
Biochar Addition and the Runoff Quality of Newly Constructed Green Roofs: A Field Study
 ,
,
Abstract
:1. Introduction
2. Materials and Methods
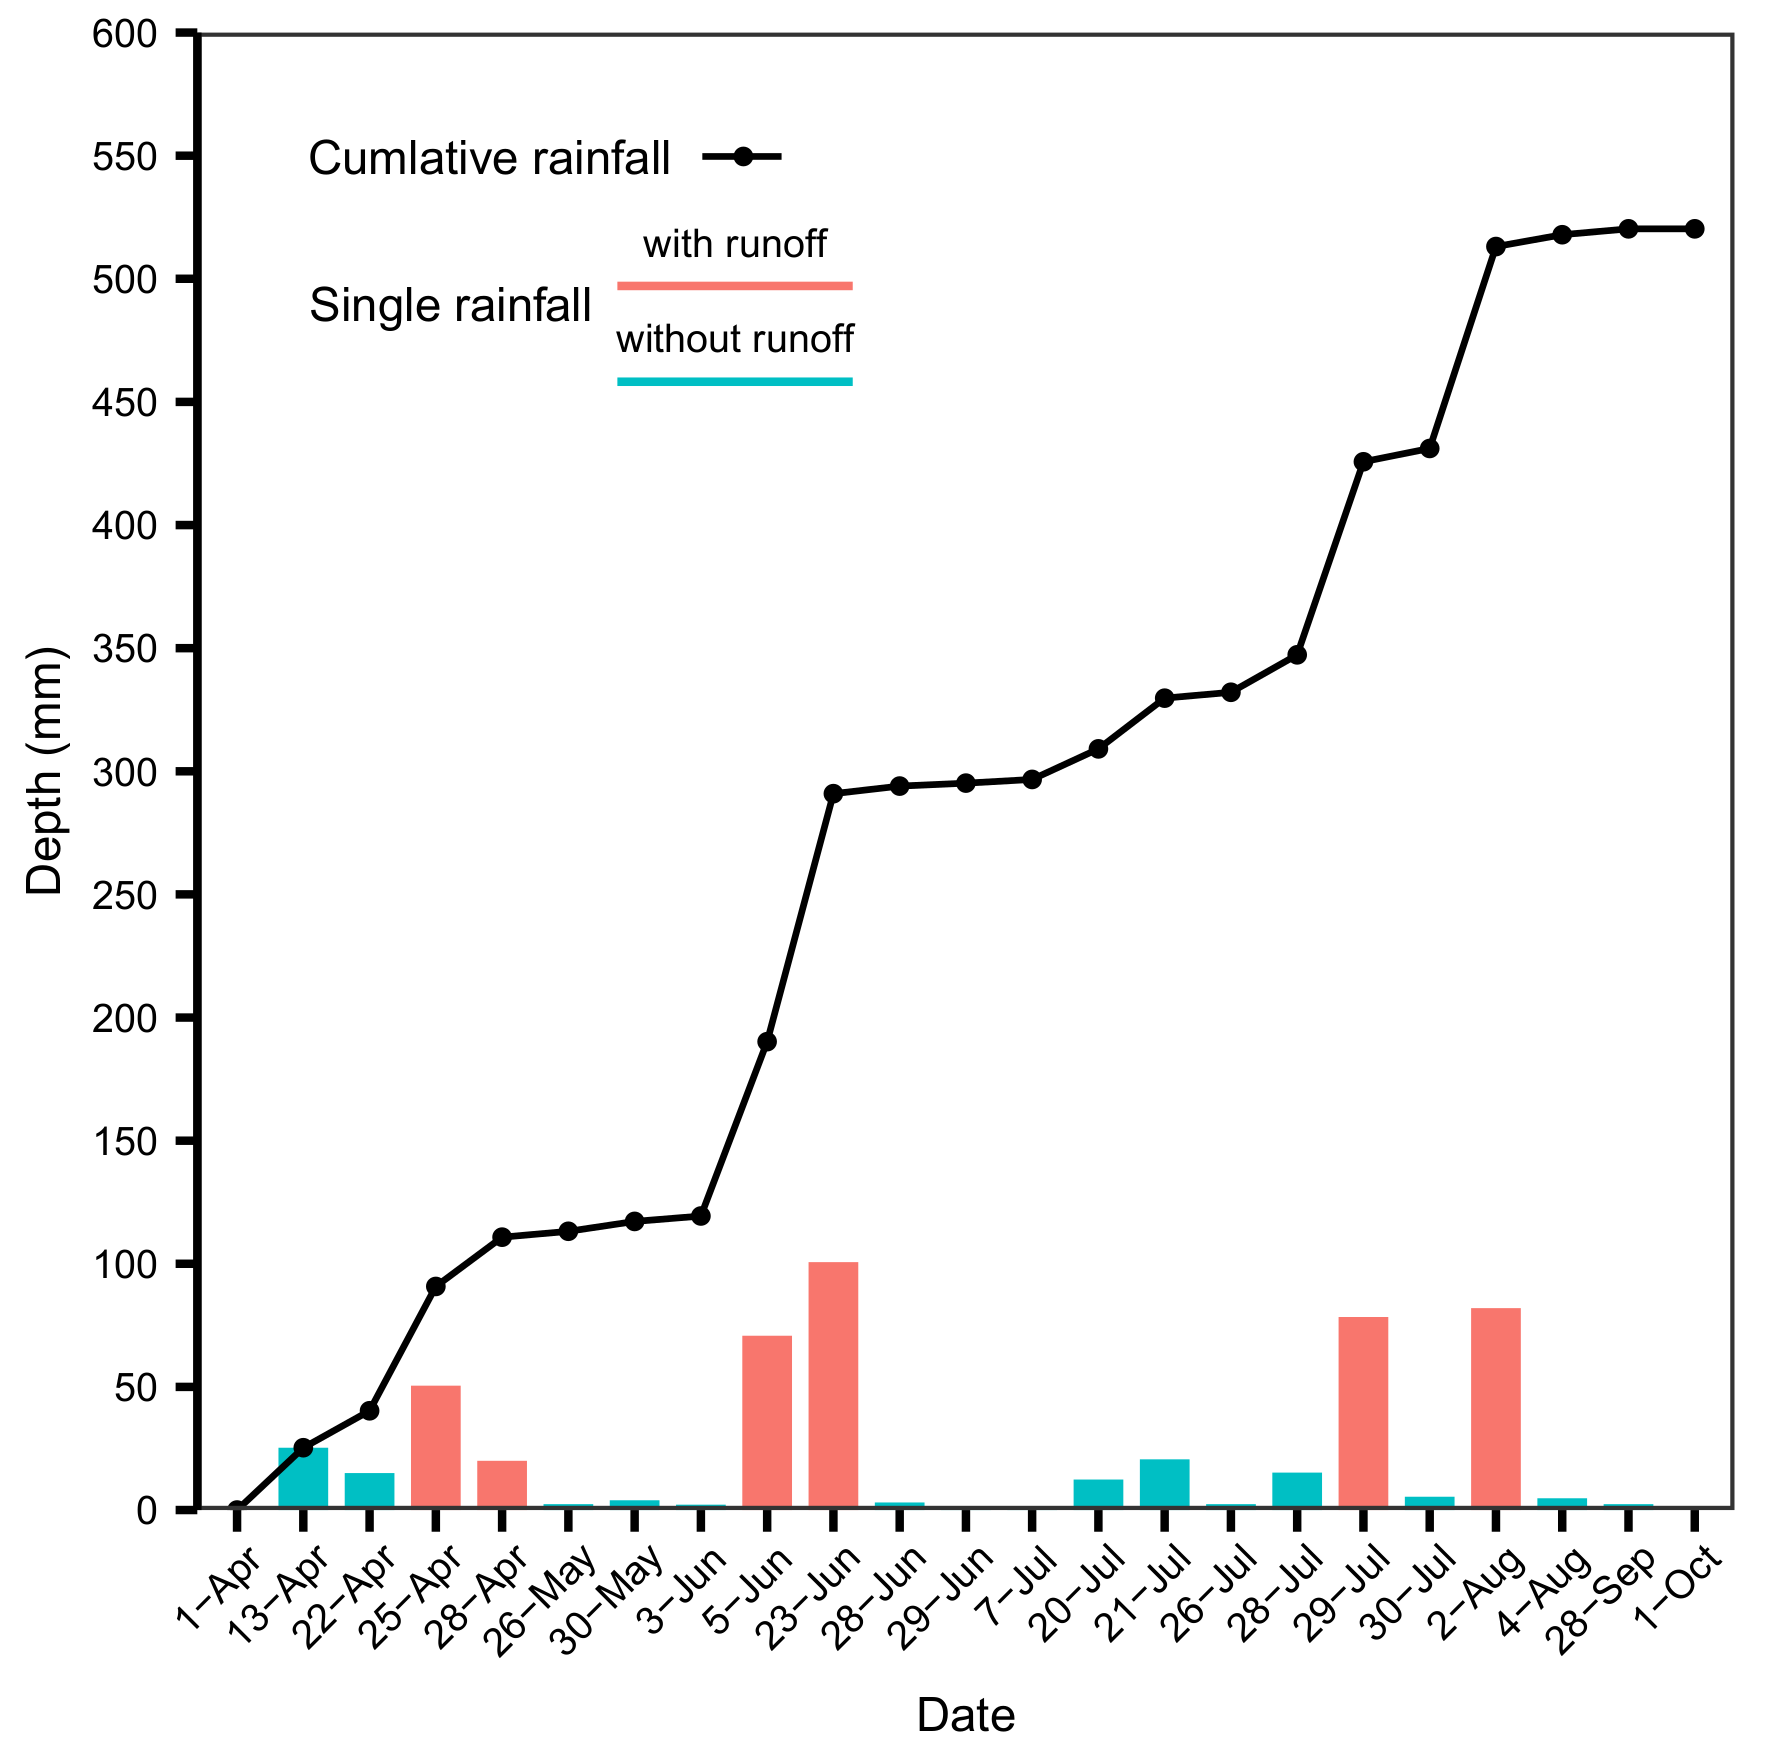
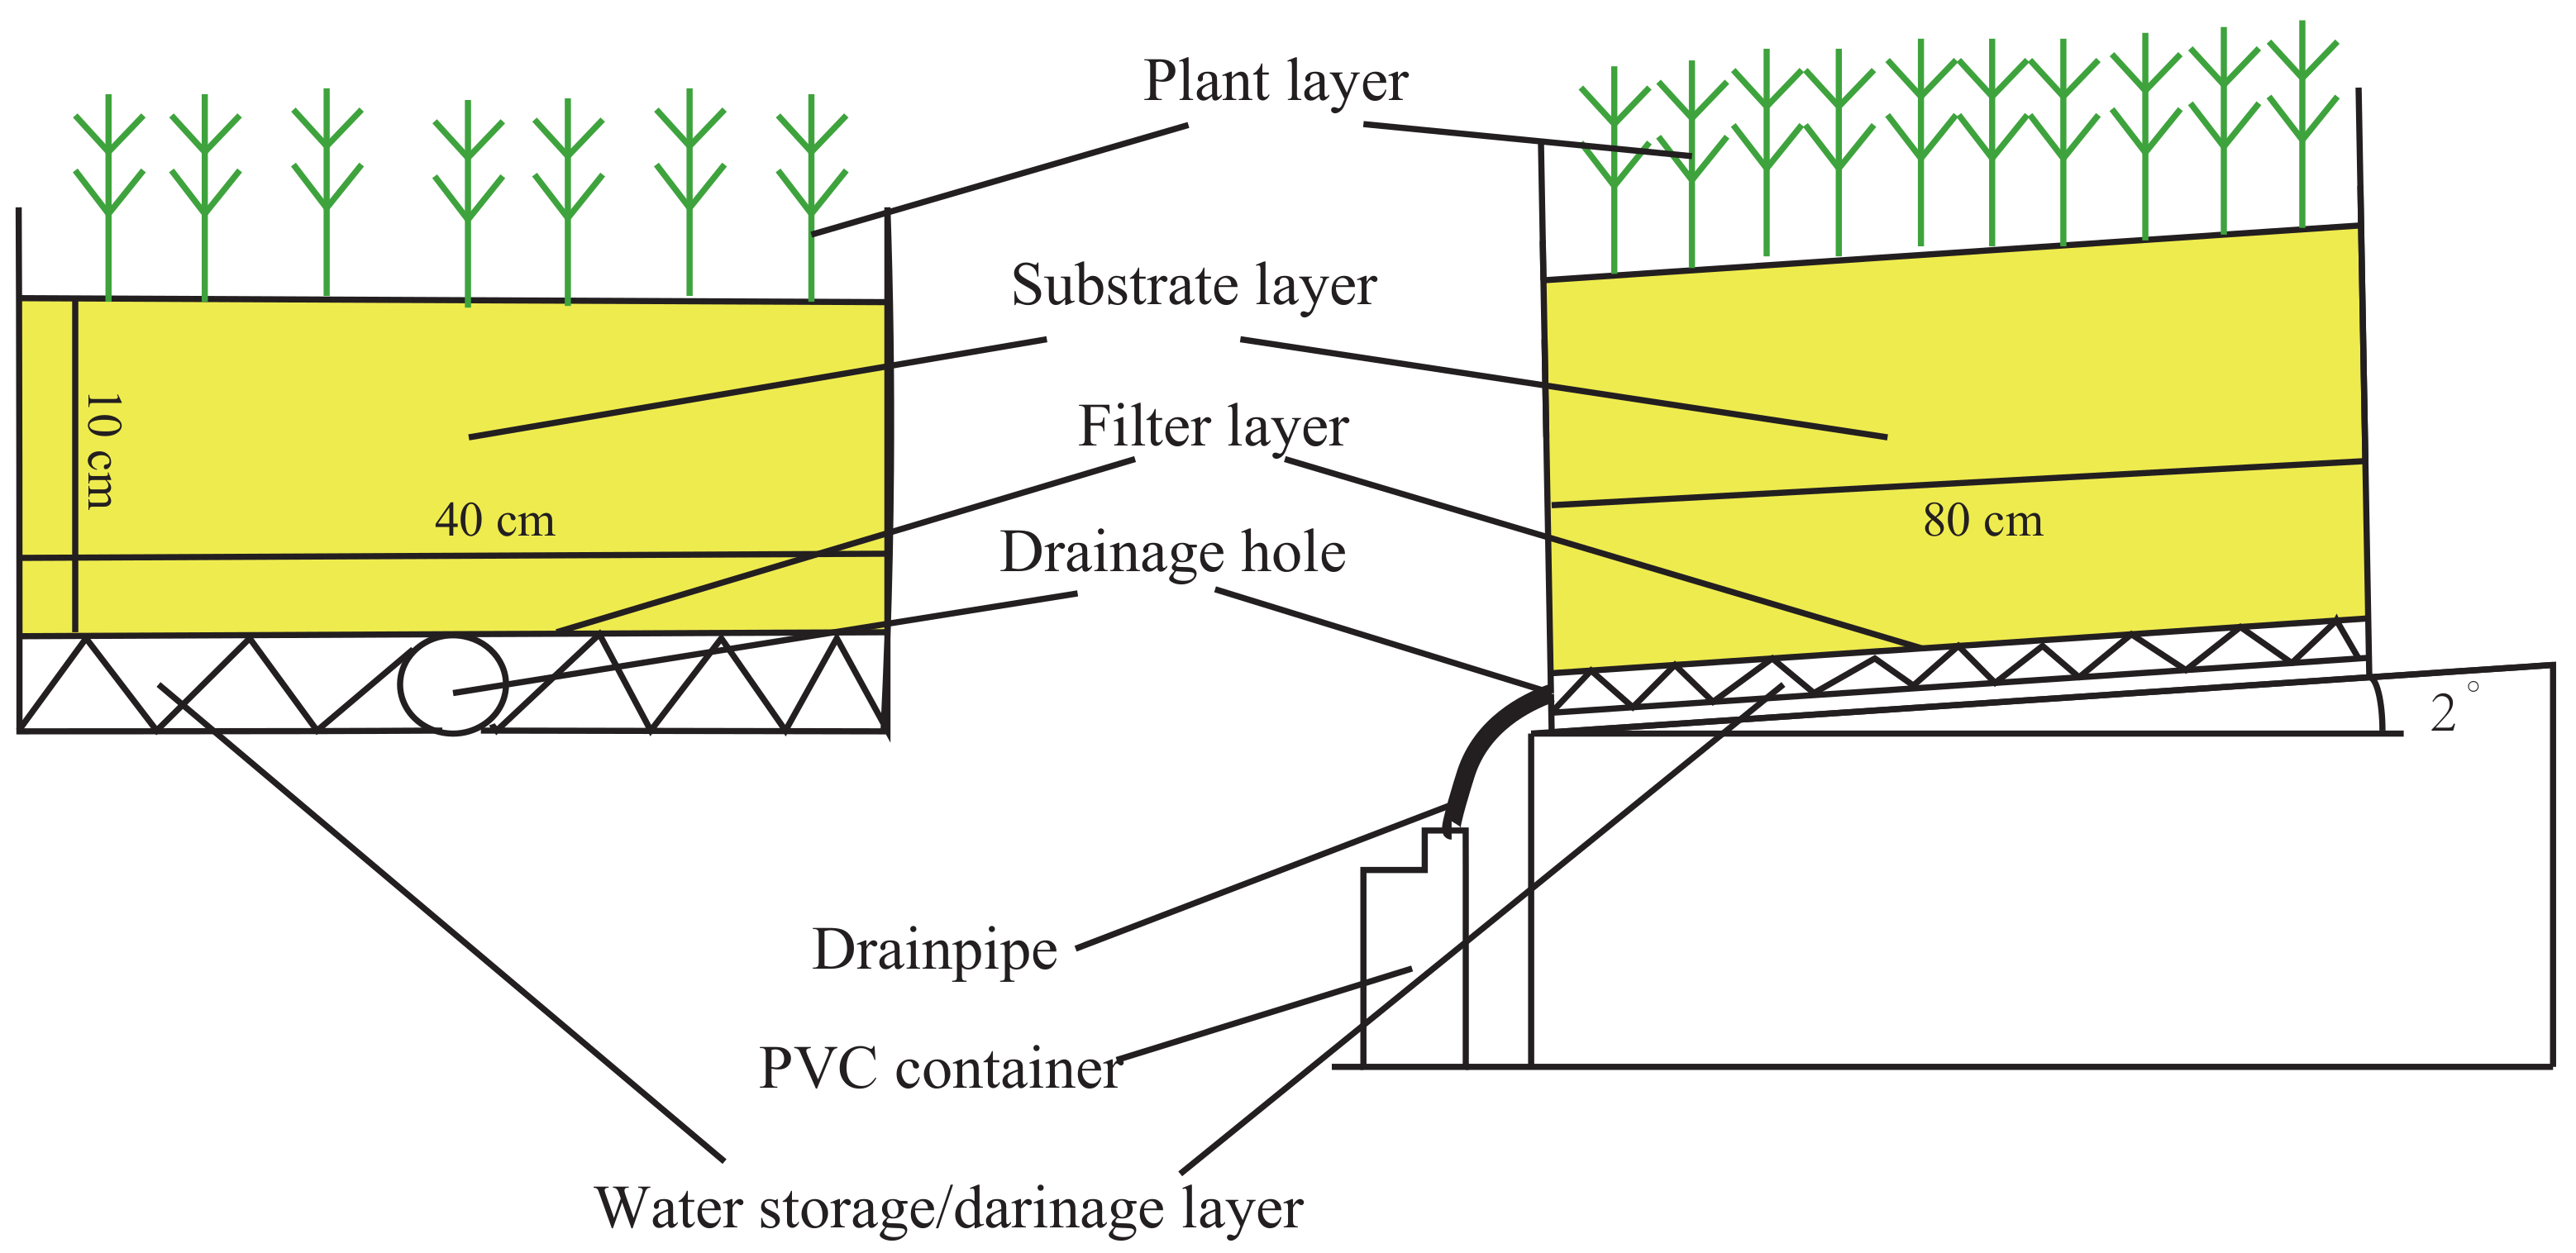
2.1. Study Area and Experimental Design
2.2. Sampling and Measurements
2.3. Data Analysis
3. Result
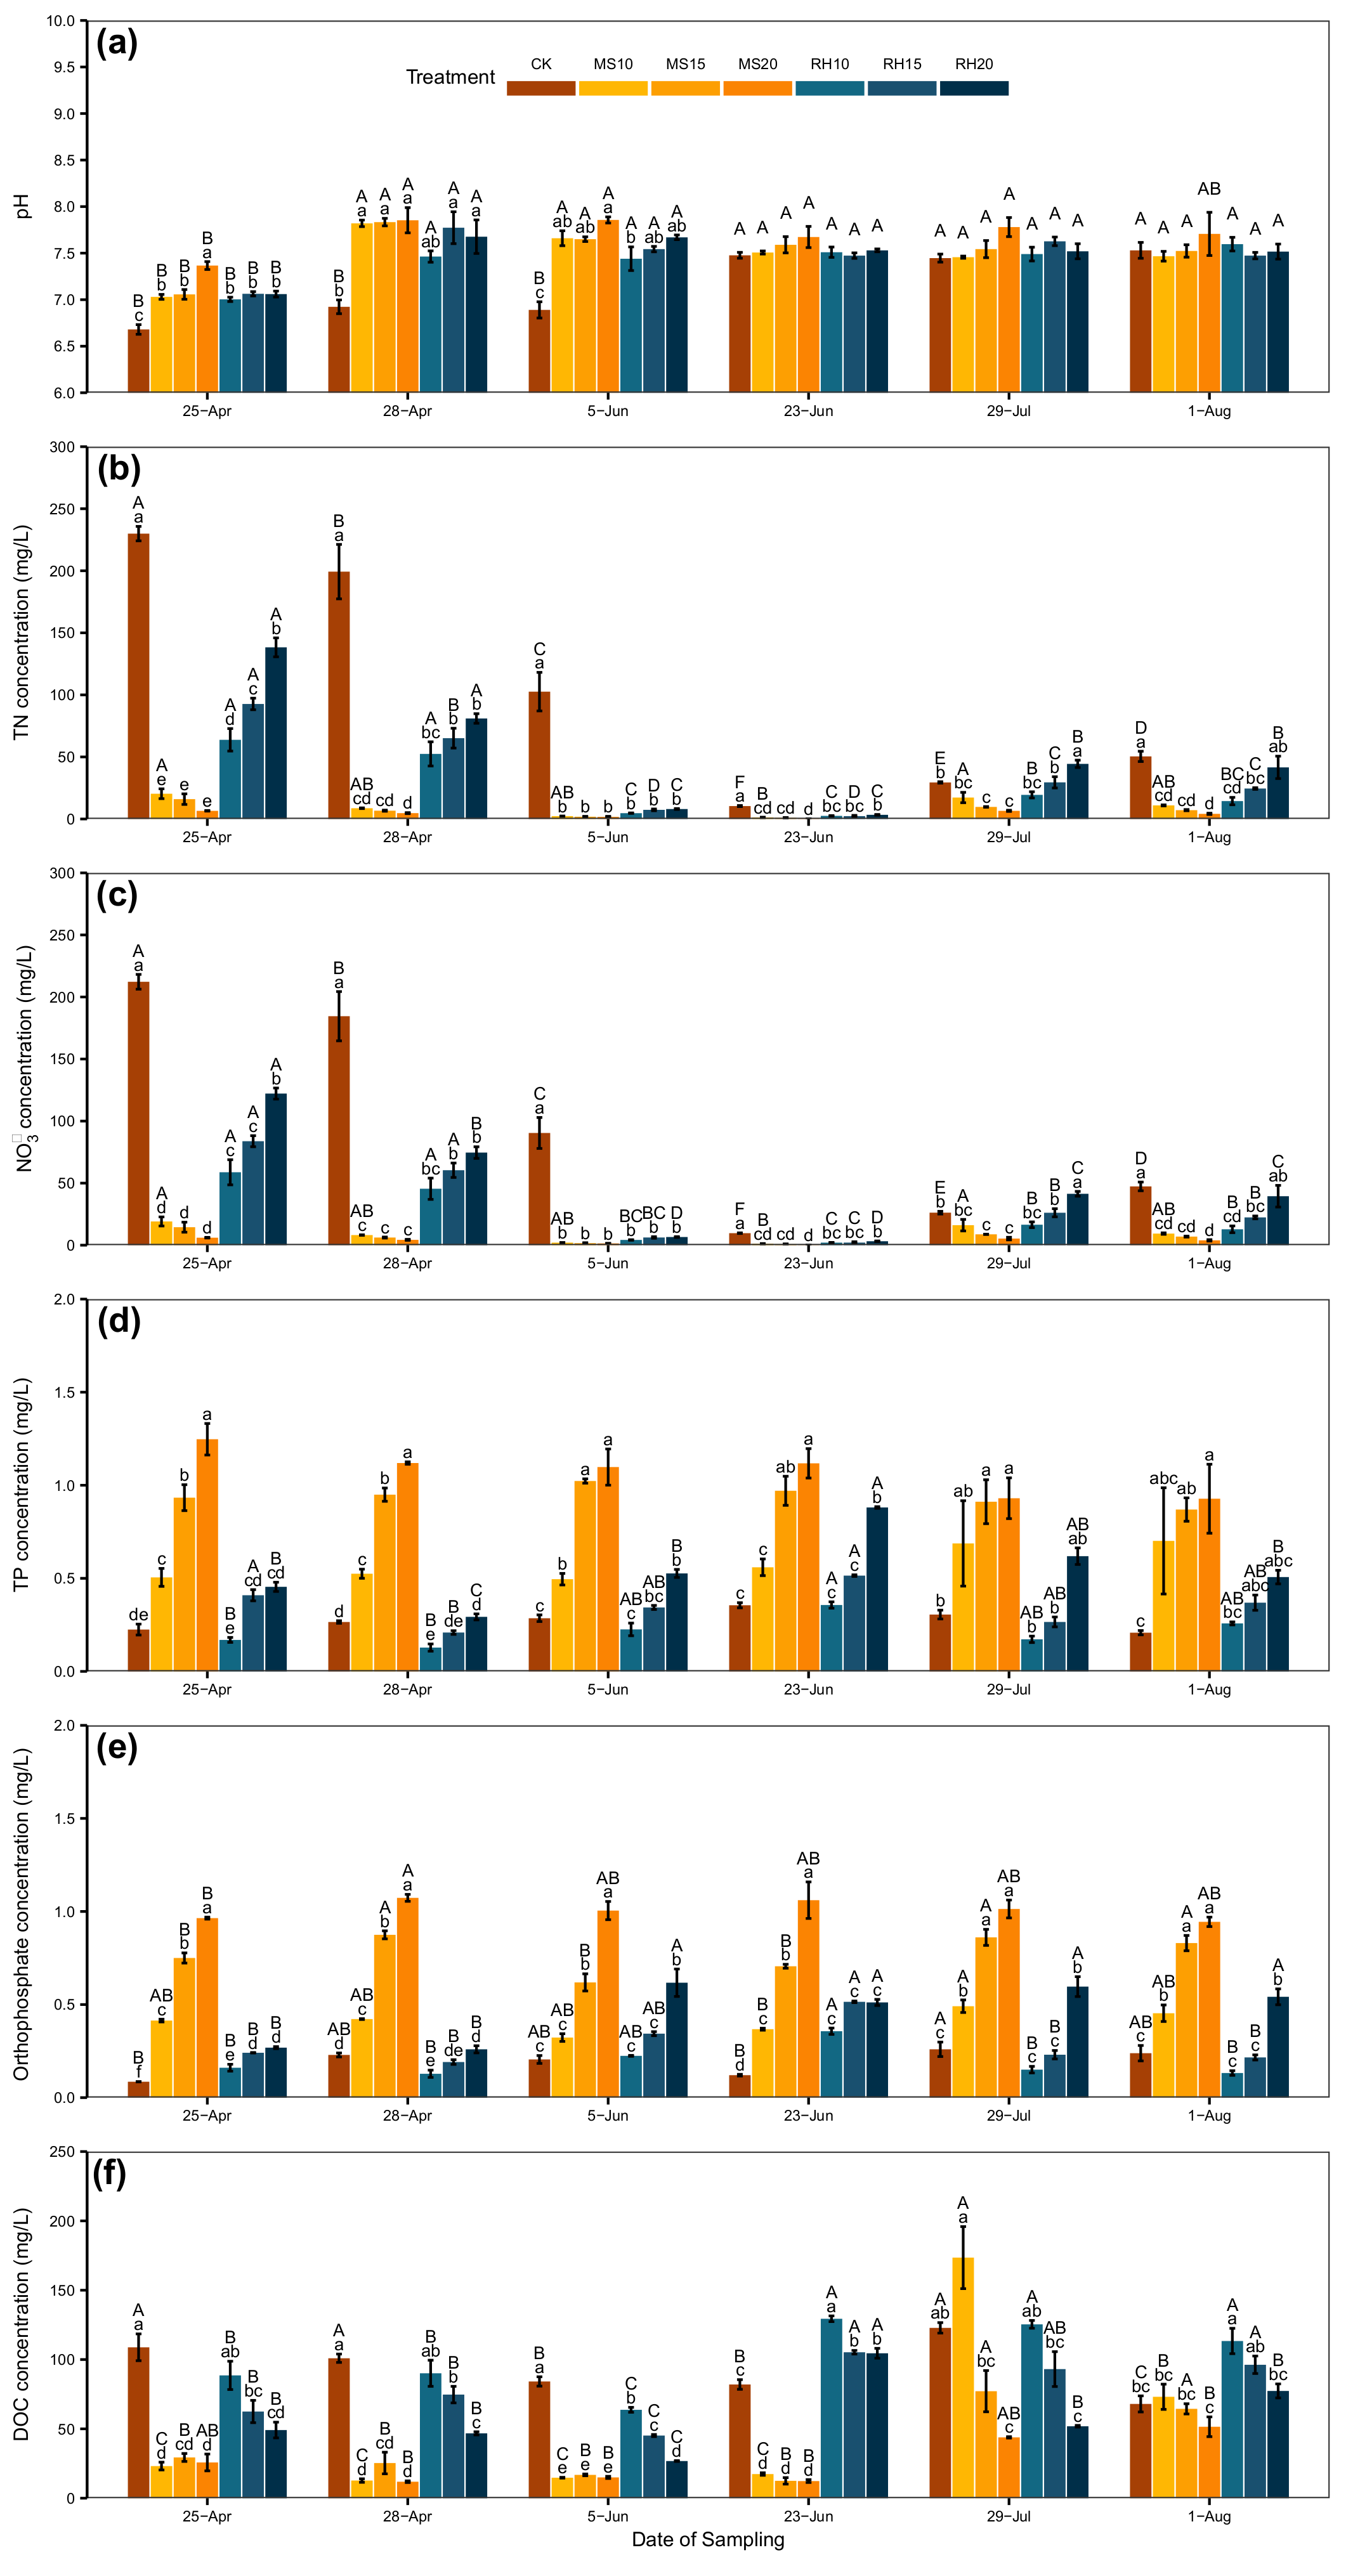
3.1. Runoff pH
3.2. Runoff TN and NO Concentrations
3.3. Runoff TP and Orthophosphate Concentrations
3.4. Runoff DOC Concentration
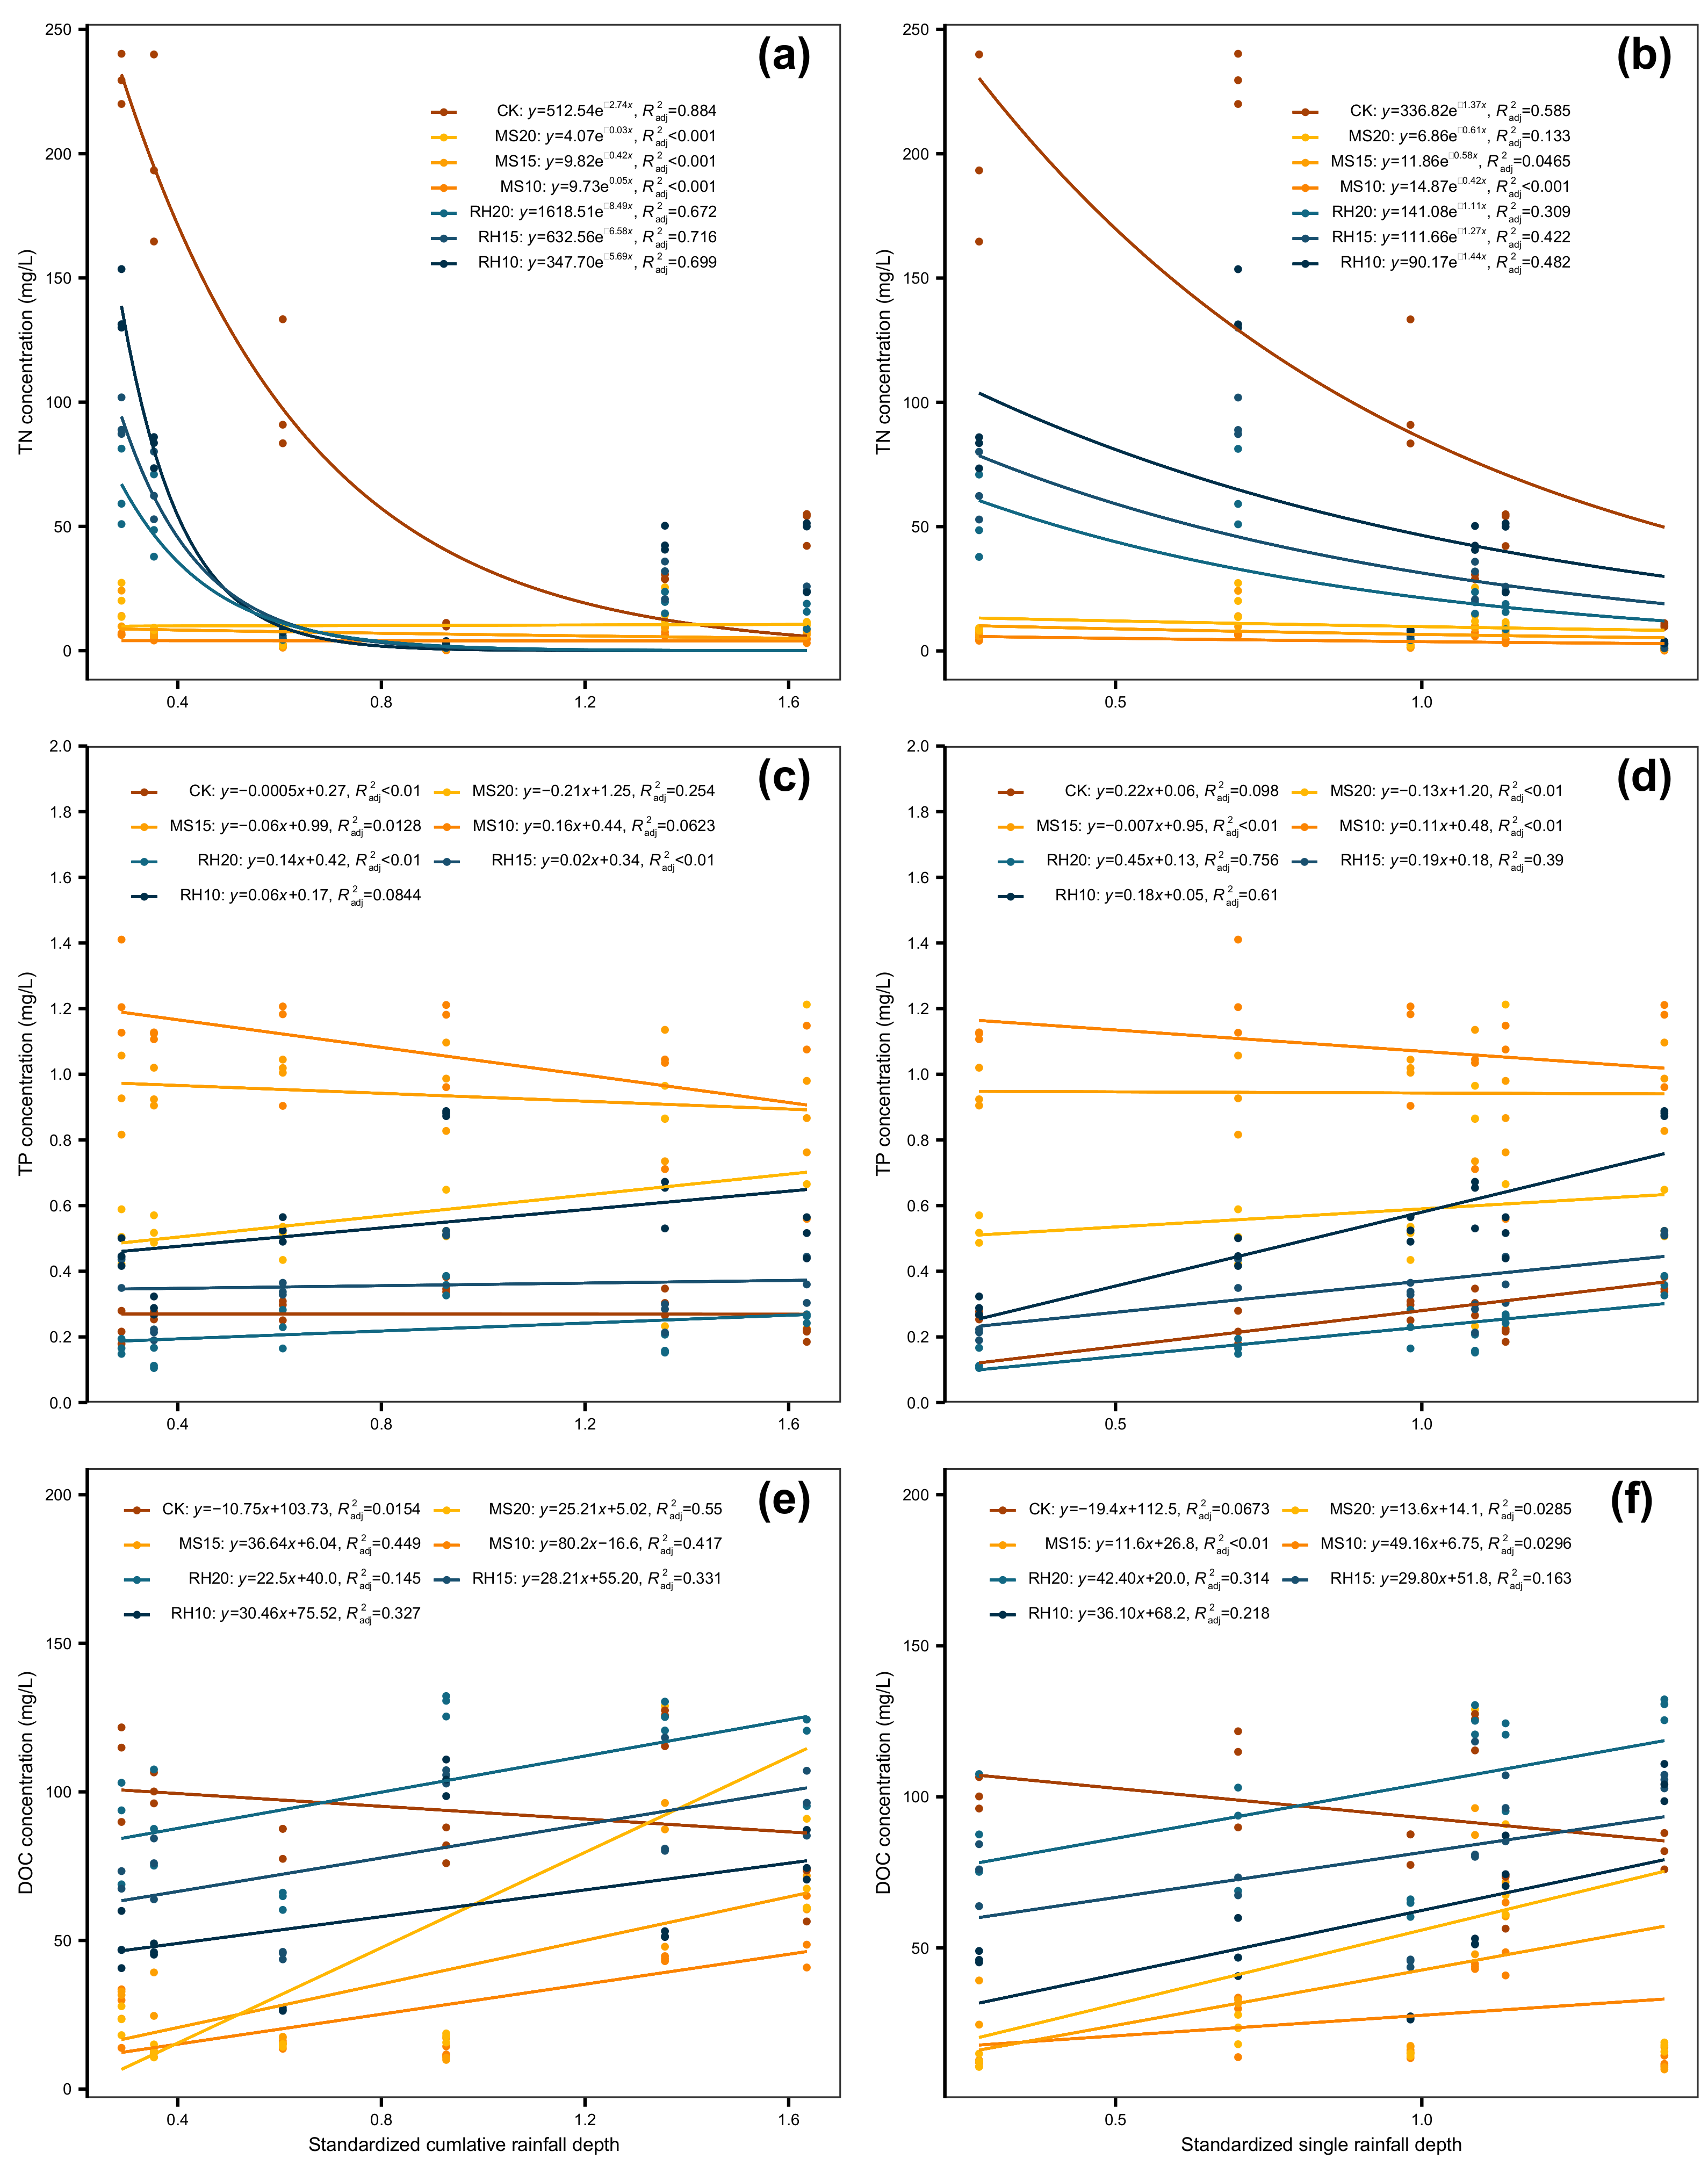
3.5. Response Relationship between Nutrient Leaching and Rainfall Characteristics
4. Discussion
4.1. The Effects of Biochar Application on Runoff pH
4.2. The Effects of Biochar Application on the Runoff’s N Concentration
4.3. The Effects of Biochar Application on the Runoff’s P Concentration
4.4. The Effects of Biochar Application on the Runoff DOC Concentration of Green Roofs
5. Conclusions
Author Contributions
Funding
Conflicts of Interest
References
- Akther, M.; He, J.; Chu, A.; van Duin, B. Nutrient leaching behavior of green roofs: Laboratory and field investigations. Sci. Total Environ. 2021, 754, 141841. [Google Scholar] [CrossRef] [PubMed]
- Czemiel Berndtsson, J. Green roof performance towards management of runoff water quantity and quality: A review. Ecol. Eng. 2010, 36, 351–360. [Google Scholar] [CrossRef]
- Stovin, V.; Vesuviano, G.; Kasmin, H. The hydrological performance of a green roof test bed under UK climatic conditions. J. Hydrol. 2012, 414-415, 148–161. [Google Scholar] [CrossRef]
- Mentens, J.; Raes, D.; Hermy, M. Green roofs as a tool for solving the rainwater runoff problem in the urbanized 21st century? Landsc. Urban Plan. 2006, 77, 217–226. [Google Scholar] [CrossRef]
- Shafique, M.; Kim, R.; Rafiq, M. Green roof benefits, opportunities and challenges - A review. Renew. Sustain. Energy Rev. 2018, 90, 757–773. [Google Scholar] [CrossRef]
- Gong, Y.; Yin, D.; Li, J.; Zhang, X.; Wang, W.; Fang, X.; Shi, H.; Wang, Q. Performance assessment of extensive green roof runoff flow and quality control capacity based on pilot experiments. Sci. Total Environ. 2019, 687, 505–515. [Google Scholar] [CrossRef]
- Beesley, L.; Moreno-Jimenez, E.; Gomez-Eyles, J.L. Effects of biochar and greenwaste compost amendments on mobility, bioavailability and toxicity of inorganic and organic contaminants in a multi-element polluted soil. Environ. Pollut. 2010, 158, 2282–2287. [Google Scholar] [CrossRef]
- Susca, T. Green roofs to reduce building energy use? A review on key structural factors of green roofs and their effects on urban climate. Build. Environ. 2019, 162, 106273. [Google Scholar] [CrossRef]
- Rowe, D.B. Green roofs as a means of pollution abatement. Environ. Pollut. 2011, 159, 2100–2110. [Google Scholar] [CrossRef] [Green Version]
- Teemusk, A.; Mander, Ü. Rainwater runoff quantity and quality performance from a greenroof: The effects of short-term events. Ecol. Eng. 2007, 30, 271–277. [Google Scholar] [CrossRef]
- Yuliani, S.; Hardiman, G.; Setyowati, E. Green-Roof: The Role of Community in the Substitution of Green-Space toward Sustainable Development. Sustainability 2020, 12, 1429. [Google Scholar] [CrossRef] [Green Version]
- Shushunova, N.S.; Korol, E.A.; Vatin, N.I. Modular Green Roofs for the Sustainability of the Built Environment: The Installation Process. Sustainability 2021, 13, 13749. [Google Scholar] [CrossRef]
- Maiolo, M.; Pirouz, B.; Bruno, R.; Palermo, S.A.; Arcuri, N.; Piro, P. The Role of the Extensive Green Roofs on Decreasing Building Energy Consumption in the Mediterranean Climate. Sustainability 2020, 12, 359. [Google Scholar] [CrossRef] [Green Version]
- Vijayaraghavan, K. Green roofs: A critical review on the role of components, benefits, limitations and trends. Renew. Sustain. Energy Rev. 2016, 57, 740–752. [Google Scholar] [CrossRef]
- Gong, Y.; Zhang, X.; Li, J.; Fang, X.; Yin, D.; Xie, P.; Nie, L. Factors affecting the ability of extensive green roofs to reduce nutrient pollutants in rainfall runoff. Sci. Total Environ. 2020, 732, 139248. [Google Scholar] [CrossRef]
- Vijayaraghavan, K.; Joshi, U.M. Can green roof act as a sink for contaminants? A methodological study to evaluate runoff quality from green roofs. Environ. Pollut. 2014, 194, 121–129. [Google Scholar] [CrossRef]
- Kuoppamäki, K.; Lehvävirta, S. Mitigating nutrient leaching from green roofs with biochar. Landsc. Urban Plan. 2016, 152, 39–48. [Google Scholar] [CrossRef]
- Johannessen, B.G.; Fassman-Beck, E.; Cheng, Y.; Rosenberger, D. Investigating Substrate Amendments to Prevent Nutrient Leaching from Extensive Sedum Green Roofs. In Proceedings of the 18th Annual World Environmental and Water Resources Congress of the Environmental-and-Water-Resources-Institute (EWRI), Minneapolis, MN, USA, 3–7 June 2018; American Society of Civil Engineers: Reston, VA, USA, 2018; pp. 75–88. [Google Scholar]
- Karczmarczyk, A.; Baryla, A.; Fronczyk, J.; Bus, A.; Mosiej, J. Phosphorus and Metals Leaching from Green Roof Substrates and Aggregates Used in Their Composition. Minerals 2020, 10, 112. [Google Scholar] [CrossRef] [Green Version]
- Lata, J.C.; Dusza, Y.; Abbadie, L.; Barot, S.; Carmignac, D.; Gendreau, E.; Kraepiel, Y.; Meriguet, J.; Motard, E.; Raynaud, X. Role of substrate properties in the provision of multifunctional green roof ecosystem services. Appl. Soil Ecol. 2018, 123, 464–468. [Google Scholar] [CrossRef]
- Chen, H.; Du, X.; Lai, M.; Nazhafati, M.; Li, C.; Qi, W. Biochar Improves Sustainability of Green Roofs via Regulate of Soil Microbial Communities. Agriculture 2021, 11, 620. [Google Scholar] [CrossRef]
- Lehmann, J. Bio-energy in the black. Front. Ecol. Environ. 2007, 5, 381–387. [Google Scholar] [CrossRef] [Green Version]
- Blanco-Canqui, H. Biochar and Soil Physical Properties. Soil Sci. Soc. Am. J. 2017, 81, 687–711. [Google Scholar] [CrossRef] [Green Version]
- Han, L.; Sun, K.; Yang, Y.; Xia, X.; Li, F.; Yang, Z.; Xing, B. Biochar’s stability and effect on the content, composition and turnover of soil organic carbon. Geoderma 2020, 364, 114184. [Google Scholar] [CrossRef]
- Prendergast-Miller, M.T.; Duvall, M.; Sohi, S.P. Biochar-root interactions are mediated by biochar nutrient content and impacts on soil nutrient availability. Eur. J. Soil Sci. 2014, 65, 173–185. [Google Scholar] [CrossRef]
- Zhou, X.; Zeng, Z.; Zeng, G.; Lai, C.; Xiao, R.; Liu, S.; Huang, D.; Qin, L.; Liu, X.; Li, B.; et al. Insight into the mechanism of persulfate activated by bone char: Unraveling the role of functional structure of biochar. Chem. Eng. J. 2020, 401, 126127. [Google Scholar] [CrossRef]
- Beck, D.A.; Johnson, G.R.; Spolek, G.A. Amending greenroof soil with biochar to affect runoff water quantity and quality. Environ. Pollut. 2011, 159, 2111–2118. [Google Scholar] [CrossRef] [PubMed]
- Chen, H.; Ma, J.; Wei, J.; Gong, X.; Yu, X.; Guo, H.; Zhao, Y. Biochar increases plant growth and alters microbial communities via regulating the moisture and temperature of green roof substrates. Sci. Total Environ. 2018, 635, 333–342. [Google Scholar] [CrossRef]
- Cao, C.T.N.; Farrell, C.; Kristiansen, P.E.; Rayner, J.P. Biochar makes green roof substrates lighter and improves water supply to plants. Ecol. Eng. 2014, 71, 368–374. [Google Scholar] [CrossRef]
- Qiu, D.; Peng, H.; Li, T.; Qi, Y. Application of stabilized sludge to extensive green roofs in Shanghai: Feasibility and nitrogen leaching control. Sci. Total Environ. 2020, 732, 138898. [Google Scholar] [CrossRef]
- Kuoppamäki, K. Vegetated roofs for managing stormwater quantity in cold climate. Ecol. Eng. 2021, 171, 106388. [Google Scholar] [CrossRef]
- China, E. Monitoring and Analysis Methods for Water and Wastewater; China Environmental Science Press: Beijing, China, 2002; pp. 232–235. [Google Scholar]
- R Core Team. R: A Language and Environment for Statistical Computing; R Foundation for Statistical Computing: Vienna, Austria, 2022. [Google Scholar]
- He, K.; Huo, H.; Zhang, Q. Urban Air Pollution in China: Current Status, Characteristics, and Progress. Annu. Rev. Energy Environ. 2002, 27, 397–431. [Google Scholar] [CrossRef]
- Liu, M.; Huang, X.; Song, Y.; Tang, J.; Cao, J.; Zhang, X.; Zhang, Q.; Wang, S.; Xu, T.; Kang, L.; et al. Ammonia emission control in China would mitigate haze pollution and nitrogen deposition, but worsen acid rain. Proc. Natl. Acad. Sci. USA 2019, 116, 7760–7765. [Google Scholar] [CrossRef] [PubMed] [Green Version]
- Razzaghmanesh, M.; Beecham, S.; Kazemi, F. Impact of green roofs on stormwater quality in a South Australian urban environment. Sci. Total Environ. 2014, 470–471, 651–659. [Google Scholar] [CrossRef] [PubMed]
- Wu, S.; Zhang, Y.; Tan, Q.; Sun, X.; Wei, W.; Hu, C. Biochar is superior to lime in improving acidic soil properties and fruit quality of Satsuma mandarin. Sci. Total Environ. 2020, 714, 136722. [Google Scholar] [CrossRef]
- Xu, R.K.; Zhao, A.Z.; Yuan, J.H.; Jiang, J. pH buffering capacity of acid soils from tropical and subtropical regions of China as influenced by incorporation of crop straw biochars. J. Soils Sediments 2012, 12, 494–502. [Google Scholar] [CrossRef]
- Qianqian, Z.; Liping, M.; Huiwei, W.; Long, W. Analysis of the effect of green roof substrate amended with biochar on water quality and quantity of rainfall runoff. Environ. Monit. Assess. 2019, 191, 304. [Google Scholar] [CrossRef]
- Malcolm, E.G.; Reese, M.L.; Schaus, M.H.; Ozmon, I.M.; Tran, L.M. Measurements of nutrients and mercury in green roof and gravel roof runoff. Ecol. Eng. 2014, 73, 705–712. [Google Scholar] [CrossRef]
- Alkharabsheh, H.M.; Seleiman, M.F.; Battaglia, M.L.; Shami, A.; Jalal, R.S.; Alhammad, B.A.; Almutairi, K.F.; Al-Saif, A.M. Biochar and Its Broad Impacts in Soil Quality and Fertility, Nutrient Leaching and Crop Productivity: A Review. Agronomy 2021, 11, 993. [Google Scholar] [CrossRef]
- Yao, Y.; Gao, B.; Zhang, M.; Inyang, M.; Zimmerman, A.R. Effect of biochar amendment on sorption and leaching of nitrate, ammonium, and phosphate in a sandy soil. Chemosphere 2012, 89, 1467–1471. [Google Scholar] [CrossRef]
- Nguyen, T.T.N.; Xu, C.Y.; Tahmasbian, I.; Che, R.; Xu, Z.; Zhou, X.; Wallace, H.M.; Bai, S.H. Effects of biochar on soil available inorganic nitrogen: A review and meta-analysis. Geoderma 2017, 288, 79–96. [Google Scholar] [CrossRef] [Green Version]
- Bu, X.; Xue, J.; Zhao, C.; Wu, Y.; Han, F. Nutrient Leaching and Retention in Riparian Soils as Influenced by Rice Husk Biochar Addition. Soil Sci. 2017, 182, 241–247. [Google Scholar] [CrossRef]
- Gardiner, D.T.; Miller, R.W. Soils in Our Environment; Prentice Hall: Hoboken, NJ, USA, 2004. [Google Scholar]
- Gao, S.; DeLuca, T.H.; Cleveland, C.C. Biochar additions alter phosphorus and nitrogen availability in agricultural ecosystems: A meta-analysis. Sci. Total Environ. 2019, 654, 463–472. [Google Scholar] [CrossRef] [PubMed]
- Farrell, C.; Cao, C.T.N.; Ang, X.Q.; Rayner, J.P. Use of water-retention additives to improve performance of green roof substrates. Acta Hortic. 2016, 271–278. [Google Scholar] [CrossRef]
- Fang, C.; Zhang, T.; Li, P.; Jiang, R.F.; Wang, Y.C. Application of magnesium modified corn biochar for phosphorus removal and recovery from swine wastewater. Int. J. Environ. Res. Public Health 2014, 11, 9217–9237. [Google Scholar] [CrossRef] [Green Version]
- Liu, Y.Z.; Bralts, V.F.; Engel, B.A. Evaluating the effectiveness of management practices on hydrology and water quality at watershed scale with a rainfall-runoff model. Sci. Total Environ. 2015, 511, 298–308. [Google Scholar] [CrossRef]
- El-Naggar, A.; El-Naggar, A.H.; Shaheen, S.M.; Sarkar, B.; Chang, S.X.; Tsang, D.C.W.; Rinklebe, J.; Ok, Y.S. Biochar composition-dependent impacts on soil nutrient release, carbon mineralization, and potential environmental risk: A review. J. Environ. Manag. 2019, 241, 458–467. [Google Scholar] [CrossRef]
- Lei, Z.; Li, Q.; Song, X.; Wang, W.; Zhang, Z.; Peng, C.; Tian, L. Biochar mitigates dissolved organic carbon loss but does not affect dissolved organic nitrogen leaching loss caused by nitrogen deposition in Moso bamboo plantations. Glob. Ecol. Conserv. 2018, 16, e00494. [Google Scholar] [CrossRef]
- Mukherjee, A.; Zimmerman, A.R. Organic carbon and nutrient release from a range of laboratory-produced biochars and biochar-soil mixtures. Geoderma 2013, 193–194, 122–130. [Google Scholar] [CrossRef]
- Liu, Z.; Dugan, B.; Masiello, C.A.; Barnes, R.T.; Gallagher, M.E.; Gonnermann, H. Impacts of biochar concentration and particle size on hydraulic conductivity and DOC leaching of biochar-sand mixtures. J. Hydrol. 2016, 533, 461–472. [Google Scholar] [CrossRef] [Green Version]
- Barnes, R.T.; Gallagher, M.E.; Masiello, C.A.; Liu, Z.; Dugan, B. Biochar-induced changes in soil hydraulic conductivity and dissolved nutrient fluxes constrained by laboratory experiments. PLoS ONE 2014, 9, e108340. [Google Scholar] [CrossRef] [Green Version]
- Gmach, M.R.; Kaiser, K.; Cherubin, M.R.; Cerri, C.E.P.; Lisboa, I.P.; Vasconcelos, A.L.S.; Siqueira-Neto, M. Soil dissolved organic carbon responses to sugarcane straw removal. Soil Use Manag. 2020, 37, 126–137. [Google Scholar] [CrossRef]
- Evans, L.R.; Pierson, D.; Lajtha, K. Dissolved organic carbon production and flux under long-term litter manipulations in a Pacific Northwest old-growth forest. Biogeochemistry 2020, 149, 75–86. [Google Scholar] [CrossRef]
- Yang, X.Y.; Chang, K.H.; Kim, Y.J.; Zhang, J.; Yoo, G. Effects of different biochar amendments on carbon loss and leachate characterization from an agricultural soil. Chemosphere 2019, 226, 625–635. [Google Scholar] [CrossRef] [PubMed]
- Chen, S.; Yoshitake, S.; Iimura, Y.; Asai, C.; Ohtsuka, T. Dissolved organic carbon (DOC) input to the soil: DOC fluxes and their partitions during the growing season in a cool-temperate broad-leaved deciduous forest, central Japan. Ecol. Res. 2017, 32, 713–724. [Google Scholar] [CrossRef]

| Treatment | Soil | Biochar | Perlite | Vermiculite |
|---|---|---|---|---|
| CK | 70% | 0 | 15% | 15% |
| MS10 | 60% | 10% | 15% | 15% |
| MS15 | 55% | 15% | 15% | 15% |
| MS20 | 50% | 20% | 15% | 15% |
| RH10 | 60% | 10% | 15% | 15% |
| RH15 | 55% | 15% | 15% | 15% |
| RH20 | 50% | 20% | 15% | 15% |
| Component | pH | TC (g kg) | TN (g kg) | TP (g kg) |
|---|---|---|---|---|
| Soil | 8.0 | 12.1 | 2.1 | 1.5 |
| MSB | 10.4 | 470.4 | 12.0 | 12.7 |
| RHB | 8.5 | 390.1 | 9.9 | 1.4 |
| Perlite | 7.0 | - | - | - |
| Vermiculite | 7.0 | - | - | - |
| Indicators | pH | TN | NO | TP | Orthophosphate | DOC | ||||||||||||
|---|---|---|---|---|---|---|---|---|---|---|---|---|---|---|---|---|---|---|
| F | p | F | p | F | p | F | p | F | p | F | p | |||||||
| Treatment | 16.76 | <0.001 | 0.88 | 104.05 | <0.001 | 0.98 | 121.05 | <0.001 | 0.98 | 127.33 | <0.001 | 0.98 | 445.30 | <0.001 | 0.99 | 105.90 | <0.001 | 0.98 |
| Time | 53.51 | <0.001 | 0.79 | 271.15 | <0.001 | 0.95 | 268.09 | <0.001 | 0.95 | 4.02 | 0.03 | 0.22 | 11.50 | <0.001 | 0.45 | 73.25 | <0.001 | 0.80 |
| Interaction | 3.74 | <0.001 | 0.62 | 50.73 | <0.001 | 0.96 | 50.36 | <0.001 | 0.96 | 1.65 | 0.13 | 0.41 | 10.01 | <0.001 | 0.81 | 16.17 | <0.001 | 0.87 |
Disclaimer/Publisher’s Note: The statements, opinions and data contained in all publications are solely those of the individual author(s) and contributor(s) and not of MDPI and/or the editor(s). MDPI and/or the editor(s) disclaim responsibility for any injury to people or property resulting from any ideas, methods, instructions or products referred to in the content. |
© 2023 by the authors. Licensee MDPI, Basel, Switzerland. This article is an open access article distributed under the terms and conditions of the Creative Commons Attribution (CC BY) license (https://creativecommons.org/licenses/by/4.0/).
Share and Cite
Xiong, W.; Li, J.; Wang, H.; Wu, Y.; Li, D.; Xue, J. Biochar Addition and the Runoff Quality of Newly Constructed Green Roofs: A Field Study. Sustainability 2023, 15, 4081. https://doi.org/10.3390/su15054081
Xiong W, Li J, Wang H, Wu Y, Li D, Xue J. Biochar Addition and the Runoff Quality of Newly Constructed Green Roofs: A Field Study. Sustainability. 2023; 15(5):4081. https://doi.org/10.3390/su15054081
Chicago/Turabian StyleXiong, Weiwei, Juan Li, Hankun Wang, Yongbo Wu, Dongchang Li, and Jianhui Xue. 2023. "Biochar Addition and the Runoff Quality of Newly Constructed Green Roofs: A Field Study" Sustainability 15, no. 5: 4081. https://doi.org/10.3390/su15054081