Abstract
BRCs (bioretention cells), one of many low-impact development (LID) practices, are increasingly utilized to lessen the amount of runoff while simultaneously improving the runoff quality. Because the goal of BRCs and LID designs, in general, is to mimic or replicate the pre-development hydrology, it is critical to evaluate the hydrologic and ecologic performances of the BRC facility from the perspective of replicating the pre-development hydrology. The metrics developed in this study were intended to represent the hydrologic regime including the runoff volume control metrics, peak flow frequency exceedance curve, and flow duration curve. We also used a hydrological indicator of T0.5, the fraction of a multi-year period in which the flow exceeds the 0.5-year return period storm to represent the performances regarding downstream ecology. The indicators were compared to their pre-development values to determine how closely they reflected and replicated the pre-development state. A long-term stormwater management model (SWMM) model was developed to examine conditions before and after development and water movement in BRCs. When the BRCs facilities areas are 5% of the entire impervious study area, key findings show that: (1) BRCs have significant runoff volume control performances. (2) The peak flow frequency exceedance curve with BRCs could fully match the pre-development scenario for minor rainfall events compared to the 0.1-year storm. Flow duration curves with BRCs showed that, the frequency, magnitude, and duration of small flows that occurred for more than 90% of the total time closely matched those of pre-development hydrology. (3) T0.5 with BRCs showed significant improvement compared with the value of the area with no BRCs and was close to the pre-development T0.5. The findings presented in this study indicated the significant performance of BRCs in improving downstream ecology.
1. Introduction
The impervious areas created by the urbanization of a watershed significantly decrease natural detention and infiltration. These alterations lead to an increase in the amount of stormwater runoff, which is one of the primary contributors to the ecological degradation of receiving waters, including the ecology of streams and water bodies [1,2,3]. To solve the ecological problems caused by urbanization, the natural flow regime emerged, which postulates that “the ecological integrity of river ecosystem depends on their natural dynamic character” [4,5]. There has been a recent uptick in the number of studies looking into the possibility of managing water resources based on a flow pattern in its natural and pre-developed state [6].
Stormwater management practices, such as various infiltration or retention systems, have been developed to facilitate the achievement of this objective. This development coincides with the emergence of the natural flow paradigm and the subsequent interest in it [7]. One of them is known as low-impact development (LID), a site design strategy that aims to preserve or recreate the pre-development hydrology through the use of design strategies to create a hydrologic landscape that is functionally identical [8]. Typical LID practices (LIDs) include bioretention facilities, grass swales, detention ponds, and infiltration trenches, which adequately take advantage of natural processes and receive and deal with surface runoff generated by urbanization near its sources. Consequently, LIDs are regarded as ideal measures to solve the problems caused by urbanization [9].
“Rain gardens,” also known as bioretention cells (BRCs), are a widespread LID practice used in urban areas to mitigate the runoff yield and improve water quality in a way that is both natural and visually beautiful [10]. It is quickly becoming one of the most widespread LID techniques [11,12,13,14,15]. Various studies have demonstrated the advantages of bioretention performances, including reducing peak flow, increasing infiltration, and reducing contaminant and temperature [16,17,18,19]. Numerous field and laboratory investigations have proven the enhancements to both the runoff volume and the water quality of BRCs on a number of spatial levels [16,20,21,22,23,24,25]. A series of hydrological indicators have been used in the study, for example, flow reduction and reduction efficiency [26,27,28], and the cited research shows that runoff reduction rates for BRCs range from 40% to 99%. Recently, some researchers used a series of indicators developed by ecologists, such as cyclicity, generalization, vulnerability, ascendency, development capacity, and robustness, to characterize and compare the ecological impacts of LIDs as ecosystems [29].
All studies linked peak flow and total volume to evaluate LID effects. Still, they mostly saw LIDs as traditional stormwater management practices rather than innovative technologies replicating the pre-development hydrograph. The initial objective of LIDs to sustain pre-development hydrology and improve downstream ecology has largely significantly been ignored. The currently used performance evaluation indicators discussed here cannot demonstrate and evaluate performances of bioretention as the LID practice since the hydrologic regime is complicated and may not be evaluated by a set of single-event-based indicators. Even if a stormwater management method satisfies its design goals for flood mitigation and quality improvement, it may not be effective. Many downstream impacts must be considered, such as geomorphology, hydrogeology, water, and ecology [30]. However, accessing the effects of one of the primary LIDs, BRCs, in mimicking flow regimes is crucial for urban planners and watershed managers.
Regarding the BRC performances, the monitoring strategy is the most popular but is restricted by long-term data and effort [31]. Especially for the area where LIDs will be established, the only way to predict the performance is by simulation using realistic models [15,28,32]. Performance evaluations of BRCs require long-term runoff data to represent the hydrological regime, a consequence being that the simulation using the model is the only approach. LID models must accurately depict pre- and post-development situations [33], which becomes vital when evaluating the performance of LIDs in sustaining a pre-development hydrology. Amongst all hydrologic models, the Stormwater Management Model (SWMM) is regarded as one of the most successful examples to represent the radically different hydrology of both pre-developed and developed lands [34].
An SWMM model was developed in the following study to provide continuous hydrologic simulation utilizing a long-term record. This modeling approach had two goals: (1) to develop an indicator system to evaluate BRCs’ performance in replicating the pre-development hydrology and improving downstream ecology, and (2) to evaluate the BRCs’ hydrologic performance to determine whether they replicated the pre-development scenario.
2. Materials and Methods
2.1. Site Description and Data Source
The study area is located in the Little Mill Creek Watershed in the United States of America, and a 0.36 km2 urban catchment was selected for this study. Little Mill Creek drains an area of 92.40 km2, with a mean yearly precipitation of 1180 mm. The topographic wetness index is 494.65, and about 14% of the watershed is dominated by forest. For the study area, 45% is impervious, contributed by roads, roofs, and parking lots. The pervious location is mainly the medium-density residential land distributed evenly. We used hypothetical on-site BRCs and a natural catchment to simulate sub-catchments and drainage elements. Hourly rainfall and temperature data were collated from U.S National Climatic Data Center (NCDC). We chose 1968 to 1977 for the long-term simulation considering the lack of data and storm patterns. The mean annual precipitation for this period is 94.84 cm, only 2.62 cm more than the average yearly precipitation for the entire record. The evaporation rate was modeled as a set of monthly average values, listed in Table 1.

Table 1.
Evaporation parameters.
2.2. Modeled Scenarios
This study examined the differences in catchment response when BRCs were placed using a theoretical modeling scenario. The model was based on the developed condition, which has been established and implemented without BRC practices using the SWMM developed by the United States Environmental Protection Agency (EPA), with an emphasis to examine how the rainfall and catchment characteristics will impact the hydrological performances of BRCs, but in this paper, we tried to examine how close the BRCs will replicate the pre-development hydrology [35,36]. A time step of 15 min was chosen for the wet period, and a time step of 30 min was chosen for the dry period to stress the dry gaps between the precipitation events.
In particular, LIDs in an urban catchment should mimic the pre-development hydrology. It is crucial to achieve this in the model hydrologic regime of pre-developed conditions and developed with BRC scenario. The performances of BRCs can be assessed by comparing how the hydrographs of the BRCs treatment scenario match the pre-developed scenario. Consequently, as a contrast, the pre-developed condition was also modeled as a comparison.
- (1)
- Developed Model
This scenario simulated the current conditions in the study area. Field research was conducted to collect data, including aerial images, pipe information, soil physical and chemical properties, open channels, and land-use types. We then used a geographic Information System (GIS) to process and validate all the data, and 21 subcatchments were delineated, shown in Figure 1.
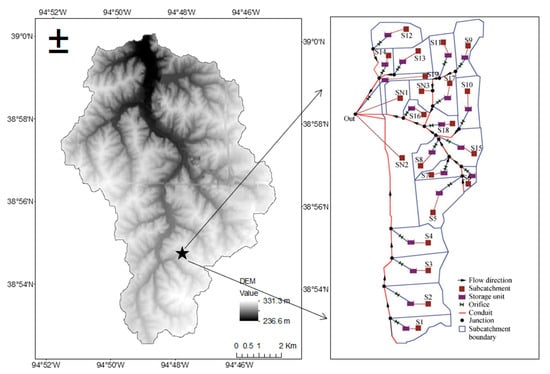
Figure 1.
Location and the schematic diagram of the study area.
We built up an SWMM model and used Nash–Sutcliffe efficiency coefficients (Ens) for the validation of the model. Six rainfall events covering different magnitude and duration were selected. It was found that Nash–Sutcliffe efficiency coefficients (Ens) for the flow of the selected six single precipitation events were greater than 0.78, demonstrating a favorable simulation effect. The main calibrated parameters are listed in Table 2.
Table 2.
Main input parameters of SWMM subcachment.
- (2)
- Pre-developed model
The pre-developed SWMM model was based on the developed model and was developed to represent the pre-development hydrology. Considering imperviousness is an important indicator in assessing urbanization, we set the imperiousness of the study area as 5%. Other parameters of this model were the same as the developed model except for a different site imperviousness of 5%.
- (3)
- Developed with BRCs
This model is approached based on the developed model by hypothetically placing a BRC in the possible subcatchment. We used a high-resolution imagery and measurement tool of ArcGIS to determine the applicable BRCs surface area for each subcatchment. Two of the twenty-one subcatchments were open land, and no BRCs were simulated. In SWMM, we used a storage unit, an outlet and a node to embed each outflow series.
RECARGA, a tool for bioretention, was utilized to design all BRCs to ensure a drainage duration of fewer than 48 h [37]. The BRC surface area and the subcatchement imperviousness where it lay are shown in Figure 2. The saturated hydraulic conductivity (minimum infiltration rate) of natural soil is 0.64 cm/h, and the diameter of the underdrain hole is 1.27 cm, 1.91 cm, or 2.54 cm. The planting media depth is 1.2 m with a minimum infiltration rate of 0.305 m/d.
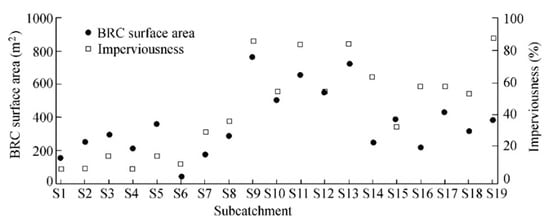
Figure 2.
BRC surface area and subcatchment imperviousness.
Due to the complexity of water movement in biological retention ponds, SWMM has certain limitations in accurately simulating water movement and water volume change in biological retention ponds. Therefore, in this paper, RECARGA, a design and simulation software for biological retention ponds, was used to simulate the water movement and water volume change in biological retention ponds. The results were then embedded in the SWMM model for further analysis. The simulation included the following steps: (1) the developed model was used to simulate the runoff series of each subcatchments during 1968–1977, with a time interval of 1 h; (2) the runoff series was edited in the format required by RECARGA; (3) the parameters in RECARGA were edited according to BRCs and subcatchment characteristics; (4) RECARGA was used to simulate the water movement in each BRC; (5) the results of RECARGA were used to obtain the outflow series after the treatment of BRCs; and (6) the outflow series was input into the developed model for further analysis. For each subcatchment, the SWMM uses a storage pool, an outlet, and a node to accept the runoff series from the BRCs. Figure 3 displays the procedure used to simulate the hydrological performances of BRCs.
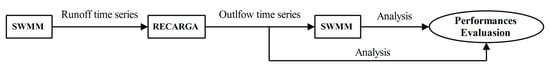
Figure 3.
Simulation and performance of BRCs based on SWMM and RECARGA.
2.3. Performances Indicator System
As stated before, the most critical goal of LID is to sustain the regional hydrology before development. Prince George’s County suggests evaluating if LIDs accomplish the goal by comparing the pre-development and post-development hydrology [35]. We developed a series of indicators to facilitate these comparisons. First, we assessed how much flow would flow through and then leaves BRCs (underdrain flow), which contributes to the regional surface, but BRCs have improved the water quality. We also examined how much flow would contribute to the regional runoff, including underdrain flow and the water flow over the BRCs surface without infiltration. We used Rreduction, Roverflow, and Runderdrain to examine the hydrological performances of BRCs. Rreduction is an overall indicator representing the runoff reduction due to the application of BRCs. Roverflow is an indicator to describe the part of water contributing to regional surface runoff without being treated by BRCs, and Runderdrain represents the water contributing to regional surface runoff with the water quality improved since it flows through the planting media of the BRCs.
where Voverflow refers to the water flowing out of the facility from the surface without infiltration; Vinflow refers to the total water flowing into the BRCs; Vunderdrain refers to the water flowing out of the facility through the underdrain in the bottom of BRCs; and Voutflow refers to water flowing out of the BRCs, including Roverflow and Runderdrain.
The flow regime’s condensing frequency, magnitude, and duration are also crucial characteristics. We used the peak flow frequency exceedance curve to depict the peak discharge’s frequency distribution and magnitude. The peak flow frequency exceedance curve shows flow peaks and associated exceedances per year or simulation period. These are essential components for the flow regime, account for the ecological benefits, and were applied in this study as one performance evaluation indicator. The flow duration graph illustrates the percentage of time flows equaled or exceeded during simulation. It shows the flow magnitude, duration, and frequency and expresses the hydrologic spectrum [36]. Palhegyi [38] tested the flow duration curves of a bioretention cell by comparing pre-developed and developed runoff time series based on single precipitation events. The flow duration curves closely reproduce the pre-developed hydrologic time series. Flow duration curves have also been used in evaluating stormwater management practices’ impacts and are considered an efficient tool for watershed calibration. Therefore, they were applied in this study as one performance evaluation indicator.
We also developed an ecology indicator to represent whether BRCs will promote the downstream ecology. T0.5, the fraction of a multi-year period in the flow that exceeds the 0.5-year return period storm, was calculated as a measure of the influence of urbanization because high flows tend to increase in frequency but are shorter in duration. Research showed that T0.5 was a great predictor of biotic diversity, a measure of water quality [35]. Similar findings were also noticed in the study area, indicating a high correlative relationship between T0.5 and biological indices MBI (Macroinvertebrate Biotic Index), FBI (Family Level Biotic Index), and KBI (Kansas Biotic Index) in the East Lenexa study [36]. Therefore, T0.5 served as the hydrologic indicator for quantifying the ecological benefits of bioretention cells in the study area.
Bioretention performance in mimicking an pre-development hydrology was determined by comparing three management scenario metrics: pre-developed, developed condition, and developed with BRCs. It was considered that the closer the indicators of the scenario are to the pre-developed situation, the better their hydrological performances.
3. Results and Discussion
3.1. Runoff Mitigation and Water Quality Improvement
Models under the three scenarios discussed here were executed with a 15 min time step for the precipitation data set from 1968 to 1977. The results were listed in Table 3.
Table 3.
Runoff control performances of bioretention.
Reduction expressed runoff mitigation; the flow ratio remained in the BRCs to the total regional surface flow. Figure 4 shows the runoff. The runoff reduction for the whole study area was 53.4%, ranging from 42.1% to 57.2% for each BRC. To be more specific, 599,180 m3 of water was retained in the BRCs, whereas 1,282,480 m3 of runoff was recorded across the whole study area. Of the 19 BRCs, the minimum reduction was 42.7%, while the maximum was 57.2%. Most concentrated between 48.2% and 55.1%, with little variation.
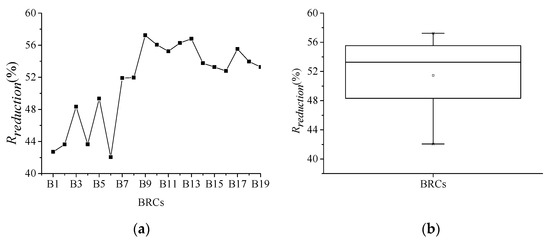
Figure 4.
Reduction of BRCs. (a) Rreduction for all BRCs; (b) range and distribution of Rreduction.
Overflow refers to the water flowing across the BRC surface area without infiltrating, which may be caused by a filled BAV and the precipitation intensity exceeding the infiltration rate of native soil. Overflow contributed to the direct surface runoff and was thus used as an indicator to represent the performances of BRCs. We used Roverflow, the ratio of overflow to the total inflow to the BRCs, for the analysis. The results are shown in Figure 5. The cumulative Roverflow for the study period was 30.55%, which accounted for 65.6% of surface runoff. For single BRC, Roverflow ranged from 24.7% to 39.5%. Significant differences were noticed between BRCs, mainly caused by the BAV of BRCs. A strong negative correlation with the fitness square R2 of 0.99 indicated that less water flowed out of the facility directly with the increase in the reduction rate.
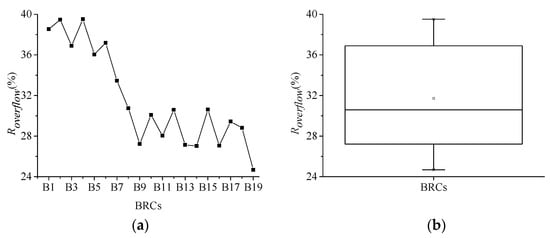
Figure 5.
Roverflow of BRCs. (a) Roverflow for all BRCs; (b) range and distribution of Roverflow.
Additionally, we wanted to analyze another flow indicator, underdrain flow, which is easily ignored. Underdrain flow refers to the water flowing through BRCs but still contributes to the surface runoff. However, it was noted that the underdrain flow was different from the overflow because the water quality was greatly improved by flowing through the planting zone of BRCs. We introduced Runderdrain, the ratio of underdrain flow to the total inflow, to represent the treated water that contributed to runoff. Figure 6 shows that the accumulated Runderdrain was 16.1%, accounting for 34.6% outflow, indicating a noticeable improvement in water quality. Figure 6 shows that the underflow ranged from 13.1% to 21.0%, mainly concentrated between 15.0% and 18.9%, with significant fluctuations, but no significant trend was noticed between BRCs.
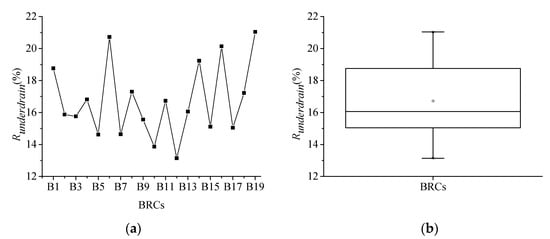
Figure 6.
Underdrain flow of BRCs. (a) Underdrain flow ratio of the subcatchments; (b) range and distribution of underdrain flow ratio.
To test the hydrological impacts of BRCs, we conducted a significance test for the water quantity entering and leaving biological detention ponds. There was a significant difference between the two groups of data when p < 0.5. The significance test revealed p = 2.40 × 10⁻⁷, confirming that the volume of water exiting the BRCs was significantly smaller than the volume entering the BRCs. As expected, positive linear relationships were observed between the inflow and outflow (R2 = 0.979, where R2 is the coefficient of determination) and inflow and overflow (R2 = 0.927). This implied that the outflow would significantly increase with the inflow. It can be easily speculated that the BRCs might have limited hydrological performances during large storms, which are more likely to generate more runoff.
To evaluate the study area’s BRC runoff volume control, the runoff coefficients under the three different scenarios were calculated and listed in Table 4. The runoff coefficients under the scenarios of a pre-developed, developed, and developed with BRCs were 0.081, 0.358, and 0.165, respectively. These numbers indicated a significant improvement in the runoff coefficient for the study area. While BRCs decreased the runoff coefficient significantly, it remained much higher than in the pre-developed condition, suggesting that 5% of the study area’s impervious area as the BRC surface area may not be enough to reduce the developed runoff coefficient to the pre-developed value.
Table 4.
Runoff coefficient for the three scenarios.
Figure 7 displays the distinctions between each situation more explicitly. Significant fluctuations were noticed for the developed conditions. BRCs significantly decreased the runoff coefficient and generated a more concentrated distribution. These findings indicate that BRCs could mimic the pre-developed hydrology to some extent, especially for low-impervious subcatchments such as S1, S2, S3, S4, S5, and S6.
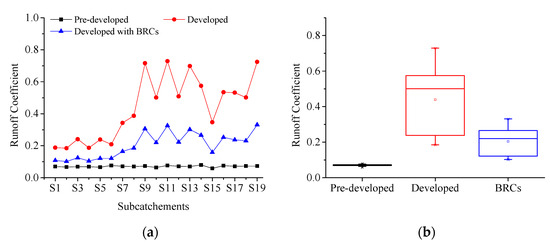
Figure 7.
Runoff coefficients under different scenarios. (a) Runoff coefficients for different subcatchments; (b) range and distribution of runoff coefficients.
3.2. Peak Flow Frequency Exceedance Curve
Figure 8 depicts the frequency of peak flow exceedance for the three scenarios evaluated in the study area. As anticipated, the lowest peak discharge value occurred under the pre-developed scenario, and a more significant increase in peak discharge value was observed for the developed scenario without stormwater controls. Figure 8 demonstrates that the BRCs significantly reduced the peak discharge for storms with a return duration of less than one year. When the storm return period exceeded one year, the peak discharge of the BRC-controlled scenario approached the scenario of developed area without stormwater controlled. Additionally, when the storm was smaller than the 0.1-year storm value, the peak discharge of the BRC-controlled scenario could be the same as the pre-developed scenario. These findings confirmed that when the BRCs cells area was 5% of the total impervious area, the performance in peak discharge during large storms was limited and was capable of handling storms smaller than the one-year storm.
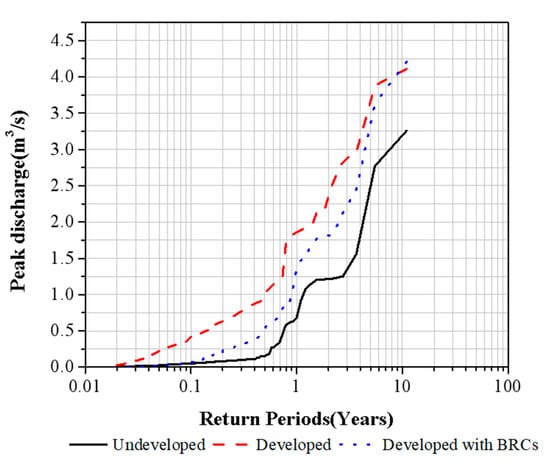
Figure 8.
Performances of bioretention cells on peak flow frequency exceedance curve.
3.3. Flow Duration Curve
Frequency and duration are crucial components in hydrology, and flow duration curves could successfully depict duration and magnitude [35]. Figure 9 shows the impacts of the BRC control practices on the full spectrum of flow, demonstrated by flow duration curves. It can be seen that when BRCs controlled the runoff generation under urban conditions, small discharges (those that occur more than 90% of the time) in magnitude and duration closely matched those of pre-developed conditions across a full spectrum. The change in large flows was explained because the BRCs cells can only control the small storms, which is discussed later in the study.
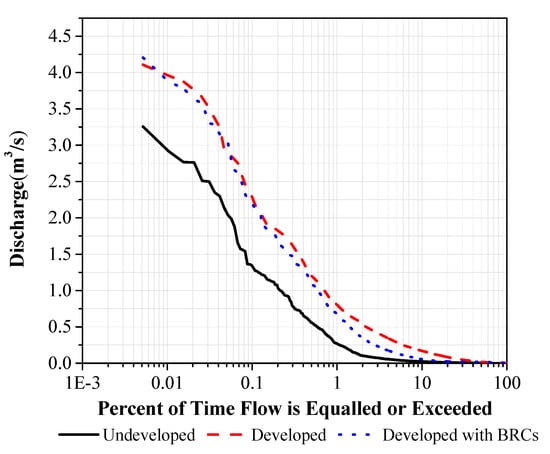
Figure 9.
Flow duration curve for the three scenarios.
3.4. T0.5
The SWMM model results for the three scenarios were used to estimate the T0.5 at the study area’s outlet to study the impacts of BRC cells on in-stream biology. Since there was a positive linear relationship between T0.5 and biological diversity, it was assumed that if the T0.5 increased, then the biological diversity would increase. Calculations of T0.5 under different thresholds are listed in Table 5. Table 5 shows that when the threshold was 0.11 m3/s, for the pre-developed scenario, T0.5 was 0.838. For the developed condition, T0.5 was 0.045, indicating the degradation of biological diversity. For the condition of land developed with BRCs, T0.5 was 0.226, which showed a significant increase, indicating improvement in in-stream ecology. The resemblance of T0.5 of BRCs to pre-developed conditions might suggest that even small BRCs (the surface area of BRCs was 5% of its impervious catchment area) can be efficient in improving stream ecology.
Table 5.
T0.5 under different scenarios.
4. Discussion
Evaluation of the performances of 19 BRCs on the runoff volume control, peak flow exceedance curve, flow duration curve, and T0.5 allowed the investigation into the evaluation standards of BRC performances and current sizing design methods.
4.1. Runoff Volume Control Performances
The runoff volume control performances of BRCs were significant in controlling the total inflow, 53.3% of which infiltrated into the groundwater or left BRCs via transpiration or evaporation. Similar runoff volume control performances were found in the studies by Davis [22] and Li et al. [39] based on the field monitoring data. In Davis’ analysis, the mean values of Routflow for the two BRCs under 24 h monitoring were 35% and 48%, respectively. These numbers were smaller than the value in this study; the reason for this might be that the BRCs area was about 45% of the whole drainage area (and also 45% of the impervious area). In comparison, the BRC area was only 5.0% impervious in this study. The runoff volume control performance and infiltration performances were very significant. However, supposing we used runoff coefficients as an indicator to examine the runoff volume control performances of BRCs. In that case, the results would not be satisfactory, especially for areas with high imperviousness. These findings indicate that if we wanted the runoff coefficients to be reduced to their pre-developed value, we need to increase the surface area of the BRCs or increase the media and native soil infiltration rates. According to Davis’ research, the BRC area was almost 45% of the total drainage area, and the runoff coefficient was approximately 0.24, which was much higher than the runoff coefficients under pre-developed conditions (less than 0.07 based on the result in this study). It was noted that the 45% BRC area was 45% of the whole drainage area, a very high ratio, and may not always be available for a catchment. In addition, the infiltration of the native soil was limited by the local soil and could not be enhanced manually. Based on these findings, we assumed that the runoff coefficients were not an efficient goal of LID practices.
4.2. Peak Discharge Reduction, Flow Duration Curve and T0.5
The peak discharge reduction for single events was not analyzed in this study. Instead, the peak discharge curves were plotted. The peak discharge curve of the BRC treatment condition matched the predeveloped state very well when the precipitation was smaller than a 0.1-year (return period) storm. The peak discharge reduction for the 0.5-year to 2-year storm was around 40% to 50%. When the storm was smaller than the 1-year storm, the peak reduction decreased significantly. Previous studies supported these results that BRCs cells can reduce hydrologic impacts for small events but were predicted to be ineffective in large storm events [40,41,42]. The peak discharge curve was a very efficient way to evaluate the performance of BRC cells if the objective of BRCs cells was for peak discharge, but it was noted that peak reduction was the only goal. Detention can be more efficient by controlling the precipitation depth up to a 100-year storm.
The flow duration curve expressed the long-term hydrologic spectrum of the study area. It could provide direct knowledge of the flow’s quantity, duration, and frequency. Palhegyi [38] tested the flow duration curves by comparing pre- and post-runoff time series and found that the flow duration curves closely reproduced the pre-developed hydrologic time series. He recommended that the flow duration curves be the basis for designing stormwater controls that mimic pre-developed hydrology. Palhegyi’s research was based on the flow duration curve of single events, and the results could not reflect the pre-developed hydrology. Still, this method was different from the current sizing methods. To conclude, the flow duration curves were a good way for BRC sizing because they could achieve the design objectives of recharging groundwater or base flow, reducing peak discharge, and controlling the flow duration, magnitude, and frequency simultaneously.
The results for T0.5 indicated that BRCs are an efficient way to improve water stream ecology. However, this study did not test other hydrologic indicators that were assumed to be related to stream ecology.
5. Conclusions
In this paper, we developed a series of hydrological indicators to examine the BRCs performances and used them in a moderate urban area. Implementing BRCs could significantly reduce the urban surface flow while improving the water quantity. Runoff coefficients were closer to those under pre-developed conditions. The analysis results of the peak discharge frequency curve show that the BRCs plays a significant role in regulating the peak discharge of rainfall events with a high frequency. When the frequency of precipitation events decreases, its regulatory role on the peak discharge is gradually weakened. The flow duration curve confirmed that BRCs can effectively simulate the regional natural runoff morphology for small rainfall events and can be an effective metric to evaluate the performances of BRCs. However, it was challenging to minimize the runoff coefficients as the values under pre-developed conditions might not be an effective evaluation indicator. To meet the LID design goals, a higher BRC surface area will be needed. From a hydrologic perspective, if T0.5 was used, the stream ecology was significantly improved under BRC treatment conditions.
Author Contributions
Conceptualization, Y.S. and C.X.; methodology, Y.S. and F.Y.; software, Q.L.; validation, M.M. and Y.S.; formal analysis, Y.S. and M.M.; investigation, Y.S.; resources, Y.S.; data curation, Q.L.; writing—original draft preparation, Q.L.; essay—review and editing, Y.S. All authors have read and agreed to the published version of the manuscript.
Funding
This research was funded by Basic Public Welfare Research Program of Zhejiang Province, grant number LZJWD22E090001; Major Science and Technology Program of Zhejiang Province, grant number 2021C03019; Central Plains Science and Technology Innovation Leading Talent Support Program, grant number 204200510048; and The Key Scientific Research Project Plan of Colleges and Universities in Henan Province, grant number 21A170014.
Institutional Review Board Statement
Not applicable.
Informed Consent Statement
Not applicable.
Data Availability Statement
The data presented in this study are available on request from the corresponding author. The data are not publicly available due to the complexity of models.
Conflicts of Interest
The authors declare no conflict of interest.
References
- Barco, J.; Hogue, T.S.; Curto, V.; Rademacher, L. Linking hydrology and stream geochemistry in urban fringe watersheds. J. Hydrol. 2008, 360, 31–47. [Google Scholar] [CrossRef]
- Chen, W.J.; Huang, G.R.; Zhang, H. Urban stormwater inundation simulation based on SWMM and diffusive overland-flow model. Water Sci. Technol. 2017, 76, 3392–3403. [Google Scholar] [CrossRef]
- Fletcher, T.D.; Andrieu, H.; Hamel, P. Understanding, management and modelling of urban hydrology and its consequences for receiving waters: A state of the art. Adv. Water Resour. 2013, 51, 261–279. [Google Scholar] [CrossRef]
- Poff, N.L.; Allan, J.D.; Bain, M.B.; Karr, J.R.; Prestegaard, K.L.; Richter, B.D.; Sparks, R.E.; Stromberg, J.C. The natural flow regime: A paradigm for river conservation and restoration. BioScience 1997, 47, 769–784. [Google Scholar] [CrossRef]
- Walsh, C.J.; Fletcher, T.D.; Ladson, A.R. Stream restoration in urban catchments through redesigning stormwater systems: Looking to the catchment to save the stream. J. N. Am. Benthol. Soc. 2005, 24, 690–705. [Google Scholar] [CrossRef]
- Poff, N.L.; Zimmerman, J.K.H. Ecological responses to altered flow regimes: A literature review to inform the science and management of environmental flows. Freshw. Biol. 2010, 55, 194–205. [Google Scholar] [CrossRef]
- Hamel, P.; Daly, E.; Fletcher, T.D. Source-control stormwater management for mitigating the impacts of urbanisation on baseflow: A review. J. Hydrol. 2013, 485, 201–211. [Google Scholar] [CrossRef]
- U.S. Environmental Protection Agency (USEPA). Low Impact Development: A Literature Review; Office of Water: Washington, DC, USA, 2000; EPA-841-B-00-005. [Google Scholar]
- Zhu, Z.; Chen, Z.; Chen, X.; Yu, G. An Assessment of the Hydrologic Effectiveness of Low Impact Development (LID) Practices for Managing Runoff with Different Objectives. J. Environ. Manag. 2019, 231, 504–514. [Google Scholar] [CrossRef]
- Hsieh, C.H.; Davis, A.P. Multiple-event study of bioretention for treatment of urban storm water runoff. Water Sci. Technol. 2005, 51, 177–181. [Google Scholar] [CrossRef]
- Aiyelokun, O.; Pham, Q.B.; Aiyelokun, O.; Malik, A.; Adarsh, S.; Mohammadi, B.; Linh, N.T.T.; Zakwan, M. Credibility of Design Rainfall Estimates for Drainage Infrastructures: Extent of Disregard in Nigeria and Proposed Framework for Practice. Nat. Hazards 2021, 109, 1557–1588. [Google Scholar] [CrossRef]
- Abduljaleel, Y.; Demissie, Y. Identifying Cost-Effective Low-Impact Development (LID) under Climate Change: A Multi-Objective Optimization Approach. Water 2022, 14, 3017. [Google Scholar] [CrossRef]
- Davis, A.P.; Hunt, W.F.; Traver, R.G.; Clar, M. Bioretention technology: Overview of current practice and future needs. J. Environ. Eng. 2009, 135, 109–117. [Google Scholar] [CrossRef]
- Jaber, F.H.; Guzik, E.R. Improving water quality and reducing the volume of urban stormwater runoff with a bioretention area. In Proceedings of the American Society of Agricultural and Biological Engineers Annual International Meeting, ASABE, Reno, NV, USA, 21 June 2009. [Google Scholar]
- Brown, R.J.; Hunt, W.F. Impacts of maintenance and (1m) properly sizing bioretention on hydrologic and water quality performance. In Proceedings of the World Environmental and Water Recources Congress, Providence, RI, USA, 16–20 May 2010. [Google Scholar]
- Dietz, M.E.; Clausen, J.C. A field evaluation of rain garden flow and pollutant treatment. Water Air Soil Pollut. 2005, 167, 123–138. [Google Scholar] [CrossRef]
- Davis, A.P. Field performance of bioretention: Water quality. Environ. Eng. Sci. 2007, 24, 1048–1064. [Google Scholar] [CrossRef]
- Lisenbee, W.A.; Hathaway, J.M.; Winston, R.J. Modeling Bioretention Hydrology: Quantifying the Performance of DRAINMOD-Urban and the SWMM LID Module. J. Hydrol. 2022, 612, 128179. [Google Scholar] [CrossRef]
- Passeport, E.; Hunt, W.F.; Line, D.E.; Smith, R.A.; Brown, R.A. Field study of the ability of two grassed bioretention cells to reduce stormwater runoff pollution. J. Irrig. Drain. Eng. 2009, 135, 505–510. [Google Scholar] [CrossRef]
- Chapman, C.; Horner, R.R. Performance assessment of a street-drainage BRCs system. Water Environ. Res. 2010, 82, 109–119. [Google Scholar] [CrossRef]
- Chen, X.L.; Peltier, E.; Sturm, B.S.M.; Young, C.B. Nitrogen removal and nitrifying and denitrifying bacteria quantification in a water BRCs system. Water Res. 2013, 47, 1691–1700. [Google Scholar] [CrossRef]
- Davis, A.P. Field performance of bioretention: Hydrology impacts. J. Hydrol. Eng. 2008, 13, 90–95. [Google Scholar] [CrossRef]
- DeBusk, K.M.; Wynn, T.M. Strom-water Bioretention for runoff quality and quantity mitigation. J. Environ. Eng. 2011, 137, 800–808. [Google Scholar] [CrossRef]
- Jia, H.F.; Wang, X.W.; Ti, C.P.; Zhai, Y.Y.; Field, R.; Tafuri, A.N.; Cai, H.H.; Yu, S.L. Field monitoring of a LID-BMP treatment train system in China. Environ. Monit. Assess. 2005, 187, 373–390. [Google Scholar] [CrossRef]
- Jones, P.S.; Davis, A.P. Spatial accumulation and strength of affiliation of heavy metals in BRCs media. J. Environ. Eng. 2013, 139, 479–487. [Google Scholar] [CrossRef]
- Hunt, W.F.; Davis, A.P.; Traver, R. Meeting hydrologic and water quality goals through targeted BRCs design. J. Environ. Eng. 2012, 138, 698–707. [Google Scholar] [CrossRef]
- Li, J.K.; Davis, A.P. A unified look at phosphorus treatment using bioretention. Water Res. 2016, 90, 141–155. [Google Scholar] [CrossRef]
- Lucas, B. Design of integrated bioinfiltration-detention urban retrofits with continuous simulation methods. In Proceedings of the World Environment & Water Resources Congress, ASCE, Kansas City, MO, USA, 17–21 May 2009. [Google Scholar]
- Morris, Z.B.; Malone, S.M.; Cohen, A.R.; Weissburg, M.J.; Bras, B. Impact of Low-Impact Development Technologies from an Ecological Perspective in Different Residential Zones of the City of Atlanta, Georgia. Engineering 2018, 4, 194–199. [Google Scholar] [CrossRef]
- Gregory, M. Flow duration hydrograph analyses for assessing LID performance. J. Water Manag. Model. 2015, 23, 1–6. [Google Scholar] [CrossRef]
- Asleson, B.C.; Nestingen, R.S.; Gulliver, J.S.; Hozalski, R.M.; Nieber, J.L. Performance assessment of rain gardens. JAWRA J. Am. Water Resour. Assoc. 2009, 45, 1019–1031. [Google Scholar] [CrossRef]
- Heasom, W.; Traver, R.G.; Welker, A. Hydrologic modeling of a bioinfiltration best management practice. JAWRA J. Am. Water Resour. Assoc. 2006, 42, 1329–1347. [Google Scholar] [CrossRef]
- Bosley, E.K.; Kem, E. Hydrologic Evaluation of Low Impact Development Using a Continuous, Spatially-Distributed Model. Masters Thesis, Virginia Polytechnic Institute and State University, Blacksburg, VA, USA, 2008. [Google Scholar]
- Platz, M.; Simon, M.; Tryby, M. Testing of the Storm Water Management Model Low Impact Development Modules. JAWRA J. Am. Water Resour. Assoc. 2020, 56, 283–296. [Google Scholar] [CrossRef]
- Sun, Y.; Pomeroy, C.; Li, Q.; Xu, C. Impacts of Rainfall and Catchment Characteristics on Bioretention Cell Performance. Water Sci. Eng. 2019, 12, 98–107. [Google Scholar] [CrossRef]
- Pomeroy, C.A. Evaluating the Impacts of Urbanization and Stormwater Management Practices on Stream Response. Ph.D. Dissertation, Colorado State University, Fort Collins, CO, USA, 2007. [Google Scholar]
- Sun, Y.-W.; Wei, X.-M.; Pomeroy, C.A. Global Analysis of Sensitivity of Bioretention Cell Design Elements to Hydrologic Performance. Water Sci. Eng. 2011, 4, 246–257. [Google Scholar] [CrossRef]
- Palhegyi, G.E. Modeling and sizing bioretention using flow duration control. J. Hydrol. Eng. 2010, 15, 417–425. [Google Scholar] [CrossRef]
- Li, H.; Sharkey, L.J.; Hunt, W.F.; Davis, A.P. Mitigation of impervious surface hydrology using bioretention in North Carolina and Maryland. J. Hydrol. Eng. 2009, 14, 407–415. [Google Scholar] [CrossRef]
- Brander, K.E.; Owen, K.E.; Potter, K.W. Modeled impacts of development type on runoff volume and infiltration performance. JAWRA J. Am. Water Resour. Assoc. 2004, 40, 961–969. [Google Scholar] [CrossRef]
- Williams, E.S.; Wise, W.R. Economic impacts of alternative approaches to storm water management and land development. J. Water Resour. Plan. Manag. 2009, 135, 537–546. [Google Scholar] [CrossRef]
- Muthanna, T.M.; Viklander, M.; Thorolfsson, S.T. An evaluation of applying existing BRCs sizing methods to cold climates with snow storage conditions. Water Sci. Technol. 2007, 56, 73–81. [Google Scholar] [CrossRef]


Disclaimer/Publisher’s Note: The statements, opinions and data contained in all publications are solely those of the individual author(s) and contributor(s) and not of MDPI and/or the editor(s). MDPI and/or the editor(s) disclaim responsibility for any injury to people or property resulting from any ideas, methods, instructions or products referred to in the content. |
© 2023 by the authors. Licensee MDPI, Basel, Switzerland. This article is an open access article distributed under the terms and conditions of the Creative Commons Attribution (CC BY) license (https://creativecommons.org/licenses/by/4.0/).