Review

What Is Polluting Delhi’s Air? A Review from 1990 to 2022

by
Sarath K. Guttikunda
1,2,*,
Sai Krishna Dammalapati
2,
Gautam Pradhan
3,
Bhargav Krishna
4,
Hiren T. Jethva
5 and
Puja Jawahar
2
1
Transportation Research and Injury Prevention (TRIP) Centre, Indian Institute of Technology, New Delhi 110016, India
2
Urban Emissions, New Delhi 110019, India
3
Earthmetry, Bengaluru 560037, India
4
Centre for Policy Research, New Delhi 110021, India
5
GESTAR-II, NASA Goddard Space Flight Center, Morgan State University, Greenbelt, MD 21251, USA
*
Author to whom correspondence should be addressed.
Sustainability 2023, 15(5), 4209; https://doi.org/10.3390/su15054209
Submission received: 2 February 2023 / Revised: 22 February 2023 / Accepted: 23 February 2023 / Published: 26 February 2023

Abstract

:
Delhi’s annual average PM2.5 concentration in 2021–22 was 100 μg/m3—20 times more than the WHO guideline of 5 μg/m3. This is an improvement compared to the limited information available for the pre-CNG-conversion era (~30%), immediately before and after 2010 CWG (~28%), and the mid-2010s (~20%). These changes are a result of continuous technical and economic interventions interlaced with judicial engagement in various sectors. Still, Delhi is ranked the most polluted capital city in the world. Delhi’s air quality is a major social and political concern in India, often with questions regarding its severity and primary sources, and despite several studies on the topic, there is limited consensus on source contributions. This paper offers insight by reviewing the influence of Delhi’s urban growth since 1990 on pollution levels and sources and the evolution of technical, institutional, and legal measures to control emissions in the National Capital Region of Delhi.

1. Introduction

“How bad is Delhi’s air quality?” and “What are the main sources of Delhi’s air pollution problem?” are perennial questions in India, despite Delhi being the most studied city [1,2,3,4,5,6,7,8]. Delhi’s air pollution peaks during the winter months starting with Diwali and post-harvest agricultural waste burning and deteriorates further with lower surface temperatures resulting in an increase in demand for space heating [9,10,11]. The pollution levels are the lowest during the monsoon months, but not negligible. This cyclical nature also overlaps with the overall interest in the topic and efforts to address the issue, peaking at the start of the winter pollution episodes, with the most the media coverage (based on the number of articles published), public interest (based on social media activity and google search trends), and political will (based on the number of political statements made) [12,13].
Delhi’s air pollution is a year-round problem with substantial contributions coming from vehicle exhaust, road dust, construction dust, cooking and heating, open waste burning, light and heavy industries, diesel generator sets, seasonal sources such as agricultural burning and dust storms, and contributions from sources outside Delhi’s administrative boundary [2,7,8,14,15]. While Delhi’s air quality is the most talked about, studied, and published (nationally and internationally), there is limited consensus on its sources and their contributions. These modelling studies conducted between 1990 and 2022 ranged from the use of filter sampling with chemical analysis in a laboratory [8], building multi-pollutant emission inventories [14,16,17], conducting chemical transport modelling [18,19,20], to the use of real-time instruments [21,22,23].
Continuous ambient air quality monitoring expanded from mostly manual monitoring in the 1990s to one real-time station in the 2000s to 40+ real-time stations in 2022. These stations measure and reported a mix of pollutants ranging from aerosols such as particulate matter (PM2.5 and PM10 size fractions), to gases such as sulphur dioxide (SO2), nitrogen oxides (NO and NO2), carbon monoxide (CO), ammonia (NH3), and ozone [24,25]. For convenience, the discussion in this paper is limited to PM2.5, which is the most important pollutant often exceeding Indian standards [3,26,27] and also contributes to a large share of estimated health impacts related to the respiratory, heart, and neurological systems [28,29,30,31,32,33,34].
The judiciary system, comprising the Supreme Court and the National Green Tribunal, has played a critical role in addressing the air pollution problem in Delhi, in some cases mandating technical, economic, and institutional solutions ahead of the respective national and state departments. Despite these efforts, in 2022, Delhi’s air quality ranked the worst among the world’s capital cities [35].
More than 100 studies have documented the rise and fall of Delhi’s air quality, the interventions in various sectors that worked and failed to address the air quality problem, the capacity-building efforts to generate and disseminate monitoring data, the efforts to quantify emission sources and their contributions to ambient PM2.5 pollution, the ways to raise awareness via pollution alert systems, and the challenges in institutionalising air quality management efforts. This long-form review paper aims to gain a deeper understanding of the concerns surrounding Delhi’s air quality and its evolution from data, including sectoral, judicial, and institutional perspectives, by consolidating all the information between 1990 and 2022.

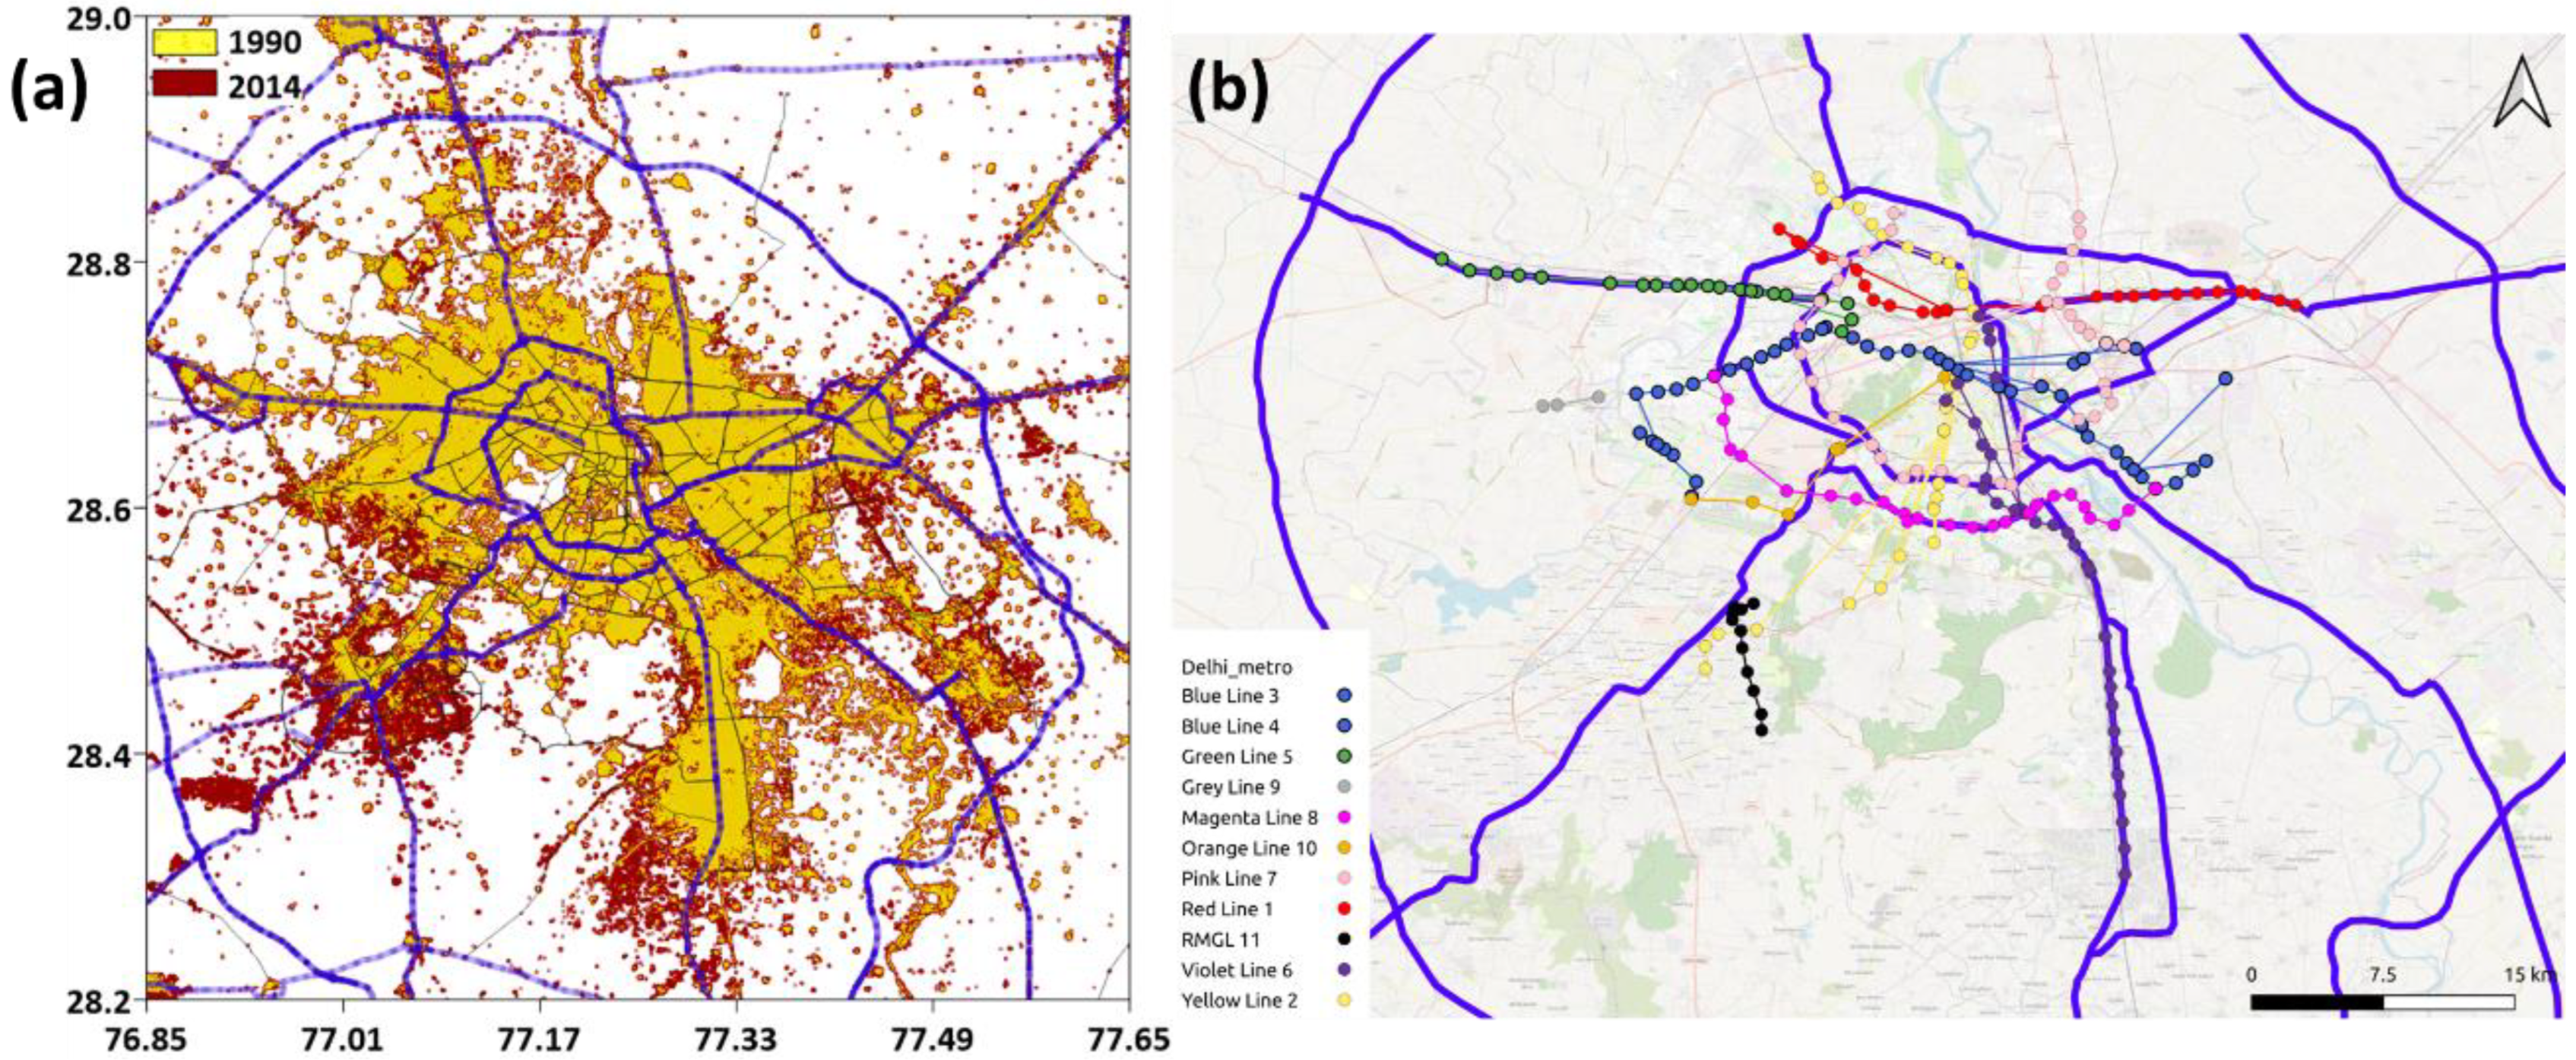
2. Geography and Meteorology

Delhi was designated union territory in 1956 and the National Capital Territory (NCT) in 1992, with limited state-level administrative power. The NCT (Table 1), covering ~0.05% of India’s landmass, is inhabited by ~1.6% of India’s total population and hosts ~8% of India’s registered vehicle fleet. Situated on the Indo-Gangetic Plain (IGP), the city is landlocked between the states of Haryana, Uttar Pradesh, and Rajasthan and is surrounded by multiple Tier-2 and Tier-3 cities. The most notable satellite cities are Gurgaon, Noida, Greater Noida, Ghaziabad, Faridabad, and Sonipat, with constant personal and commercial traffic to and from Delhi. The most notable Tier-3 cities within Delhi’s influential airshed are Rohtak, Jhajjar, Manesar, Bhiwadi, Bulandshahr, Hapur, and Meerut. Collectively with more districts from the neighbouring states, this area is referred to as the National Capital Region (NCR).
Delhi’s weather can be described as a mix of seasons—warm and pleasant spring (February to April) with occasional dust storms; hot and humid summer (May to June) with temperatures reaching up to 40°C; monsoon (July to September) with occasional thunderstorms and strong winds; post-monsoon (late September to early November) with cool breeze and clear skies; and cold and foggy winter (late November to early February) with temperatures dropping to below 10 °C (Table 2). While the emissions quantum is one reason for high air pollution levels in Delhi, seasonal meteorology also plays a dominant role in exacerbating pollution levels [36].
The winter peaks and monsoonal lows in air quality have a strong correlation with modulations in wind speeds, temperature, and mixing heights. Mixing layer (inversion) height, which is a proxy for vertical mixing of emissions, is the lowest during the winter months and even lower during the winter nights (under 100 m), resulting in smaller volumes of air to mix and disperse emissions. At the same time, the winter months also witness a sharp rise in emissions from burning coal, biomass, and waste for heating purposes to counter dropping air and surface temperatures (below 10 °C). The spring and summer months are marked by mixing layer heights above 1000 m and higher wind speeds, allowing for better dispersion of emissions, in both horizontal and vertical dimensions and lesser ambient pollution levels. On average, based on tracer simulations for the years 2001–2008, wintertime PM2.5 concentrations were 20–60% higher, and summertime PM2.5 concentrations were 20–40% lower than annual averages [36].
Most of the monsoonal rains are observed between June and September, followed by sporadic rain spells due to the occurrence of western disturbances during October and November. The frequency of these occurrences doubled between 1980 and 2019 in North India [37]. The winter months also experience low wind speeds, stagnation of air, fog formation, and low visibility, leading to the cancelation of flights and trains and hindrances resulting in economic losses [38,39,40]. All schools have been shut for multiple days due to severe to hazardous levels of pollution leading to public health emergencies between November and January every year since 2017. An increase in fog formation rates is also linked to the presence of secondary organic aerosols from the combustion of biomass for space heating and post-harvest open biomass burning in the North Indian states of Punjab, Haryana, and Uttar Pradesh [41].

3. Ambient Air Quality

The rate of urbanization is a proxy for an increase in the demand for cooking and heating fuels, transportation, electricity for residential and industrial needs, garbage and solid waste management, construction of residential and commercial estates, and state infrastructure development in the form of expressways, highways, arterial roads, and pavements. Most energy needs are met by burning coal, gasoline, diesel, and natural gas. All the combustion and dust-producing activities have resulted in an increase in ambient pollution levels. Change in Delhi’s land use and land cover between 1990 and 2014 is shown in Figure 1a for an airshed covering the NCT and its satellite cities. According to the global human settlements program [42], more than 80% of Delhi’s landmass is designated as a built-up urban area. In Delhi’s airshed, the total built-up area increased four times, from 370 km2 in 1975 to 1220 km2 in 2014.

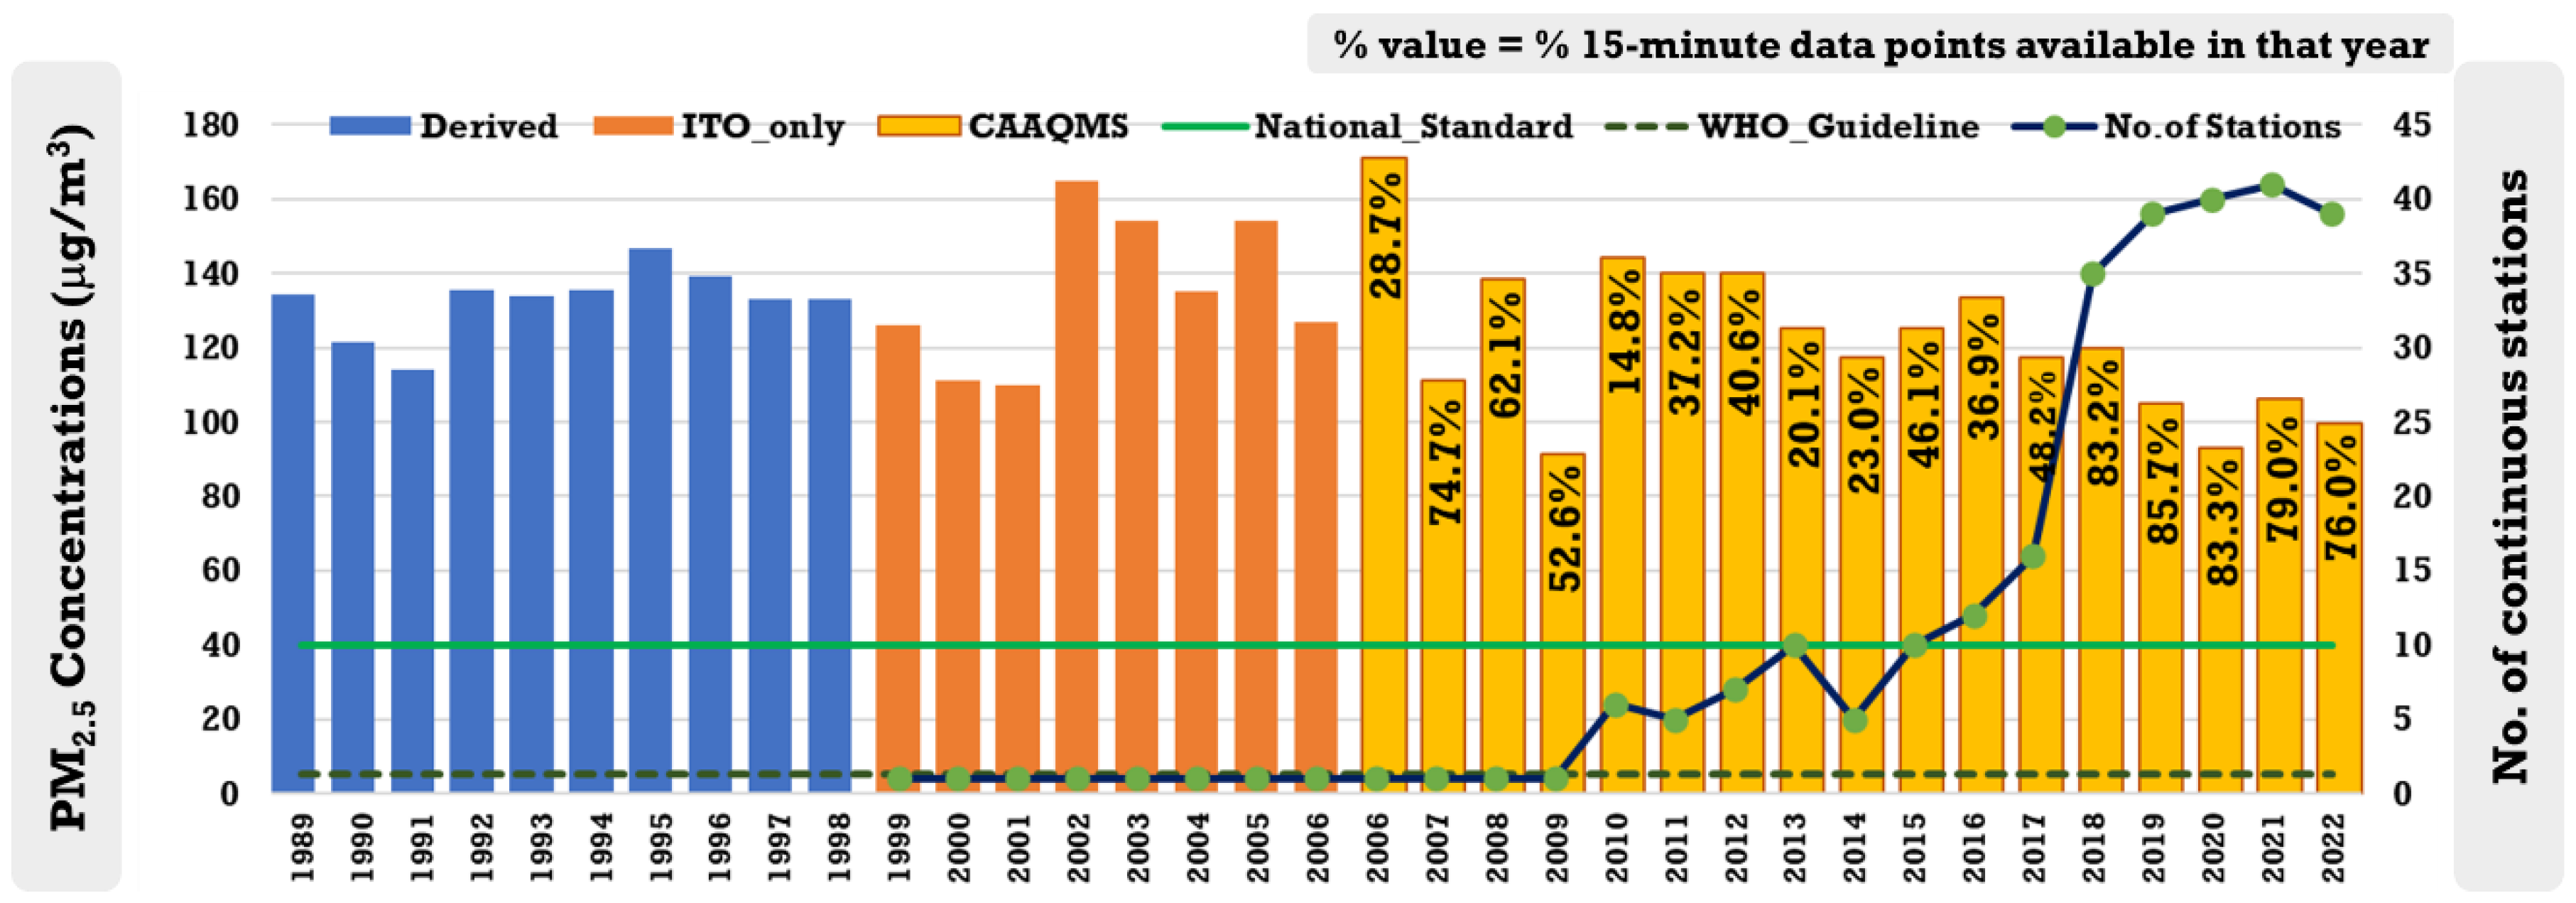
3.1. Ground Measurements

In Delhi, the ambient air quality is monitored by the Central Pollution Control Board (CPCB) and the Delhi Pollution Control Committee (DPCC). The data from a combination of manual and continuous monitoring stations are hosted on CPCB’s online portal [24]. While only the monthly and annual average concentrations are discussed in this paper, where available, all the data as daily, hourly, and sub-hourly averages are included as Supplementary Information (SI). We acknowledge that there are biases in comparing the data collected from manual and continuous stations to construct trend analysis. However, in the absence of long-term data from one operational monitoring network, it was difficult to interpret the influence of the implementation of key policy and technical interventions on air quality without combining all the available data.

3.1.1. Pre-2006 Period

Most information on Delhi’s air quality before 1998 is anecdotal and available only as averages from academic and official publications. This period also marks a turning point in the air quality dialogues in Delhi with the Supreme Court’s decision to mandate the conversion of all public transport buses and three-wheelers to operate on compressed natural gas (CNG) [4,43,44].
A 1997 white paper [1] published by CPCB and the Ministry of Environment and Forests (MoEF, now MoEFCC with Climate Change) listed the annual averages of total suspended PM (TSP) values as 373, 338, 317, 377, 372, 377, 407, 387, and 370 μg/m3 for the period of 1989 to 1997 (nine years), based on data collected by manual stations. Assuming a typical ratio fraction of 60% between TSP and PM10 and 60% between PM10 and PM2.5, the average PM10 and PM2.5 concentrations for the period are 221 ± 20 μg/m3 and 133 ± 12 μg/m3, respectively, which stand as 14 and 26 times more than the WHO (2021) guidelines of 15 and 5 μg/m3, respectively. While a typical ratio of 60% is used in this assessment, the PM2.5/PM10 fraction could range from as low as 10% during very dusty days to 90% during winter days, with a large portion of PM coming from the burning of coal, biomass, and waste. Summertime 1998 averages during a filter-based study were 71 ± 15 μg/m3 near the Lodhi institutional area and one of Delhi’s largest gardens [45]. Wintertime concentrations are expected to be at least more than double the annual averages.
PM2.5 was introduced as a criterion pollutant requiring mandatory monitoring only in November 2009, and most of the measurements available before 2010 are reported as respirable PM (aka PM10). For the period covering 1999 and 2006, continuous PM10 data are accessible only at an ITO (income tax office) monitoring station near a traffic junction and can be viewed as a station representative of an urban setting (a copy of the data is included in the Supplementary Materials). Figure 2 presents a summary of the PM2.5 data, derived as 60% of PM10. The seasonal trend includes highs during the winter months (Dec-Jan) and lows during the monsoonal months (Jun–Jul). The annual average PM10 concentrations between 1999 and 2006 (8 years) are 209 (70–515), 185 (64–359), 184 (61–410), 275 (131–474), 256 (100–476), 225 (97–378), 257 (96–476), and 212 (97–412) μg/m3. For the same period, the derived PM2.5 concentrations are 126 (42–309), 111 (39–216), 110 (36–246), 165 (79–284), 154 (60–285), 135 (58–227), 154 (58–286), and 127 (58–247) μg/m3. The numbers in brackets represent the 5th and 95th percentile daily average concentrations in the year. We interpret the drop in the annual average concentrations in 2000 and 2001 of approximately 18% compared to the pre-1998 average (133) and 12% compared to the 1999 average (126) as an immediate result of multiple emission control measures implemented in the late 1990s. These measures included the conversion of buses and three-wheelers to operate on CNG, relocation of polluting brick kilns from within city limits to the outskirts, and promotion of cleaner fuels for cooking [44,46,47]. The 2000-01 change observed in these measurements can be attributed to CNG conversion. It is assumed that any significant change in fleet average emission rates is expected to be reflected in the transport-emission-heavy surroundings of the ITO station.
After 2001, all the gains of CNG conversion were gobbled up by an increase in the number of personal vehicles and their usage [47,48,49], and the overall PM10 and PM2.5 averages during 1999-2006 hovered at 228 ± 123 μg/m3 and 137 ± 74 μg/m3, respectively. These values are 15 and 27 times more than the WHO (2021) guidelines of 15 and 5 μg/m3, respectively.

3.1.2. 2006–2018 Period

The number of continuous ambient air quality monitoring (CAAQM) stations and access to data started to increase in 2006, including direct measurements of PM2.5 concentrations. In India, Delhi was among a handful of cities that started to measure and report these values. The PM2.5 data for the period of 2006 to 2022 from CPCB’s online repository were cleaned by deleting nulls, negatives, and unexplainable feeds and they were quality controlled for final use. A summary of these data filters is listed in the Supplementary Materials. Figure 2 presents spatial coverage in the form of the number of CAAQM stations operational by year and temporal coverage in the form of % of useful data points by 15 min interval and the annual average PM2.5 concentrations. The archived database (in the Supplementary Materials) contains both the raw data by station and cleaned hourly, monthly, and annual averages. While there is an improvement in the annual averages between 2006 and 2022, it is difficult to infer what fraction of this improvement is due to on-ground emission controls and what fraction is due to better representation in the measurements with a larger pool of data.
Between 2006 and 2018, the number of stations increased from 1 (ITO station only) to 35. The first big jump in the number of stations came before the Commonwealth Games (CWG) in 2010 when DPCC installed six continuous stations. In the later years, the database included continuous stations operated by the Indian Meteorological Department (IMD) and the Indian Institute of Tropical Meteorology (IITM) under the SAFAR (System of Air quality and weather Forecasting and Research) program [25,50]. The seasonality in the month-by-month (Table 3) data shows typical highs during the winter months and lows during the summer and monsoonal months. This period did not observe any major changes in activity patterns, besides periodic improvements in vehicle and fuel standards and the promotion of clean fuels for cooking.

3.1.3. Post-2018 Period

This period is marked by several significant developments: (1) ratification of the National Clean Air Programme (NCAP) in 2019, (2) major disruptions due to COVID-19 lockdowns in 2020 and 2021, (3) the introduction of Bharat Stage (BS) 6 vehicles in April 2020, (4) the closure of the Environment Pollution (Prevention and Control) Authority (EPCA) in 2020, (5) formation of the Commission for Air Quality Management (CAQM) in 2021, and (6) an increase in CAAQM stations from 35 to 41. Under NCAP, Delhi was designated as one of the 132 non-attainment cities required to reduce their annual average PM2.5 concentrations by 20–30% by 2024 compared to those observed in 2017 [26], with a special emphasis on the need for more ambient and emissions monitoring and more source apportionment studies to support clean air action plans.
The data quality, as usable data in 15 min average points, improved from 30% in 2006 to 85% in 2019 (Figure 2). In the last five years (2018–2022), usable data in the pool remained above 75%, with at least 40 CAAQM stations operating in the city.
Post-2018, a 10% dip in 2020’s PM2.5 concentrations (Table 3) when compared to 2019 is notable. This is due to a 25–45% drop in the monthly average concentrations between March and August of 2020 because of the strictest COVID-19 lockdown restrictions thus far [51]. On the evening of 24 March 2020, the Indian government announced a national lockdown in its fight against COVID-19. Phase 1 of the lockdown lasted for 21 days, Phase-2 for 19 days, Phase 3 for 14 days, and lastly Phase 4 for 14 days, ending on 31 May 2020. A similar lockdown was announced during the second wave of COVID-19 in 2021, during the months of April-June. These lockdowns came as an exogenous shock to human mobility and economic activities. Per the Google Mobility data, mobility fell up to 80% during the lockdown periods [52,53]. In addition to restrictions for personal and freight movement, a large portion of small- and medium-scale industry including markets was shut, most of the non-manufacturing workforce was moved to work from home, and all schools and universities operated remotely for a large portion of 2020 and 2021 [54]. Besides the reductions observed during the lockdowns in 2020, there is limited variation in the annual and seasonal trends between 2019 and 2022.

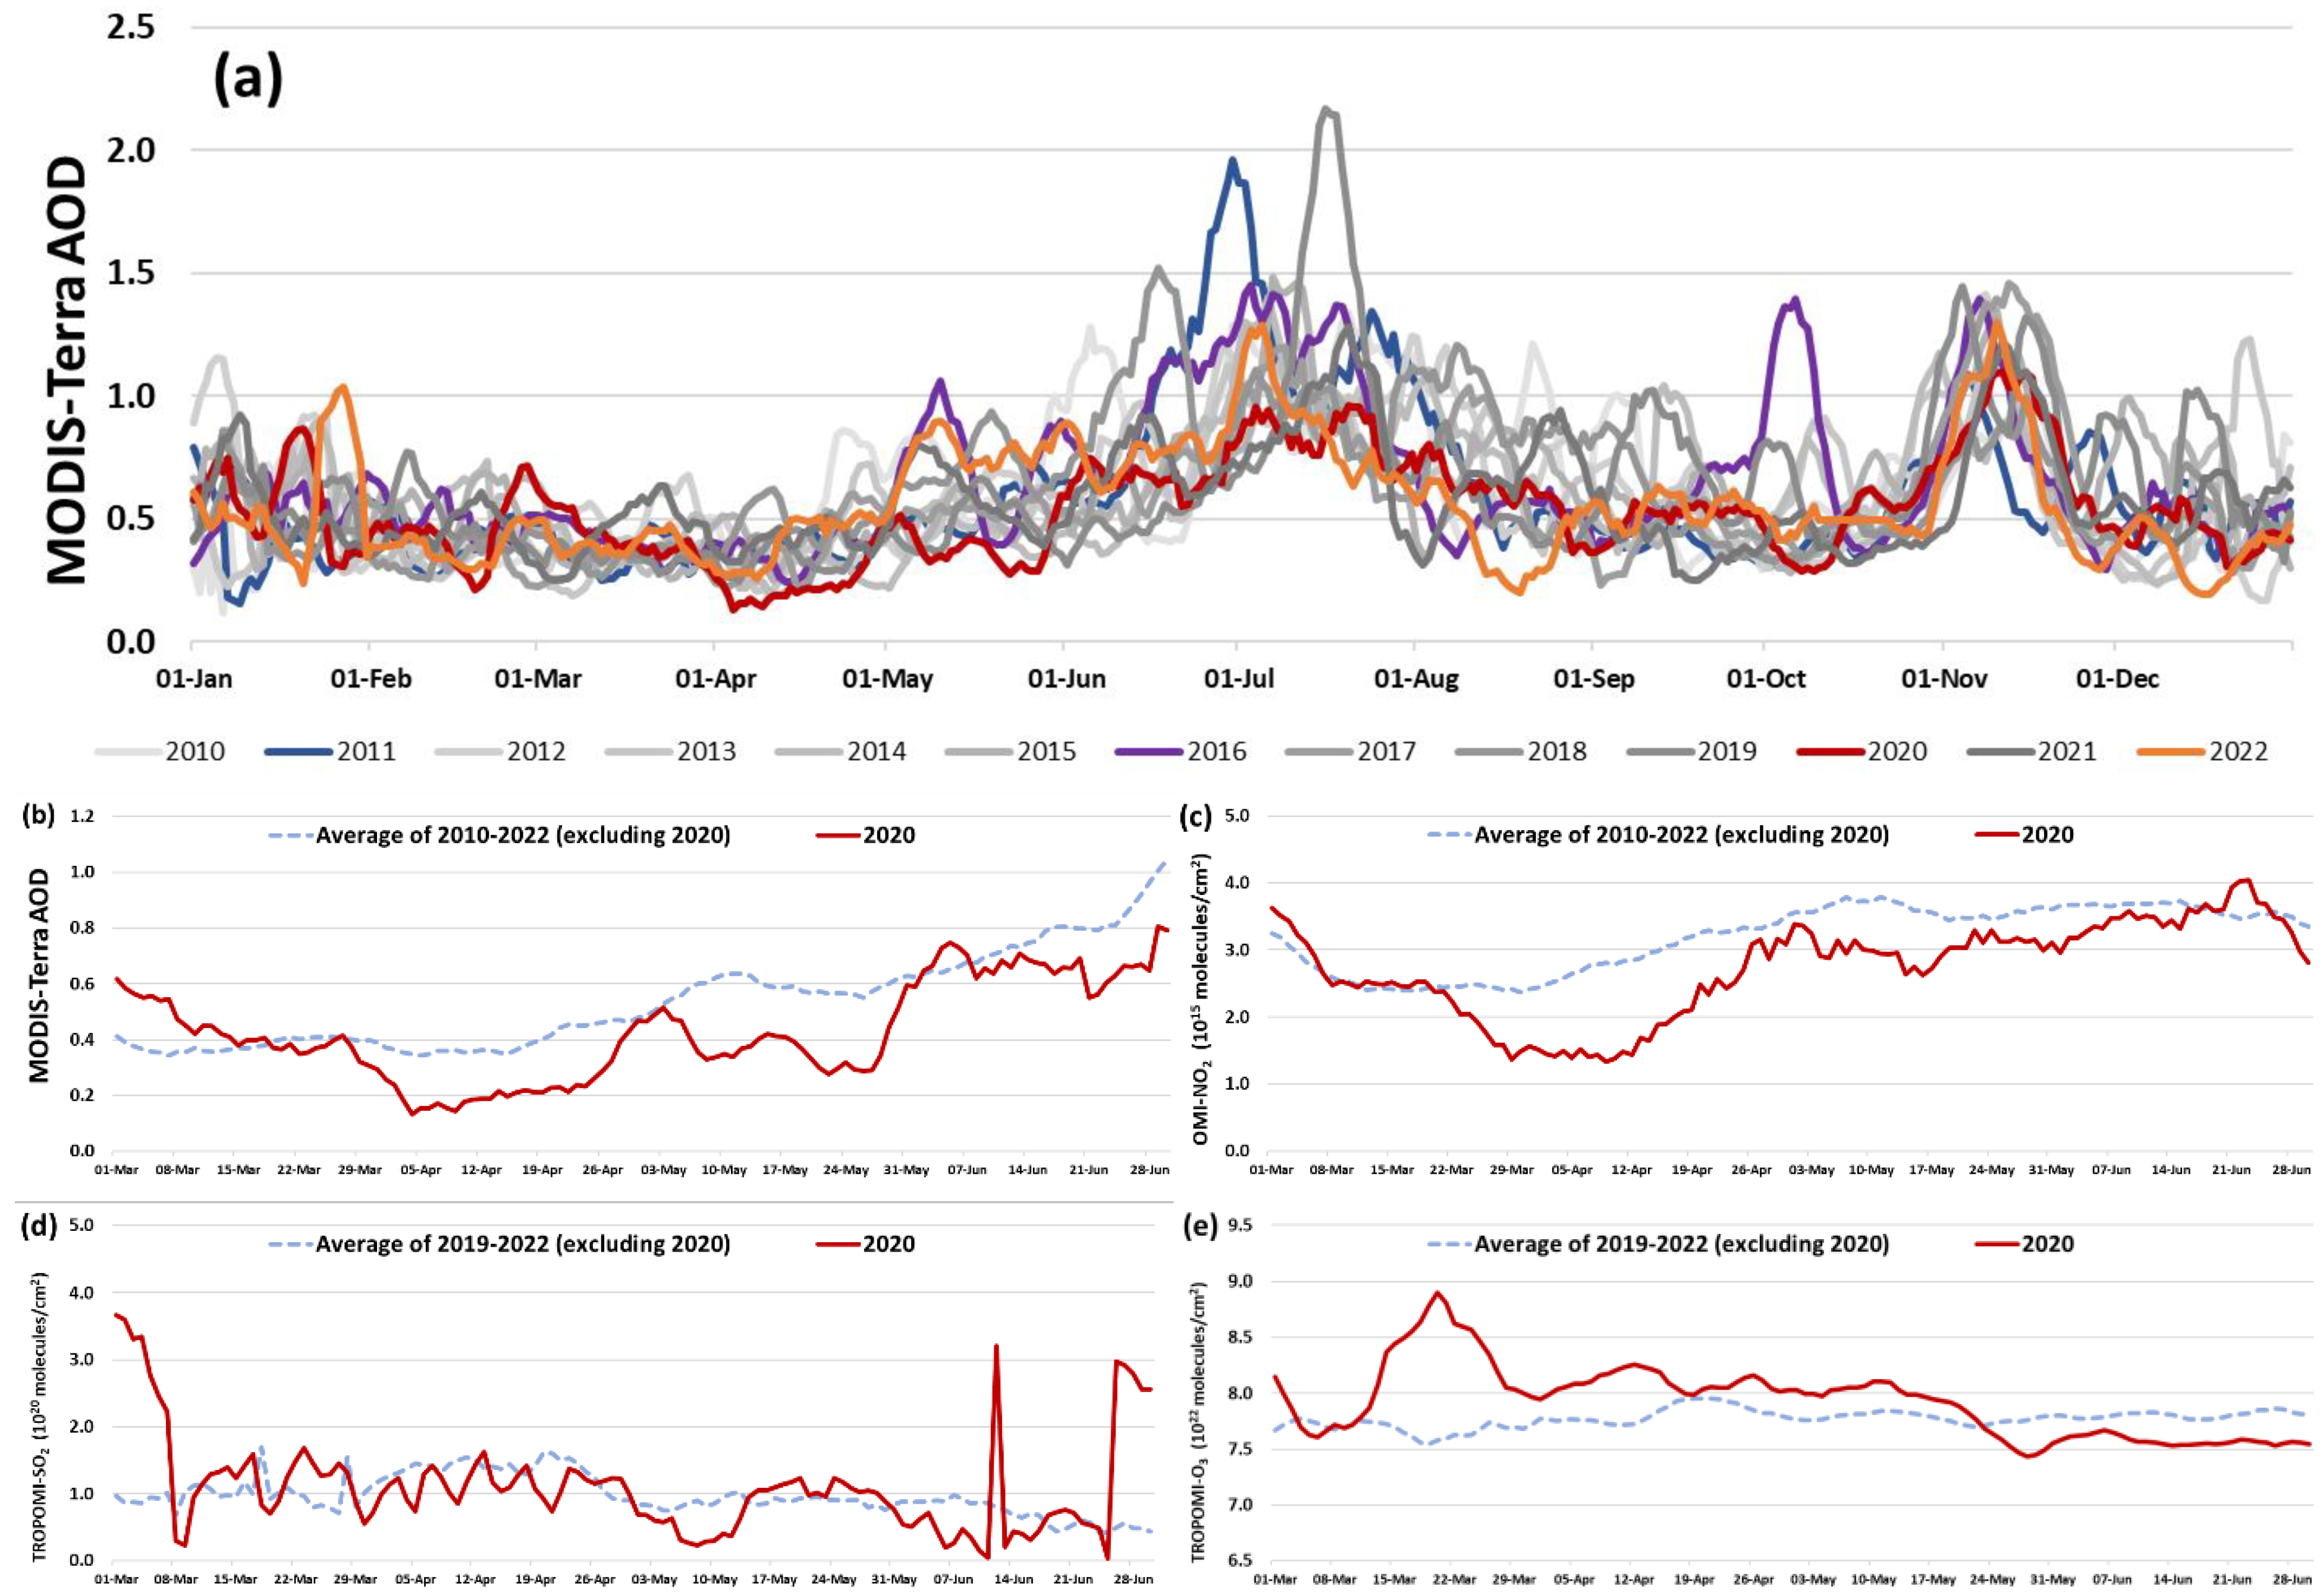
3.2. Satellite Observations and Reanalysis

Due to technical, personnel, and financial reasons, it is not feasible to cover all the parts of a city or a region with monitors [55]. As of December 2022, a total of 45 stations are operational in Delhi, which is a vast improvement compared to only 1 station during the period of 2006-09 period. Yet, large parts of the city are either underrepresented or not represented at all. Interpretation of satellite retrievals has started to fill this gap in understanding regional air quality trends [55,56,57,58]. These feeds are available for PM in the form of aerosol optical depth (AOD) and columnar density for SO2, NO2, ozone, HCHO, and CO gases from a cluster of satellites operated by NASA and ESA. Over India, there are currently no dedicated geostationary satellites observing atmospheric pollutants; all the information is only available as daily snapshots from other satellites [59]. GEMS from the Korean Space Agency is a new resource yet to be used for Indian applications [60]. While these observations are not a direct reflection of the on-ground activities, data can help understand regional pollution signatures and track sources. Applications of these retrievals of atmospheric composition range from calibrating local and regional emission inventories [61] to nudging global model simulations, building reanalysed historical concentrations [19,62], and supporting studies to estimate health impacts using reanalysed data [31,58].
For the NCT region, reanalysed PM2.5 fields for 1998 to 2021 combining results from the GEOS-chem chemical transport model, all-available satellite observations, and on-ground measurements are shown in Figure 3 in four time blocks [19,62]. Annual average maps for individual years are included in the Supplementary Materials. In India, as state-level averages, Delhi ranked the most polluted for the entire period [27]. The estimated domain average concentration for 1998–1999 was 81 μg/m3, for 2000–2009 102.3 μg/m3, for 2010–2019 119.7 μg/m3, and for 2020–2021 was 115.0 μg/m3. The general trend between 1998 and 2021 indicates deteriorating air quality, despite improvements from the introduction of better vehicle and fuel standards, the introduction of a 350 km metro system connecting all the satellite cities, the promotion of zig-zag technology for brick manufacturing, and increasing the number of customers for LPG. An illustration of AOD from the MODIS-Terra satellite for 2010–2022 is shown in Figure 4a. While AOD is a columnar representation, including regional influences, high pollution periods of wintertime heating in January-February, dust storms after spring months, and post-harvest agricultural residue burning in October-November are evident.
The dip in 2020 annual averages in the ground measurements and the reanalysed data fields (Figure 2, Figure 3 and Figure 4, and Table 3) reflect the impact of COVID-19 lockdowns [54]. Air quality improvements during the early days of the lockdowns were reported with pictures of clear blue skies in all the cities, good air quality index (green colour on India’s air quality index scale), and reports of seeing the range of Himalayas from areas 200 km away in Punjab. Figure 4b–d present a summary of the 8-day mean AOD and columnar density of NO2, SO2, and ozone as a domain average of multiple years excluding 2020 and independently for 2020 for four months between March and June. These observations represent a combination of local emissions at the lower altitudes and regional contributions from the tropopause to the upper troposphere.
In April and May months, the incidence of regional and transported dust storms is high, which can lead to an increase in the regional aerosol loading and, subsequently, gradual abundance in AOD. The sharp reduction in AOD for 2020 can be directly linked to the absence of combustion activities and road dust during the lockdown periods. A similar drop in the columnar NO2 density can be directly linked to the near-absence of traffic emissions, personal and freight, during the first two lockdown periods and partial personal traffic during the later periods. The differences are not as significant in the case of SO2 and ozone loading because of their emission source regions, sectors, and chemistry. A majority of the SO2 emissions in the NCR region and in India are linked to coal-fired thermal power plants and large point sources such as iron and steel industries and refineries [14,47,63]. With the introduction of BS6 fuel, sulphur content in urban vehicle exhaust is the lowest in two decades, and all the coal-fired power plants are located at least 100 km from the centre of the city airshed. While there was a drop in electricity generation rates at the beginning of the lockdown periods, most of the power plants were running at business-as-usual setting, resulting in limited changes in the background SO2 concentrations and the overall columnar density. The behaviour of ozone concentrations during and immediately after COVID–19 is still a topic of many on-going investigations [64,65]. One theory is that a drop in NOx emissions altered the local photochemistry to produce marginally more ozone during the lockdowns and subsequently settled back into the seasonal pattern. In practice, NOx–VOC-ozone chemistry is not simple, and the regime’s behaviour also depends on the mix of individual emissions such as anthropogenic vs. biogenic vs. biomass VOCs and their age mix. Science aside, an important lesson learned from the on-ground and satellite observations during the COVID–19 lockdown period is that the only path to better air quality is through reducing emissions from all known sources.

4. Receptor, Source, and Other Modelling Studies

4.1. Source Apportionment

Any amount of fuel or waste burnt is a source of emissions and will eventually be part of the air pollution problem. However, estimating the contribution of these sources to ambient pollution levels is the hardest result to pinpoint. Being a landlocked hub-city surrounded by multiple Tier-2 and Tier-3 cities, the sources are not always locally registered nor under Delhi’s own jurisdiction to control, for example, constant personal and commercial traffic to and from the city in vehicles not registered in Delhi and power plants outside the city limits within a radius of 100 km.
For source apportionment, Delhi is the most-studied city, having been studied with various techniques, and yet remains a city with no consensus on the contribution patterns [8,14,66,67,68]. Measurement-based studies are preferred for regulatory purposes [68,69], where filter samples are collected from various locations across the city and are subjected to chemical analysis for shares of ions, metals, and carbonaceous aerosols. Together with representative chemical profiles of all the known sources and using a receptor model, source contributions are statistically determined. A major limitation of this method is spatial coverage, which is limited only to the measurement locations. Despite the gaps and high financial cost, this top-down receptor modelling technique has been the most popular and more than 50% of the known studies in India were conducted in Delhi and IGP between 1990 and 2022 [8]. On the other hand, an emissions-based technique is a cost-effective way to fill the spatial and temporal gaps. The biggest advantage of this method is its ability to model a multi-pollutant environment at urban, regional, and global spatial scales and temporally at hourly, monthly, and annual scales to evaluate pollution trends, identify hotspots, differentiate between local and non-local sources, and support policy dialogue with what-if scenarios. The major limitations of this technique are access to a representative emissions inventory and high computational cost. Eventually, consolidating the results from both methods can identify any inconsistencies and thus lead to more reliable results.
Detailed reviews of receptor-model studies conducted across India were published by Pant and Harrison 2012, Banerjee et al., 2015, and Yadav et al., 2022 [8,67,68]. A similar review of emission-model studies is not available. Only the results from a selection of studies published between 1990 and 2022 are summarised in Table 4 to demonstrate the evolution of the range of source contributions and the methods employed at arrive these conclusions.
Irrespective of the techniques used, a summary of results points to sources burning coal, petrol, diesel, gas, biomass, and waste that support daily activities in the fields of personal transport, freight transport, electricity generation, industrial manufacturing, cooking, heating, construction, road dust resuspension, and waste burning. Delhi also experiences long-range transport of pollution from seasonal post-harvest field residue burnings and wind-blown dust lasting for a few weeks in a year [74]. A consolidated summary of the results from various source apportionment studies is presented in Table 5.
The contribution of various sectors to air pollution in the city has remained consistent over time. However, the estimated source contribution ranges may vary depending on factors such as where ambient filters were collected, how many filters were collected, and the size of the selected airshed for emissions. Emerging source apportionment techniques aim to evaluate these contributions in real time and bridge gaps from previous studies [21,74]. Ultimately, controlling emissions at their sources within the city and collaborating with neighbouring districts and states to do the same is necessary to effectively address air pollution.

4.2. Air Quality Forecasting and Alert Systems

The concept of air quality forecasting was first introduced in Delhi as part of the 2010 CWG and proposed as an activity for all the non-attainment cities under the National Clean Air Programme (NCAP) in 2019 [26,75]. Air quality forecasting is the prediction of future levels of air pollution for both long-term policy planning and short-term pollution alerts. These systems use meteorological and emissions data at the finest resolution possible in coded mathematical models to predict pollutant concentrations in the atmosphere, the levels of dry and wet deposition, and the range of chemical and physical transformations feasible for the given mix of emissions. The goal is to provide people with air quality information so they can take steps to protect their health. In this section, only the short-term (3 to 5 day) air quality forecasts programmed by various institutes using urban, regional, and global models are listed. Model results available in the public domain (in no order of preference) are.
  • The Copernicus Atmosphere Monitoring Service (CAMS) forecasting system is a service provided by the European Union (https://atmosphere.copernicus.eu/data, accessed 22 February 2023) that uses a combination of mathematical models and satellite data to provide air quality forecasts at 40 km spatial resolution globally and at 10–12 km spatial resolution for select regions. It is designed to provide reliable forecasts of air quality across Europe with the use of the ESA’s geostationary satellite data. The global data can be visualised at https://www.windy.com (accessed 22 February 2023). The CAMS reanalysis archives from 1990 are also available for studying long-term trends;
  • The Early Warning System (EWS) for Delhi by IITM is hosted at https://ews.tropmet.res.in (accessed 22 February 2023) and includes results from the WRF-Chem regional model and GEOS and WACCM global modelling systems as a combination of national, region, and cit- level hourly maps, time series, and comparison with data from the CPCB’s monitoring network. The system also includes the forecast of fog onset and visibility for Delhi and a summary of air quality forecasts for other cities;
  • The NASA-GEOS system is operated by the Global Modelling and Assimilation Office (GMAO) to support a wide range of applications, including air, weather, and climate modelling (https://gmao.gsfc.nasa.gov, accessed 22 February 2023). A 10-day air quality forecast for Delhi from the GEOS-5 model is included on the EWS portal. Like CAMS, the GEOS system also includes a data assimilation system (GEOS-DAS) with reanalysis archives from 1990 for studying long-term trends (like MERRA-2—https://giovanni.gsfc.nasa.gov/giovanni, accessed 22 February 2023);
  • SAFAR (https://safar.tropmet.res.in, accessed 22 February 2023) uses a combination of on-ground measurements, emission inventories, and mathematical models to predict air quality for the next three days. Since its inception for Delhi, the model has been replicated for the cities of Mumbai, Pune, and Ahmedabad;
  • SILAM (System for Integrated modeLing of Atmospheric composition) is a global chemical transport model developed and maintained by the Finnish Meteorological Institute (FMI). As part of a memorandum of understanding, FMI shares air quality forecasts customised for the NCR Delhi region with the Indian Meteorological Department (IMD). These results are also included on the EWS portal;
  • The Urban Emissions program (by the authors) uses the WRF-CAMx modelling system covering the Indian Subcontinent and Delhi’s airshed as a nest. The city results are shared at https://www.delhiairquality.info (accessed 22 February 2023) in the form of hourly and daily average maps, city-level hourly and daily average PM2.5 source apportionment, district-level concentration and source apportionment time series, and real-time (updated every 6 h) comparison of results with data from CPCB’s monitoring network.
Eventually, consolidation of results from various models, known as ensemble forecasting, can improve the overall accuracy of the predictions while leveraging the strengths of the models and compensating for their individual weaknesses.

5. Sectoral History

Delhi’s annual average concentration in 2021–22 was 100 μg/m3—20 times more than the WHO guideline of 5 μg/m3. This is an improvement compared to the limited information available for the pre-CNG-conversion era (~30%), immediately before and after 2010 CWG (~28%), and the mid-2010s (~20%). These improvements are a result of continuous technical and economic interventions interlaced with judicial engagement in various sectors. In this section, we review the interventions that demonstrated some noticeable drops in air pollution, some that caused notional changes, and some that caused none.

5.1. Transport Sector

Road transport is considered the most significant contributor to Delhi’s air pollution, despite being on par with other sectors such as residential cooking and heating, open waste burning, and industrial fuel combustion. With a large portion of the national vehicle fleet (8%) in a small area, traffic congestion and high exposure to pollution on roads are major issues [47,76,77]. Studies show that daily at least 55% of the population in Delhi is within 100 m of main roads and exposed to PM2.5 concentrations higher than average ambient concentrations.
There is a misconception that if Delhi’s traffic problem is solved, Delhi’s air quality will improve. This stems from the fact that major milestones in Delhi’s air quality history are marked with interventions in the transport sector (Figure 2 and Figure 3). While interventions are doing their job in reducing on-road emissions, the growing number of vehicles and their usage is nullifying any improvements coming from introducing better vehicle and fuel standards and any other interventions to curb traffic. The total registered vehicle fleet in the NCT increased five times between 1990 and 2018 from 2.8 million to 11.4 million [78] (Figure 5). The total fleet is expected to reach 13.0 million for the year ending in 2022. Overall, two-wheelers dominate the fleet, with 65% of registrations, followed by four-wheelers, which increased their share from 22% in 1993 to 28% in 2018. The reminder of the fleet is comprised of passenger taxis (three-wheeler and four-wheeler), buses (long-distance traveling outside Delhi and short distance intracity), and freight vehicles. Leading up to 2010 CWG, the overall bus fleet increased year-on-year until 2012; afterwards, new buses were introduced only to replace retiring buses. Due to a restriction on the number of three-wheeler licenses, their registrations remained consistent over the years. The largest jump in fleet size was observed for taxis, with the emergence of Ola and Uber services in 2010. These vehicle numbers do not include the daily transient fleet of personal and commercial vehicles from the neighbouring Tier-2 and Tier-3 cities, which on a weekday doubles the active number of on-road vehicles in Delhi.

5.1.1. Vehicle and Fuel Standards

Before 2020 (BS6), Delhi implemented vehicle and fuel standards four years before the rest of the country. BS standards were first introduced in 2000, with BS2 in 2001 in Delhi and 2005 nationwide, BS3 in 2005 in Delhi and 2010 nationwide, BS4 in 2010 in Delhi and 2017 nationwide, and BS6 nationwide in 2020. SO2 emissions improved significantly from 1% sulphur diesel under pre-BS standards in 1995 to 10 ppm sulphur diesel under BS6, and other pollutant standards improved by 90–95% with the introduction of diesel particle filters and selective catalytic converters under BS6. Most of Delhi’s fleet will be BS6 compliant by 2025–26 [47,79].

5.1.2. Pollution-Under-Check (PUC) Programme

Introduced in 2004, the PUC certification process has known gaps. The test neither includes exclusive measurements of PM2.5, SO2, and NO2 emissions nor records the odometer reading to build usage statistics. The failure rate for the diesel vehicle smoke test is under 2% and for the petrol vehicle CO test is under 5% [80]. While the test currently serves as a namesake control measure, its true potential for inspection and maintenance is yet to be fulfilled. As of 25 October 2022, vehicles in Delhi are not allowed fuel at stations if they do not display a valid PUC certificate on their dashboards.

5.1.3. Public Transportation and CNG Introduction

In 2021–2022, the Delhi Transport Corporation (DTC) operated fewer than 4000 buses on 450 routes, transporting 3.3 million commuters daily, which is about 40% of the passenger-km travelled in the city [81]. Over 80% of this fleet will officially retire in 2025. This is far from the ideal number of buses required for a city of nearly 20 million people. An ideal bus fleet for a city is 0.5 to 1.2 buses per 1000 people, which means Delhi’s requirement is 10,000 to 24,000 [82]. In 1997, a white paper on Delhi’s air quality recommended that the city needed to operate at least 15,000 buses by 2000 to meet the increasing demand [1]. Then, the fleet size was 2000, which was retrofitted from diesel to CNG; subsequently, all new vehicles were only CNG. In 2022, 150 electric buses were introduced into the DTC fleet, and this is expected to reach 1500 in the coming years [83].
The Supreme-Court-mandated diesel to CNG conversion process in 1998 took five years to implement, including the designing of conversion kits, training, replacement, CNG fuel stations, and preparation of standards for manufacturers to produce CNG vehicles [46]. Upon full conversion, more than 90% of PM2.5 and SO2 emissions were reduced from buses, autos, taxis, and some passenger vehicles [47]. Emissions also improved due to the introduction of new fuel standards between 2000 and 2005, which reduced sulphur content from 0.25% to 0.05% to 350 ppm in multiple stages. Based on limited ambient monitoring data, PM2.5 concentrations were reduced by 10–15% in 2001 compared to 1998 (Figure 2), but not all reduction can be linked to the conversion. The same period also witnessed the relocation of brick kilns and major industrial units from within Delhi’s administrative boundary to outside the borderline [4,44].

5.1.4. Bus Rapid Transit (BRT) System

The BRT system was piloted in Delhi on a small section of 6 km in 2008 as part of the preparations for the 2010 CWG. The corridor featured dedicated bus lanes in the middle of main roads, with covered stations and stops for passengers [84]. The pilot was designed using successful systems from around the world, such as (a) Curitiba, Brazil, considered the “father” of modern BRT systems; (b) Bogotá, Colombia, another successful system with over 120 km of dedicated bus lanes and a ridership of over 2 million passengers per day; and (c) Guangzhou, China, the longest system in the world, with over 400 km of dedicated bus lanes. These examples have different characteristics and challenges, but they all implemented successful strategies for BRT services such as dedicated lanes, efficient fare collection, frequent service, comfortable stations, and more [85,86].
The pilot was short-lived and faced criticism for several reasons that led to its failure, such as poor infrastructure design, confusion among drivers resulting in cars and motorcycles frequently entering the bus lanes, increased congestion during peak hours, and poor management of the BRT corridor, all of which led to lack of support from users [87]. The project also faced administrative delays and cost overruns, which further reduced public support. As a result, the corridor was dismantled in 2016.
Before the start of the 2010 CWG, to transport athletes, officials, and visitors, approximately 80 km of dedicated bus lanes were marked with paint and traffic barriers (orange cones) on several major roads in the city. The overall bus fleet was doubled with new buses equipped with GPS trackers and intelligent transport systems to track their movements. The goal was to give priority to buses, and additional traffic police were deployed to enforce compliance and ensure the smooth flow of buses. The dedicated bus lanes helped reduce travel times for athletes and officials, and the presence of additional enforcement also helped ease traffic congestion on the roads for general traffic along the non-dedicated corridors. While the additional buses were made part of the DTC fleet, the dedicated bus lanes were only in operation for the duration of the Games and were dismantled immediately after. This experience shows that with dedicated enforcement and community support, permanent BRT lanes can be carved out of the existing transport network with little change in design [88].

5.1.5. Metrorail System

Delhi’s Metrorail system serving 286 stations expanded its operations over multiple phases and now covers 390 km across the NCT and its neighbouring cities (Figure 1b). The first corridor began operations in 2002 and Phase 1 and 2 started operating in 2011, covering 190 km. In 2022, ridership was at 85% of the 2019 (pre-COVID) peak, at 6.0 million per day.
An access–egress survey of metro riders found that up to 25% of trips are supported by para-transit vehicles, such as auto-rickshaws, creating mini-hubs near the stations [89]. Most of these trips are within a 3 km radius of the stations, and some are battery-operated. More than 50–60% of access–egress trips are non-motorised, such as walking and cycle-rickshaws. The metro was designed to ease traffic load and congestion on the roads, with users from motorcycles and cars shifting to this mode. However, with a large portion of riders reporting as users of walking, cycling, and bus modes, those gains were never immediately visualised, and the roads continue to be congested during peak hours. More than 50% of riders own either a two-wheeler or a car, and 13% of access–egress trips used personal transport. Localised feeder systems have grown organically to support last-mile connectivity, catering to residents within a 2–3 km radius. During peak hours, while there is some congestion outside the stations due to pick-up and drop-off of passengers, some stations have taken measures to distribute these loads to multiple gates.
The satellite cities of Gurugram a”d NO’DA are benefiting from the expansion of the metro rail system, which is promoting connectivity, easing congestion along the main corridors, and providing more mobility options. Gurugram also operates a 12 km rapid metro rail system, which serves as a feeder system to Delhi’s larger system. This system began operations in 2013 and became fully operational in 2017 and is expected to serve 100,000 passengers per day.

5.1.6. Para-Transit System

The Delhi taxi system includes both three-wheelers (auto-rickshaws) and four-wheelers. After 2000, all auto-rickshaws were required to use CNG, and by 2010, all four-wheeler taxis were also required to operate on CNG. Additionally, all radio and app-based taxi services are required to operate on CNG or electricity [90]. The introduction of app-based services such as Ola and Uber in 2011–2012 led to a significant increase in the taxi fleet size (Figure 5), as they are considered a more convenient option for riders, as they can track the driver’s location and estimated time of arrival and allow cashless payments, compared to the hassles of haggling and over-charging from 3Ws and traditional black-n-yellow taxis. The total ride-hailing fleet in NCR Delhi is between 80,000 to 100,000. While some studies have shown that app-based services reduced on-road congestion, others have suggested that they led to an increase in motorised transport and overall vehicle km travelled, which means more emissions and pollution [91].

5.1.7. Odd–Even Experiment

Delhi’s government attempted the odd–even experiment three times, with limited success in improving air quality. The first attempt in January 2016 saw some improvement, but the second and third attempts in April 2016 and November 2019 had no noticeable difference [92]. The rule restricted vehicles with registration numbers ending in odd numbers on odd days and even numbers on even days, but it was unsuccessful due to multiple exceptions and a lack of alternatives for commuters [93]. Without exceptions, the DTC was required to operate at least 13,000 buses to support a 50% cut in personal vehicle usage, but it operated less than 5000 buses during the first attempt (calculations are included in the Supplementary Materials). The exceptions included all motorcycles, cars with women drivers or with kids, cars operating on CNG, and cars with the special service tag. This meant approximately 70% of daytime cars were exempted. Anecdotally, use of four-wheeler taxis and three-wheelers operating on CNG increased, along with the use of motorcycles. What was gained by reducing the number of vehicles on the roads was wiped out by additional usage of other vehicles. In January 2016, [92] suggested that while some improvement in PM2.5 concentrations was recorded during the daytime, an equivalent increase was recorded during the nighttime, implying a shift in the time of use of the vehicle, instead of full avoidance of usage as anticipated. The same ambient concentrations as daily averages demonstrated limited benefits.
In the second and third attempts, the bus fleet was not increased as it was in the first attempt. Dust and fire events in the region made it difficult to record any benefits of the program during these periods. A similar program was implemented in Mexico City in 1989 and resulted in an increase in the number of vehicles on the road, bypassing the numbering system [94]. High silt loading on Delhi’s roads is a result of ongoing construction activities and tyre wear and tear. As road dust resuspension is linked to vehicle speeds, during the odd–even period, higher speeds also undermined some of the benefits of reduced vehicle use.

5.1.8. Electric Vehicle (EV) Promotion

To encourage the adoption of electric vehicles in Delhi, the government implemented the Delhi Electric Vehicles Policy in 2020, offering various financial incentives such as exemptions from road tax and reductions in registration fees, as well as plans for scrapping old vehicles, subsidies on loans, and discounts at charging stations [95]. The main goal of the policy was to accelerate the adoption of electric vehicles in two-wheelers, public/shared transport vehicles, and goods carriers. The target was to have 25% of new vehicle registrations be battery electric vehicles (BEVs) by 2024, which is approximately 500,000 across all vehicle segments in the city. These vehicles will collectively reduce on-road PM2.5 emissions and CO2 emissions over their lifetime compared to an equal-sized fleet running on petrol, diesel, and gas. These savings are equivalent to eliminating the lifetime CO2 emissions from nearly 100,000 gasoline cars [96].
According to the Delhi Dialogue Commission (DDC), BEV registrations are averaging 10% of total registrations, making it a leader among India’s other metropolitan cities. As of July 2022, Delhi has an on-road EV fleet of 160,000 and an EV-to-public-charger ratio of 25:1, which is comparable to ratios in cities such as Oslo and Helsinki. A Charging Action Plan was also released, which includes plans to install 18,000 public and semi-public EV charging points to achieve a ratio of 15:1 by 2024. The plan also includes the establishment of battery recycling centres and skill centres to train people in jobs related to the EV ecosystem [95].

5.1.9. New Expressways

The Eastern and Western Peripheral Expressways encircling Delhi (Figure 1) were designed to divert non-destined traffic away from Delhi, reducing pollution and traffic congestion in the city. The Eastern Expressway, also known as the Kundli-Ghaziabad-Palwal Expressway and the Western Expressway, also known as the Kundli-Manesar-Palwal expressway, are both 135 km long. According to the results of surveys conducted by IIT-Delhi and the Centre for Science and Environment, prior to 2015, approximately 130,000 heavy-duty vehicles (HDVs) entered Delhi every day and more than 50% of the traffic only passed through the city [97]. The share of traffic emissions in Delhi from passing HDVs is between 30–50% in various parts of the city [47], and diverting this traffic away from the urban parts has significant benefits to health in terms of exposure.

5.2. Agricultural Waste Burning

After the transport sector, the source with the most media coverage is the open burning of agricultural waste in October and November to prepare fields for the winter crop in the states of Punjab and Haryana [12,13]. Due to time constraints and the lack of an affordable and wide-scale residue management system, farmers consider burning the residue a faster and cheaper way than tilling and inundating the fields to mulch the waste naturally over weeks [98,99]. Field residue burning is also prevalent during the months of April and May, although lesser in frequency, but the pre-winter burning emissions have a higher impact on the regional and urban air quality due to slow-moving winds, lower inversion heights, and lower surface temperatures, all conducive to manifesting severe to hazardous levels of air pollution.
Several satellite feeds (https://worldview.earthdata.nasa.gov, accessed 22 February 2023) are available to track and model these fires to predict the onset and propagation of fire emissions [100,101,102,103]. The prediction for 2022 prediction ranks as the fifth most active fire season after 2012, 2016, 2020, and 2021 (Figure 6). Such a prediction model is based on a long-term (2002–2016), robust relationship between satellite measurements of vegetation index (NDVI), a proxy for crop amounts and proportionate generation of residue, and post-harvest fires, a precursor of air pollution events. The NDVI-fires relationship opens the possibility of predicting seasonal fire activities in advance by looking at the regional mean NDVI values prior to the onset of the burning season. The revised prediction model predicts fire statistics for the years 2017–2021 with more than 90% accuracy (or less than 10% error) [104]. The prediction of the totality of seasonal fires can be useful to gauge the overall spatial–temporal variations in PM2.5 and aerosol loading in the downwind region (including Delhi) in the regional models for the short-term to even seasonal forecast. Long-range transport of these emissions is a known source of PM2.5 peaks over Delhi, contributing to up to 50% of the daily averages during the pre-winter season [9,105,106]. While this phenomenon lasts only for 2–3 weeks and on an annual basis contributes to less than 3% of Delhi’s averages, the extreme nature of its impacts on health and local economics has lasting effects [27,34,107].
To improve air quality and protect the health of millions, there is an urgent need to implement a cost-effective and farmer-friendly crop residue management system to replace the harmful practice of stubble burning. In the states of Punjab, Haryana, and Uttar Pradesh, two strategies have been employed to reduce stubble burning: ex situ and in situ methods. Since 2018–19, the Union Ministry of Agriculture and Farmers’ Welfare has provided financial assistance and subsidies to farmers’ collectives and cooperative societies to tackle this problem. The funds have primarily been used to subsidise the purchase of stubble management equipment such as happy-seeders, combine harvesters, rotavators, and super-straw management systems. As of March 2021, approximately INR 24,400,000,000 (USD 298,000,000) has been spent on subsidising and distributing this equipment. Additionally, other initiatives such as the development of units to convert stubble into biomass briquettes or pellets for co-firing in boilers have received a subsidy of INR 6,910,000,000 (USD 84,000,000) [108,109]. While the core issue traces its roots back to the green revolution and the dominant cultivation of rice and wheat in the water-depleting regions of Punjab and Haryana, the solutions have largely been focused on the immediate practice of stubble burning rather than the root cause [110].

5.3. Residential Emissions

Residential sector emissions in Delhi and in India are a combination of cooking, heating, and lighting emissions. Together, this sector contributes to more than 30% of the estimated premature deaths in India due to outdoor PM2.5 concentrations [10,111] and contributes to 15–20% of the estimated annual PM2.5 concentrations in Delhi. This contribution is higher during the winter months due to heating emissions and disadvantageous meteorology [14,18,66].
According to the 2011 census (last available update) [112], in the urban parts of the districts, 80–85% of the registered households are predominantly using LPG or electricity for cooking. These districts include nine from Delhi; Faridabad, Gurugram, and Rohtak from Haryana; and Noida and Ghaziabad from Uttar Pradesh. In the rural parts of the districts, 63% in Delhi, 30% in Haryana, and 19% in Uttar Pradesh predominantly use LPG and electricity for cooking. Other traditional fuels include coal, crop residue, wood, cow-dung, and others. Collectively, in these 12 districts, 75% of the households are listed as urban dwellers.
In 2016, the Ministry of Petroleum and Natural Gas (MoPNG) launched the Ujjwala program to provide LPG connections to women from economically and socially disadvantaged households across India. At the end of 2022, a total of 110 million new connections were made, which included a subsidy to cover the cost of a stove and the first cylinder. The goal of the program is to increase the use of clean cooking fuel, reduce indoor and outdoor air pollution, and improve health [113,114]. While the share of LPG usage in the 2011 census was already the highest in Delhi compared to the other states, the Ujjwala scheme added another 150,000 consumers to the pool (as of November 2022). Another 100,000 and 350,000 consumers were added in the neighbouring Haryana and Uttar Pradesh districts, further reducing the overall load of cooking emissions on ambient air quality.
At the beginning of the Ujjwala program, the Government also launched the “Give It Up” campaign—a voluntary scheme for individuals who can afford LPG connections without subsidy so that the government can use the funds to provide LPG connections to families living below the poverty line [115]. Approximately 17 million consumers volunteered. However, in January 2021, the government revoked all subsidies on LPG for domestic consumers in a move to reduce the fiscal deficit and align domestic LPG prices with international prices. The lack of subsidies has raised concerns for the continued usage of LPG and an increase in risk for rural households shifting to low-cost traditional fuels [113,116]. As of December 2022, a partial subsidy of INR 200 is available only for Ujjwala beneficiaries for 12 cylinders/year. While the loss of subsidy is not an issue for rich Delhi districts, this could have an impact of the emission loads in the neighbouring districts.
Winter months in Delhi (November to February) are marked by low ground-level temperatures (under 15 °C) (Table 2), prompting the burning of coal, wood, and in some instances waste for warmth. During this time, the average minimum temperature typically ranges from 5–10 °C on the coldest nights, with occasional frost and fog. While most of the permanent and large building neighbourhoods use cleaner options such as electric and water heaters, a large portion of the neighbourhoods still relies on conventional fuels for heating. During some winter days, the contribution of space heating emissions to ambient PM2.5 levels is as high as 50%, due to two factors: (a) an increase in overall emissions and (b) low wind speeds and mixing heights, further enhancing the pollution loads, on average 8–20 times worse than the summer months [36,117]. Several vulnerable groups were identified: street vendors; rickshaw pullers; construction workers; homeless people; people living in the slums, rural areas, and informal settlements with inadequate housing insulation; and people with pre-existing chronic health conditions such as asthma and heart disease [10]. Every winter, the government and the Residential Welfare Associations run blanket and warm clothing drives and operate warm shelters for outdoor workers to minimise exposure to cold temperatures and high pollution levels.

5.4. Waste Management

As of March 2022, Delhi operates three landfills—Ghazipur (70 acres), Bhalaswa (36 acres), and Okhla (46 acres), with a combined processing capacity of 7000 tons a day [118]. According to [1], four landfills were operational during 1996–97 with a combined processing capacity of 5000 tons a day, and 14 smaller landfill sites were already full and closed. As of July 2019, there were 2.8 billion tons of legacy waste at the three landfills, which was reduced to 2.0 billion tons in 2020. These landfills are sometimes referred to as mountains, with the potential threat of spontaneous fires.
Urban solid waste is normally a mixed waste comprising household, plastic, commercial, toxic, and hospital wastes. The five municipal corporations (MC) in Delhi entrusted to manage waste are (1) North Delhi (NDMC), (2) South Delhi (SDMC), (3) East Delhi (EDMC), (4) New Delhi (NDMC), and the (5) Delhi Cantonment Board (DCB). While MCs are responsible for managing solid waste, there is a wide range of stakeholders involved: households, rag pickers, recyclers, waste dealers, etc. MCs are responsible for setting up infrastructure for the segregation, collection, storage, transportation, processing, and disposal of solid waste, either on their own or by engaging private agencies. They are also responsible for ensuring that recyclable waste gets recycled, open burning of waste does not take place, and no damage is caused to the environment in the process. As of March 2022, only NDMC and SDMC have a solid waste management plan for reducing the processing load and managing the legacy waste. The overall waste segregation rate in Delhi is 32% and only 48% (~5300 tons/day) of the waste collected is processed and safely disposed of. NDMC processes and segregates 100% of the waste collected. Assuming a per capita waste generation rate of 0.7 kg per day, approximately 20 million Delhi inhabitants can produce 14,000 tons per day, and the official waste generation rate is 11,000 tons/day. Subtracting the landfill processing capacity means approximately 6000 to 9000 tons/day of the total waste generated is left for composting and/or open burning. Open waste burning in residential areas, waste collection centres, and at the landfills is an uncertain source of emissions [103,119]. Source apportionment studies suggest that waste burning can account for up to 5–15% of ambient PM2.5 concentrations across Delhi [5,66].
Various types of MSW processing facilities are available: material recovery, waste to energy (WTE), recycling, composting, bio-methanation, and refuse-derived fuel. Currently, 4550 tons/day of the 5300 tons/day of waste processed is at the WTE plants and this method is being pursued as a primary technology for waste management by all the municipalities. Two new plants are expected to be operational in 2023 with a combined WTE capacity of 8050 tons/day. However, [120] identified various socio-economic and environmental concerns with this singular focus on WTE plants, such as (a) the impact on the livelihood of informal rag-pickers since all the recyclables would be diverted to the plants. Approximately 300,000 informal waste workers’ livelihoods would be at threat with the addition of two new plants. Additionally, (b) waste incineration leads to emissions of dioxins and furans, causing health problems in the neighbouring areas.

5.5. Construction Sector

In Delhi, construction of residential and commercial buildings, roads, flyovers, and subways for metro rail system are common sights. Emission sources associated with the sector are dust particles generated during construction activities such as drilling, sawing, mixing, and demolishing; movement and management of the construction and demolition (C&D) waste; hot mixing units; and brick kilns.
In Delhi, approximately 3500 tons of C&D waste was generated per day in 2021–22 [121]. In addition to solid waste management, the five MCs are responsible for the managing of C&D waste at 257 designated sites across the city. On average, only 1770 tons/day (51%) of the collected waste is processed per day, while the processing capacity at the plants is 5150 tons/day. The processed waste is used to make paver blocks, kerb stones, concrete bricks, and other aggregates, as well as granular sub-base, sand, and soil, which are used in infrastructure projects as directed by the Department of Urban Development to minimise the use of traditional natural resources and increase the use of recycled products. These recycling rules include (a) a minimum of 2% of C&D products in all building works, (b) a minimum of 10% of C&D products in all road works and (c) a minimum of 5% of C&D products for non-structural applications, including private entities.
Fugitive dust from the construction sites is also a concern during the days with winds above threshold speeds and forms a large portion of the coarse fraction of PM. Whenever GRAP is in effect for PM10 in poor conditions, the Commissioner or officers in charge of police departments can enforce rules for dust control and close all non-compliant sites. For very poor, severe, or emergency PM10 conditions, DPCC and MCs can stop all construction activities [122]. While GRAP has been operational since 2016, there is limited information on the impact of passing these rules whenever the poor-to-emergency conditions are triggered, with the limited overseeing capabilities of the DPCC, MCs, and police departments.
The brick manufacturing industry in NCR uses fixed chimney brick kiln technology (FCBKT), which is more energy-efficient than traditional clamp-style kilns (where sundried bricks are stacked with fuel such as coal dust and biomass and burnt continuously for 10–15 days). In FCBKT, a chimney in the middle of the kiln allows for the flue gas to circulate within the kiln and escape from a single outlet. In 2006–08, there were 937 marked brick kilns in Delhi’s airshed, covering an area of 80 km × 80 km (Figure 7). In 2021, the number dropped to 751 due to either closures or relocation to farther districts. There are no brick kilns within Delhi’s administrative boundary limits. All kilns within the limits were either relocated or closed following the Supreme Court order in the 1990s [44,46]. Some of the kilns also closed due to proximity to growing residential hubs in NOIDA, Ghaziabad, and Rohtak.
A typical kiln can produce up to 20,000 bricks a day and most of the production in IGP occurs only during the non-monsoonal months of October to March. These months are also marked with the highest levels of air pollution in Delhi (Table 2). In 2010–11, the brick industry produced up to 16 million bricks a day [14]. Fuel used for baking the sundried bricks includes coal dust, wood, and agricultural waste, and in some cases old shredded tyres (Figure 7c). For those relocating or refurbishing kilns, the NCR officials and private groups encouraged brick kiln owners and facilitated conversion of FCBKT kilns to use zigzag technology, which emits 30–40% lower emissions per kg of baked brick [123,124]. Here the bricks are loaded in a zigzag pattern, with minimal changes to the structure of the kiln or the chimney.

5.6. Road Dust

Roads in Delhi are covered with a mix of natural dust and tyre wear and tear. With the constant movement of vehicles, the potential for dust resuspension is high. On average, 10–20% of the PM2.5 and 30–50% of the PM10 fractions are constituted of dust [8,14,125,126]. While the fraction of paved roads has increased in Delhi, leading to lesser natural dust on the roads for resuspension, a constant increase in the number of vehicles and vehicle km travelled means that the overall shares of road dust have remained constant over the years (Table 4). Several measures were proposed and implemented to control road dust in Delhi, such as (a) regular manual sweeping and the use of mechanical sweepers with water sprinklers to suppress resuspension for some hours. While wetting is an effective method, this also requires a lot of water, often sourced from the waste water treatment plants; (b) paving of roads with asphalt or concrete to reduce dust loading on the roads, often as part of managing C&D waste; (c) planting vegetation along the sides of roads to reduce exposure to dust by providing a barrier between the road and the surrounding area and to provide additional leaf surface for dry deposition. Some proposals have included green roofs and vertical farming on the building; (d) restricting the movement of heavy-duty vehicles during peak hours. Since dust resuspension is a function of vehicle speeds and vehicle weights, reducing the presence of heavy-duty vehicles during peak hours has a direct impact on resuspension rates. In Delhi, big trucks are not allowed to enter or conduct operations between 6 am and 9 pm; and (e) use of dust suppressants at construction sites to reduce wind erosion and kerbside dust loading.

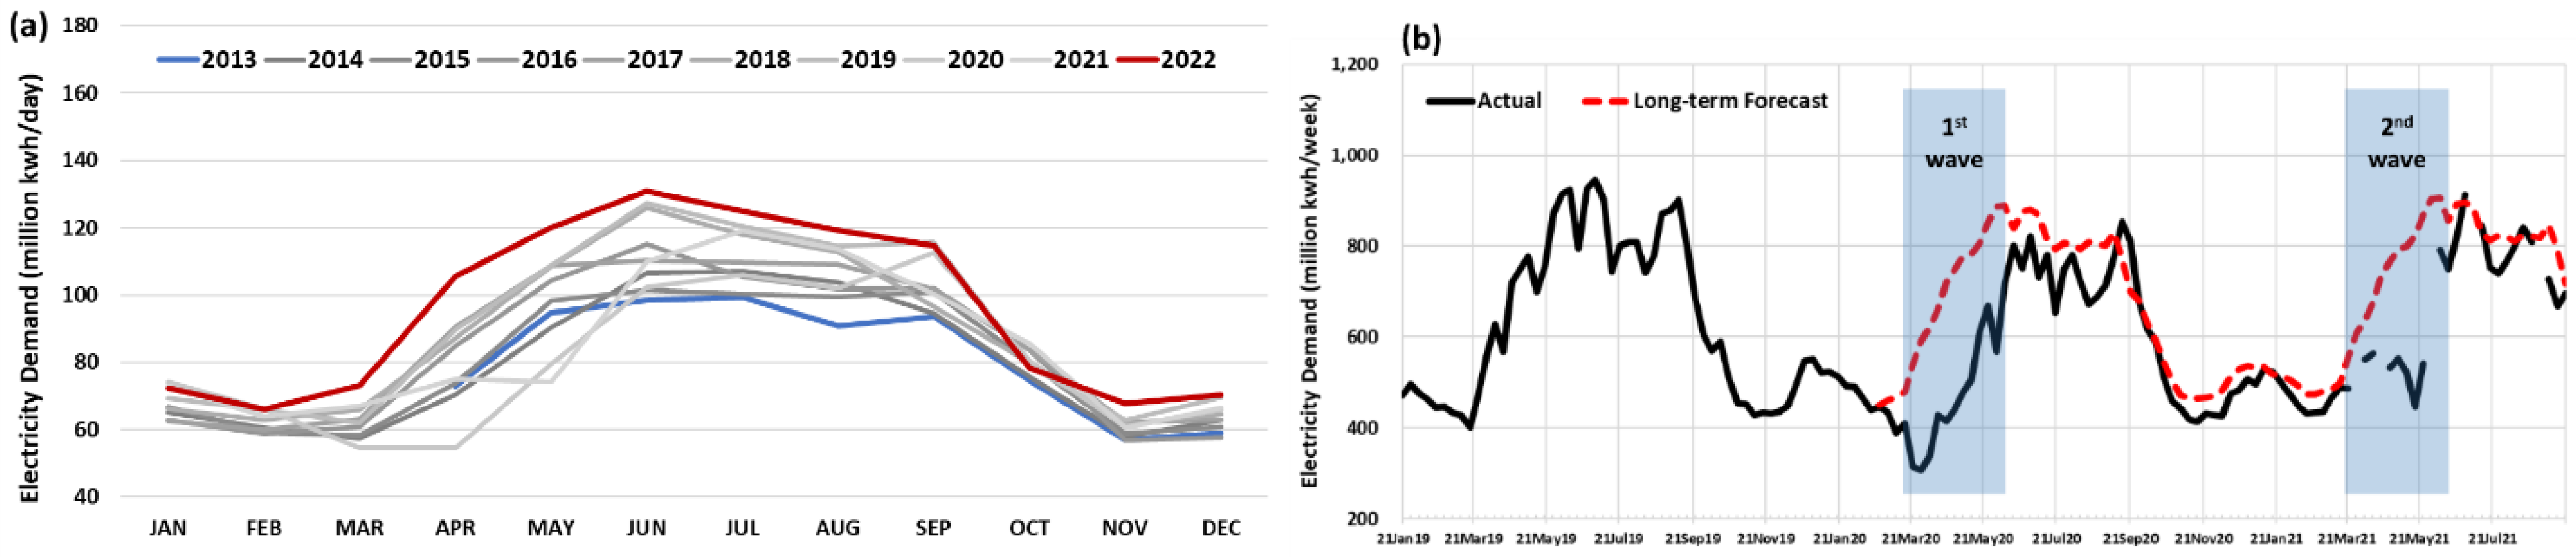
5.7. Electricity Consumption and Load Sharing

Load sharing in Delhi is different from other states. While other states have power deficits, Delhi has tied up surplus power to cater to the increasing demand and peak load and has dropped the need for diesel generator sets, with load shedding at under 0.02% [127]. Delhi’s residential consumers also benefit from subsidies such as free 200 units per month, discounted pricing for consumption between 200 to 400 units per month, 100% rebate for special groups, and the lowest fixed tariffs in the country. Between 2013 and 2022, average demand per day has increased (Figure 8), with peaks during the summer months of May to Aug. These months are hot and dry, pushing the need for constant air conditioning. In 10 years, the highest net increases in the average demand are 45% in April and 32% in June. Delhi’s annual demand in 2021–22 was 33,300 million units.
A summary of the installed generation capacity (in MW), annual generation (in million kwh), and annual plant load factor for all the power plants in the immediate vicinity of Delhi is presented in Table 6. The installed generation capacity in Delhi is 1792 MW, supported by three gas units (90 MW) operated by the Indraprastha Power Generation Company and nine gas units (1702 MW) operated by the Pragati Power Generation Company. However, local generation only supports 15% of the demand, and the remaining 85% is purchased from neighbouring states. In 2011, these distributions were 23% and 77%. Between 2015 and 2022, three old power plants closed operations—Rajghat, Badarpur, and Faridabad—as part of the drive to reduce the impact of local power plants on Delhi’s air quality, and the two operational plants are underutilised, at PLFs between 20 and 50%. The overall impact of the local and regional power plants on Delhi’s air quality is estimated at 5–7% of annual average PM2.5 concentrations [63,128]. A large portion of this is in the secondary form of sulphates from the chemical conversion of SO2 emissions during the advection of gas from the source region to the city limits. While the new emissions norms were in place for flue gas desulphurization in December 2015, the implementation has been delayed multiple times and only a fraction of the power plants in India have even prepared plans to implement.
COVID-19 lockdowns also had an impact on the overall electricity demand in Delhi, with the largest drops coming from the commercial and industrial estates. A summary of the weekly demand between 2019 and 2021 is included in Figure 8, including a forecast line to illustrate the drop in demand during the two waves. The maximum drop in the estimated demand was 48% during the first wave and 45% during the second wave.

5.8. Diwali Firecrackers

The Diwali festival, highlighted with fireworks, falls in the month of October or November (based on India’s lunar calendar) and is one the extreme events when air quality levels go past the emergency scale for at least three nights—the day before, the day of, and the day after Diwali. At some hotspots across most Indian cities, hourly averages can peak at 1000 to 3000 μg/m3. The mix of pollutants includes copious amounts of heavy metals and gases from bursting tons of firecrackers in a short span of 3–6 h [11]. Between 2016 and 2022, the Supreme Court intervened with on-and-off bans on the sale of firecrackers in Delhi (but not in the whole of the NCR). However, the effect on the overall median and peak concentrations was limited. Figure 9 summarises all-station hourly average PM2.5 concentrations as ranges for two days (the day of and the day after Diwali). The peaks correspond to the hours of firecracker burning on Diwali night, overlapping the two days. While these peaks occur only for a few hours and for 2–3 days, the total load of emissions and severity of the concentrations is very high compared to any of the remaining days of the year, resulting in a large number of acute exposure incidents of respiratory cases [129]. An important outcome of a series of public interest litigations (detailed in the following section) is the information on firecracker sales in Delhi. According to the papers filed on behalf of firecrackers manufacturers, distributors, and sellers, in response to the ban in 2016, total firecracker sales in Delhi was five million kilos—approximately 30% of their national sales, shared by 1.6% of the national population living in an area of 0.05% of the national landmass.
Between 2015 and 2022, the peaks and the averages of 2022 are the lowest recorded. A blanket ban on the bursting of firecrackers was issued in 2022. However, multiple non-compliant reports were registered across the city. Despite this, the pollution levels were low for two reasons: (a) advantageous meteorological conditions on the night of Diwali and the day after Diwali (Figure 9b), and (b) 2022’s Diwali day was at least a week ahead of the post-harvest fires in Punjab and Haryana. The ventilation rates during this period were at least double compared to previous years, halving the net concentrations. While there is more awareness of the health impacts of firecracker emissions and the extreme nature of the pollution on Diwali day, with no clear path ahead, this event is expected to repeat in the following years, with the only course of action coming from nature.

6. Judicial and Institutional Engagement

6.1. Role of the Judicial System

The Supreme Court of India, propelled primarily by public interest litigations (PIL) filed by concerned citizens, has intervened on multiple occasions to either introduce an intervention for the first time or fast track existing interventions for immediate action to support Delhi’s air quality management. Its actions, while encroaching on the turf of an elected executive and the Parliament, can be seen as a reaction to the two latter institutions being largely apathetic to Delhi’s deteriorating air quality [130]. The interpretation of the Supreme Court in a separate case (M. C. Mehta vs. Union of India, 1986) also provided the legal basis for the court to intercede in matters of air quality by recognising the right to clean air under article 21 of the Indian constitution. Several landmark judgements have brought notable changes to the regulatory framework of Delhi’s air quality and led to the introduction of sweeping policy interventions. At the same time, the wide berth occupied by the Court has also led to the promotion of ad hoc and unscientific interventions. Some milestones are highlighted in this section.

6.1.1. Environment Pollution (Prevention and Control) Authority (EPCA)

In 1998, following the Supreme Court’s orders, the Union Government constituted the EPCA as a statutory body under the Environment Protection Act (1986), with the objective of protecting the environment and controlling pollution in Delhi (and the surrounding states of Haryana, Uttar Pradesh, and Rajasthan) and providing guidance to the Court on the matter (https://epca.org.in, accessed 22 February 2023). EPCA, however, chose not to utilise the full extent of its legal authority, largely restricting itself to submitting monitoring reports to the Supreme Court and progress reports to the Union Government. While some actions taken by the Supreme Court (highlighted in the following sections) are a result of EPCA’s contributions to the Court, independent experts note that EPCA effectively failed to perform in its role as a quasi-judicial authority, leading up to its replacement with the new Commission in 2020 [131].

6.1.2. Diesel to CNG Conversion

Started with the PIL filed by environmental lawyer M. C. Mehta in 1998, the Supreme Court ruled on the immediate conversion of public transport buses and para-transit vehicles from diesel to CNG [46]. Upon complete conversion, more than 90% of PM2.5 and SO2 emissions from buses, auto-rickshaws, taxis, and some passenger vehicles were reduced [47,48]. The SO2 emissions also benefited from the introduction of newer fuel standards reducing the sulphur content in petrol and diesel. This successful conversion program remains an iconic intervention in Delhi’s history, with the Court intervening on multiple occasions to fast-track this transition. Since then, multiple cities have introduced CNG buses and promoted CNG for passenger vehicles, but never replicated at the same scale.

6.1.3. Diwali Firecracker Ban

In 2015, three toddlers filed a PIL at the Supreme Court asking for a complete ban on the sale of fireworks in the period just before and during Diwali [132]. Noting the concerns related to the health of children and the vulnerable in society, the Supreme Court nevertheless declined the petitioners’ request to ban firework sales, indicating that a ban would be considered if evidence comes to light that fireworks are found to be a major pollutant during the festive season. Instead, it initially directed the government and the educational institutions to disseminate messaging around the ill effects of fireworks and the air pollution caused by their use.
In 2016, the Supreme Court decided against a complete ban on sales and instead directed the government to reduce by half the number of fireworks sellers in the region [133]. With this order doing little to reduce access to fireworks, air quality levels jumped to alarming levels in late October (Figure 9a), and the Court eventually temporarily banned sales on 11 November [134].
Subsequent directions from the Court included soliciting a report from the CPCB on the harmful chemicals used in fireworks, directing the Petroleum and Explosives Safety Organization (PESO) to examine the potential to manufacture “green” fireworks that would emit 30–35% less air pollution, and banning the sale of specific categories of fireworks. In subsequent years, the Court attempted to regulate sales to comprise only approved “green” fireworks and directed the government to restrict the burning of fireworks to two-hour windows on Diwali [135]. The failure of such moves led to a complete ban on the sale of fireworks in 2022, but compliance levels were low.

6.1.4. Leapfrogging from BS4 to BS6 Vehicle Emission and Fuel Standards

In February 2016, the Union Ministry for Transport issued a notification on the transition from BS4 to BS6 standards for 2Ws, 3Ws, LDVs, and HDVs on 1 April 2020 [136]. In effect, this meant leapfrogging five years in advance, compared to the original date of 2025, under the Auto Fuel Policy. In 2018, the society of automobile manufacturers (SIAM) filed a petition requesting an extension that would allow them to continue to sell BS4 standard vehicles. The Supreme Court denied their petition and ruled in favour of the introduction of the BS6 standard nationwide, as per schedule in 2020 [137].

6.1.5. Petcoke Ban

In 2017, the Supreme Court ruled in favour of an immediate ban on using petcoke (which has high sulphur content) in all non-cement industrial units in NCR Delhi [138]. Subsequently, the ban was extended to any industry using petcoke and furnace oil in the neighbouring states of Haryana, Rajasthan, and Uttar Pradesh. Petcoke is a by-product of the oil refining process with a sulphur content of 6–7% by weight, which upon combustion is released as SO2 gas and transforms to its aerosol form (sulphates—a major chemical component of ambient PM2.5). In India, the total consumption of petcoke peaked at 25.6 million tons in 2018 before dropping to 21.7 million tons, partly because of this ruling [27].

6.1.6. Installation of Smog Towers

On 25 November 2019, the Supreme Court directed the Union Government and the Government of Delhi to install smog towers across Delhi to improve air quality levels at those locations [139]. Driven primarily by the public discourse around the perceived impact of one such giant vacuum cleaner installed in Xi’an, China, the smog tower came to be seen as a symbol of solutions for deteriorating Delhi’s air quality [117]. There are no studies in India or elsewhere that showcase any beneficial impact of these installations on ambient air quality. If anything, all the installations opened with a lot of fanfare, only to fizzle out within days of operations. Delhi installed one large smog tower at a capital cost of INR 3,000,000, one medium-size tower at a capital cost of INR 1,000,000, and multiple air purifiers at traffic intersections and bus stops. Of all the interventions by the Supreme Court to address Delhi’s air quality, this is the most unscientific push for a solution to scrub pollution, instead of addressing emissions at their sources.

6.1.7. National Green Tribunal (NGT)

NGT is a special judicial body established by the Parliament under the NGT Act of 2010 to expedite litigations related to environmental protection. India is the third country in the world, after Australia and New Zealand, to have dedicated environmental courts. The Supreme Court of India declared NGT’s position as a unique forum endowed with suo moto powers to take up environmental issues and can thus recognise issues based on letters, representations, and media reports. Specifically, NGT’s jurisdiction extends to any issue that falls under the Water Act, the Water Cess Act, the Forest Conservation Act, Air Act, Environment Protection Act, Public Liability Insurance Act, and the Biological Diversity Act. Accordingly, the NGT has intervened for the protection of Delhi’s air quality in:
  • Vardhaman Kaushik vs. Union of India case [140]—the NGT ordered de-registration of all diesel vehicles older than 10 years and all petrol vehicles older than 15 years.
  • Smt. Ganga Lalwani vs. Union of India and Ors. case [141]—the NGT took cognisance of crop burning as a significant cause of Delhi’s air pollution and ordered various steps to reduce crop burning in adjoining states. These include converting crop waste into organic manure, use of ISRO’s services to alter lice on crop burning incidents, etc.
  • Almitra H. Patel and Ors. vs. Union of India [142]—the NGT prohibited open burning of waste and directed all states to implement the solid waste management rules. Using its authority, the NGT under the polluter pays principle, in October 2022, imposed an environment compensation fee of INR 9,000,000,000 on the Delhi government for undisposed waste in its landfills.
  • Mayank Manohar and Paras Singh vs. Government of Delhi and Ors. [143]—the NGT directed the government to immediately shut down 4770 industrial units running illegally in the residential areas of Delhi and directed it to adopt coercive measures to recover compensation for illegal operation of such units in accordance with law apart from prosecution.

6.2. Role of Union Government

The prominence of Delhi as the national capital has meant substantial media coverage has been devoted to its deteriorating air quality over the years. This has translated into significantly more attention paid to it by the Union Government often to the neglect or even detriment of areas in the IGP that are likely as polluted [27]. While policy action from the Union Government has often been seen as a lagging indicator to judicial attention, here are some instances of a more proactive approach materialising.

6.2.1. Graded Response Action Plan (GRAP)

Responding to the extreme air pollution episodes before and during the winter months, CPCB formed the GRAP in January 2017. The plan outlined a series of escalating air pollution control measures for various line departments in the NCR Delhi, depending on the prevalent ambient PM2.5 and PM10 levels expressed as air quality index (AQI) [122].
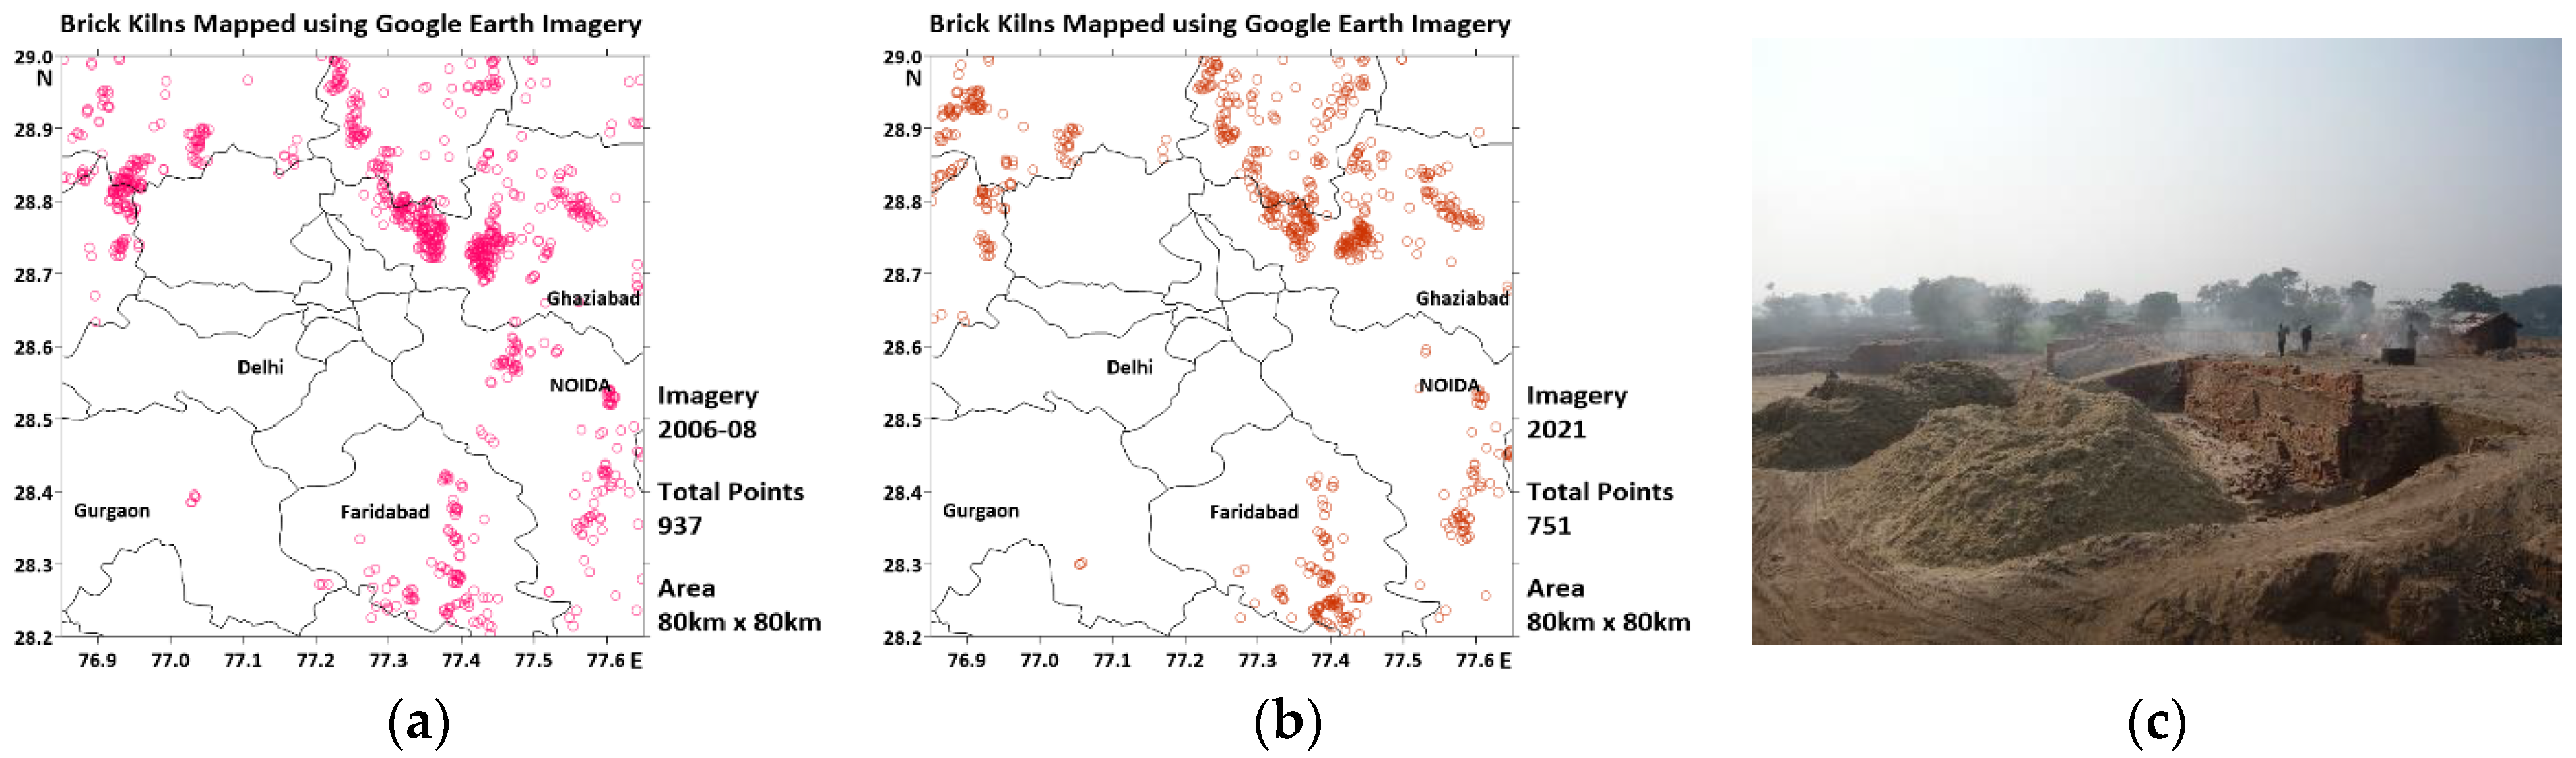
  • When AQI conditions land in the poor category, actions include ensuring strict enforcement of controls on garbage burning, brick kilns, power plants, ash ponds, construction sites, fireworks, and periodic wet sweeping of roads; vigilance on polluting vehicles, vehicles touting PUC norms and out of state trucks; deploying more traffic police; and posting information on social media.
  • When AQI conditions land in the very poor category, actions include banning diesel generator sets, increasing parking fees, increasing bus services, stopping coal and wood burning at hotels, opening eateries and stationing guards at markets in residential areas, and increasing public awareness.
  • When AQI conditions land in the severe category, actions include shutting down brick kilns, hot-mix plants, stone crushers, and power plants, intensifying public transport services, and wet-sweeping roads more frequently.
  • Under emergency conditions, actions include closing entry of non-commodity trucks, closing all construction activities, introducing the odd–even formula, and additional measures as the authority sees fit (for example, in January 2023, all coal use was banned in the NCR region).
Overall, the GRAP measures remain largely reactive, brought into effect only if the severity of the air quality persists for at least 48 h in any of the AQI categories, and to date, there has been little analysis on whether the GRAP has been successful in reducing ambient air pollution during these extreme events.

6.2.2. National Clean Air Programme (NCAP)

In January 2019, the Union Government notified NCAP, the first long-term policy aimed at improving ambient air quality nationwide. With a 2019 baseline, a total of 102 “non-attainment” cities were tasked with reducing ambient PM2.5 levels by 20–30% by 2024 compared to a 2017 baseline [26]. An updated list of 132 cities covers 24 states, with Maharashtra (19), Uttar Pradesh (17), and Andhra Pradesh (13) with more than ten cities each. The benchmark for air quality improvement was later changed to the reduction in PM10 levels due to the lack of an adequate baseline for many cities. In 2022, the new target under NCAP was 40% reduction in the annual averages by 2026, compared to the 2017 baseline.
Under the program, all the non-attainment cities were required to submit action plans. An early assessment of 102 approved action plans indicated that most cities compiled a series of actions akin to a wish list [26]. Only 25% of these plans integrated any kind of data on relative source contributions with respect to their source-specific control strategies and 50% of the action items were related to dealing with transport emissions from roads, rail, aviation, shipping, and road dust. Of the 92 action points in Delhi’s plan, 49 and 22 were transport- and industry-related; the rest covered open waste burning, residential cooking and heating, dust, monitoring, and public awareness. The skewed nature of the action plans is also an indication of the perception that transport is the most important source of emissions, irrespective of the shares determined via source apportionment studies (Section 4). Upon approval, MoEFCC allocated some funds for institutional capacity building such as adding more monitoring systems and setting up an information dissemination platform. Cities showcasing the greatest improvement across a range of metrics including actions to reduce emissions from waste burning, road and construction dust, vehicles, and industries were awarded additional funds under the Swachh Vayu Survekshan or clean air survey [144].
NCAP has helped focus attention on India’s air pollution issue nationwide, rather than just in NCR Delhi. The increased ambient monitoring network has enabled cities to measure their air quality and develop tailored action plans, rather than just following Delhi’s example. The number of continuous ambient monitoring stations across India rose from under 100 in 2018 to over 400 by the end of 2022.
To facilitate further development and evaluation of city clean air action plans, a National Knowledge Network (NKN) was created by the Indian Institute of Technology—Kanpur. More than 130 Indian institutes of repute are included in the network. These institutes are tasked with assisting cities, state PCBs, and urban local bodies with the design, implementation, and evaluation of city action plans, in addition to any other technical support necessary in the form of expansion of the ambient monitoring network, building emission inventories, conducting source apportionment, evaluation of costs and benefits, and institutional capacity building.

6.2.3. Commission for Air Quality Management (CAQM)

The CAQM for NCR Delhi and adjoining areas was introduced by the Union Government through an ordinance in October 2020. This was in response to the Supreme Court appointing a special committee headed by a retired Judge, Madan. B. Lokur, to direct action on Delhi’s air quality. In response to the promulgation of the CAQM ordinance, both the Lokur committee and EPCA stood dissolved, with their responsibilities passing on to the CAQM.
Comprised of past and current bureaucrats, the modus operandi of the CAQM is like the erstwhile EPCA. After functioning for six months, the CAQM ordinance lapsed in March 2021, and was repromulgated by the Union Government in April 2021. In August 2021, Parliament passed the CAQM Act, empowering the body with substantial authority to regulate air quality not only in the NCT Delhi but also in Punjab, Haryana, Uttar Pradesh, and Rajasthan. With this broader remit, the CAQM became the first expression of air pollution policy that intends to regulate air pollution across state boundaries. Under the act, the CAQM has broader powers including the ability to collect environmental compensation, override decisions of the CPCB and other regulatory entities, and transcend jurisdictional boundaries.

6.2.4. Fifteenth Finance Commission Grant (XVFC)

In November 2019, the XVFC allocated performance-linked grants for air quality to 42 urban agglomerations with over one million inhabitants. These grants were structured in two tranches, with the first tranche targeting expansion of monitoring, development of city-specific action plans, and building capacity in urban local bodies to undertake air quality management actions. The second tranche of funds are linked to performance metrics, mainly improvements in air quality shown by these cities. With a total fund allocation of INR 44,000,000,000 (USD 530,000,000) over five years and with half of it front-loaded, this is the single largest allocation of funds ever made for air quality management in India [145]. In the first year of the funds, most cities focused on expanding ambient and emissions monitoring networks, constructing an emissions inventory, conducting source apportionment studies, and conceptualising clean air action plans [26,146].

7. Final Remarks

Air pollution in Delhi is a year-round problem, not just limited to specific events such as Diwali or post-harvest fires or seasons such as winter. Long-term solutions should be the focus to address this issue, as outlined in the clean air action plans for the city. These solutions include increasing infrastructure for public transportation, walking, and cycling; promoting the use of clean fuels such as LPG and electricity for cooking and heating; enforcing emissions standards for industries; improving waste management and reducing open waste burning; and increasing the city’s green cover. The COVID lockdowns have shown that when emissions from all sources are reduced, air quality improves.
There is sufficient understanding of sources and emission loads contributing to observed PM2.5 pollution levels and the best available solutions to reverse the trends. In a nutshell, the key sources that require immediate attention are vehicle exhaust, road dust, construction dust, cooking and heating, open waste burning, and industries. The collective list of long-term actions has consistently remained in multiple clean air plans prepared between 1997 to 2020. While we can wait for further research, more evidence on the impacts of air pollution, and the development of better emission databases, there is no need to wait before acting. This problem is not limited to the city’s boundary; instead, a collective regional set of actions are required to address this urgent issue at hand.
The relationship between the urban environment, health, and planning is inseparable in mega cities. With a population of over 25 million in the airshed, pollution from a mix of sources, such as transport, cooking, heating, waste burning, and industries, is an inevitable part of urban life. To address this, reducing pollution must be incorporated as a key aspect of the city’s master plan. Urban planning measures, such as reducing traffic, promoting non-motorised transportation, creating pedestrian zones, and encouraging mixed-use commercial and residential areas, are crucial in achieving this goal.
Air purifiers are designed to filter the air in a specific area, such as a room or an office, to reduce exposure to harmful levels of particulate and gaseous pollutants. However, the same concept, as larger installations, cannot be a solution for ambient air pollution. To effectively address ambient air pollution, it is necessary to implement measures that target the emissions at the sources by altering control technology, influencing behaviours, and providing incentives.
AQI is an easy-to-understand public message metric. To populate this with more representative information, Delhi city and the neighbouring cities must expand their monitoring network. The spatial heterogeneity of pollution in Delhi’s airshed is high, requiring many monitors to accurately measure the intensity and variability. To cover the airshed of 100 km × 100 km, at least 100 CAAQMSs are needed to represent all the activities spatially and temporally. A hybrid system using a mix of reference-grade and low-cost sensors is a cost-effective solution, provided the low-cost sensors are properly and often calibrated and validated. Satellite feeds and operational chemical transport models can also be used to supplement monitoring in areas where monitors are not present. A larger pool of measurements is also useful for understanding any inconsistencies in the local and regional source contributions.
Health impacts, such as the number of cases of chronic obstructive pulmonary disease (COPD), asthma, bronchitis, heart attacks, reduced cognitive development, mental health, diabetes, and lung cancer, are key metrics for assessing good and bad air quality in a city. Tracking air pollution exposure rates through a comprehensive monitoring network and analysing hospital admission records during both extreme and moderate air quality periods is critical to understanding the impact of air pollution on human health. Providing open access to this information to the health community is also beneficial as it can help in the development of targeted interventions and public health campaigns. Additionally, this information can be used to prioritise interventions and allocate resources to the areas of highest need.
The sectors are constantly changing, resulting in fluctuating emissions. For example, as vehicle sales increase, so do vehicle emissions, and as fuel and vehicle standards improve, transport emissions decrease. The expansion of the city leads to increased emissions from transport and construction, and for industrial output, associated emissions fluctuate with energy sources. As the population increases, the demand for cooking and heating energy also increases, leading to increased emissions. However, these changes should not be an excuse to neglect the importance of consolidating knowledge and establishing an operational emissions inventory to identify hotspots and inform short-term pollution alerts and long-term policy analysis programs.
Periodic updates to emission inventories and repeating source apportionment studies are essential for a clean air action plan. This helps us track changes in various sectors, anticipate missing links, and enable surveys or studies to bridge informational gaps. It is like the need for an expanding air quality monitoring network to track progress or lack thereof. A regular update on the emission inventory allows for the identification of new sources or hotspots, the assessment of their relative contributions, and the development of targeted control measures. Similarly, repeating source apportionment studies every 2–3 years can help identify the relative importance of different sources over time. The last known studies were in 2018 using filter samples collected in 2016 and 2021 using the 2017 baseline emissions inventory. Updated information is crucial for the development and implementation of effective clean air strategies.
Under the GRAP program, it is important to use air quality forecasting information to proactively manage pollution rather than relying solely on trends from the last 48 h. Due to the diverse sources of pollution and weather patterns in Delhi, anticipating the severity of pollution in advance and being prepared to address the likely sources can help prevent high-exposure events. This requires a centralised agency to lead the system, disseminate information, and follow up with relevant departments to implement short-term measures.
To address the air pollution problem in Delhi, we have MoEFCC, CPCB, Union Ministries, CAQM, and the Supreme Court at the national level; the Government of the NCT Delhi and DPCC at the state level; and various municipalities at the urban level. An overarching body is crucial in addressing this multi-faceted issue of air pollution to bring together different stakeholders, including governments, corporations, and NGOs, and develop a unified plan of action. While the CAQM is ordained with the authority and resources necessary to enforce regulations, monitor compliance, and ensure accountability to reduce air pollution in NCR Delhi, the implementation strategy is dependent on the capacity of urban municipalities.
It is important for action to be taken by the relevant municipalities, PCBs, and ministries in addressing the issue of air pollution rather than waiting for the Judiciary to intervene. These line departments have the knowledge, expertise, and resources to implement effective solutions to address the issue and to work collaboratively with other stakeholders, such as community groups and industry leaders. This proactive approach is also important for avoiding legal challenges and penalties, which can be costly and time-consuming and could lead to delays in effective and permanent action.

Supplementary Materials

The following supporting information can be downloaded at https://doi.org/10.5281/zenodo.7595761 (accessed 22 February 2023). This includes (a) available ambient air quality monitoring data for Delhi: (a1) cpcb_delhi_data_2006-2018-raw-cleaned.rar (a2) 1999-2006-CPCB ITO-Hourly.xlsx (a3) NAMP data for 2011 to 2015 (a4) Graph-Composite-1989-2022.xlsx (b) Supporting documents: (b1) 1997-CPCB-White-Paper-on-Delhi-Air-Pollution.pdf (b2) 2011-CPCB-Source-Apportionment-Report-Extracts.pdf (b3) 2015-04 Infograph Delhi Banning Vehicles to Control AP.jpg (b4) 2016-03 Inforgraph Delhi Odd Even Emissions.jpg (b5) 2019-09-Infograph-Delhi-Odd-Even-Buses.jpg (b6) NCAP-Planned-Source-Apportionment-studies.pdf (b7) SIM-41-2021-Data-Resources-for-Energy-Emissions-Analysis.pdf (c) Reanalysis fields from WUSTL global modelling system: (c1) wustl_delhi_1998-2021.csv is at 0.01 degree resolution (c2) wustl_delhi_1998-2021.png and (d) Satellite data retrievals: (d1) satellite-modis_terra_aod_delhi-covidperiod.xlsx (d2) satellite-modis_terra_aod_delhi-longerperiod.xlsx (d3) satellite-omi_no2_delhi-covidperiod.xlsx (d4) satellite-tropomi_o3_delhi.xlsx (d5) satellite-tropomi_so2_delhi.xlsx.

Author Contributions

Conceptualization, S.K.G. and P.J.; methodology, S.K.G.; software, G.P. and S.K.D.; validation, S.K.D. and S.K.G.; formal analysis, all authors; investigation, all authors; resources, all authors; data curation, S.K.G., G.P. and S.K.D.; writing—original draft preparation, S.K.G.; writing—review and editing, S.K.G. and P.J.; visualization, S.K.G. and S.K.D.; supervision, P.J.; project administration, P.J. and S.K.G.; funding acquisition, S.K.G. All authors have read and agreed to the published version of the manuscript.

Funding

This research received no external funding.

Institutional Review Board Statement

Not applicable.

Informed Consent Statement

Not applicable.

Data Availability Statement

All the supporting documents and collated databases are publicly available at https://doi.org/10.5281/zenodo.7595761 (accessed 22 February 2023).

Conflicts of Interest

The authors declare no conflict of interest.

References

  1. CPCB. White Paper on Pollution in Delhi; Government of India: New Delhi, India, 1997.
  2. CPCB. Air Quality Monitoring, Emission Inventory and Source Apportionment Study for Indian Cities; Government of India: New Delhi, India, 2011.
  3. Guttikunda, S.K.; Goel, R.; Pant, P. Nature of air pollution, emission sources, and management in the Indian cities. Atmos. Environ. 2014, 95, 501–510. [Google Scholar] [CrossRef]
  4. Guttikunda, S. Air pollution in Delhi. Econ. Political Wkly. 2012, 47, 24–27. [Google Scholar]
  5. Gani, S.; Bhandari, S.; Seraj, S.; Wang, D.S.; Patel, K.; Soni, P.; Arub, Z.; Habib, G.; Hildebrandt Ruiz, L.; Apte, J.S. Submicron aerosol composition in the world’s most polluted megacity: The Delhi Aerosol Supersite study. Atmos. Chem. Phys. 2019, 19, 6843–6859. [Google Scholar] [CrossRef] [Green Version]
  6. Chowdhury, S.; Dey, S.; Tripathi, S.N.; Beig, G.; Mishra, A.K.; Sharma, S. “Traffic intervention” policy fails to mitigate air pollution in megacity Delhi. Environ. Sci. Policy 2017, 74, 8–13. [Google Scholar] [CrossRef]
  7. Talukdar, S.; Tripathi, S.N.; Lalchandani, V.; Rupakheti, M.; Bhowmik, H.S.; Shukla, A.K.; Murari, V.; Sahu, R.; Jain, V.; Tripathi, N.; et al. Air Pollution in New Delhi during Late Winter: An Overview of a Group of Campaign Studies Focusing on Composition and Sources. Atmosphere 2021, 12, 1432. [Google Scholar] [CrossRef]
  8. Yadav, S.; Tripathi, S.N.; Rupakheti, M. Current status of source apportionment of ambient aerosols in India. Atmos. Environ. 2022, 274, 118987. [Google Scholar] [CrossRef]
  9. Cusworth, D.H.; Mickley, L.J.; Sulprizio, M.P.; Liu, T.; Marlier, M.E.; DeFries, R.S.; Guttikunda, S.K.; Gupta, P. Quantifying the influence of agricultural fires in northwest India on urban air pollution in Delhi, India. Environ. Res. Lett. 2018, 13, 044018. [Google Scholar] [CrossRef] [Green Version]
  10. Chowdhury, S.; Dey, S.; Guttikunda, S.; Pillarisetti, A.; Smith, K.R.; Di Girolamo, L. Indian annual ambient air quality standard is achievable by completely mitigating emissions from household sources. Proc. Natl. Acad. Sci. USA 2019, 116, 10711–10716. [Google Scholar] [CrossRef] [Green Version]
  11. Singh, A.; Pant, P.; Pope, F.D. Air quality during and after festivals: Aerosol concentrations, composition and health effects. Atmos. Res. 2019, 227, 220–232. [Google Scholar] [CrossRef]
  12. Adhikary, R.; Patel, Z.B.; Srivastava, T.; Batra, N.; Singh, M.; Bhatia, U.; Guttikunda, S. Vartalaap: What drives# airquality discussions: Politics, pollution or pseudo-science? Proc. ACM Human-Comput. Interact. 2021, 5, 1–29. [Google Scholar]
  13. Patel, K.; Adhikary, R.; Patel, Z.B.; Batra, N.; Guttikunda, S. Samachar: Print News Media on Air Pollution in India. In Proceedings of the ACM SIGCAS/SIGCHI Conference on Computing and Sustainable Societies (COMPASS), Seattle, WA, USA, 8 June 2022; pp. 401–413. [Google Scholar]
  14. Guttikunda, S.K.; Calori, G. A GIS based emissions inventory at 1 km × 1 km spatial resolution for air pollution analysis in Delhi, India. Atmos. Environ. 2013, 67, 101–111. [Google Scholar] [CrossRef]
  15. Lalchandani, V.; Srivastava, D.; Dave, J.; Mishra, S.; Tripathi, N.; Shukla, A.K.; Sahu, R.; Thamban, N.M.; Gaddamidi, S.; Dixit, K.; et al. Effect of Biomass Burning on PM2.5 Composition and Secondary Aerosol Formation During Post-Monsoon and Winter Haze Episodes in Delhi. J. Geophys. Res. Atmos. 2022, 127, e2021JD035232. [Google Scholar] [CrossRef]
  16. Sahu, S.K.; Beig, G.; Parkhi, N.S. Emissions inventory of anthropogenic PM2.5 and PM10 in Delhi during Commonwealth Games 2010. Atmos. Environ. 2011, 45, 6180–6190. [Google Scholar] [CrossRef]
  17. Gurjar, B.R.; van Aardenne, J.A.; Lelieveld, J.; Mohan, M. Emission estimates and trends (1990-2000) for megacity Delhi and implications. Atmos. Environ. 2004, 38, 5663–5681. [Google Scholar] [CrossRef]
  18. Guttikunda, S.K.; Goel, R. Health impacts of particulate pollution in a megacity—Delhi, India. Environ. Dev. 2013, 6, 8–20. [Google Scholar] [CrossRef]
  19. van Donkelaar, A.; Hammer, M.S.; Bindle, L.; Brauer, M.; Brook, J.R.; Garay, M.J.; Hsu, N.C.; Kalashnikova, O.V.; Kahn, R.A.; Lee, C.; et al. Monthly Global Estimates of Fine Particulate Matter and Their Uncertainty. Environ. Sci. Technol. 2021, 55, 15287–15300. [Google Scholar] [CrossRef]
  20. van Donkelaar, A.; Martin, R.V.; Li, C.; Burnett, R.T. Regional Estimates of Chemical Composition of Fine Particulate Matter Using a Combined Geoscience-Statistical Method with Information from Satellites, Models, and Monitors. Environ. Sci. Technol. 2019, 53, 2595–2611. [Google Scholar] [CrossRef] [Green Version]
  21. DPCC. Real-Time Advanced Air Source Management Network (R-AASMAN); Delhi Pollution Control Committee, Government of Delhi: New Delhi, India, 2023. Available online: http://raasman.com (accessed on 1 February 2023).
  22. Bhandari, S.; Gani, S.; Patel, K.; Wang, D.S.; Soni, P.; Arub, Z.; Habib, G.; Apte, J.S.; Hildebrandt Ruiz, L. Sources and atmospheric dynamics of organic aerosol in New Delhi, India: Insights from receptor modeling. Atmos. Chem. Phys. 2020, 20, 735–752. [Google Scholar] [CrossRef] [Green Version]
  23. Rai, P.; Furger, M.; El Haddad, I.; Kumar, V.; Wang, L.; Singh, A.; Dixit, K.; Bhattu, D.; Petit, J.-E.; Ganguly, D.; et al. Real-time measurement and source apportionment of elements in Delhi’s atmosphere. Sci. Total Environ. 2020, 742, 140332. [Google Scholar] [CrossRef]
  24. CPCB. Continuous Ambient Ait Quality Monitoring System (CAAQMS) under the National Ambient Monitoring Programme (NAMP); Central Pollution Control Board, Government of India: New Delhi, India, 2022.
  25. Pant, P.; Lal, R.M.; Guttikunda, S.K.; Russell, A.G.; Nagpure, A.S.; Ramaswami, A.; Peltier, R.E. Monitoring particulate matter in India: Recent trends and future outlook. Air Qual. Atmos. Health 2018, 12, 45–58. [Google Scholar] [CrossRef]
  26. Ganguly, T.; Selvaraj, K.L.; Guttikunda, S.K. National Clean Air Programme (NCAP) for Indian cities: Review and outlook of clean air action plans. Atmos. Environ. X 2020, 8, 100096. [Google Scholar] [CrossRef]
  27. Guttikunda, S.; Ka, N. Evolution of India’s PM2.5 pollution between 1998 and 2020 using global reanalysis fields coupled with satellite observations and fuel consumption patterns. Environ. Sci. Atmos. 2022, 2, 1502–1515. [Google Scholar] [CrossRef]
  28. HEI. State of Global Air (SOGA). A Special Report on Global Exposure to Air Pollution and its Health Impacts; Health Effects Institute: Boston, MA, USA, 2022. [Google Scholar]
  29. Balakrishnan, K.; Dey, S.; Gupta, T.; Dhaliwal, R.S.; Brauer, M.; Cohen, A.J.; Stanaway, J.D.; Beig, G.; Joshi, T.K.; Aggarwal, A.N.; et al. The impact of air pollution on deaths, disease burden, and life expectancy across the states of India: The Global Burden of Disease Study 2017. Lancet Planet. Health 2019, 3, e26–e39. [Google Scholar] [CrossRef] [PubMed] [Green Version]
  30. Dandona, L.; Dandona, R.; Kumar, G.A.; Shukla, D.K.; Paul, V.K.; Balakrishnan, K.; Prabhakaran, D.; Tandon, N.; Salvi, S.; Dash, A.P.; et al. Nations within a nation: Variations in epidemiological transition across the states of India, 1990–2016 in the Global Burden of Disease Study. Lancet 2017, 390, 2437–2460. [Google Scholar] [CrossRef] [PubMed] [Green Version]
  31. Pandey, A.; Brauer, M.; Cropper, M.L.; Balakrishnan, K.; Mathur, P.; Dey, S.; Turkgulu, B.; Kumar, G.A.; Khare, M.; Beig, G.; et al. Health and economic impact of air pollution in the states of India: The Global Burden of Disease Study 2019. Lancet Planet. Health 2021, 5, e25–e38. [Google Scholar] [CrossRef] [PubMed]
  32. WHO. Health Aspects of Air Pollution with Particulate Matter, Ozone and Nitrogen Dioxide; WHO Regional Office for Europe: Copenhagen, Denmark, 2003. [Google Scholar]
  33. Shi, L.; Wu, X.; Danesh Yazdi, M.; Braun, D.; Abu Awad, Y.; Wei, Y.; Liu, P.; Di, Q.; Wang, Y.; Schwartz, J.; et al. Long-term effects of PM2·5 on neurological disorders in the American Medicare population: A longitudinal cohort study. Lancet Planet. Health 2020, 4, e557–e565. [Google Scholar] [CrossRef] [PubMed]
  34. McDuffie, E.E.; Martin, R.V.; Spadaro, J.V.; Burnett, R.; Smith, S.J.; O’Rourke, P.; Hammer, M.S.; van Donkelaar, A.; Bindle, L.; Shah, V.; et al. Source sector and fuel contributions to ambient PM2.5 and attributable mortality across multiple spatial scales. Nat. Commun. 2021, 12, 3594. [Google Scholar] [CrossRef]
  35. IQair. World’s Most Polluted Cities in 2021. Available online: https://www.iqair.com/world-most-polluted-cities (accessed on 13 December 2022).
  36. Guttikunda, S.K.; Gurjar, B.R. Role of meteorology in seasonality of air pollution in megacity Delhi, India. Environ. Monit Assess 2012, 184, 3199–3211. [Google Scholar] [CrossRef]
  37. Ahmed, M.; Das, B.; Lotus, S.; Ali, M. A study on frequency of western disturbances and precipitation trends over Jammu & Kashmir, India: 1980-2019. Mausam 2022, 73, 283–294. [Google Scholar]
  38. Gautam, R.; Singh, M.K. Urban Heat Island Over Delhi Punches Holes in Widespread Fog in the Indo-Gangetic Plains. Geophys. Res. Lett. 2018, 45, 1114–1121. [Google Scholar] [CrossRef]
  39. Singh, M.K.; Gautam, R. Developing a long-term high-resolution winter fog climatology over south Asia using satellite observations from 2002 to 2020. Remote Sens. Environ. 2022, 279, 113128. [Google Scholar] [CrossRef]
  40. Kulkarni, R.; Jenamani, R.K.; Pithani, P.; Konwar, M.; Nigam, N.; Ghude, S.D. Loss to Aviation Economy Due to Winter Fog in New Delhi during the Winter of 2011–2016. Atmosphere 2019, 10, 198. [Google Scholar] [CrossRef] [Green Version]
  41. Hakkim, H.; Sinha, V.; Chandra, B.P.; Kumar, A.; Mishra, A.K.; Sinha, B.; Sharma, G.; Pawar, H.; Sohpaul, B.; Ghude, S.D.; et al. Volatile organic compound measurements point to fog-induced biomass burning feedback to air quality in the megacity of Delhi. Sci. Total Environ. 2019, 689, 295–304. [Google Scholar] [CrossRef] [PubMed]
  42. Pesaresi, M.; Ehrilch, D.; Florczyk, A.J.; Freire, S.; Julea, A.; Kemper, T.; Soille, P.; Syrris, V. GHS Built-Up Grid, Derived from Landsat, Multitemporal (1975, 1990, 2000, 2014); European Commission, Joint Research Centre, JRC Data Catalogue: Brussels, Belgium, 2015. [Google Scholar]
  43. DTE. The Supreme Court not to Budge on CNG Issue; DTE: New Delhi, India, 2002. [Google Scholar]
  44. Bell, R.G.; Mathur, K.; Narain, U.; Simpson, D. Clearing the Air: How Delhi Broke the Logjam on Air Quality Reforms. Environ. Sci. Policy Sustain. Dev. 2004, 46, 22–39. [Google Scholar] [CrossRef]
  45. Balachandran, S.; Meena, B.R.; Khillare, P.S. Particle size distribution and its elemental composition in the ambient air of Delhi. Environ. Int. 2000, 26, 49–54. [Google Scholar] [CrossRef] [PubMed]
  46. Narain, U.; Bell, R. Who Changed Delhi’s Air? The Roles of the Court and the Executive in Environmental Policymaking; Resources for the Future: Washington, DC, USA, 2005. [Google Scholar]
  47. Goel, R.; Guttikunda, S.K. Evolution of on-road vehicle exhaust emissions in Delhi. Atmos. Environ. 2015, 105, 78–90. [Google Scholar] [CrossRef]
  48. Goel, R.; Guttikunda, S.K. Role of urban growth, technology, and judicial interventions on vehicle exhaust emissions in Delhi for 1991–2014 and 2014–2030 periods. Environ. Dev. 2015, 14, 6–21. [Google Scholar] [CrossRef]
  49. Krelling, C.; Badami, M.G. Cost-effectiveness analysis of compressed natural gas implementation in the public bus transit fleet in Delhi, India. Transp. Policy 2022, 115, 49–61. [Google Scholar] [CrossRef]
  50. SAFAR. System of Air Quality and Weather Forecasting And Research, Indian Institute of Tropical Meteorology, Pune, India. Available online: http://safar.tropmet.res.in/ (accessed on 1 February 2023).
  51. Tibrewal, K.; Venkataraman, C. COVID-19 lockdown closures of emissions sources in India: Lessons for air quality and climate policy. J. Environ. Manag. 2022, 302, 114079. [Google Scholar] [CrossRef]
  52. Faridi, S.; Yousefian, F.; Janjani, H.; Niazi, S.; Azimi, F.; Naddafi, K.; Hassanvand, M.S. The effect of COVID-19 pandemic on human mobility and ambient air quality around the world: A systematic review. Urban Clim. 2021, 38, 100888. [Google Scholar] [CrossRef]
  53. Venter, Z.S.; Aunan, K.; Chowdhury, S.; Lelieveld, J. COVID-19 lockdowns cause global air pollution declines. Proc. Natl. Acad. Sci. USA 2020, 117, 18984–18990. [Google Scholar] [CrossRef] [PubMed]
  54. Sathe, Y.; Gupta, P.; Bawase, M.; Lamsal, L.; Patadia, F.; Thipse, S. Surface and satellite observations of air pollution in India during COVID-19 lockdown: Implication to air quality. Sustain. Cities Soc. 2021, 66, 102688. [Google Scholar] [CrossRef] [PubMed]
  55. Gani, S.; Pant, P.; Sarkar, S.; Sharma, N.; Dey, S.; Guttikunda, S.K.; AchutaRao, K.M.; Nygard, J.; Sagar, A.D. Systematizing the approach to air quality measurement and analysis in low and middle income countries. Environ. Res. Lett. 2022, 17, 021004. [Google Scholar] [CrossRef]
  56. Edwards, M.R.; Holloway, T.; Pierce, R.B.; Blank, L.; Broddle, M.; Choi, E.; Duncan, B.N.; Esparza, Á.; Falchetta, G.; Fritz, M.; et al. Satellite Data Applications for Sustainable Energy Transitions. Front. Sustain. 2022, 3, 910924. [Google Scholar] [CrossRef]
  57. Holloway, T.; Miller, D.; Anenberg, S.; Diao, M.; Duncan, B.; Fiore, A.M.; Henze, D.K.; Hess, J.; Kinney, P.L.; Liu, Y.; et al. Satellite Monitoring for Air Quality and Health. Annu. Rev. Biomed. Data Sci. 2021, 4, 417–447. [Google Scholar] [CrossRef]
  58. Dey, S.; Purohit, B.; Balyan, P.; Dixit, K.; Bali, K.; Kumar, A.; Imam, F.; Chowdhury, S.; Ganguly, D.; Gargava, P.; et al. A Satellite-Based High-Resolution (1-km) Ambient PM2.5 Database for India over Two Decades (2000–2019): Applications for Air Quality Management. Remote Sens. 2020, 12, 3872. [Google Scholar] [CrossRef]
  59. Kurinji, L.; Ganguly, T. Managing India’s Air Quality Through an Eye in the Sky; Council for Energy Environment and Water: New Delhi, India, 2020. [Google Scholar]
  60. Baek, K.; Kim, J.H.; Bak, J.; Haffner, D.P.; Kang, M.; Hong, H. Evaluation of total ozone measurements from Geostationary Environmental Monitoring Satellite (GEMS). EGUsphere 2022, 2022, 1–23. [Google Scholar] [CrossRef]
  61. Ghude, S.D.; Pfister, G.G.; Jena, C.; van der A, R.J.; Emmons, L.K.; Kumar, R. Satellite constraints of nitrogen oxide (NOx) emissions from India based on OMI observations and WRF-Chem simulations. Geophys. Res. Lett. 2013, 40, 423–428. [Google Scholar] [CrossRef]
  62. Hammer, M.S.; van Donkelaar, A.; Li, C.; Lyapustin, A.; Sayer, A.M.; Hsu, N.C.; Levy, R.C.; Garay, M.J.; Kalashnikova, O.V.; Kahn, R.A.; et al. Global Estimates and Long-Term Trends of Fine Particulate Matter Concentrations (1998–2018). Environ. Sci. Technol. 2020, 54, 7879–7890. [Google Scholar] [CrossRef]
  63. Guttikunda, S.K.; Jawahar, P. Atmospheric emissions and pollution from the coal-fired thermal power plants in India. Atmos. Environ. 2014, 92, 449–460. [Google Scholar] [CrossRef]
  64. Roozitalab, B.; Carmichael, G.R.; Guttikunda, S.K.; Abdi-Oskouei, M. Elucidating the impacts of COVID-19 lockdown on air quality and ozone chemical characteristics in India. Environ. Sci. Atmos. 2022, 2, 1183–1207. [Google Scholar] [CrossRef]
  65. Nussbaumer, C.M.; Pozzer, A.; Tadic, I.; Röder, L.; Obersteiner, F.; Harder, H.; Lelieveld, J.; Fischer, H. Tropospheric ozone production and chemical regime analysis during the COVID-19 lockdown over Europe. Atmos. Chem. Phys. 2022, 22, 6151–6165. [Google Scholar] [CrossRef]
  66. Dubash, N.; Guttikunda, S.K. Delhi has a Complex air Pollution Problem, Hindustan Times. Available online: https://tinyurl.com/ybrtw9e7 (accessed on 1 February 2023).
  67. Banerjee, T.; Murari, V.; Kumar, M.; Raju, M.P. Source apportionment of airborne particulates through receptor modeling: Indian scenario. Atmos. Res. 2015, 164–165, 167–187. [Google Scholar] [CrossRef]
  68. Pant, P.; Harrison, R.M. Critical review of receptor modelling for particulate matter: A case study of India. Atmos. Environ. 2012, 49, 1–12. [Google Scholar] [CrossRef] [Green Version]
  69. Johnson, T.M.; Guttikunda, S.K.; Wells, G.; Bond, T.; Russell, A.; West, J.; Watson, J. Tools for Improving Air Quality Management. A Review of Top-Down Source Apportiontment Techniques and Their Application in Developing Countries; ESMAP Publication Series; The World Bank: Washington, DC, USA, 2011. [Google Scholar]
  70. Amann, M.; Purohit, P.; Bhanarkar, A.D.; Bertok, I.; Borken-Kleefeld, J.; Cofala, J.; Heyes, C.; Kiesewetter, G.; Klimont, Z.; Liu, J.; et al. Managing future air quality in megacities: A case study for Delhi. Atmos. Environ. 2017, 161, 99–111. [Google Scholar] [CrossRef]
  71. TERI. Source Apportionment of PM2.5 & PM10 of Delhi NCR for Identification of Major Sources; The Energy Research Institute: New Delhi, India, 2018. [Google Scholar]
  72. Gupta, L.; Bansal, M.; Nandi, P.; Habib, G.; Sunder Raman, R. Source apportionment and potential source regions of size-resolved particulate matter at a heavily polluted industrial city in the Indo-Gangetic Plain. Atmos. Environ. 2023, 298, 119614. [Google Scholar] [CrossRef]
  73. Tobler, A.; Bhattu, D.; Canonaco, F.; Lalchandani, V.; Shukla, A.; Thamban, N.M.; Mishra, S.; Srivastava, A.K.; Bisht, D.S.; Tiwari, S.; et al. Chemical characterization of PM2.5 and source apportionment of organic aerosol in New Delhi, India. Sci. Total Environ. 2020, 745, 140924. [Google Scholar] [CrossRef]
  74. Lalchandani, V.; Kumar, V.; Tobler, A.; Thamban, N.M.; Mishra, S.; Slowik, J.G.; Bhattu, D.; Rai, P.; Satish, R.; Ganguly, D.; et al. Real-time characterization and source apportionment of fine particulate matter in the Delhi megacity area during late winter. Sci. Total Environ. 2021, 770, 145324. [Google Scholar] [CrossRef]
  75. Guttikunda, S.K.; Calori, G.; Velay-Lasry, F.; Ngo, R. Air Quality Forecasting System for Cities: Modeling Architecture for Delhi; SIM-22-2009; ResearchGate GmbH.: New Delhi, India, 2011. [Google Scholar]
  76. Goel, R.; Gani, S.; Guttikunda, S.K.; Wilson, D.; Tiwari, G. On-road PM2.5 pollution exposure in multiple transport microenvironments in Delhi. Atmos. Environ. 2015, 123, 129–138. [Google Scholar] [CrossRef]
  77. Apte, J.S.; Kirchstetter, T.W.; Reich, A.H.; Deshpande, S.J.; Kaushik, G.; Chel, A.; Marshall, J.D.; Nazaroff, W.W. Concentrations of fine, ultrafine, and black carbon particles in auto-rickshaws in New Delhi, India. Atmos. Environ. 2011, 45, 4470–4480. [Google Scholar] [CrossRef]
  78. MoRTH. Road Transport Yearbook and Statistics Reports for 2000 to 2020; Minister of Road Transport and Highways, the Government of India: New Delhi, India, 2022.
  79. Goel, R.; Guttikunda, S.K.; Mohan, D.; Tiwari, G. Benchmarking vehicle and passenger travel characteristics in Delhi for on-road emissions analysis. Travel Behav. Soc. 2015, 2, 88–101. [Google Scholar] [CrossRef]
  80. EPCA. Report of Assessment of Pollution Under Control (PUC) Programme in Delhi and NCR: Recommendations for Improvement to Ensure Pollution from In-Use Vehicles is Under Control; EPCA Report No. 73; Environment Pollution (Prevention and Control) Authority for Delhi NCR: New Delhi, India, 2017. [Google Scholar]
  81. Suman, H.K.; Bolia, N.B.; Tiwari, G. Analysis of the Factors Influencing the Use of Public Buses in Delhi. J. Urban Plan. Dev. 2016, 142, 04016003. [Google Scholar] [CrossRef]
  82. World-Bank. Urban Bus Toolkit—Tools and Options for Reforming Urban Bus Systems; The World Bank: Washington, DC, USA, 2006. [Google Scholar]
  83. Gadepalli, R.; Gumireddy, S.; Bansal, P. Cost Drivers of Electric Bus Contracts: Analysis of 33 Indian Cities. Transp. Res. Rec. 2022, 2676, 03611981221088593. [Google Scholar] [CrossRef]
  84. Hidalgo, D.; Pai, M. Delhi Bus Corridor: An Evaluation; EMBARQ: Overland Park, KS, USA, 2009. [Google Scholar]
  85. Badami, M.G.; Haider, M. An analysis of public bus transit performance in Indian cities. Transp. Res. Part A Policy Pract. 2007, 41, 961–981. [Google Scholar] [CrossRef]
  86. Nikitas, D.A.; Karlsson, P.M. A Worldwide State-of-the-Art Analysis for Bus Rapid Transit: Looking for the Success Formula. J. Public Transp. 2015, 18, 1–33. [Google Scholar] [CrossRef] [Green Version]
  87. Nguyen, M.H.; Pojani, D. Chapter Two—Why Do Some BRT Systems in the Global South Fail to Perform or Expand. In Advances in Transport Policy and Planning; Shiftan, Y., Kamargianni, M., Eds.; Academic Press: Cambridge, MA, USA, 2018; Volume 1, pp. 35–61. [Google Scholar]
  88. Hodgson, P.; Potter, S.; Warren, J.; Gillingwater, D. Can bus really be the new tram? Res. Transp. Econ. 2013, 39, 158–166. [Google Scholar] [CrossRef] [Green Version]
  89. Goel, R.; Tiwari, G. Access-egress and other travel characteristics of metro users in Delhi and its satellite cities. IATSS Res. 2016, 39, 164–172. [Google Scholar] [CrossRef] [Green Version]
  90. Rajagopal, D.; Sawant, V.; Bauer, G.S.; Phadke, A.A. Benefits of electrifying app-taxi fleet—A simulation on trip data from New Delhi. Transp. Res. Part D Transp. Environ. 2022, 102, 103113. [Google Scholar] [CrossRef]
  91. Tirachini, A. Ride-hailing, travel behaviour and sustainable mobility: An international review. Transportation 2020, 47, 2011–2047. [Google Scholar] [CrossRef]
  92. Kumar, P.; Gulia, S.; Harrison, R.M.; Khare, M. The influence of odd–even car trial on fine and coarse particles in Delhi. Environ. Pollut. 2017, 225, 20–30. [Google Scholar] [CrossRef]
  93. Beiser-McGrath, L.F.; Bernauer, T.; Prakash, A. Do policy clashes between the judiciary and the executive affect public opinion? Insights from New Delhi’s odd–even rule against air pollution. J. Public Policy 2021, 42, 185–200. [Google Scholar] [CrossRef]
  94. Davis, L.W. The Effect of Driving Restrictions on Air Quality in Mexico City. J. Political Econ. 2008, 116, 38–81. [Google Scholar] [CrossRef] [Green Version]
  95. Delhi-Govt. Delhi Electric Vehicles Policy 2020; Government of Delhi: New Delhi, India, 2020. Available online: https://ev.delhi.gov.in (accessed on 1 February 2023).
  96. RMI. Accelerating Electric Mobility in Delhi: Journey and Insights from Implementing the Delhi Electric Vehicles Policy; Rocky Mountain Institute: New Delhi, India, 2022. Available online: https://ev.delhi.gov.in/files/Accelerating-Electric-Mobility-in-Delhi8497bf.pdf (accessed on 1 February 2023).
  97. CSE. Debunking Official Numbers of Trucks Entering Delhi; Center for Science and Environment: New Delhi, India, 2015. [Google Scholar]
  98. Shyamsundar, P.; Springer, N.P.; Tallis, H.; Polasky, S.; Jat, M.L.; Sidhu, H.S.; Krishnapriya, P.P.; Skiba, N.; Ginn, W.; Ahuja, V.; et al. Fields on fire: Alternatives to crop residue burning in India. Science 2019, 365, 536–538. [Google Scholar] [CrossRef] [PubMed]
  99. Singha, M.; Dong, J.; Ge, Q.; Metternicht, G.; Sarmah, S.; Zhang, G.; Doughty, R.; Lele, S.; Biradar, C.; Zhou, S.; et al. Satellite evidence on the trade-offs of the food-water–air quality nexus over the breadbasket of India. Glob. Environ. Change 2021, 71, 102394. [Google Scholar] [CrossRef]
  100. Jethva, H.; Chand, D.; Torres, O.; Gupta, P.; Lyapustin, A.; Patadia, F. Agricultural Burning and Air Quality over Northern India: A Synergistic Analysis using NASA’s A-train Satellite Data and Ground Measurements. Aerosol Air Qual. Res. 2018, 18, 1756–1773. [Google Scholar] [CrossRef] [Green Version]
  101. Jethva, H.; Torres, O.; Field, R.D.; Lyapustin, A.; Gautam, R.; Kayetha, V. Connecting Crop Productivity, Residue Fires, and Air Quality over Northern India. Sci. Rep. 2019, 9, 16594. [Google Scholar] [CrossRef] [Green Version]
  102. Wooster, M.J.; Roberts, G.J.; Giglio, L.; Roy, D.P.; Freeborn, P.H.; Boschetti, L.; Justice, C.; Ichoku, C.; Schroeder, W.; Davies, D.; et al. Satellite remote sensing of active fires: History and current status, applications and future requirements. Remote Sens. Environ. 2021, 267, 112694. [Google Scholar] [CrossRef]
  103. Wiedinmyer, C.; Akagi, S.K.; Yokelson, R.J.; Emmons, L.K.; Al-Saadi, J.A.; Orlando, J.J.; Soja, A.J. The Fire INventory from NCAR (FINN): A high resolution global model to estimate the emissions from open burning. Geosci. Model Dev. 2011, 4, 625–641. [Google Scholar] [CrossRef] [Green Version]
  104. Jethva, H. Assessing predictability of post-monsoon crop residue fires in Northwestern India. Front. Earth Sci. 2022, 10, 1047278. [Google Scholar] [CrossRef]
  105. Beig, G.; Sahu, S.K.; Singh, V.; Tikle, S.; Sobhana, S.B.; Gargeva, P.; Ramakrishna, K.; Rathod, A.; Murthy, B.S. Objective evaluation of stubble emission of North India and quantifying its impact on air quality of Delhi. Sci. Total Environ. 2020, 709, 136126. [Google Scholar] [CrossRef]
  106. Kanawade, V.P.; Srivastava, A.K.; Ram, K.; Asmi, E.; Vakkari, V.; Soni, V.K.; Varaprasad, V.; Sarangi, C. What caused severe air pollution episode of November 2016 in New Delhi? Atmos. Environ. 2020, 222, 117125. [Google Scholar] [CrossRef]
  107. GBD-MAPS. Global Burden of Disease—Mapping Air Pollution Sources in India; Health Effects Institute: Boston, MA, USA, 2018. [Google Scholar]
  108. PIB. Agricultural Mechanization for In-Situ Management of Crop Residue by MoAFW; Release ID: 1707021; Press Information Bureau, Government of India: New Delhi, India, 2021.
  109. PIB. Measures to Reduce Pollution Due to Stubble Burning by MoEFCC; Release ID: 1779712; Press Information Bureau, Government of India: New Delhi, India, 2021.
  110. Mukherjee, A.; Tripathi, S.N.; Ram, K.; Saha, D. New Delhi Air Potentially Chokes from Groundwater Conservation Policies in Adjoining Regions. Environ. Sci. Technol. Lett. 2023, 10, 3–5. [Google Scholar] [CrossRef]
  111. Chowdhury, S.; Chafe, Z.A.; Pillarisetti, A.; Lelieveld, J.; Guttikunda, S.K.; Dey, S. The Contribution of Household Fuels to Ambient Air Pollution in India—A Comparison of Recent Estimates; Policy Brief No. CCAPC/2019/01; Collaborative Clean Air Policy Centre: New Delhi, India, 2019. [Google Scholar]
  112. Census-India. Census of India, 2011; The Governement of India: New Delhi, India, 2011.
  113. Harish, S.; Smith, K.R. (Eds.) Ujjwala 2.0: From Access to Sustained Usage; Policy Brief No. CCAPC/2019/03; Collaborative Clean Air Policy Centre: New Delhi, India, 2019. [Google Scholar]
  114. Tripathi, A.; Sagar, A.D.; Smith, K.R. Promoting clean and affordable cooking: Smarter subsidies for LPG. Econ. Political Wkly. 2015, 50, 81–84. [Google Scholar]
  115. Gill-Wiehl, A.; Brown, T.; Smith, K. The need to prioritize consumption: A difference-in-differences approach to analyze the total effect of India’s below-the-poverty-line policies on LPG use. Energy Policy 2022, 164, 112915. [Google Scholar] [CrossRef]
  116. Gupta, A.; Vyas, S.; Hathi, P.; Khalid, N.; Srivastav, N.; Spears, D.; Coffey, D. Persistence of solid fuel use in rural North India. Econ. Political Wkly. 2020, 55, 55. [Google Scholar]
  117. Guttikunda, S.; Jawahar, P. Can We Vacuum Our Air Pollution Problem Using Smog Towers? Atmosphere 2020, 11, 922. [Google Scholar] [CrossRef]
  118. DPCC. Quarterly Report on Solid Waste Management, March 2022; Delhi Pollution Control Committee, Government of Delhi: New Delhi, India, 2022.
  119. Nagpure, A.S.; Ramaswami, A.; Russell, A. Characterizing the Spatial and Temporal Patterns of Open Burning of Municipal Solid Waste (MSW) in Indian Cities. Environ. Sci. Technol. 2015, 49, 12911–12912. [Google Scholar] [CrossRef]
  120. Randhawa, P.; Marshall, F.; Kushwaha, P.K.; Desai, P. Pathways for Sustainable Urban Waste Management and Reduced Environmental Health Risks in India: Winners, Losers, and Alternatives to Waste to Energy in Delhi. Front. Sustain. Cities 2020, 2, 14. [Google Scholar] [CrossRef]
  121. DPCC. Annual Report 2021-22 on Implementation of Construction and Demolition Waste Management Rules 2016; Delhi Pollution Control Committee, Government of Delhi: New Delhi, India, 2022.
  122. CPCB. Graded Response Action Plan (GRAP); Central Pollution Control Board, Government of India: New Delhi, India, 2017. Available online: https://cpcb.nic.in (accessed on 1 February 2023).
  123. Maithel, S.; Uma, R.; Bond, T.; Baum, E.; Thao, V.T.K. Brick Kilns Performance Assessment, Emissions Measurements, & A Roadmap for Cleaner Brick Production in India; CATF: Boston, MA, USA, 2012. [Google Scholar]
  124. Weyant, C.; Athalye, V.; Ragavan, S.; Rajarathnam, U.; Lalchandani, D.; Maithel, S.; Baum, E.; Bond, T.C. Emissions from South Asian Brick Production. Environ. Sci. Technol. 2014, 48, 6477–6483. [Google Scholar] [CrossRef]
  125. Pant, P.; Shukla, A.; Kohl, S.D.; Chow, J.C.; Watson, J.G.; Harrison, R.M. Characterization of ambient PM2.5 at a pollution hotspot in New Delhi, India and inference of sources. Atmos. Environ. 2015, 109, 178–189. [Google Scholar] [CrossRef]
  126. Pant, P.; Baker, S.J.; Shukla, A.; Maikawa, C.; Godri Pollitt, K.J.; Harrison, R.M. The PM10 fraction of road dust in the UK and India: Characterization, source profiles and oxidative potential. Sci. Total Environ. 2015, 530–531, 445–452. [Google Scholar] [CrossRef] [PubMed]
  127. Delhi-Govt. Economic Survey of Delhi 2021-22, Chapter 11: Energy; Delhi Planning Commission: New Delhi, India, 2022.
  128. Cropper, M.; Cui, R.; Guttikunda, S.; Hultman, N.; Jawahar, P.; Park, Y.; Yao, X.; Song, X.-P. The mortality impacts of current and planned coal-fired power plants in India. Proc. Natl. Acad. Sci. USA 2021, 118, e2017936118. [Google Scholar] [CrossRef] [PubMed]
  129. Liu, J.; Chen, Y.; Chao, S.; Cao, H.; Zhang, A. Levels and health risks of PM2.5-bound toxic metals from firework/firecracker burning during festival periods in response to management strategies. Ecotoxicol. Environ. Saf. 2019, 171, 406–413. [Google Scholar] [CrossRef] [PubMed]
  130. Ghosh, S. Chapter: Environment. In Regulation in India: Design, Capacity, Performance; Bloomsbury Publishers: London, UK, 2018. [Google Scholar]
  131. Dutta, R. Twenty Years of EPCA: Lessons for the New EPCA; Legal Initiative for Forests and Environment: New Delhi, India, 2018. [Google Scholar]
  132. Supreme-Court. Arjun Gopal vs Union Of India, Writ Petition(Civil) No. 728/2015; The Supreme Court: New Delhi, India, 2015. Available online: https://indiankanoon.org/doc/83069161/ (accessed on 1 February 2023).
  133. Supreme-Court. Arjun Gopal vs Union Of India, Writ Petition(Civil) No. 728/2015; The Supreme Court: New Delhi, India, 7 November 2016. Available online: https://indiankanoon.org/doc/54446501/ (accessed on 1 February 2023).
  134. Supreme-Court. Arjun Gopal vs Union Of India, Writ Petition(Civil) No. 728/2015; The Supreme Court: New Delhi, India, 11 November 2016. Available online: https://indiankanoon.org/doc/150260580/ (accessed on 1 February 2023).
  135. Supreme-Court. Arjun Gopal vs Union Of India, Writ Petition(Civil) No. 728/2015; The Supreme Court: New Delhi, India, 2021. Available online: https://indiankanoon.org/doc/199698532/ (accessed on 1 February 2023).
  136. PIB. Government Decides to Directly Shift from BS-IV to BS-VI Emission Norms; Release ID: 134232; Press Information Bureau, Government of India: New Delhi, India, 2016.
  137. Supreme-Court. M.C. Mehta vs Union Of India, Writ Petition(Civil) No. 13029/1985; The Supreme Court: New Delhi, India, 2018. Available online: https://indiankanoon.org/doc/73307198/ (accessed on 1 February 2023).
  138. Supreme-Court. M.C. Mehta vs Union Of India, Writ Petition(Civil) No. 13029/1985; The Supreme Court: New Delhi, India, 2017. Available online: https://indiankanoon.org/doc/174022915/ (accessed on 1 February 2023).
  139. Supreme-Court. M.C. Mehta vs Union Of India, Writ Petition(Civil) No. 13029/1985; The Supreme Court: New Delhi, India, 2019. Available online: https://indiankanoon.org/doc/40459213/ (accessed on 1 February 2023).
  140. NGT. Vardhaman Kaushik vs Union of India Case on De-Registering Older Vehicles; The National Green Tribunal: New Delhi, India, 2018. Available online: https://greentribunal.gov.in/caseDetails/DELHI/0701102000092014 (accessed on 1 February 2023).
  141. NGT. Smt. Ganga Lalwani vs. Union of India and Ors Case to Reduce Crop-Burning in Neighbouring States; The National Green Tribunal: New Delhi, India, 2018. Available online: https://greentribunal.gov.in/sites/default/files/all_documents/GANGA%20LALWANI.PDF (accessed on 1 February 2023).
  142. NGT. Almitra H. Patel & Ors. vs. Union of India Case on Waste Management in Delhi; The National Green Tribunal: New Delhi, India, 2014. Available online: https://www.dpcc.delhigovt.nic.in/uploads/sitedata/almrita_H_UOI_1.pdf (accessed on 1 February 2023).
  143. NGT. Mayank Manohar & Paras Singh vs. Government of Delhi & Ors Case to Shutdown illegal Industries in Delhi; The National Green Tribunal: New Delhi, India, 2018. Available online: https://greentribunal.gov.in (accessed on 1 February 2023).
  144. CPCB. Swachh Vayu Survekshan; Central Pollution Control Board, Government of India: New Delhi, India, 2022. Available online: https://prana.cpcb.gov.in/assets/pdf/Resources/Swachh_Vayu_Survekshan_15_aug_2022.pdf (accessed on 1 February 2023).
  145. Finance-Commission. Fifteen Finance Commission Report for the Year 2020–2021. Available online: https://fincomindia.nic.in (accessed on 1 February 2023).
  146. CREA. Tracing the Hazy Air 2023. Progress Report on National Clean Air Programme (NCAP); Centre for Research on Energy and Clean Air: New Delhi, India, 2023. [Google Scholar]
Figure 1. (a) Built-up area in the airshed covering the NCT Delhi and its satellite cities, mapped from the Global Human Settlement program. (b) Metro rail system in Delhi and Gurugram. Black lines represent major highways, ring roads, and bypass expressways.
Sustainability 15 04209 g001
Figure 2. Annual average PM2.5 concentrations in Delhi for the period of 1989 to 2022 (left axis), no. of operational continuous ambient air quality stations reporting PM2.5 concentrations in Delhi (right axis) and data availability as % of 15 min points available in that year (calculated only for CAAQM stations) (ITO = Income tax office, New Delhi).
Sustainability 15 04209 g002
Figure 3. Reanalysed annual average PM2.5 concentrations in Delhi for the period of 1998 to 2021 using chemical transport model (GEOS–chem), ground measurements, and satellite observations from [19,34].
Sustainability 15 04209 g003
Figure 4. Summary of satellite data retrievals as an 8–day running mean of the area covering Delhi’s airshed. (a) NASA MODIS-Terra AOD for all years and all days to illustrate long-term trends. For the period of 1 March to 30 June in specific, (b) NASA MODIS-Terra AOD, (c) NASA OMI NO2, (d) ESA TROPOMI SO2, and (e) ESA TROPOMI ozone, illustrating changes during 2020’s COVID-19 lockdowns. MODIS and OMI data were extracted from NASA’s Giovanni open-access database and TROPOMI from Google Earth Engine database.
Sustainability 15 04209 g004
Figure 5. Yearly number of registered vehicles as a ratio of 1993 fleet values for 2-3-4 wheelers (2W, 3W, and 4W), taxis (4WT), buses (BUS), heavy and light duty vehicles (HLDV), and total registrations (TOTAL).
Sustainability 15 04209 g005
Figure 6. A linear prediction model for estimating the post-monsoon (October and November) paddy residue burning season fire counts over Punjab-Haryana (Lon: 74E–77E, Lat: 29N–32N) region based on the pre-burning NDVI from Aqua-MODIS.
Sustainability 15 04209 g006
Figure 7. Mapped brick kilns using Google Earth imagery for (a) 2006–08 and (b) 2021 (the extracted KML files are available via email) and (c) photograph of fuel loading at a brick kiln in Rohtak (by author).
Sustainability 15 04209 g007
Figure 8. (a) Monthly electricity demand in MU/day between 2013 and 2022. (b) Weekly electricity demand between 2019 and 2021 highlighting the COVID waves (data source: Grid Controller of India Ltd.).
Sustainability 15 04209 g008
Figure 9. (a) Summary of PM2.5 concentration ranges of all-station hourly averages for the day of and the day after Diwali in Delhi (data source: CPCB, New Delhi, India). (b) Summary of ventilation rate (wind speed * boundary layer height) from ERA5 reanalysis fields, averaged over the grids covering Delhi.
Sustainability 15 04209 g009
Table 1. Geographical and other salient characteristics of the NCT-Delhi (Data sources: Census India, Open Street Maps, Ministry of Road Transport and Highways, and Delhi Statistical reports).
CharacteristicData
Total area1500 km2
Green cover (2019)21%
Number of districts11
Number of sub-districts27
Number of municipal corporations3
Total state population19 million
Net migrant population (2011 census)2 million
Population density12,000 persons/km2
Urbanization (state)86%
GDP (per capita, 2020)US$4600
Road density2100 km/100 km2
Total registered vehicles (2021)14 million
Metro rail length350 km
Landfills3
Landfill capacity7000 tons/day
PM2.5 pollution rank (2021)4 (among world cities) [35]
PM2.5 pollution rank (2021)1 (among world capital cities) [35]
Table 2. Summary of all day (AD), daytime (DT), and nighttime (NT) averages (±standard deviations) of mixing heights (MH in m), near-surface temperature (T in °C), and near-surface wind speeds (WS in m/s) by month. Data were extracted from WRF model simulations using the NCEP reanalysis fields for the year 2018.
MH-ADMH-DTMH-NTT-DTT-NTWS-AD
JAN298 (58)557 (118)39 (8)18.9 (1.8)9.9 (1.5)2.7 (0.7)
FEB516 (94)974 (187)57 (56)24.2 (2.8)15.3 (2.5)2.8 (0.9)
MAR926 (198)1801 (393)51 (18)30.5 (2.6)19.6 (1.8)3.1 (0.6)
APR1075 (254)2066 (501)84 (45)35.5 (2.4)26.3 (2.2)3.8 (0.8)
MAY1243 (307)2377 (640)109 (60)39.4 (2.7)31.1 (1.8)3.7 (0.9)
JUN1054 (244)1855 (485)254 (124)39.0 (3.2)34.0 (2.3)4.5 (1.2)
JUL573 (240)994 (450)153 (85)33.9 (2.9)30.6 (2.1)3.1 (0.7)
AUG505 (152)906 (269)104 (58)33.0 (2.1)29.3 (1.3)2.7 (0.7)
SEP462 (123)827 (239)97 (105)31.4 (2.2)26.5 (1.1)2.8 (0.9)
OCT501 (91)959 (184)43 (13)30.0 (1.6)21.8 (1.8)2.5 (0.5)
NOV350 (73)651 (129)50 (33)25.3 (1.5)17.5 (1.9)2.7 (0.7)
DEC286 (71)534 (140)38 (8)18.8 (2.2)11.1 (2.8)2.4 (0.6)
Table 3. Monthly and annual average PM2.5 concentrations in Delhi for the period of 2006 to 2022 in μg/m3 from the continuous ambient air quality monitoring network.
YearJANFEBMARAPRMAYJUNJULAUGSEPOCTNOVDECAnnual
2006 74168217203171.0
2007253146881097389453252145 188111.1
2008156178136907350512223174226189138.6
200914512391686573554337163 91.5
2010 6911682115117616065187292267144.1
20112171611231279870695361164258277140.1
2012205141139101122 695870147263179140.3
2013190128148105129126668595145212106125.3
201419312369981201371148774137166161117.2
20151791249610112097675890153243177125.3
20162491511261209273564261152258217133.3
2017164134969612260363758135268200117.2
2018205143104949586424345139209236120.0
201919012383818863463439114187203105.0
20201481205744544634244713219919093.0
20211871509686535339413274230191106.0
202215010398106786235324010617817199.7
Table 4. Summary of source contributions to ambient PM2.5 concentrations in Delhi, estimated by studies published between 1990 and 2022.
StudyStudy YearYear of PublicationSource Information and Other Remarks
CPCB white paper [1]1970–71
1980–81
1990–91
1997Industrial–vehicular–domestic source contributions were reported as 56%–23%–21%, 40%–42%–18%, and 29%–64%–7% respectively.

This is the first known official account of source contributions in Delhi. The industrial sources include power plants, and no other sources were mentioned as part of the source apportionment. There is no mention of the technique utilised for this assessment. From the description provided in the report, this apportionment is likely for ambient PM10 concentrations.
CPCB six-city study [2]20062011For Delhi’s PM10 samples, average contributions were all dust (45.5%), domestic cooking and heating (7%), garbage burning (16.6%), and industries + diesel gensets (17.2%).

However, the published results for PM2.5 were difficult to accept with domestic use of LPG resulting in 45.4% of the total mass. Relevant pages from the official report are included in the Supplementary Materials for reference.

PM2.5 and PM10 samples were collected at residential, industrial, and kerbside locations for multiple seasons. The study also included establishing a gridded emissions inventory and a database of emission factors for other cities to adapt. The total emission loads were calculated for a representative grid of 2 km × 2 km and extrapolated to the city size of 32 km × 32 km. The estimated PM2.5 emission load is 53.6 kt/year.
SAFAR2010
&
2018
2011SAFAR was developed by IITM for the 2010 CWG. The reports did not include any apportionment for ambient concentrations.

The program conducted a series of surveys and on-ground measurements to develop an emission inventory at 1.67 km × 1.67 km and updated to 400 m × 400 m resolution in 2018. Total PM2.5 emission loads in 2010 and 2018 were 94 kt and 108 kt, respectively. The % shares of key sectors were 32% and 39% for transport, 17% and 23% for industries, 28% and 18% for all dust, 18% and 6% for residential cooking and heating, 3% and 3% for power plants, 2% and 12% for others, respectively.
Urban Emissions (authors) [14,18]20102013Emission and ATMoS Lagrangian model-based source contributions for PM2.5 ranged 16–30% for vehicle exhaust, 8–14% for road dust + construction dust, 20–27% for diffused sources including cooking, heating, and open waste burning, 3–17% for diesel generator sets, and 34–41% for industries including brick kilns and power plants.

Emissions inventory covered an airshed of 52 km × 52 km around Delhi. The estimated PM2.5 emission load is 63 kt/year. The inventory was extended to an area covering 80 km × 80 km (Figure 1) and utilised for short-term (3-day) air quality forecasting and validating against monitoring data every hour.
DPCC—IIT KanpurWinter 2013–14
and
Summer
2014
2016Receptor-model-based source contributions for PM2.5 in winter–summer months were 25–9% for vehicle exhaust, 6–31% for all dust, 8–7% for open waste burning, 5–26% for industrial coal and fly ash, 26–12% for biomass burning, and 30–15% for secondary PM component, respectively.

The estimated PM2.5 emission load was 21.5 kt/year for Delhi city. Emission and CTM model-based simulations were conducted, but no contribution shares were published.
GAINS [70]20152017Emissions and CTM-based source contributions for PM2.5 were 8.7% for vehicle exhaust, 17.4% for cooking, 19.1% for all dust, 16.5% for industries including power plants, open waste burning 6.1%, agricultural waste burning 4.3%, Diwali fireworks 1–2%, and 24.3% for secondary PM.

The study also estimated that 60% of the estimated PM2.5 originates outside Delhi administrative limits.
TERI [71]Summer and Winter
2016
2018Receptor-model-based source contributions for PM2.5 in summer–winter months were 18–23% for all transport, 34–15% for all dust, 15–22% for all biomass, 11–10% for industry, 5–4% other sources, and 17–23% secondary PM component, respectively.

Emission and CTM model-based source contributions for PM2.5 in summer–winter months were 17–28% for all transport, 38–17% for all dust, 8–10% for residential cooking, 7–4% for agricultural waste burning, 22–30% for industry, and 8–10% for other sources. Total estimated PM2.5 emission load is 32 kt/year for Delhi and 528 kt/year for the NCR Delhi.

For receptor modelling, 24 h PM2.5 and PM10 samples were collected at 20 representative locations in Delhi and its satellite cities. For emissions modelling, the study included updates to activity levels, source profiles and emission factors.
GBD-MAPS [19,34]20172021Global emission and CTM model-based source contributions for PM2.5 were 29% for all residential cooking and heating, 7% for vehicle exhaust, 25% for industry including power plants, 15% all dust, 3% open waste burning, 2% agricultural waste burning, and 19% others.

The Global Burden of Disease (GBD) study (since 1990) quantifies impacts of over 300 diseases and risk factors by age and sex [28] (https://www.healthdata.org/gbd, accessed 22 February 2023). An extension to the program is GBD-MAPS (mapping air pollution sources), which uses the same global chemical transport model to apportion sources. Because of the coarse nature of the model, the data were extracted for the grid covering the Delhi city.
Gupta et al., 2023 [72]2018–192023Receptor-model-based source contributions for PM2.5 were 17–28% for all transport, 16–30% for all dust, 14–31% for mixed combustion including biomass, 12–25% for industries, and 17–33% secondary PM component, respectively.

PM2.5 and PM10 457 samples were collected at two locations in Ghaziabad (one of the prominent satellite cities of Delhi) for one year from June 2018 to May 2019.
Gani et al., 2020 [5]; Bhandari et al., 2021 [22]; Rai et al., 2020 [23]; Tobler et al., 2020 [73]2019–202020–21These studies used new techniques, equipment, and analytical platforms that allow for real-time sampling, metal and ion speciation, and receptor modelling to ascertain source contributions. Applications in Delhi used aerosol chemical speciation monitors (ACSMs), scanning mobility particle sizers (SMPSs), aerosol mass spectrometers (AMSs) and Xact ambient metals monitors (XACTs). These systems provide information at a higher temporal resolution and avoid the risk of contamination that is associated with offline measurements, storage, and analysis of filters. However, this approach was limited to only one (IIT-Delhi campus) location, PM1 fractions, and chemical speciation, and continues to be mostly academic in nature due to higher equipment costs and unique expertise required to operate them.
DPCC [21]20232023This real-time source apportionment system was launched in January 2023 (http://raasman.com, accessed 22 February 2023). No long-term data were available at the time of the review. Receptor-model-based source contributions for PM2.5 for three days in January 2023 were 4–24% for all transport, 10–18% for all dust, 13–30% for all biomass, 5–7% for coal combustion, 2–6% open waste burning, and 30–34% secondary PM component.
Table 5. Consolidated source contributions to annual average PM2.5 concentrations across Delhi.
Sector/Source Category% Annual Contribution Range
Vehicle exhaust from petrol, diesel, and gas combustion10–30%
Dust from roads and construction activities10–30%
Industrial sources, including power plants10–30%
Residential cooking and heating activitiesUnder 10% in summer and under 30% in winter
Open waste burning5–15%
Power plants (mostly outside city limits)Under 7%
Dust storms as a seasonal regional sourceUnder 5%
Agricultural residue burning as a seasonal, regional short-term sourceUnder 3%
Diwali firecrackers as a 2-day extreme event sourceUnder 1%
Table 6. Summary of power plant operations in the immediate vicinity of Delhi—plant name, installed generation capacity (MW), actual annual generation (MU) from 2013 to 2022, and annual average plant load factor (%) (data source: Grid Controller of India Ltd.).
PlantMW2013201420152016201720182019202020212022
Badarpur TPS7054317
(71%)
3768
(62%)
2359
(39%)
2087
(34%)
1559
(26%)
1400
(23%)
Dadri NCTPP182013,007
(83%)
12,786
(81%)
10,319
(66%)
9936
(63%)
8880
(56%)
10,870
(69%)
7411
(47%)
3494
(22%)
5824
(37%)
8671
(60%)
Dadri CCPP8303404
(47%)
2645
(37%)
2960
(41%)
2620
(37%)
1741
(24%)
1491
(21%)
1771
(25%)
2107
(29%)
885
(12%)
659
(10%)
Faridabad CCPP4321679
(45%)
1586
(43%)
1360
(36%)
986
(26%)
839
(22%)
560
(15%)
648
(17%)
849
(23%)
355
(10%)
Indraprastha CCPP2701070
(46%)
975
(42%)
593
(25%)
622
(27%)
621
(27%)
607
(26%)
525
(22%)
462
(20%)
224
(10%)
309
(14%)
Indira Gandhi STPP15005272
(41%)
6657
(51%)
6178
(48%)
5808
(45%)
6702
(52%)
7638
(59%)
4712
(36%)
2594
(20%)
6916
(53%)
7684
(65%)
Mahatma Gandhi TPS13205735
(50%)
6256
(55%)
5764
(51%)
3163
(28%)
5823
(51%)
7181
(63%)
6222
(55%)
4706
(41%)
7889
(69%)
7055
(67%)
Panipat TPS13606234
(53%)
4421
(38%)
1890
(16%)
2241
(26%)
2404
(30%)
3372
(42%)
2337
(29%)
916
(14%)
2310
(38%)
4562
(81%)
Pragati CCGT-III1500999
(11%)
1612
(12%)
2041
(16%)
1948
(15%)
2819
(22%)
3698
(29%)
3765
(29%)
3374
(26%)
3340
(26%)
2558
(22%)
Pragati CCPP3302469
(86%)
2061
(72%)
1695
(59%)
1716
(60%)
1791
(63%)
1782
(62%)
1391
(49%)
1555
(54%)
1547
(54%)
1074
(41%)
Rajghat TPS135555
(48%)
367
(31%)
130
(11%)
Rajiv Gandhi TPS12004577
(44%)
4940
(48%)
4637
(45%)
4431
(43%)
3828
(37%)
5216
(50%)
2081
(20%)
1528
(15%)
2286
(22%)
5450
(57%)
Rithala CCPP1087
(1%)
Yamuna Nagar TPS6003291
(63%)
3610
(70%)
3812
(74%)
3889
(75%)
3362
(65%)
2975
(57%)
3380
(65%)
2032
(39%)
2543
(49%)
4019
(85%)
Disclaimer/Publisher’s Note: The statements, opinions and data contained in all publications are solely those of the individual author(s) and contributor(s) and not of MDPI and/or the editor(s). MDPI and/or the editor(s) disclaim responsibility for any injury to people or property resulting from any ideas, methods, instructions or products referred to in the content.

