
Effects of Nitrogen Source and Concentration on the Growth and Biochemical Composition of the Red Seaweed Grateloupia turuturu (Halymeniaceae, Rhodophyta)

Abstract
:1. Introduction
2. Materials and Methods
2.1. Algal Collection and Laboratory Acclimation
2.2. Culture Experiment
2.3. Measurements of Relative Growth Rate
2.4. Measurements of Total and Inorganic Nitrogen
2.5. Measurement of Soluble Protein
2.6. Measurement of Free Amino Acids
2.7. Measurements of Chlorophyll a (Chl a) and Phycoerythrin (PE)
2.8. Data Analysis
3. Results
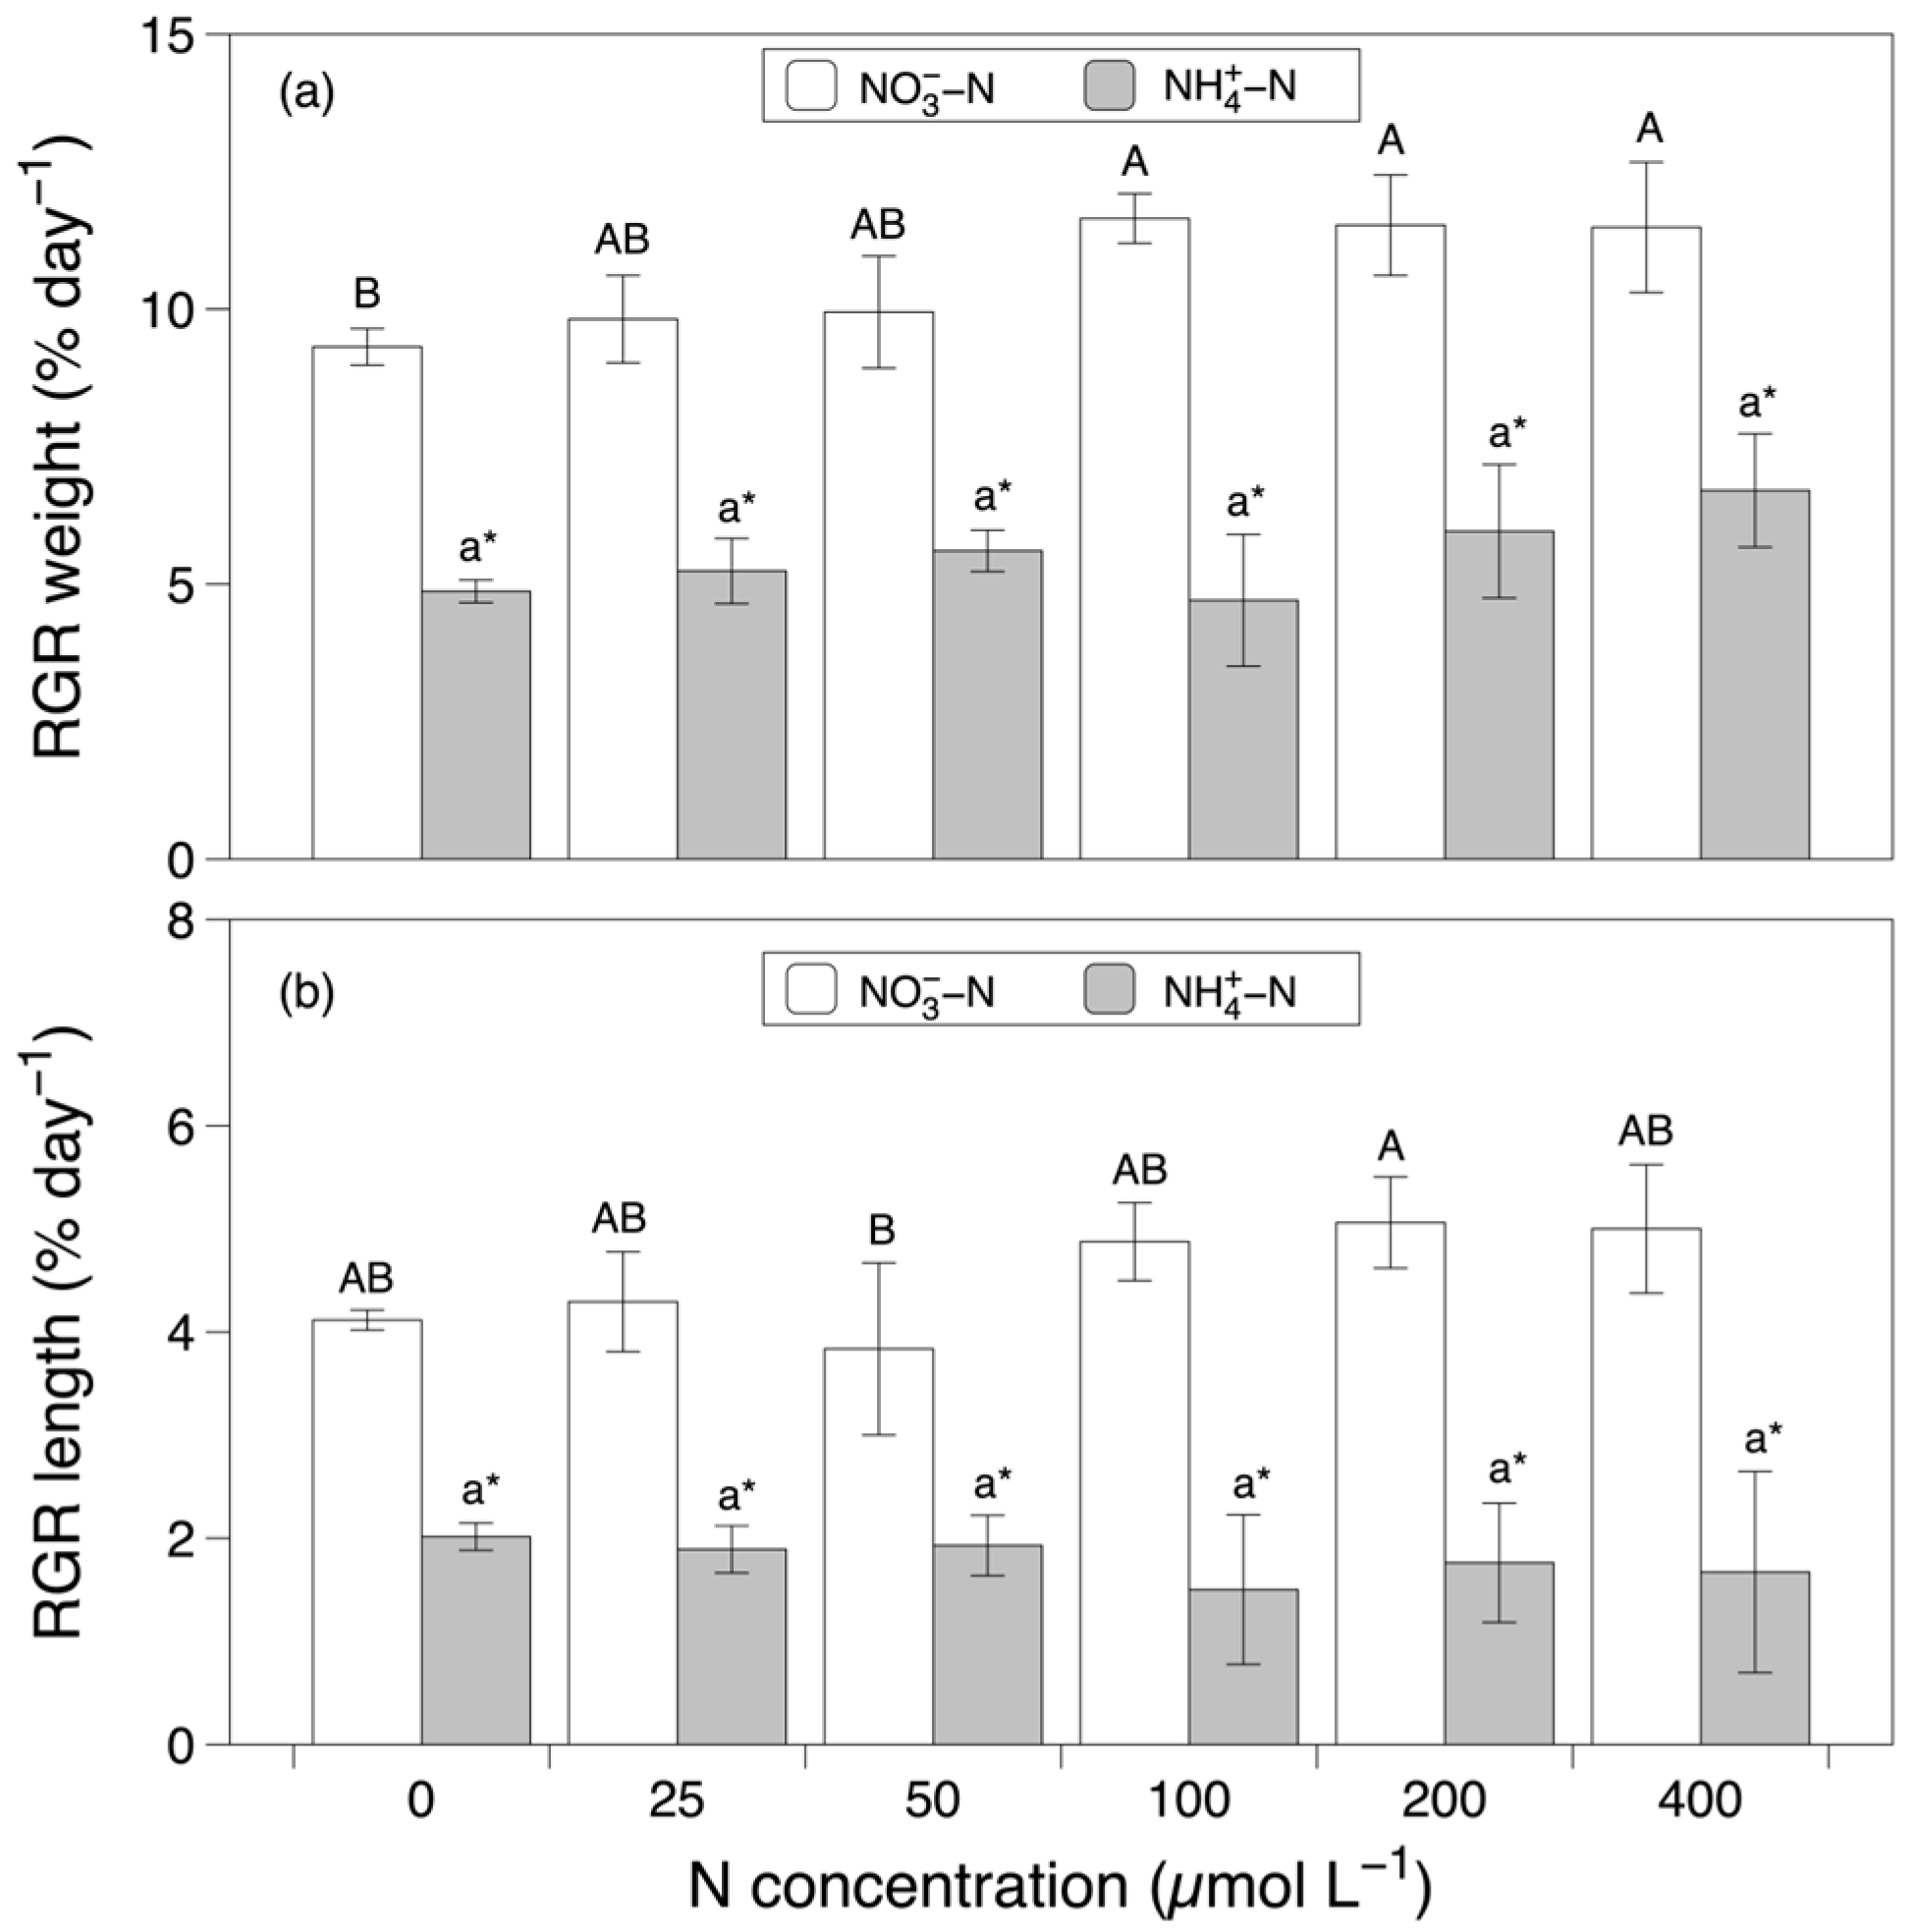
3.1. Growth
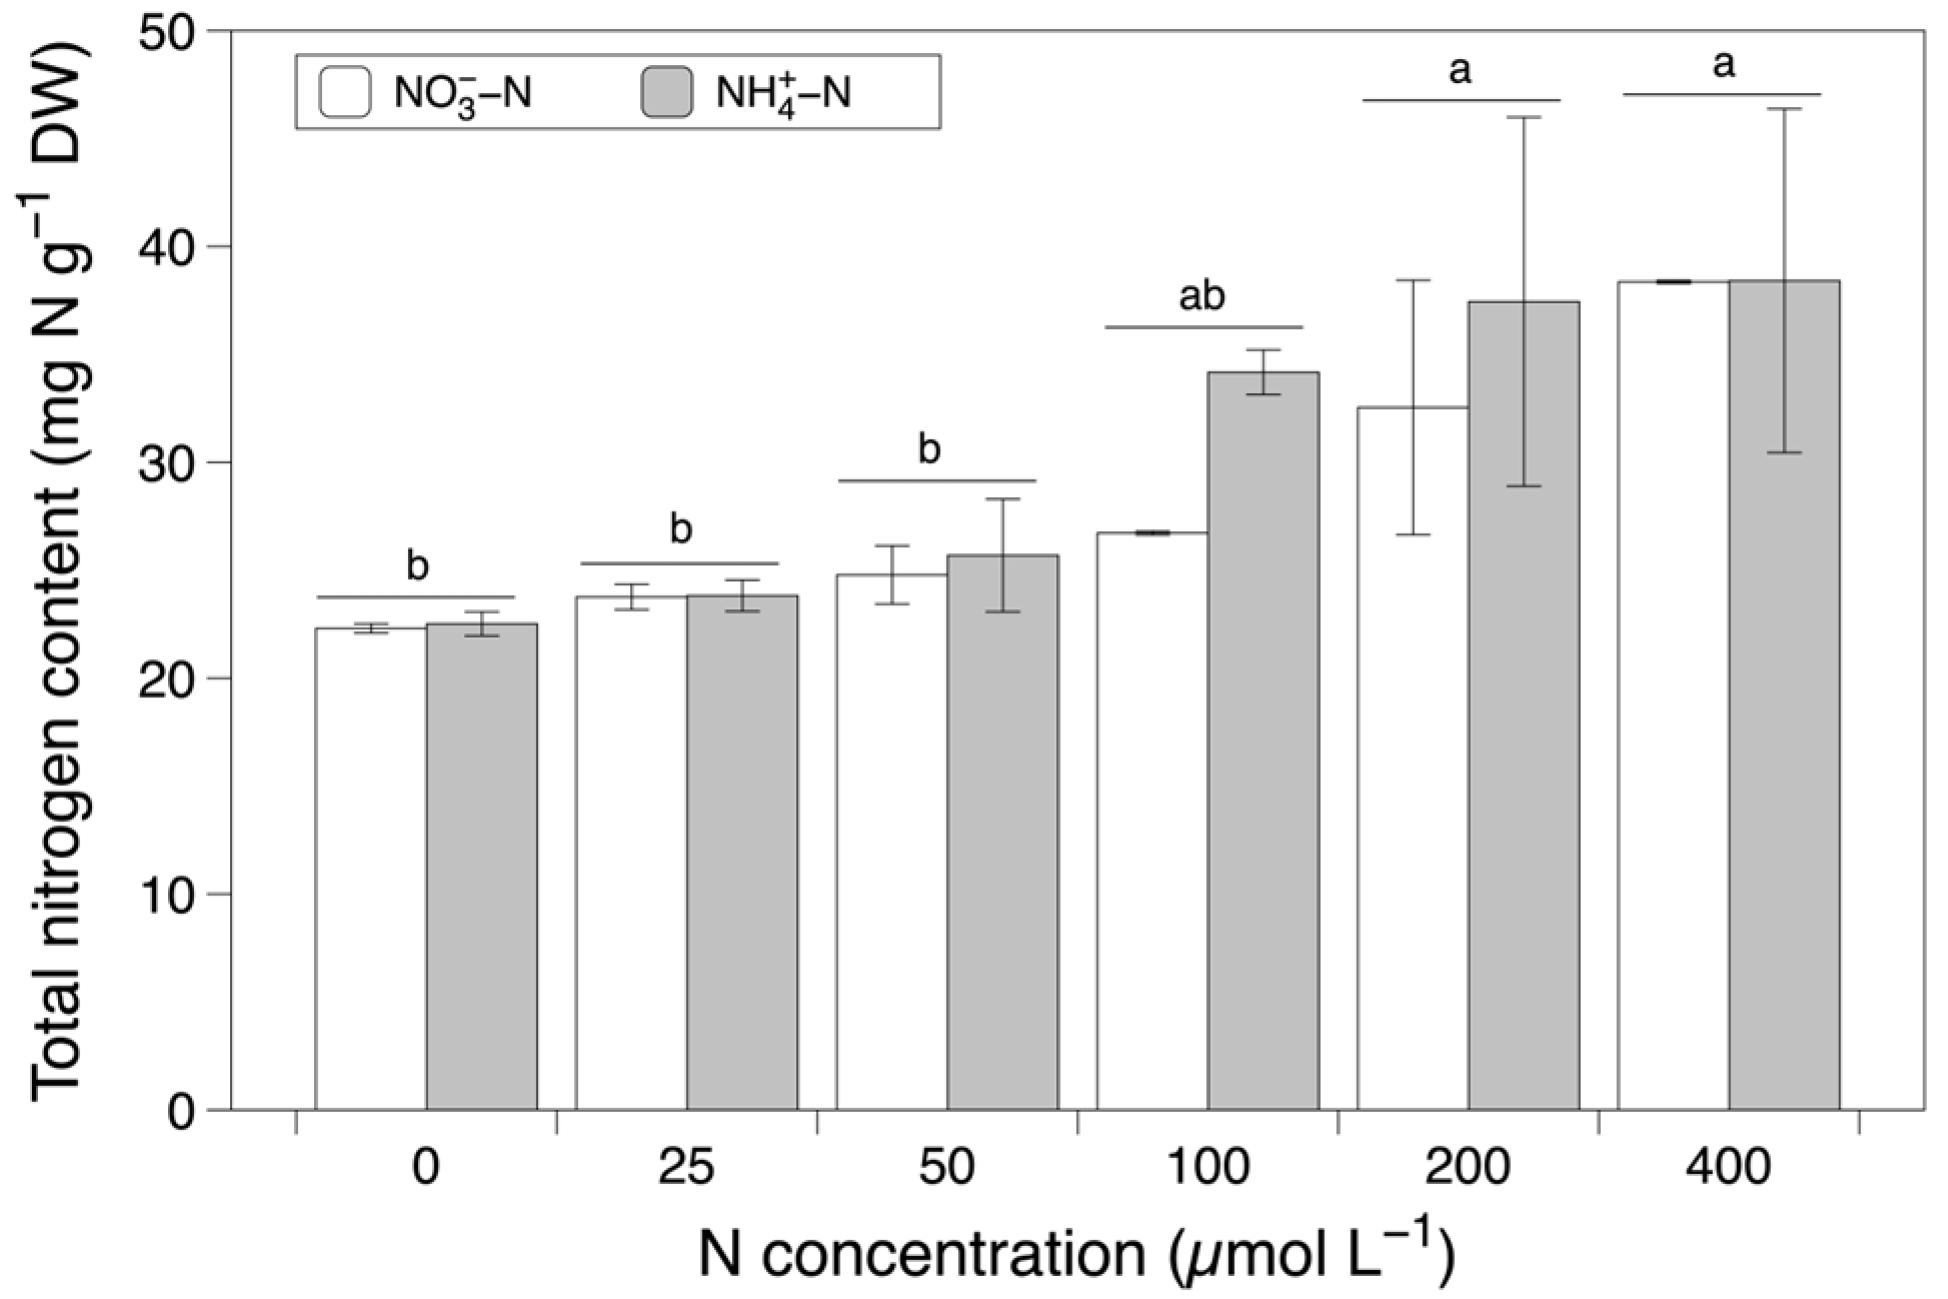
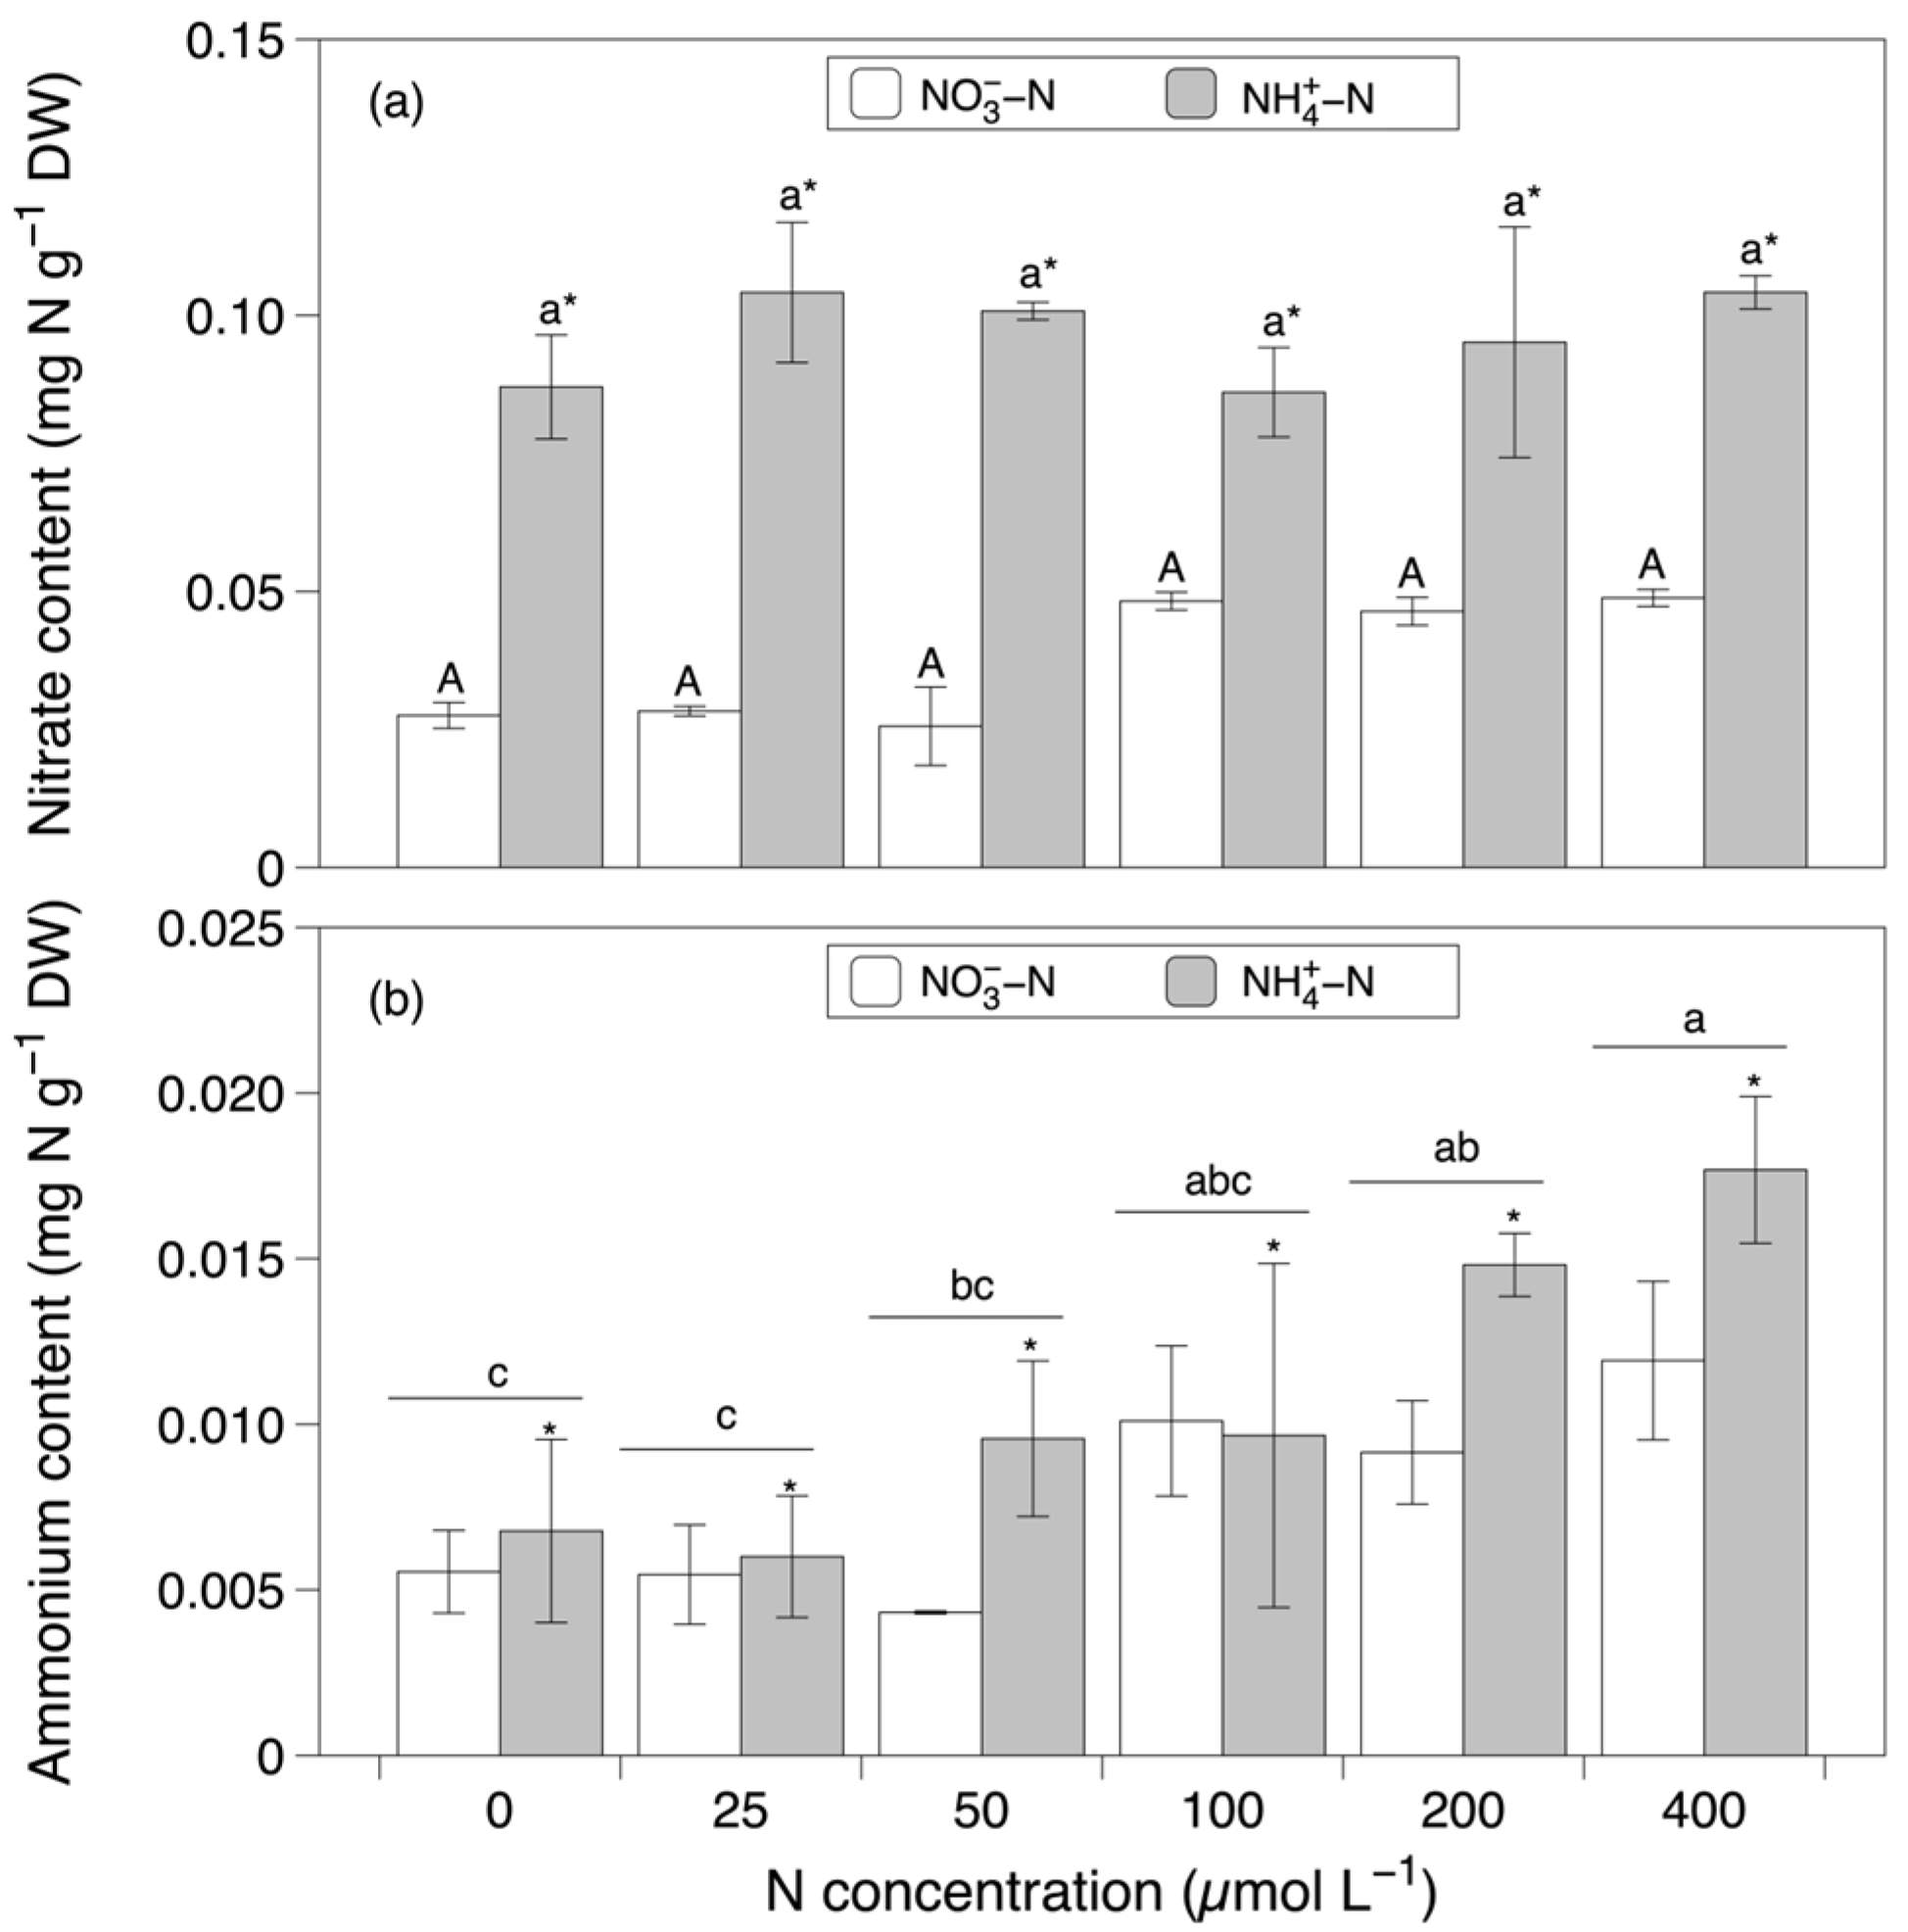
3.2. Total and Inorganic Nitrogen
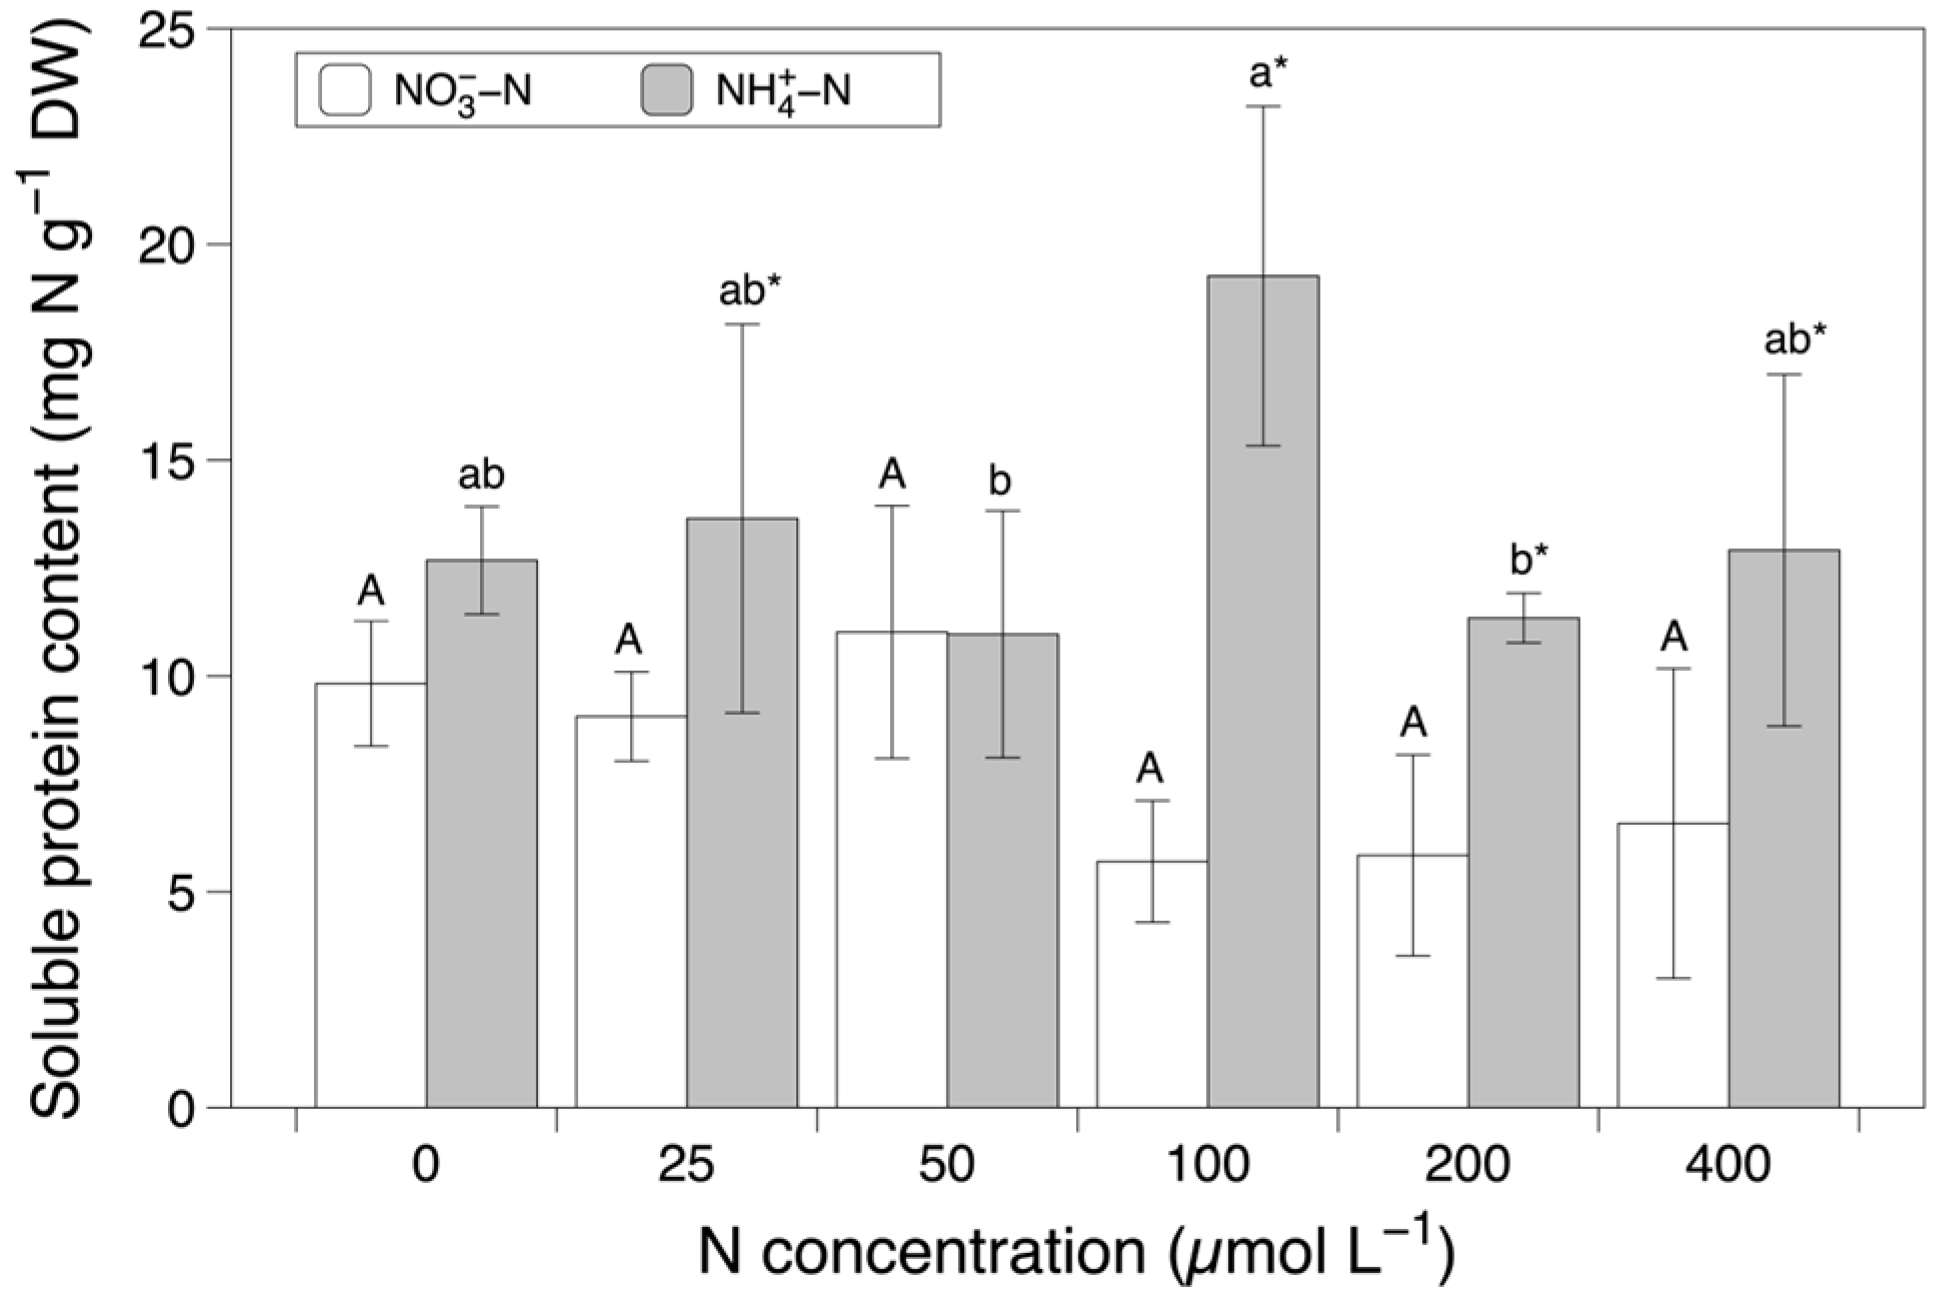
3.3. Soluble Protein
3.4. Free Amino Acids
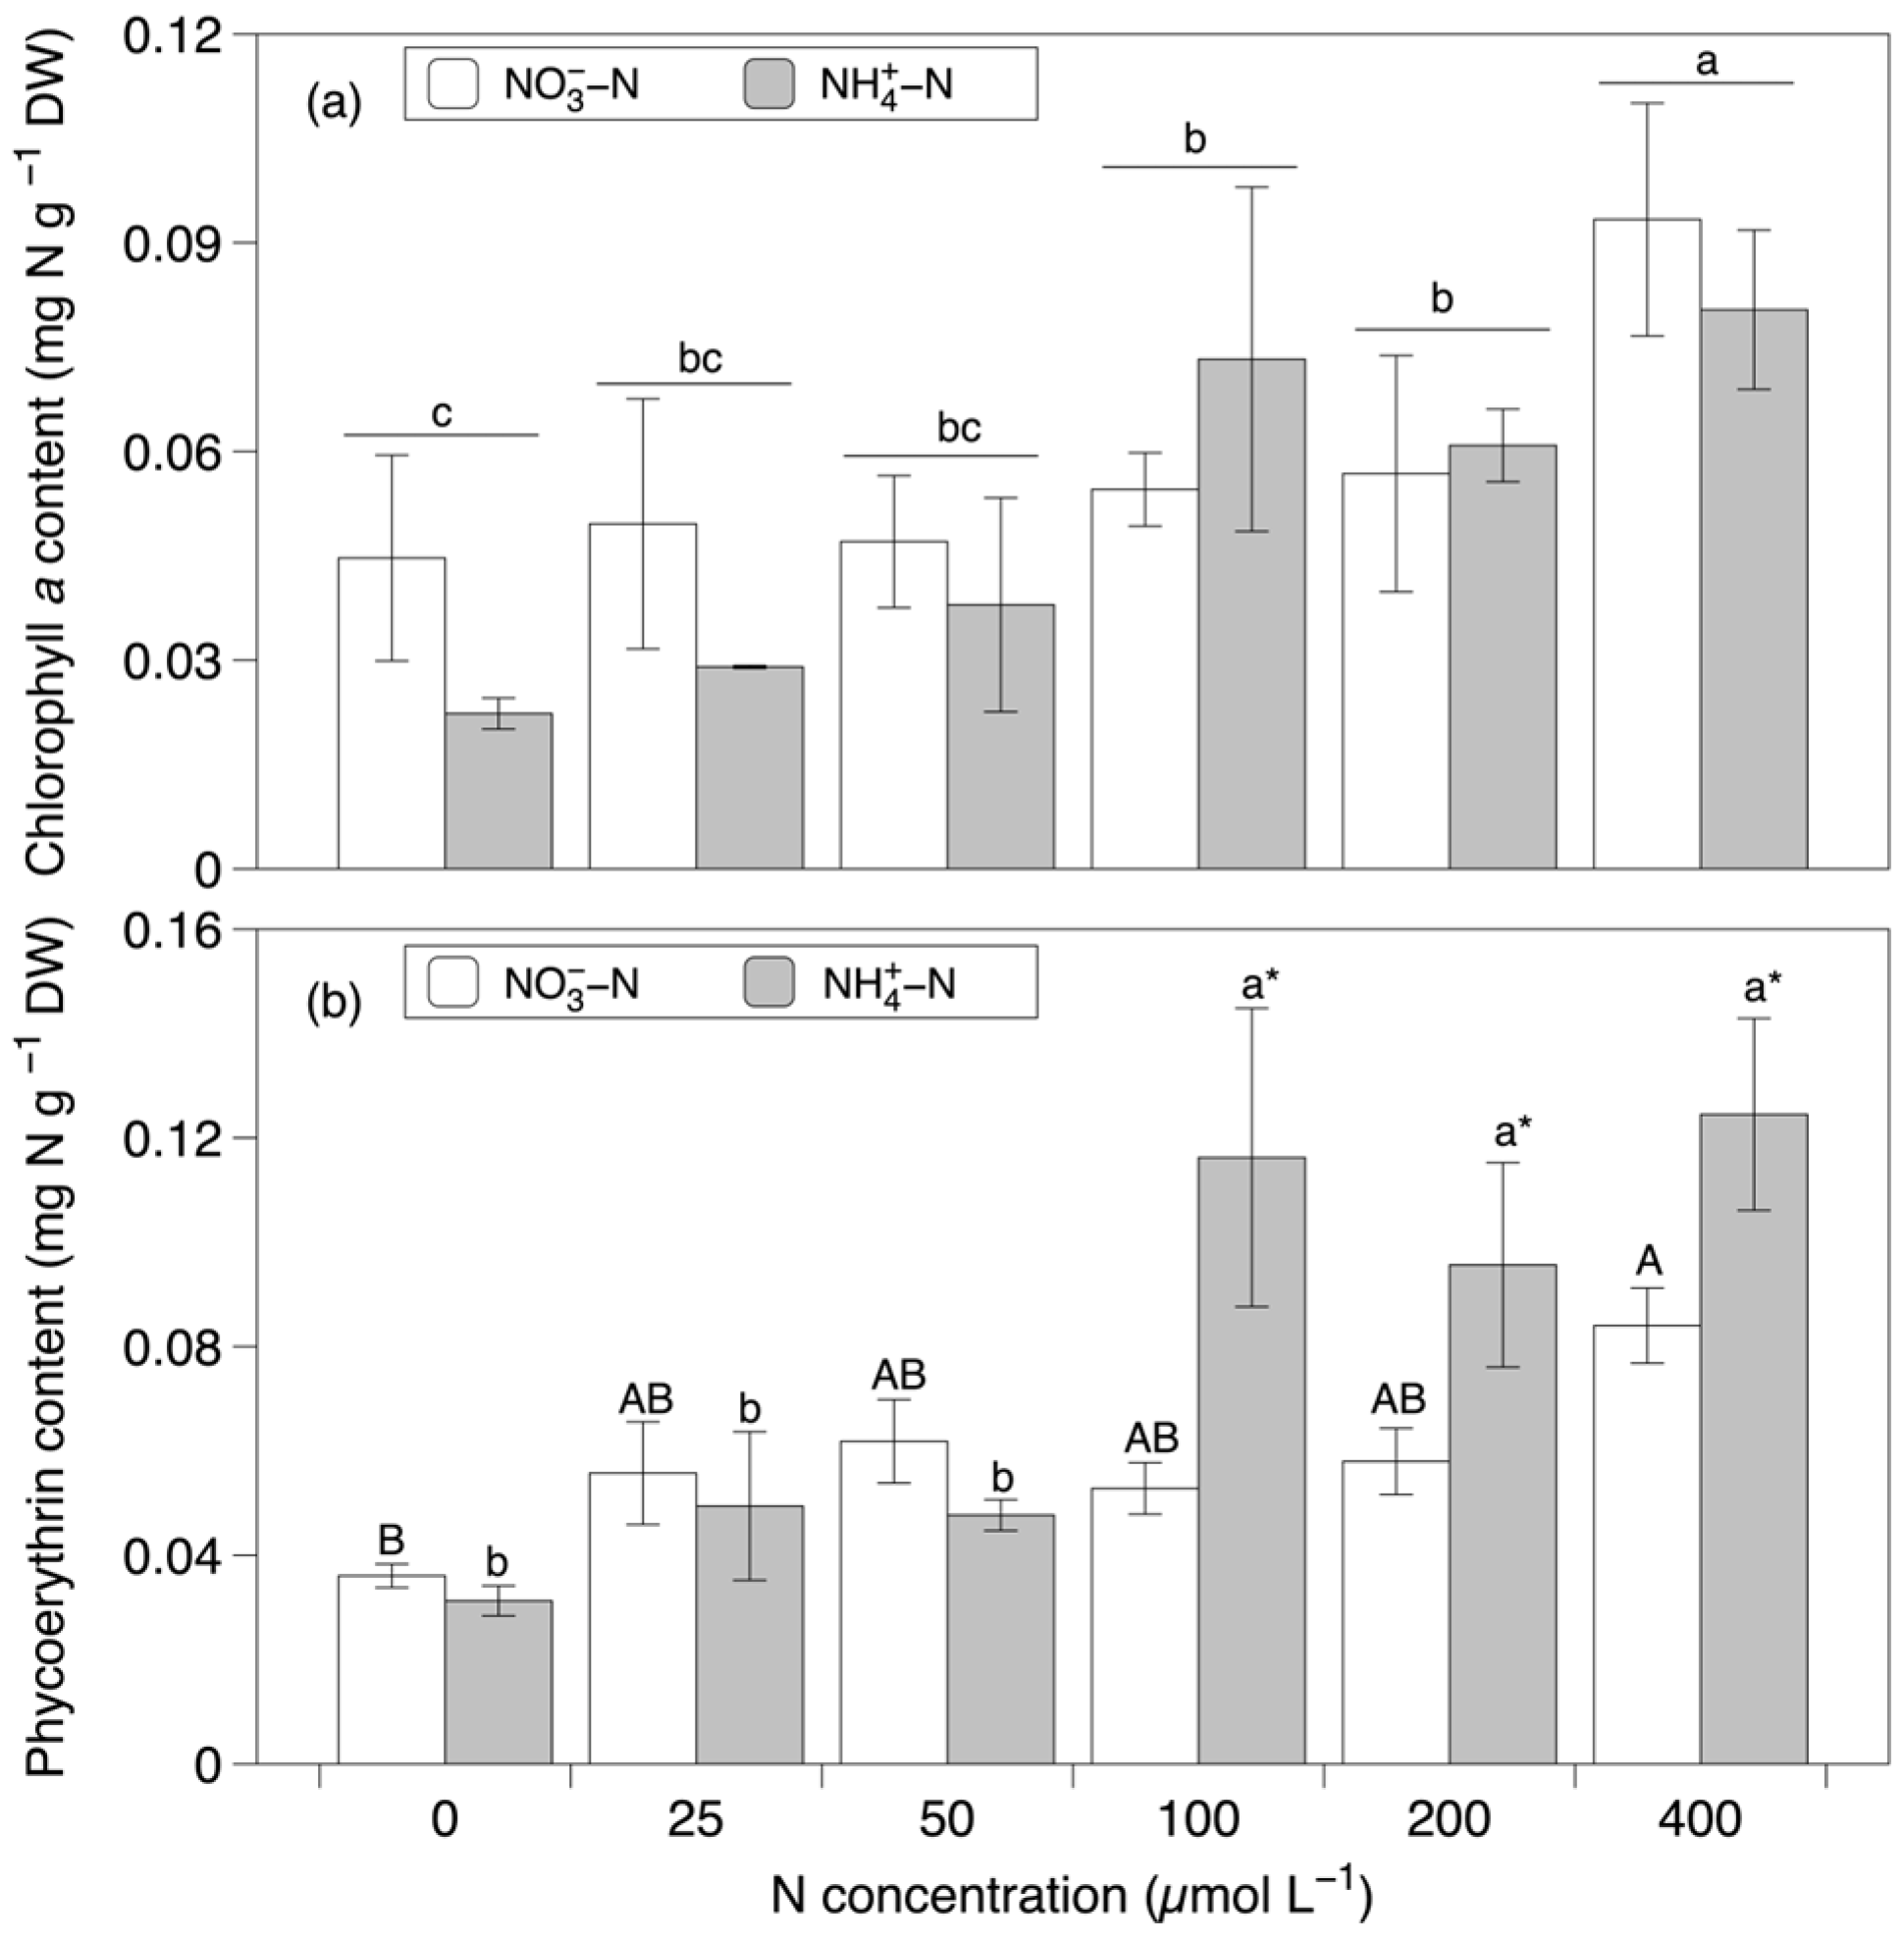
3.5. Chl a and PE
3.6. Allocation of Nitrogen Pools
4. Discussion
5. Conclusions
Author Contributions
Funding
Institutional Review Board Statement
Informed Consent Statement
Data Availability Statement
Acknowledgments
Conflicts of Interest
References
- Le Moal, M.; Gascuel-Odoux, C.; Menesguen, A.; Souchon, Y.; Etrillard, C.; Levain, A.; Moatar, F.; Pannard, A.; Souchu, P.; Lefebvre, A.; et al. Eutrophication: A new wine in an old bottle? Sci. Total Environ. 2019, 651, 1–11. [Google Scholar] [CrossRef] [Green Version]
- Selman, M.; Greenhalgh, S. Eutrophication: Sources and drivers of nutrient pollution. Renew. Resour. J. 2010, 26, 19–26. [Google Scholar]
- Huang, C.; Wang, X.; Yang, H.; Li, Y.; Wang, Y.; Chen, X.; Xu, L. Satellite data regarding the eutrophication response to human activities in the plateau lake Dianchi in China from 1974 to 2009. Sci. Total Environ. 2014, 485–486, 1–11. [Google Scholar] [CrossRef]
- Anderson, D.M.; Glibert, P.M.; Burkholder, J.M. Harmful algal blooms and eutrophication: Nutrient sources, composition, and consequences. Estuaries 2002, 25, 704–726. [Google Scholar] [CrossRef]
- Bruno, J.F.; Petes, L.E.; Harvell, C.D.; Hettinger, A. Nutrient enrichment can increase the severity of coral diseases. Ecol. Lett. 2003, 6, 1056–1061. [Google Scholar] [CrossRef]
- Smith, V.H. Eutrophication of freshwater and coastal marine ecosystems a global problem. Environ. Sci. Pollut. Res. 2003, 10, 126–139. [Google Scholar] [CrossRef]
- Malone, T.C.; Newton, A. The globalization of cultural eutrophication in the coastal ocean: Causes and consequences. Front. Mar. Sci. 2020, 7, 670. [Google Scholar] [CrossRef]
- Neori, A.; Chopin, T.; Troell, M.; Buschmann, A.H.; Kraemer, G.P.; Halling, C.; Shpigel, M.; Yarish, C. Integrated aquaculture: Rationale, evolution and state of the art emphasizing seaweed biofiltration in modern mariculture. Aquaculture 2004, 231, 361–391. [Google Scholar] [CrossRef]
- Ben-Ari, T.; Neori, A.; Ben-Ezra, D.; Shauli, L.; Odintsov, V.; Shpigel, M. Management of Ulva lactuca as a biofilter of mariculture effluents in IMTA system. Aquaculture 2014, 434, 493–498. [Google Scholar] [CrossRef]
- Cahill, P.L.; Hurd, C.L.; Lokman, M. Keeping the water clean—Seaweed biofiltration outperforms traditional bacterial biofilms in recirculating aquaculture. Aquaculture 2010, 306, 153–159. [Google Scholar] [CrossRef]
- Liu, H.; Wang, F.; Wang, Q.; Dong, S.; Tian, X. A comparative study of the nutrient uptake and growth capacities of seaweeds Caulerpa lentillifera and Gracilaria lichenoides. J. Appl. Phycol. 2016, 28, 3083–3089. [Google Scholar] [CrossRef]
- Buck, B.H.; Troell, M.F.; Krause, G.; Angel, D.L.; Grote, B.; Chopin, T. State of the art and challenges for offshore integrated multi-trophic aquaculture (IMTA). Front. Mar. Sci. 2018, 5, 165. [Google Scholar] [CrossRef]
- Chopin, T.; Robinson, S.M.C.; Troell, M.; Neori, A.; Buschmann, A.H.; Fang, J. Multitrophic integration for sustainable marine aquaculture. In The Encyclopedia of Ecology, Ecological Engineering; Jørgensen, S.E., Fath., B.D., Eds.; Elsevier: Oxford, UK, 2008; Volume 3, pp. 2463–2475. [Google Scholar]
- Chopin, T.; Neori, A.; Buschmann, A.; Pang, S.; Sawhney, M. Diversification of the aquaculture sector: Seaweed cultivation, integrated multi-trophic aquaculture, integrated sequential biorefineries. Glob. Aquacult. Advocate 2011, 14, 58–60. [Google Scholar]
- Howarth, R.W.; Marino, R. Nitrogen as the limiting nutrient for eutrophication in coastal marine ecosystems: Evolving views over three decades. Limnol. Oceanogr. 2006, 51, 364–376. [Google Scholar] [CrossRef] [Green Version]
- Paerl, H.W. Why does N-limitation persist in the world’s marine waters? Mar. Chem. 2018, 206, 1–6. [Google Scholar] [CrossRef]
- Wang, B.; Xin, M.; Wei, Q.; Xie, L. A historical overview of coastal eutrophication in the China Seas. Mar. Pollut. Bull. 2018, 136, 394–400. [Google Scholar] [CrossRef] [PubMed]
- Nelson, S.G.; Glenn, E.P.; Conn, J.; Moore, D.; Walsh, T.; Akutagawa, M. Cultivation of Gracilaria parvispora (Rhodophyta) in shrimp-farm effluent ditches and floating cages in Hawaii: A two-phase polyculture system. Aquaculture 2001, 193, 239–248. [Google Scholar] [CrossRef]
- Li, H.-M.; Zhang, C.-S.; Han, X.-R.; Shi, X.-Y. Changes in concentrations of oxygen, dissolved nitrogen, phosphate, and silicate in the southern Yellow Sea, 1980–2012: Sources and seaward gradients. Estuar. Coast. Shelf Sci. 2015, 163, 44–55. [Google Scholar] [CrossRef]
- Hurd, C.L.; Harrison, P.J.; Bischof, K.; Lobban, C.S. Seaweed Ecology and Physiology, 2nd ed.; Cambridge University Press: Cambridge, UK, 2014; 551p. [Google Scholar]
- Gruber, N. Chapter 1—The marine nitrogen cycle: Overview and challenges. In Nitrogen in the Marine Environment, 2nd ed.; Capone, D.G., Bronk, D.A., Mulholland, M.R., Carpenter, E.J., Eds.; Academic Press: San Diego, CA, USA, 2008; pp. 1–50. [Google Scholar]
- Fong, P. Chapter 20—Macroalgal-dominated ecosystems. In Nitrogen in the Marine Environment, 2nd ed.; Capone, D.G., Bronk, D.A., Mulholland, M.R., Carpenter, E.J., Eds.; Academic Press: San Diego, CA, USA, 2008; pp. 917–947. [Google Scholar]
- Taylor, M.W.; Barr, N.G.; Grant, C.M.; Rees, T.A.V. Changes in amino acid composition of Ulva intestinalis (Chlorophyceae) following addition of ammonium or nitrate. Phycologia 2006, 45, 270–276. [Google Scholar] [CrossRef]
- Pritchard, D.W.; Hurd, C.L.; Beardall, J.; Hepburn, C.D. Restricted use of nitrate and a strong preference for ammonium reflects the nitrogen ecophysiology of a light-limited red alga. J. Phycol. 2015, 51, 277–287. [Google Scholar] [CrossRef]
- Shahar, B.; Shpigel, M.; Barkan, R.; Masasa, M.; Neori, A.; Chernov, H.; Salomon, E.; Kiflawi, M.; Guttman, L. Changes in metabolism, growth and nutrient uptake of Ulva fasciata (Chlorophyta) in response to nitrogen source. Algal Res. 2020, 46, 101781. [Google Scholar] [CrossRef]
- Kim, G.; Mujtaba, G.; Lee, K. Effects of nitrogen sources on cell growth and biochemical composition of marine chlorophyte Tetraselmis sp. for lipid production. Algae 2016, 31, 257–266. [Google Scholar] [CrossRef] [Green Version]
- Roopnarain, A.; Sym, S.; Gray, V.M. Effect of nitrogenous resource on growth, biochemical composition and ultrastructure of Isochrysis galbana (Isochrysidales, Haptophyta). Phycol. Res. 2015, 63, 43–50. [Google Scholar] [CrossRef]
- DeBoer, J.A.; Guigli, H.J.; Israel, T.L.; D’Elia, C.F. Nutritional studies of two red algae. I. Growth rate as a function of nitrogen source and concentration. J. Phycol. 1978, 14, 261–266. [Google Scholar] [CrossRef]
- Chapman, A.R.O.; Markham, J.W.; Lüning, K. Effects of nitrate concentration on the growth and physiology of Laminaria saccharia (Phaeophyta) in culture. J. Phycol. 1978, 14, 195–198. [Google Scholar] [CrossRef]
- Gordon, D.M.; Birch, P.B.; McComb, A.J. Effects of inorganic phosphorus and nitrogen on the growth of an estuarine Cladophora in Culture. Bot. Mar. 1981, 24, 93–106. [Google Scholar] [CrossRef] [Green Version]
- Gao, G.; Clare, A.S.; Rose, C.; Caldwell, G.S. Eutrophication and warming-driven green tides (Ulva rigida) are predicted to increase under future climate change scenarios. Mar. Pollut. Bull. 2017, 114, 439–447. [Google Scholar] [CrossRef] [Green Version]
- Gao, G.; Gao, Q.; Bao, M.; Xu, J.; Li, X. Nitrogen availability modulates the effects of ocean acidification on biomass yield and food quality of a marine crop Pyropia yezoensis. Food Chem. 2019, 271, 623–629. [Google Scholar] [CrossRef]
- Chen, B.; Zou, D.; Ma, J. Interactive effects of elevated CO2 and nitrogen–phosphorus supply on the physiological properties of Pyropia haitanensis (Bangiales, Rhodophyta). J. Appl. Phycol. 2015, 28, 1235–1243. [Google Scholar] [CrossRef]
- Chu, Y.; Liu, Y.; Li, J.; Gong, Q. Effects of elevated pCO2 and nutrient enrichment on the growth, photosynthesis, and biochemical compositions of the brown alga Saccharina japonica (Laminariaceae, Phaeophyta). PeerJ 2019, 7, e8040. [Google Scholar] [CrossRef] [Green Version]
- Cabello-Pasini, A.; Figueroa, F.L. Effect of nitrate concentration on the relationship between photosynthetic oxygen evolution and electron transport rate in Ulva rigida (Chlorophyta). J. Phycol. 2005, 41, 1169–1177. [Google Scholar] [CrossRef]
- Nederlof, M.A.J.; Neori, A.; Verdegem, M.C.J.; Smaal, A.C.; Jansen, H.M. Ulva spp. performance and biomitigation potential under high nutrient concentrations: Implications for recirculating IMTA systems. J. Appl. Phycol. 2022, 34, 2157–2171. [Google Scholar] [CrossRef]
- Chu, Y.; Liu, Y.; Li, J.; Wang, Q.; Gong, Q. Nutrient enrichment regulates the growth and physiological responses of Saccharina japonica to ocean acidification. J. Ocean Univ. China 2020, 19, 895–901. [Google Scholar] [CrossRef]
- McGlathery, K.J.; Pedersen, M.F.; Borum, J. Changes in intracellular nitrogen pools and feedback controls on nitrogen uptake in Chaetomorphy linum (Chlorophyta). J. Phycol. 1996, 32, 393–401. [Google Scholar] [CrossRef]
- Liu, J.-W.; Dong, S.-L. Comparative studies on utilizing nitrogen capacity between two macroalgae Gracilaria tenuistipitata var. liui (Rhodophyta) and Ulva pertusa (Chlorophyta) I. Nitrogen storage under nitrogen enrichment and starvation. J. Environ. Sci. 2001, 13, 318–322. [Google Scholar]
- Naldi, M.; Wheeler, P.A. Changes in nitrogen pools in Ulva fenestrata (Chlorophyta) and Gracilaria pacifica (Rhodophyta) under nitrate and ammonium enrichment. J. Phycol. 1999, 35, 70–77. [Google Scholar] [CrossRef]
- Yamada, Y. Note on some Japanese algae VIII. Sci. Pap. Inst. Algol. Res. Fac. Sci. Hokkaido Imp. Univ. 1941, 2, 195–215. [Google Scholar]
- Capistrant-Fossa, K.; Brawley, S.H. Unexpected reproductive traits of Grateloupia turuturu revealed by its resistance to bleach-based biosecurity protocols. Bot. Mar. 2019, 62, 83–96. [Google Scholar] [CrossRef]
- Fujiwara-Arasaki, T.; Mino, N.; Kuroda, M. The protein value in human nutrition of edible marine algae in Japan. In Eleventh International Seaweed Symposium; Bird, C.J., Ragan, M.A., Eds.; Springer: Dordrecht, The Netherlands, 1984; pp. 513–516. [Google Scholar]
- Bangmei, X.; Abbott, I.A. Edible seaweeds of China and their place in the Chinese diet. Econ. Bot. 1987, 41, 341–353. [Google Scholar] [CrossRef]
- Rodrigues, D.; Freitas, A.C.; Pereira, L.; Rocha-Santos, T.A.; Vasconcelos, M.W.; Roriz, M.; Rodriguez-Alcala, L.M.; Gomes, A.M.; Duarte, A.C. Chemical composition of red, brown and green macroalgae from Buarcos bay in Central West Coast of Portugal. Food Chem. 2015, 183, 197–207. [Google Scholar] [CrossRef]
- Kendel, M.; Couzinet-Mossion, A.; Viau, M.; Fleurence, J.; Barnathan, G.; Wielgosz-Collin, G. Seasonal composition of lipids, fatty acids, and sterols in the edible red alga Grateloupia Turuturu. J. Appl. Phycol. 2012, 25, 425–432. [Google Scholar] [CrossRef]
- Denis, C.; Morançais, M.; Li, M.; Deniaud, E.; Gaudin, P.; Wielgosz-Collin, G.; Barnathan, G.; Jaouen, P.; Fleurence, J. Study of the chemical composition of edible red macroalgae Grateloupia turuturu from Brittany (France). Food Chem. 2010, 119, 913–917. [Google Scholar] [CrossRef]
- Munier, M.; Dumay, J.; Morançais, M.; Jaouen, P.; Fleurence, J. Variation in the biochemical composition of the edible seaweed Grateloupia turuturu Yamada harvested from two sampling sites on the Brittany coast (France): The influence of storage method on the extraction of the seaweed pigment R-phycoerythrin. J. Chem. 2013, 2013, 568548. [Google Scholar] [CrossRef] [Green Version]
- Cardoso, I.; Cotas, J.; Rodrigues, A.; Ferreira, D.; Osório, N.; Pereira, L. Extraction and analysis of compounds with antibacterial potential from the red alga Grateloupia Turuturu. J. Mar. Sci. Eng. 2019, 7, 220. [Google Scholar] [CrossRef] [Green Version]
- Pang, S.J.; Xiao, T.; Shan, T.F.; Wang, Z.F.; Gao, S.Q. Evidences of the intertidal red alga Grateloupia turuturu in turning Vibrio parahaemolyticus into non-culturable state in the presence of light. Aquaculture 2006, 260, 369–374. [Google Scholar] [CrossRef]
- Pang, S.J.; Xiao, T.; Bao, Y. Dynamic changes of total bacteria and Vibrio in an integrated seaweed–abalone culture system. Aquaculture 2006, 252, 289–297. [Google Scholar] [CrossRef]
- Guillard, R.R.L. Culture of Phytoplankton for Feeding Marine Invertebrates. In Culture of Marine Invertebrate Animals: Proceedings—1st Conference on Culture of Marine Invertebrate Animals Greenport; Smith, W.L., Chanley, M.H., Eds.; Springer: Boston, MA, USA, 1975; pp. 29–60. [Google Scholar]
- Hwang, S.-P.L.; Williams, S.L.; Brinkhuis, B.H. Changes in internal dissolved nitrogen pools as related to nitrate uptake and assimilation in Gracilaria tikvahiae McLachlan (Rhodophyta). Bot. Mar. 1987, 30, 11–20. [Google Scholar] [CrossRef]
- Sun, X.Y.; Hong, L.C.; Ye, H.M. Experiment determining nitrate nitrogen in water samples by on-line cadmium column reduc- tion-flow injection method. Water Resour. Prot. 2010, 26, 75–77, (In Chinese with English Abstract). [Google Scholar]
- Wu, Z.-Z. Improved method of NH4+-N determined by hypobromite oxidation in water. Mar. Environ. Sci. 2007, 26, 85–87, (In Chinese with English Abstract). [Google Scholar]
- Kochert, G. Protein determination by dye binding. In Handbook of Phycological Methods: Physiological and Biochemical Methods; Hellebust, J.A., Craigie, J.S., Eds.; Cambridge University Press: Cambridge, UK, 1978; pp. 92–93. [Google Scholar]
- Nishimura, T.; Kato, H. Taste of free amino acids and peptides. Food Rev. Int. 1988, 4, 175–194. [Google Scholar] [CrossRef]
- Fujita, R.M.; Wheeler, P.A.; Edwards, R.L. Metabolic regulation of ammonium uptake by Ulva rigida (Chlorophyta): A compartmental analysis of the rate-limiting step for uptake. J. Phycol. 1988, 24, 560–566. [Google Scholar] [CrossRef]
- Rosenberg, C.; Ramus, J. Ecological growth strategies in the seaweeds Gracilaria foliifera (Rhodophyceae) and Ulva sp. (Chlorophyceae): Soluble nitrogen and reserve carbohydrates. Mar. Biol. 1982, 66, 251–259. [Google Scholar] [CrossRef]
- Dortch, Q.; Clayton, J.R.; Thoresen, S.S.; Ahmed, S.I. Species differences in accumulation of nitrogen pools in phytoplankton. Mar. Biol. 1984, 81, 237–250. [Google Scholar] [CrossRef]
- Pallant, J. SPSS Survival Manual: A Step by Step Guide to Data Analysis Using IBM SPSS, 7th ed.; Open University Press: London, UK, 2020; 378p. [Google Scholar]
- Chang, F.H.; McClean, M. Growth responses of Alexandrium minutum (Dinophyceae) as a function of three different nitrogen sources and irradiance. N. Z. J. Mar. Freshw. Res. 1997, 31, 1–7. [Google Scholar] [CrossRef] [Green Version]
- Wang, J.; Zhou, W.; Chen, H.; Zhan, J.; He, C.; Wang, Q. Ammonium nitrogen tolerant Chlorella strain screening and its damaging effects on photosynthesis. Front. Microbiol. 2018, 9, 3250. [Google Scholar] [CrossRef]
- Chen, L.; Xing, R.; Jiang, A.; Yao, Y.; Zhou, G. Effects of nitrogen source and N/P on growth and photosynthesis in the invasive marine macroalga Chaetomorpha valida. Environ. Sci. Pollut. Res. Int. 2020, 27, 24272–24283. [Google Scholar]
- Mousavi, M.; Mehrzad, J.; Najafi, M.F.; Zhiani, R.; Shamsian, S.A.A. Nitrate and ammonia: Two key nitrogen sources for biomass and phycocyanin production by Arthrospira (Spirulina) platensis. J. Appl. Phycol. 2022, 34, 2271–2281. [Google Scholar] [CrossRef]
- Lourenço, S.O.; Barbarino, E.; Mancini-Filho, J.; Schinke, K.P.; Aidar, E. Effects of different nitrogen sources on the growth and biochemical profile of 10 marine microalgae in batch culture: An evaluation for aquaculture. Phycologia 2002, 41, 158–168. [Google Scholar] [CrossRef]
- Fong, P.; Kamer, K.; Boyer, K.E.; Boyle, K.A. Nutrient content of macroalgae with differing morphologies may indicate sources of nutrients for tropical marine systems. Mar. Ecol. Prog. Ser. 2001, 220, 137–152. [Google Scholar] [CrossRef] [Green Version]
- Costanzo, S.D.; O’Donohue, M.J.; Dennison, W.C. Gracilaria edulis (Rhodophyta) as a biological indicator of pulsed nutrients in oligotrophic waters. J. Phycol. 2000, 36, 680–685. [Google Scholar] [CrossRef]
- Martins, I.; Pardal, M.Â.; Lillebø, A.I.; Flindt, M.R.; Marques, J.C. Hydrodynamics as a major factor controlling the occurrence of green macroalgal blooms in a eutrophic estuary: A case study on the influence of precipitation and river management. Estuar. Coast. Shelf Sci. 2001, 52, 165–177. [Google Scholar] [CrossRef] [Green Version]
- Uya, M.; Maggi, E.; Mori, G.; Nuccio, C.; Gribben, P.E.; Bulleri, F. Carry over effects of nutrient addition on the recovery of an invasive seaweed from the winter die-back. Mar. Environ. Res. 2017, 126, 37–44. [Google Scholar] [CrossRef]
- Young, E.B.; Berges, J.A.; Dring, M.J. Physiological responses of intertidal marine brown algae to nitrogen deprivation and resupply of nitrate and ammonium. Physiol. Plant 2009, 135, 400–411. [Google Scholar] [CrossRef]
- Young, E.B.; Dring, M.J.; Savidge, G.; Birkett, D.A.; Berges, J.A. Seasonal variations in nitrate reductase activity and internal N pools in intertidal brown algae are correlated with ambient nitrate concentrations. Plant Cell Environ. 2007, 30, 764–774. [Google Scholar] [CrossRef]
- Li, X.; Li, W.; Zhai, J.; Wei, H.; Wang, Q. Effect of ammonium nitrogen on microalgal growth, biochemical composition and photosynthetic performance in mixotrophic cultivation. Bioresour. Technol. 2019, 273, 368–376. [Google Scholar] [CrossRef]
- Gutierrez, J.; Kwan, T.A.; Zimmerman, J.B.; Peccia, J. Ammonia inhibition in oleaginous microalgae. Algal Res. 2016, 19, 123–127. [Google Scholar] [CrossRef] [Green Version]
- Msuya, F.E.; Neori, A. Effect of water aeration and nutrient load level on biomass yield, N uptake and protein content of the seaweed Ulva lactuca cultured in seawater tanks. J. Appl. Phycol. 2008, 20, 1021–1031. [Google Scholar] [CrossRef]
- Moraes, L.; da Rosa, G.M.; de Souza, M.d.R.A.Z.; Costa, J.A.V. Carbon dioxide biofixation and production of Spirulina sp. LEB 18 biomass with different concentrations of NaNO3 and NaCl. Braz. Arch. Biol. Technol. 2018, 61, e18150711. [Google Scholar] [CrossRef] [Green Version]
- Barr, N.G.; Rees, T.A.V. Nitrogen status and metabolism in the green seaweed Enteromorpha intestinalis: An examination of three natural population. Mar. Ecol. Prog. Ser. 2003, 249, 133–144. [Google Scholar] [CrossRef] [Green Version]
- Andria, J.; Vergara, J.; Perez-Llorens, J.L. Biochemical responses and photosynthetic performance of Gracilaria sp. (Rhodophyta) from Cádiz, Spain, cultured under different inorganic carbon and nitrogen levels. Eur. J. Phycol. 1999, 34, 497–504. [Google Scholar] [CrossRef]
- Kim, J.K.; Kraemer, G.P.; Neefus, C.D.; Chung, I.K.; Yarish, C. Effects of temperature and ammonium on growth, pigment production and nitrogen uptake by four species of Porphyra (Bangiales, Rhodophyta) native to the New England coast. J. Appl. Phycol. 2007, 19, 431–440. [Google Scholar] [CrossRef]
- Chapman, A.R.O.; Craigie, J.S. Seasonal growth in Laminaria longicruris: Relations with dissolved inorganic nutrients and internal reserves of nitrogen. Mar. Biol. 1977, 40, 197–205. [Google Scholar] [CrossRef]
- Duke, C.S.; Litaker, R.W.; Ramus, J. Seasonal variation in RuBPCase activity and N allocation in the chlorophyte seaweeds Ulva curvata (Kutz.) De Toni and Codium decorticatum (Woodw.) Howe. J. Exp. Mar. Biol. Ecol. 1987, 112, 145–164. [Google Scholar] [CrossRef]
- Smit, A.J.; Robertson, B.L.; du Preez, D.R. Influence of ammonium-N pulse concentrations and frequency, tank condition and nitrogen starvation on growth rate and biochemical composition of Gracilaria Gracilis. J. Appl. Phycol. 1996, 8, 473–481. [Google Scholar] [CrossRef]
- Bird, K.T.; Habig, C.; DeBusk, T. Nitrogen allocation and storage patterns in Gracilaria tikvahiae (Rhodophyta). J. Phycol. 1982, 18, 344–348. [Google Scholar] [CrossRef]


| Factors | df | MS | F | p |
|---|---|---|---|---|
| RGR weight | ||||
| Nitrogen source | 1 | 304.762 | 424.706 | <0.001 * |
| Nitrogen concentration | 1 | 4.317 | 6.016 | <0.001 * |
| Interaction | 5 | 1.987 | 2.769 | 0.033 * |
| RGR length | ||||
| Nitrogen source | 1 | 89.708 | 296.339 | <0.001 * |
| Nitrogen concentration | 5 | 0.297 | 0.981 | 0.443 |
| Interaction | 5 | 0.912 | 3.013 | 0.023 * |
| Total nitrogen | ||||
| Nitrogen source | 1 | 39.479 | 2.178 | 0.156 |
| Nitrogen concentration | 5 | 217.101 | 11.980 | <0.001 * |
| Interaction | 5 | 12.623 | 0.697 | 0.632 |
| Nitrate | ||||
| Nitrogen source | 1 | 0.023 | 276.252 | <0.001 * |
| Nitrogen concentration | 5 | <0.001 | 2.254 | 0.099 |
| Interaction | 5 | <0.001 | 2.937 | 0.046 * |
| Ammonium | ||||
| Nitrogen source | 1 | <0.001 | 10.341 | 0.006 * |
| Nitrogen concentration | 5 | <0.001 | 10.127 | <0.001 * |
| Interaction | 5 | <0.001 | 1.535 | 0.242 |
| Soluble protein | ||||
| Nitrogen source | 1 | 330.647 | 40.958 | <0.001 * |
| Nitrogen concentration | 5 | 13.095 | 1.622 | 0.182 |
| Interaction | 5 | 37.865 | 4.690 | 0.002 * |
| Amino acid | ||||
| Nitrogen source | 1 | 1.199 | 0.701 | 0.411 |
| Nitrogen concentration | 5 | 118.679 | 69.366 | <0.001 * |
| Interaction | 5 | 17.663 | 10.324 | <0.001 * |
| Flavor amino acid | ||||
| Nitrogen source | 1 | 0.201 | 0.870 | 0.360 |
| Nitrogen concentration | 5 | 24.715 | 106.920 | <0.001 * |
| Interaction | 5 | 3.652 | 15.798 | <0.001 * |
| Chlorophyll a | ||||
| Nitrogen source | 1 | 0.001 | 2.768 | 0.105 |
| Nitrogen concentration | 5 | 0.003 | 15.309 | <0.001 * |
| Interaction | 5 | <0.001 | 2.385 | 0.059 |
| Phycoerythrin | ||||
| Nitrogen source | 1 | 0.004 | 18.528 | <0.001 * |
| Nitrogen concentration | 5 | 0.004 | 22.527 | <0.001 * |
| Interaction | 5 | 0.002 | 8.812 | <0.001 * |
| NO3−-N Concentration (μmol·L−1) | Protein (%) | RON (%) | Phycoerythrin (%) | Chlorophyll a (%) | NO3−-N (%) | NH4+-N (%) |
|---|---|---|---|---|---|---|
| 0 | 44.03) | 55.46 | 0.16 | 0.20 | 0.12 | 0.02 |
| 25 | 38.13 | 61.28 | 0.23 | 0.21 | 0.12 | 0.02 |
| 50 | 44.45 | 54.99 | 0.25 | 0.19 | 0.10 | 0.02 |
| 100 | 21.34 | 78.04 | 0.20 | 0.20 | 0.18 | 0.04 |
| 200 | 17.96 | 81.51 | 0.18 | 0.17 | 0.14 | 0.03 |
| 400 | 17.16 | 82.22 | 0.22 | 0.24 | 0.13 | 0.03 |
| NH4+-N Concentration (μmol·L−1) | Protein (%) | RON (%) | Phycoerythrin (%) | Chlorophyll a (%) | NO3−-N (%) | NH4+-N (%) |
|---|---|---|---|---|---|---|
| 0 | 56.30 | 43.05 | 0.14 | 0.10 | 0.39 | 0.03 |
| 25 | 57.29 | 41.92 | 0.21 | 0.12 | 0.44 | 0.03 |
| 50 | 42.69 | 56.54 | 0.19 | 0.15 | 0.39 | 0.04 |
| 100 | 56.37 | 42.79 | 0.34 | 0.21 | 0.25 | 0.03 |
| 200 | 30.30 | 68.99 | 0.26 | 0.16 | 0.29 | 0.04 |
| 400 | 33.62 | 65.53 | 0.32 | 0.21 | 0.27 | 0.05 |
Disclaimer/Publisher’s Note: The statements, opinions and data contained in all publications are solely those of the individual author(s) and contributor(s) and not of MDPI and/or the editor(s). MDPI and/or the editor(s) disclaim responsibility for any injury to people or property resulting from any ideas, methods, instructions or products referred to in the content. |
© 2023 by the authors. Licensee MDPI, Basel, Switzerland. This article is an open access article distributed under the terms and conditions of the Creative Commons Attribution (CC BY) license (https://creativecommons.org/licenses/by/4.0/).
Share and Cite
Wang, Q.; Lan, L.; Li, H.; Gong, Q.; Gao, X. Effects of Nitrogen Source and Concentration on the Growth and Biochemical Composition of the Red Seaweed Grateloupia turuturu (Halymeniaceae, Rhodophyta). Sustainability 2023, 15, 4210. https://doi.org/10.3390/su15054210
Wang Q, Lan L, Li H, Gong Q, Gao X. Effects of Nitrogen Source and Concentration on the Growth and Biochemical Composition of the Red Seaweed Grateloupia turuturu (Halymeniaceae, Rhodophyta). Sustainability. 2023; 15(5):4210. https://doi.org/10.3390/su15054210
Chicago/Turabian StyleWang, Qiaohan, Lan Lan, Huiru Li, Qingli Gong, and Xu Gao. 2023. "Effects of Nitrogen Source and Concentration on the Growth and Biochemical Composition of the Red Seaweed Grateloupia turuturu (Halymeniaceae, Rhodophyta)" Sustainability 15, no. 5: 4210. https://doi.org/10.3390/su15054210