Abstract
The issue of global warming has become increasingly documented as a major problem facing the world. The present study adopted the autoregressive distributed lag (ARDL) model to check the validity of the EKC hypothesis under the moderating role of industrialization on CO2 emissions, and to assess the relationship between CO2 emissions, energy consumption, industrialization, economic growth, and financial development in Indonesia in the long and short term, in three separate models employing data spanning the period 1983–2018. The results of the bounds approach prove the presence of a cointegration relationship between CO2 emissions, economic growth, economic growth square, energy consumption, industrialization, and financial development. In Model 1, the empirical outcomes demonstrate that a rise in economic growth leads to higher CO2 emissions. On the contrary, a rise in economic growth squared impedes CO2 emissions in the long run. This result proves the validity of the environmental Kuznets curve hypothesis. Moreover, Model 2 reveals that economic growth and energy consumption foster higher CO2 emissions. Higher financial development decreases the associated CO2. Model 3 shows that industrialization as a moderator factor shows a reverse consequence of economic growth and economic growth squared on CO2. Economic growth shows a significant negative impact on CO2, while economic growth squared is linked positively with CO2 emissions, which does not validate the EKC hypothesis under the moderating role of industrialization. This study recommends that industries’ transition from reliance on excessive non-renewable energy sources to knowledge-based industrialization will reduce CO2 emissions and improve environmental quality.
1. Introduction
The issue of global warming has become increasingly documented as a major problem facing the world. During the industrial revolution, the use of non-renewable energy resources rose sharply for production purposes and led to the release of greenhouse gases (GHG), which are considered as the essential cause of global warming and a sign of climate change. These gases trap heat in the atmosphere and create the GHG effect [1]. Indonesia has created a strategy for NDC implementation that consists of nine programs designed to accelerate the transformational changes toward low-carbon and climate-resilient development and to meet the 2030 target set in its Nationally Determined Contribution (NDC). To mitigate emissions from 2020 to 2030 by an unconditional 29%, and up to a conditional 41%, the Indonesian Government pledged in 2015, compared with the 2030 scenario of business as usual, an unconditional commitment increase compared with the 2010 commitment of 26% [2].
Numerous studies have been conducted to determine the impact of various factors on environmental degradation, also known as the environmental Kuznets curve (EKC). For example, ref. [1] studied the effect of urbanization on the EKC in Turkey using methods such as dynamic ordinary least squares (DOLS) and fully modified ordinary least squares (FMOLS), while [3] looked at the moderating effect of financial development on the EKC in Pakistan using the ARDL bounds testing approach, and ref. [4] adopted the same approach to examine the effect of financial development on the EKC in Malaysia.
In a different context, ref. [5] evaluated the influence of the manufacturing, agriculture, and urbanization sectors in Indonesia on the EKC using the ARDL model. The findings confirm the long-term validity of the EKC. The study revealed that manufacturing value added, when measured as a percentage of GDP (used as a representation of the manufacturing sector), had a positive association with CO2 emissions for the manufacturing sector. Additionally, the study by [6] aimed to evaluate the impact of energy consumption, urbanization, and economic growth on environmental degradation in Indonesia from 1970 to 2018; utilizing the ARDL model, it discovered that both economic growth and energy consumption exhibited a positive significant association with environmental degradation. Moreover, ref. [7] used data from Indonesia from 1975Q1 to 2011Q4 to study the linkage between CO2, financial development, trade openness, energy consumption, and economic growth by employing the ARDL model. The empirical findings show that economic growth is positively associated with CO2 emissions in the long term. Furthermore, energy consumption and CO2 emissions are positively associated, while financial development is negatively connected to CO2. In another study, ref. [8] employed the ARDL model and scrutinized the relationship between CO2, trade openness, energy consumption, and economic growth in Indonesia between 1980 and 2016. The outcomes suggest that economic growth and energy consumption were positively correlated with CO2. To the best of our knowledge, this study is pioneering in considering the moderating role of industrialization on the EKC in Indonesia. Therefore, to fill this gap in knowledge and provide fresh empirical evidence, the present study focuses on examining the moderating role of industrialization on the EKC in Indonesia data covering the period 1983–2018. To attain this goal, the autoregressive distributed lag model and seemingly unrelated regression have been applied to test the validity of the conventional EKC, and to estimate the long- and short-term connections between CO2 emissions, financial development, economic growth, industrialization, and energy consumption. In addition, this study examines the validity of the EKC based on the impact of the moderating role of industrialization in Indonesia.
2. Literature Review
Numerous studies empirically show that financial development, energy consumption, and economic growth are having an impact on environmental degradation. Moreover, several studies have been concerned about the validity of the EKC hypothesis in the conventional framework that describes the link between environmental quality and economic growth. Furthermore, several studies have discussed the EKC hypothesis by incorporating relevant factors such as financial development, economic growth, urbanization, international trade openness, and energy consumption. However, only a few studies have considered the role of industrialization on environmental degradation and the moderating role of industrialization on the EKC. For example, ref. [1] inspected the moderating role of urbanization on the EKC in Turkey in the period 1960–2016. The empirical results from DOLS and FMOLS supported the validity of the EKC in the presence of the moderating role played by urbanization. Additionally, energy consumption has a favorable influence on CO2. Another study by [4], exploring the moderating role of financial development, tested the relationship between financial development and the EKC in Malaysia from 1970 to 2016 using the ARDL model. The outcome did not support the environmental Kuznets curve hypothesis. Financial development displayed a negative correlation with CO2. Additionally, the relationship between income and the environment was significantly moderated by the financial development role. The correlation between CO2 emissions and energy consumption was found to be insignificant. The study by [9] analyzed the moderating impact of financial development on Turkey’s carbon emissions between 1960 and 2016. The FMOLS, DOLS, and CCR empirical results showed that economic growth, financial development, and energy consumption had a long-term positive impact on CO2 emissions with no moderating effects. Additionally, the findings supported the significance of moderating the role of financial development as a determinant of carbon emissions. In addition, ref. [10] employed pooled mean group autoregressive distributed lag (PMG/ARDL) model panel data covering the period 1994–2018 from 8 selected ASEAN+3 countries, and found that industrialization and economic growth were negatively associated with CO2, whereas financial development and energy consumption showed a positive influence on CO2 emissions.
A study by [11] scrutinized the association between industrialization and carbon dioxide emissions in the period 1991–2017 using data from Asian economies by applying FMOLS. The findings showed that industrialization increased carbon dioxide emissions, whereas per capita gross domestic product was negatively connected with CO2.
In addition, ref. [12] applied the nonlinear iterative partial least square (NIPALS) regression in Senegal from 1980 to 2011, and found that an increase in financial development, electricity consumption, and industrialization increased CO2. In contrast, carbon dioxide emissions decreased when economic growth increased. Moreover, the empirical results of [13] showed that there was a Granger causality between carbon dioxide emissions and energy use. Financial development has a causal relationship with CO2. Granger causes were also found from economic growth to carbon dioxide emissions. In Sri Lanka from 1971 to 2012, bidirectional causality was found between industrialization and energy use, while [14] applied the ARDL model data from Vietnam for the period 1985–2015. The outcomes revealed that energy consumption and industrialization affected carbon dioxide emissions positively. Furthermore, GDP per capita displayed a positive linkage with CO2. Research by [15] examined the relationships between carbon dioxide emissions, industrialization, economic growth, and electricity consumption in Benin from 1980 to 2012. The outcomes from the ARDL model, in the long run, showed that industrialization and electricity consumption intensified CO2 emissions.
3. Data and Methodology
3.1. Data
The moderating effects of the pertinent variables on the environmental Kuznets curve have been examined in several studies in the environmental economics literature, for instance, studies by [1,3,4,16,17]. Therefore, by examining the moderating effect of industrialization on the EKC in Indonesia using data covering the period 1983–2018, this study contributes to the previous literature. The dependent variables are carbon dioxide emissions (CO2), expressed as per capita metric tons. The independent variables are per capita gross domestic product (GDP) measured at constant 2010 USD, per capita GDP squared, industry (including construction), value added (% of GDP), domestic credit in the private sector provided by banks as a percentage of GDP, and per capita primary energy consumption. For this study, GDP per capita is used to measure economic growth. Domestic credit from the private sector is used to indicate financial development. Primary energy consumption is the unit of measurement for energy consumption. Industrialization is gauged using industry value added as a percentage of GDP. Energy consumption is an irreplaceable factor in the industrialization process in order to obtain higher economic growth. Additionally, financial development is an essential factor for supporting industrialization via promoting banking systems activities and attracting FDI to expand industry. Industrialization expansion, therefore, results in degrading the environment as long as energy consumption is an irreplaceable factor in industries’ processes. All the data were generated from the World Development Indicators of the World Bank [18], except the primary energy (consumption per capita) data, which were obtained from British Petroleum [19].
3.2. Theoretical Framework
The environmental Kuznets curve hypothesis (EKC) has been widely tested in the environmental economic literature. Following the fundamental general models by [20,21], the conventional environmental Kuznets curve framework is presented as:
where LCO2 indicates the natural logarithm of carbon dioxide emissions; LGDP represents the natural logarithm of economic growth; LGDP2 is the natural logarithm of the square of economic growth, α0 is the constant, µit is the error term, and α1 and α2 are the coefficients of the independent variables.
Similarly to the study by [1], this study incorporates financial development, industrialization, and energy consumption as relevant determinants of CO2 emissions and is presented as:
where LDC, LIND, and LEC are financial development, industrialization, and energy consumption, respectively.
To validate the existence of the hypothesis of the environmental Kuznets curve under the moderating role of industrialization on CO2 emissions, this study examines the interactions of industrialization with all the variables in the model. The interaction model frame is as follows:
3.3. Econometrics Methodology
To investigate the presence of the EKC hypothesis under the moderating role of industrialization on CO2 emissions, this study applied the autoregressive distributed lag (ARDL) model to assess the link between CO2 emissions, energy consumption, industrialization, financial development, and economic growth in Indonesia. The ARDL model has been used in this study because it is appropriate for small samples; it also takes into consideration the error correction model. The ARDL approach provides consistent and robust results because it allows describing the existence of an equilibrium relationship in both long-run and short-run dynamics without losing long-run information. The ARDL bounds test approach can be applied regardless of whether the underlying regressors are integrated of order one I(1) or order zero I(0). Seemingly unrelated regression is employed to scrutinize the ARDL robustness estimations. Moreover, the augmented [22] unit root tests and the tests recommended by [23] are used to check the stationarity of the variables. The cointegration relationship is determined by the ARDL model bounds developed by [24]. The goodness-of-fit of the estimated coefficients and residual stability was tested using diagnostic and residual stability tests. The diagnostic tests are heteroscedasticity, serial correlation, Ramsey RESET, and normality. The cumulative sum of squares of recursive residuals (CUSUMSQ) is accompanied by the cumulative sum of recursive residuals (CUSUM) and are used to investigate residual stability.
The initial step to analyzing the relationship between CO2 emissions, economic growth, industrialization, energy consumption, and financial development, and examining the moderating role of industrialization on the EKC, would be by reformulating Equations (1)–(3) in the general framework of the ARDL model as follows:
where Δ denotes the first difference, the Akaike information criterion (AIC) is used to determine the optimal lag length q, and α0 is constant. The long-run coefficients are α1, α2, α3, α4, and α5. The short-run coefficients are denoted by β1, β2, β3, β4, and β5. µt indicates the error term.
The cointegration relationship in this study was checked by (H0: α1 = α2 = α3 = α4 = α5 = 0), which means in the long run there is no cointegration relationship. This hypothesis was tested against the hypothesis, which indicates that the cointegration relationship exists (H1: α1 ≠ α2 ≠ α3 ≠ α4 ≠ α5 ≠ 0) in the long run.
The cointegration relationship supports the next step to estimate the association between CO2 emissions, economic growth, industrialization, financial development, and energy consumption in the long and short term, and examines the moderating role of industrialization on the environmental Kuznets curve.
4. Empirical Results Analysis
4.1. Descriptive Statistics and Correlations
The empirical analysis in the study started with some descriptive and correlation analysis to explore the reliability, variations, and correlation between the variables [4]. Descriptive statistics and correlations results are presented in Table 1 and Table 2, respectively.

Table 1.
Descriptive statistics.
Table 2.
Correlation analysis.
Based on the standard deviation value in Table 1, economic growth squared is more volatile between the series. Moreover, energy consumption shows a higher variation than the other variables. All the variables are normally distributed as indicated by the Jarque–Bera test. Moreover, the skewness test demonstrates that economic growth and economic growth squared have low positive skewness value of 0.066 and 0.133 respectively. Furthermore, financial development shows a low positive skewness value of 0.296, while CO2 emissions and industrialization display low negative skewness. Additionally, energy consumption is found to have a moderate negative skewness value of −0.557.
As shown in Table 2, economic growth has a high positive correlation with CO2, suggesting that as long as a country’s economic growth increases, CO2 will rise as well. Furthermore, the square of economic growth and industrialization have a high positive correlation with CO2, indicating that the higher the square of economic growth and industrialization, the higher the rise in CO2 will be. Additionally, energy consumption shows a positive correlation with CO2, whereas financial development demonstrates a negative correlation with CO2, suggesting that a country’s financial development might be acting as a proxy to reduce CO2. Notably, industrialization shows a negative correlation with financial development.
In the next step, after descriptive statistics analysis and correlations matrix discussion, this study performs the augmented Dickey–Fuller and Phillips tests to check the properties of the time series. The results are shown in Table 3.
Table 3.
The unit root tests.
According to the Phillips and Perron (PP) and augmented Dickey–Fuller (ADF) results shown in Table 3, the only two variables that are stationary at the level are LEC and LIND*LEC, based on the result of the ADF test. However, the findings of PP and ADF at the first difference demonstrate that CO2 emissions, economic growth, industrialization, financial development, and squared economic growth are stationary.
4.2. Cointegration Test
To examine the moderating role of industrialization on the environmental Kuznets curve, after confirming the variables were stationary, this study employed the bounds test for cointegration to analyze the cointegration relationship between CO2 emissions, economic growth, industrialization, financial development, economic growth squared, and energy consumption. The outcomes are shown in Table 4.
Table 4.
Bounds test for cointegration.
As seen from Table 4, the calculated F-statistics in all models exceeded the bounds test critical value at a 1% significance level and proved that the null hypothesis, which suggests there is no cointegration relationship, has been rejected. These findings show the presence of cointegration between CO2, economic growth, industrialization, financial development, economic growth squared, and energy consumption in Indonesia.
4.3. Long- and Short-Run Relationship Analysis
The existence of a cointegration relationship between the variables supports the next step: to estimate the long- and short-run relationship between CO2, economic growth, industrialization, financial development, economic growth squared, and energy consumption. Consequently, the ARDL long- and short-run relationships have been estimated for Models 1, 2, and 3. The results are reported in Table 5.
Table 5.
ARDL Long- and short-run analysis.
The short- and long-term relationships for the three models are shown in Table 5. The results of the traditional environmental Kuznets curve are examined in Model 1. According to Table 5, economic growth in Model 1 has a positive effect on CO2 emissions and is statistically significant at the 5% level, whereas there is a 5% significant negative correlation between economic growth squared and CO2 emissions. This finding is consistent with [3,5]. These findings support the validity of the environmental Kuznets curve hypothesis, which predicts that, close to the turning point, a rise in economic growth will result in a decrease in CO2 emissions and an improvement in environmental quality. According to the coefficient of economic growth (LGDP), a 1% increase in economic growth will result in 11.41% increase in CO2 emissions. The coefficient of the square of economic growth (LGDP2), on the other hand, shows that a 1% increase in the square of economic growth results in a 0.667% decline in CO2 emissions. Model 2 also focuses on estimating the important factors that affect CO2 emissions. The empirical findings from Model 2 show that a rise in energy consumption leads to higher CO2. Additionally, increasing economic growth results in more CO2 emissions, as demonstrated by the positive sign at a 1% significance level. These findings are consistent with [1,8,9]. These results supported the fact that relying heavily on extensive energy use from various unclean resources degraded environmental quality. While financial development was found to have an effective role in improving environmental quality by minimizing CO2 emissions by 0.077%, equivalent to any 1% financial development increase, these results are in line with [3,4]. This outcome suggests that a well−developed financial sector contributes significantly in ameliorating environmental quality in Indonesia. Industrialization has a statistically insignificant positive influence on CO2 emissions. When comparing Model 1 and Model 3, Model 3 demonstrates that industrialization as a moderating factor exhibits a counter−effect to economic growth and economic growth squared on CO2. Furthermore, economic growth has a substantial negative effect on CO2 emissions, while the square of economic growth is positively related to CO2. This outcome does not support the environmental Kuznets curve hypothesis when the moderating effect of industrialization is taken into account. This can be attributed to industrial expansion, since attaining rapid economic growth lowers environmental quality by emitting more CO2 emissions into the atmosphere. The short-run part of Table 5 shows that the coefficients of the error term for Models 1, 2, and 3 are all negative in effect and statistically significant. This outcome demonstrates that the deviation from the long-term equilibrium will be corrected by 0.21%, 0.88%, and 0.50% per year, respectively.
Furthermore, the ARDL estimations robustness was checked by estimating the seemingly unrelated regression. The outcomes are reported in Table 6. The robustness results reported in Table 6 support the long-run findings of the ARDL model.
Table 6.
Seemingly unrelated regression.
4.4. Diagnostic Tests and Parameters Stability
This study conducted diagnostic tests to capture heteroscedasticity, serial correlation, functional form, and normality. The results are reported in the bottom part of Table 5 and show that the estimated models are homoscedastic, do not exhibit serial correlation, and are normally distributed, as explained by the Jarque–Bera test. Additionally, the functional forms are properly formulated. Furthermore, the cumulative sum of recursive residual (CUSUM) and cumulative sum square of recursive residuals (CUSUMSQ) techniques have been employed to test the stability and reliability of estimated coefficients in the long and short term in all three models. The outcomes are depicted in Figure 1 and Figure 2 for Model 1, Figure 3 and Figure 4 for Model 2, and Figure 5 and Figure 6 for Model 3, respectively. The CUSUM test was applied to check the systematic changes in the estimated coefficients, while the CUSUMSQ test was used to inspect the sudden change in the stability of the coefficients. If the CUSUM and CUSUMSQ test statistics fall between the straight lines of critical bounds at a 5% significance level, the null hypothesis of stability of the estimated parameters will be accepted.
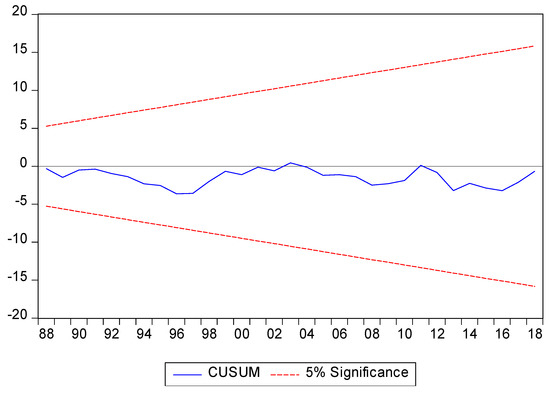
Figure 1.
Cumulative sum (CUSUM) of recursive residuals for model 1.
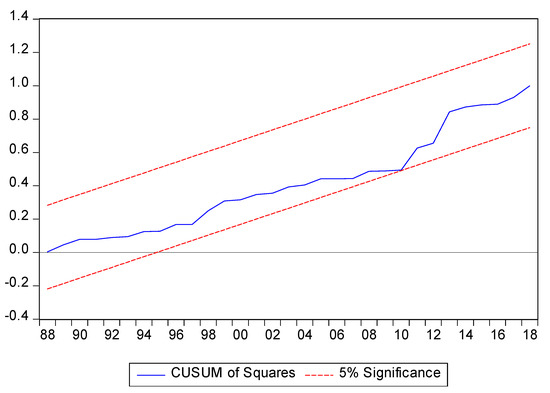
Figure 2.
Cumulative sum square (CUSUMSQ) of recursive residuals for model 1.
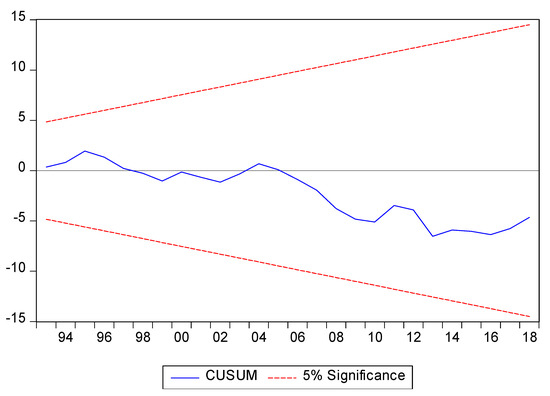
Figure 3.
Cumulative sum (CUSUM) of recursive residuals for model 2.
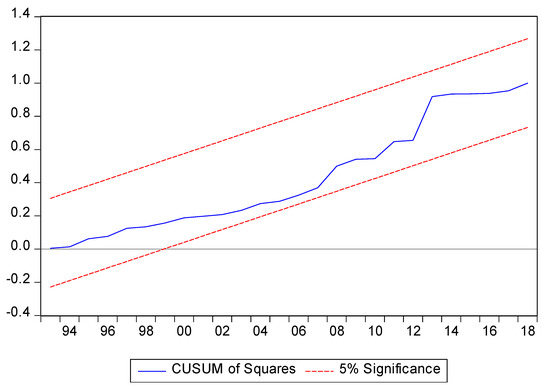
Figure 4.
Cumulative sum square (CUSUMSQ) of recursive residuals for model 2.
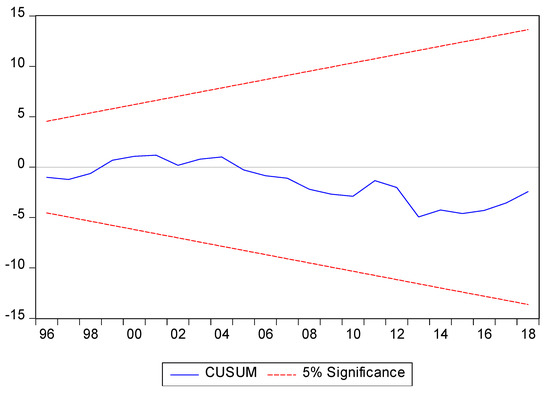
Figure 5.
Cumulative sum (CUSUM) of recursive residuals for model 3.
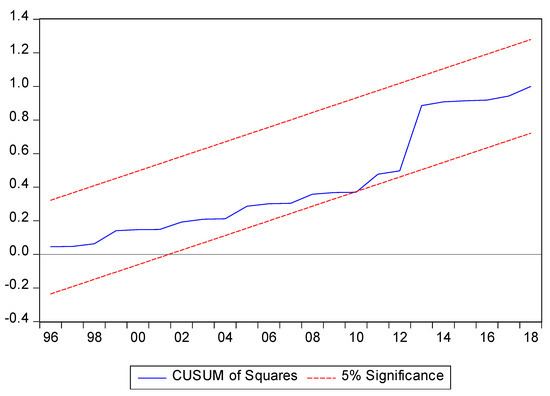
Figure 6.
Cumulative sum square (CUSUMSQ) of recursive residuals for model 3.
5. Conclusions and Policy Implications
In this study, Indonesian data from 1983 to 2018 are used to examine the moderating effects of industrialization on the environmental Kuznets curve. The dependent variables are carbon dioxide emissions (CO2), expressed as per capita metric tons. The independent variables are per capita gross domestic product (GDP) measured at constant 2010 USD, per capita GDP squared, industry (including construction), value added (% of GDP), domestic credit in the private sector provided by banks as a percentage of GDP, and per capita primary energy consumption. For this study, GDP per capita is used to measure economic growth. Domestic credit in the private sector is used to indicate financial development. Primary energy consumption is the unit of measurement for energy consumption. Industrialization is gauged using industry value added as a percentage of GDP. The data were generated from the World Development Indicators of the World Bank, except the primary energy (consumption per capita) data, which were obtained from British Petroleum.
To test the validity of the EKC hypothesis under the moderating role of industrialization on CO2, the present study applied the ARDL model to estimate the long- and short-term relationship between CO2 emissions, economic growth, industrialization, financial development, and energy consumption. According to the unit root tests, CO2, economic growth, energy consumption, economic growth squared, industrialization, and financial development at the first difference are stationary. The cointegration findings confirm the existence of a cointegration relationship between CO2 emissions, economic growth, industrialization, financial development, economic growth squared, and energy consumption. In Model 1, the empirical outcomes demonstrate that a rise in economic growth leads to higher CO2 emissions. On the contrary, a rise in economic growth squared impedes CO2 emissions in the long run. This result proves the validity of the environmental Kuznets curve hypothesis and predicts that after the turning point, higher economic growth will lead to lower CO2 emissions and better environmental conditions. Moreover, Model 2 reveals that economic growth causes a surge in CO2, and energy consumption also fosters CO2 emissions, while a negative result for the financial development coefficient leads to reduced CO2 emissions and significantly improves environmental quality. Furthermore, the coefficient of industrialization shows a statistically insignificant positive link with CO2. Model 3 shows that industrialization as a moderating factor shows a reverse consequence of economic growth and economic growth squared on CO2. Economic growth shows a significant negative impact on CO2, while economic growth squared is linked positively with CO2 emissions, which does not validate the EKC hypothesis presence under the moderating role of industrialization.
The coefficients of the error correction term in Models 1, 2, and 3, as shown in the short-run part of Table 5, are negative and statistically significant, indicating that the deviation from long-run equilibrium is adjusted by 0.21%, 0.88%, and 0.50% per annum, respectively. The diagnostic and stability test results showed and proved stability and reliability for all the estimated coefficients during the study period.
Due to industrial expansion, rapidly expanding economies have relied heavily on extensive energy use from various resources, which degrades environmental quality. The empirical findings of this study show that industrialization has a significant positive impact on environmental quality in Indonesia by changing the economic sectors that rely on green technologies and less energy−intensive production inputs. Furthermore, industries’ transition from reliance on excessive non−renewable energy sources to knowledge−based industrialization will reduce CO2 emissions and improve environmental quality.
Additionally, exports from sectors requiring less energy could show how Indonesian industrialization has improved the nation’s environment and decreased carbon emissions.
By facilitating funding access, lowering capital outflow, and boosting economic activity by utilizing environmentally friendly technologies, financial development increases the efficacy of initiatives to improve environmental quality. Furthermore, the empirical findings display that energy consumption and economic growth lead to higher CO2 emissions. To maintain stable economic growth and ensure better environmental quality in Indonesia, energy from clean and renewable sources would make a significant contribution.
Although this study contributes significantly to the literature on environmental, industrialization, energy consumption, and economic growth, particularly in Indonesia and other developing nations, it has limitations, such as restrictions related to the length of the time period covered and the use of a single country, especially Indonesia. Future research could therefore consider extending the time period, using panel data, and additionally including institutional variables.
Author Contributions
Conceptualization, K.E.E. and U.H.; methodology, K.E.E. and U.H.; software, K.E.E.; validation, U.H.; formal analysis, K.E.E. and U.H.; investigation, K.E.E.; resources, K.E.E.; data curation, U.H.; writing original draft preparation, K.E.E.; Writing−review and editing, U.H.; visualization, K.E.E.; and supervision, U.H. All authors have read and agreed to the published version of the manuscript.
Funding
This research received no external funding.
Institutional Review Board Statement
Not applicable.
Informed Consent Statement
Not applicable.
Data Availability Statement
The data used in this study are available on the World Bank Indicators database published by the World Bank: https://databank.worldbank.org/source/world-development-indicators# (accessed on 8 July 2022), and British Petroleum Statistical Review of World Energy (BP): https://www.bp.com/en/global/corporate/energy-economics/statistical-review-of-world-energy.html (accessed on 9 July 2022).
Conflicts of Interest
The authors declare no conflict of interest.
References
- Kirikkaleli, D.; Kalmaz, D.B. Testing the moderating role of urbanization on the environmental Kuznets curve: Empirical evidence from an emerging market. Environ. Sci. Pollut. Res. 2020, 27, 38169–38180. [Google Scholar] [CrossRef] [PubMed]
- UN Climate Change. Custom Search|UNFCCC. 2022. Available online: https://unfccc.int/gcse?q=ENHANCEDNATIONALLYDETERMINEDCONTRIBUTION (accessed on 14 February 2023).
- Rahman, S.U.; Chen, S.; Saleem, N.; Bari, M.W. Financial development and its moderating role in environmental Kuznets curve: Evidence from Pakistan. Environ. Sci. Pollut. Res. 2019, 26, 19305–19319. [Google Scholar] [CrossRef] [PubMed]
- Gill, A.R.; Hassan, S.; Haseeb, M. Moderating role of financial development in environmental Kuznets: A case study of Malaysia. Environ. Sci. Pollut. Res. 2019, 26, 34468–34478. [Google Scholar] [CrossRef] [PubMed]
- Prastiyo, S.E.; Irham; Hardyastuti, S.; Jamhari. How agriculture, manufacture, and urbanization induced carbon emission? The case of Indonesia. Environ. Sci. Pollut. Res. 2020, 27, 42092–42103. [Google Scholar] [CrossRef] [PubMed]
- Purnama, H.; Gunarto, T.; Budiarty, I. Effects of energy consumption, economic growth and urbanization on indonesian environmental quality. Int. J. Energy Econ. Policy Int. J. Energy Econ. Policy 2020, 10, 580–587. [Google Scholar] [CrossRef]
- Shahbaz, M.; Hye, Q.M.A.; Tiwari, A.K.; Leitão, N.C. Economic growth, energy consumption, financial development, international trade and CO2 emissions in Indonesia. Renew. Sustain. Energy Rev. 2013, 25, 109–121. [Google Scholar] [CrossRef]
- Adebayo, T.S. Testing the EKC Hypothesis in Indonesia: Empirical Evidence from the ARDL−Based Bounds and Wavelet Coherence Approaches. Appl. Econ. J. 2021, 28, 1–23. [Google Scholar]
- Rjoub, H.; Odugbesan, J.A.; Adebayo, T.S.; Wong, W.−K. Sustainability of the Moderating Role of Financial Development in the Determinants of Environmental Degradation: Evidence from Turkey. Sustainability 2021, 13, 1844. [Google Scholar] [CrossRef]
- Elfaki, K.E.; Khan, Z.; Kirikkaleli, D.; Khan, N. On the nexus between industrialization and carbon emissions: Evidence from ASEAN + 3 economies. Environ. Sci. Pollut. Res. 2022, 29, 31476–31485. [Google Scholar] [CrossRef]
- Zafar, A.; Ullah, S.; Majeed, M.T.; Yasmeen, R. Environmental pollution in Asian economies: Does the industrialisation matter? OPEC Energy Rev. 2020, 44, 227–248. [Google Scholar] [CrossRef]
- Asumadu−Sarkodie, S.; Owusu, P.A. A multivariate analysis of carbon dioxide emissions, electricity consumption, economic growth, financial development, industrialization, and urbanization in Senegal. Energy Sources Part B Econ. Plan. Policy 2016, 12, 77–84. [Google Scholar] [CrossRef]
- Asumadu−Sarkodie, S.; Owusu, P.A. Energy use, carbon dioxide emissions, GDP, industrialization, financial development, and population, a causal nexus in Sri Lanka: With a subsequent prediction of energy use using neural network. Energy Sources Part B Econ. Plan. Policy 2016, 11, 889–899. [Google Scholar] [CrossRef]
- Phong, L.H.; Van, D.T.B.; Bao, H.H.G. The role of globalization on carbon dioxide emission in Vietnam incorporating industrialization, urbanization, gross domestic product per capita and energy use. Int. J. Energy Econ. Policy 2018, 8, 275–283. [Google Scholar]
- Asumadu−Sarkodie, S.; Owusu, P.A. Carbon dioxide emission, electricity consumption, industrialization, and economic growth nexus: The Beninese case. Energy Sources Part B Econ. Plan. Policy 2016, 11, 1089–1096. [Google Scholar] [CrossRef]
- Katircioğlu, S.T.; Taşpinar, N. Testing the moderating role of financial development in an environmental Kuznets curve: Empirical evidence from Turkey. Renew. Sustain. Energy Rev. 2017, 68, 572–586. [Google Scholar] [CrossRef]
- Mushtaq, M.; Ahmed, S. Environmental Kuznets Curve: Moderating role of financial development. Econ. J. Emerg. Mark. 2021, 13, 27–40. [Google Scholar] [CrossRef]
- World Bank. World Development Indicators|DataBank. 2022. Available online: https://databank.worldbank.org/source/world−development−indicators (accessed on 8 July 2022).
- British Petroleum. British Petroleum Statistical Review of World Energy, Energy Economics. 2022. Available online: https://www.bp.com/en/global/corporate/energy−economics/statistical−review−of−world−energy.html (accessed on 9 July 2022).
- Grossman, G.M.; Krueger, A.B. Economic Growth and the Environment. Q. J. Econ. 1995, 110, 353–377. [Google Scholar] [CrossRef]
- Shafik, N. Economic Development and Environmental Quality: An Econometric Analysis. Oxf. Econ. Pap. 1994, 46 (Suppl. S1), 757–773. [Google Scholar] [CrossRef]
- Dickey, D.A.; Fuller, W.A. Distribution of the Estimators for Autoregressive Time Series With a Unit Root. J. Am. Stat. Assoc. 1979, 74, 427–431. [Google Scholar]
- Phillips, P.C.B.; Perron, P. Testing for a unit root in time series regression. Biometrika 1988, 75, 335–346. [Google Scholar] [CrossRef]
- Pesaran, M.H.; Shin, Y.; Smith, R.J. Bounds testing approaches to the analysis of level relationships. J. Appl. Econom. 2001, 16, 289–326. [Google Scholar] [CrossRef]


Disclaimer/Publisher’s Note: The statements, opinions and data contained in all publications are solely those of the individual author(s) and contributor(s) and not of MDPI and/or the editor(s). MDPI and/or the editor(s) disclaim responsibility for any injury to people or property resulting from any ideas, methods, instructions or products referred to in the content. |
© 2023 by the authors. Licensee MDPI, Basel, Switzerland. This article is an open access article distributed under the terms and conditions of the Creative Commons Attribution (CC BY) license (https://creativecommons.org/licenses/by/4.0/).