
Thermodynamic Analysis and Optimization of the Micro-CCHP System with a Biomass Heat Source
 ,
,  ,
,
Abstract
:1. Introduction
2. Materials and Methods
2.1. Analysis of the Proposed System
- Minor changes in pressure were ignored.
- All modeling was checked in stable conditions.
- All processes were one-dimensional and adiabatic, and nothing was carried out during the process.
- The velocity of entering and leaving the fluid in the ejector was equal.
- Kinetic and potential exergy was omitted.
- The power required for pumping or suctioning fluid into the desalination system was omitted.
- The temperature of fresh water leaving the dehumidifier was equal to the average temperature of the air entering and exiting the dehumidifier.
- The state of the output flow from the condenser and evaporator was saturated.

2.2. Desalination System
- The lowest temperature of the system: the temperature of the salt water entering the dehumidifier has the lowest temperature of the desalination system.
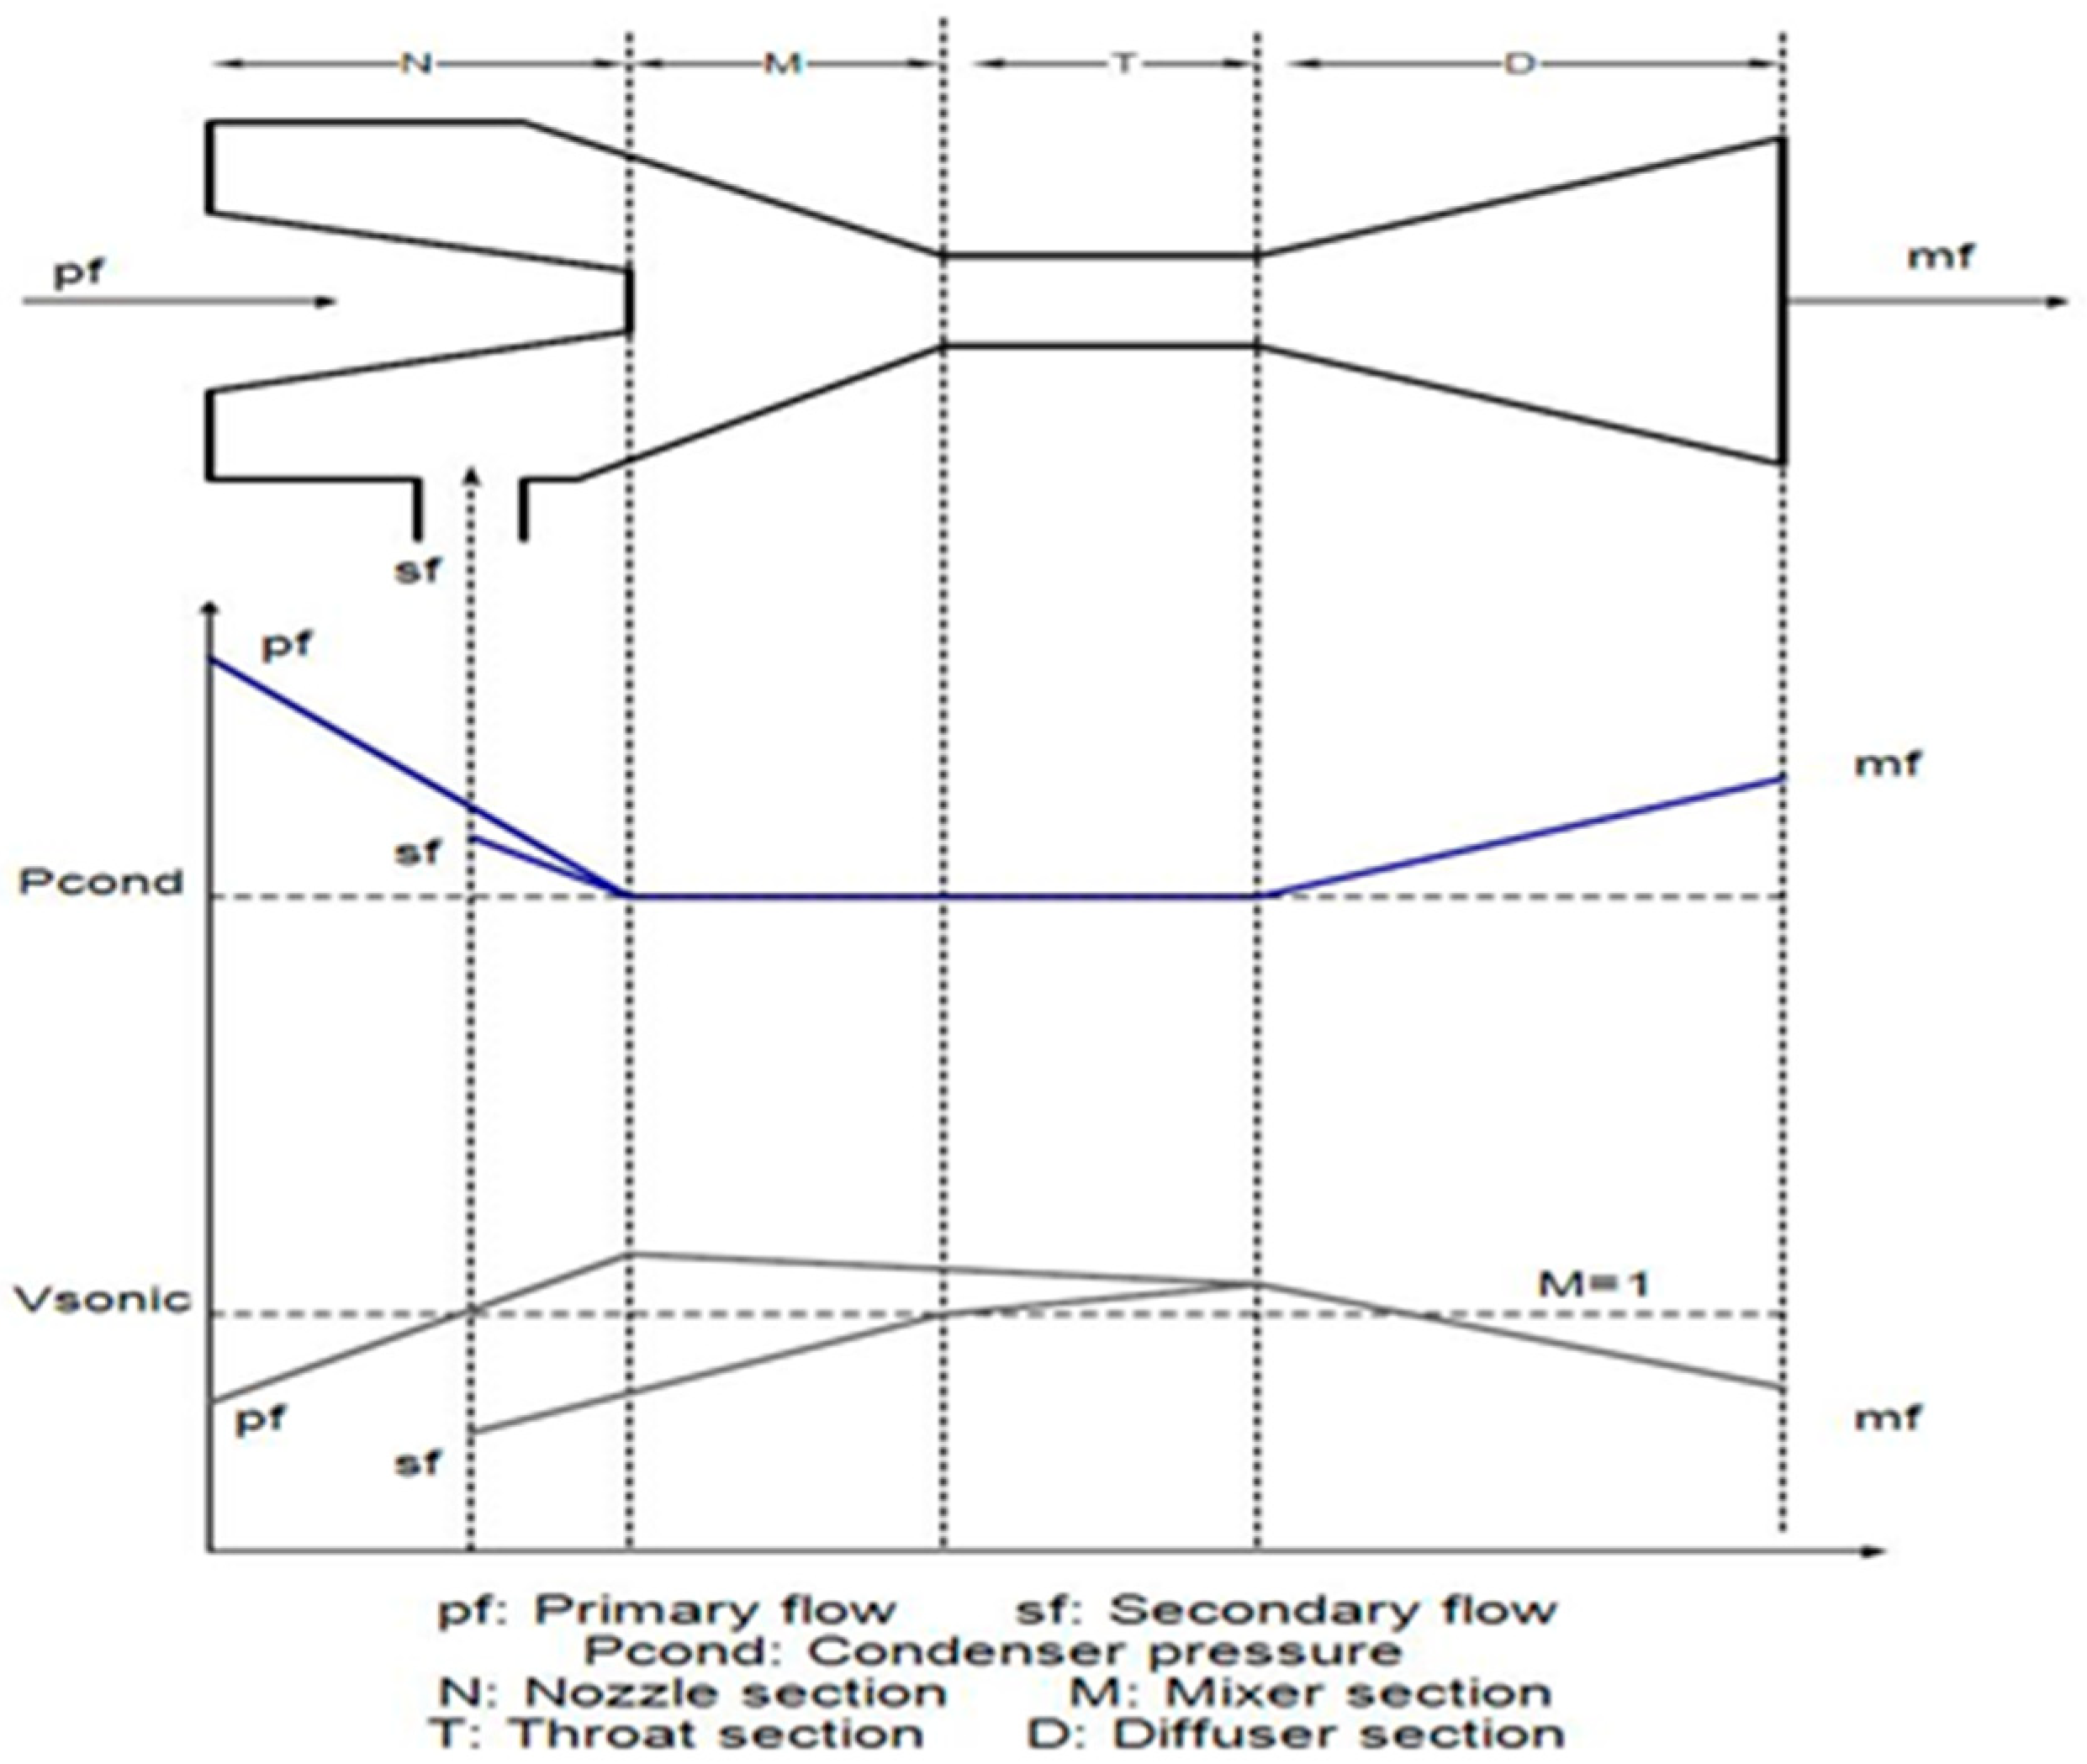
2.3. Ejector
3. Results
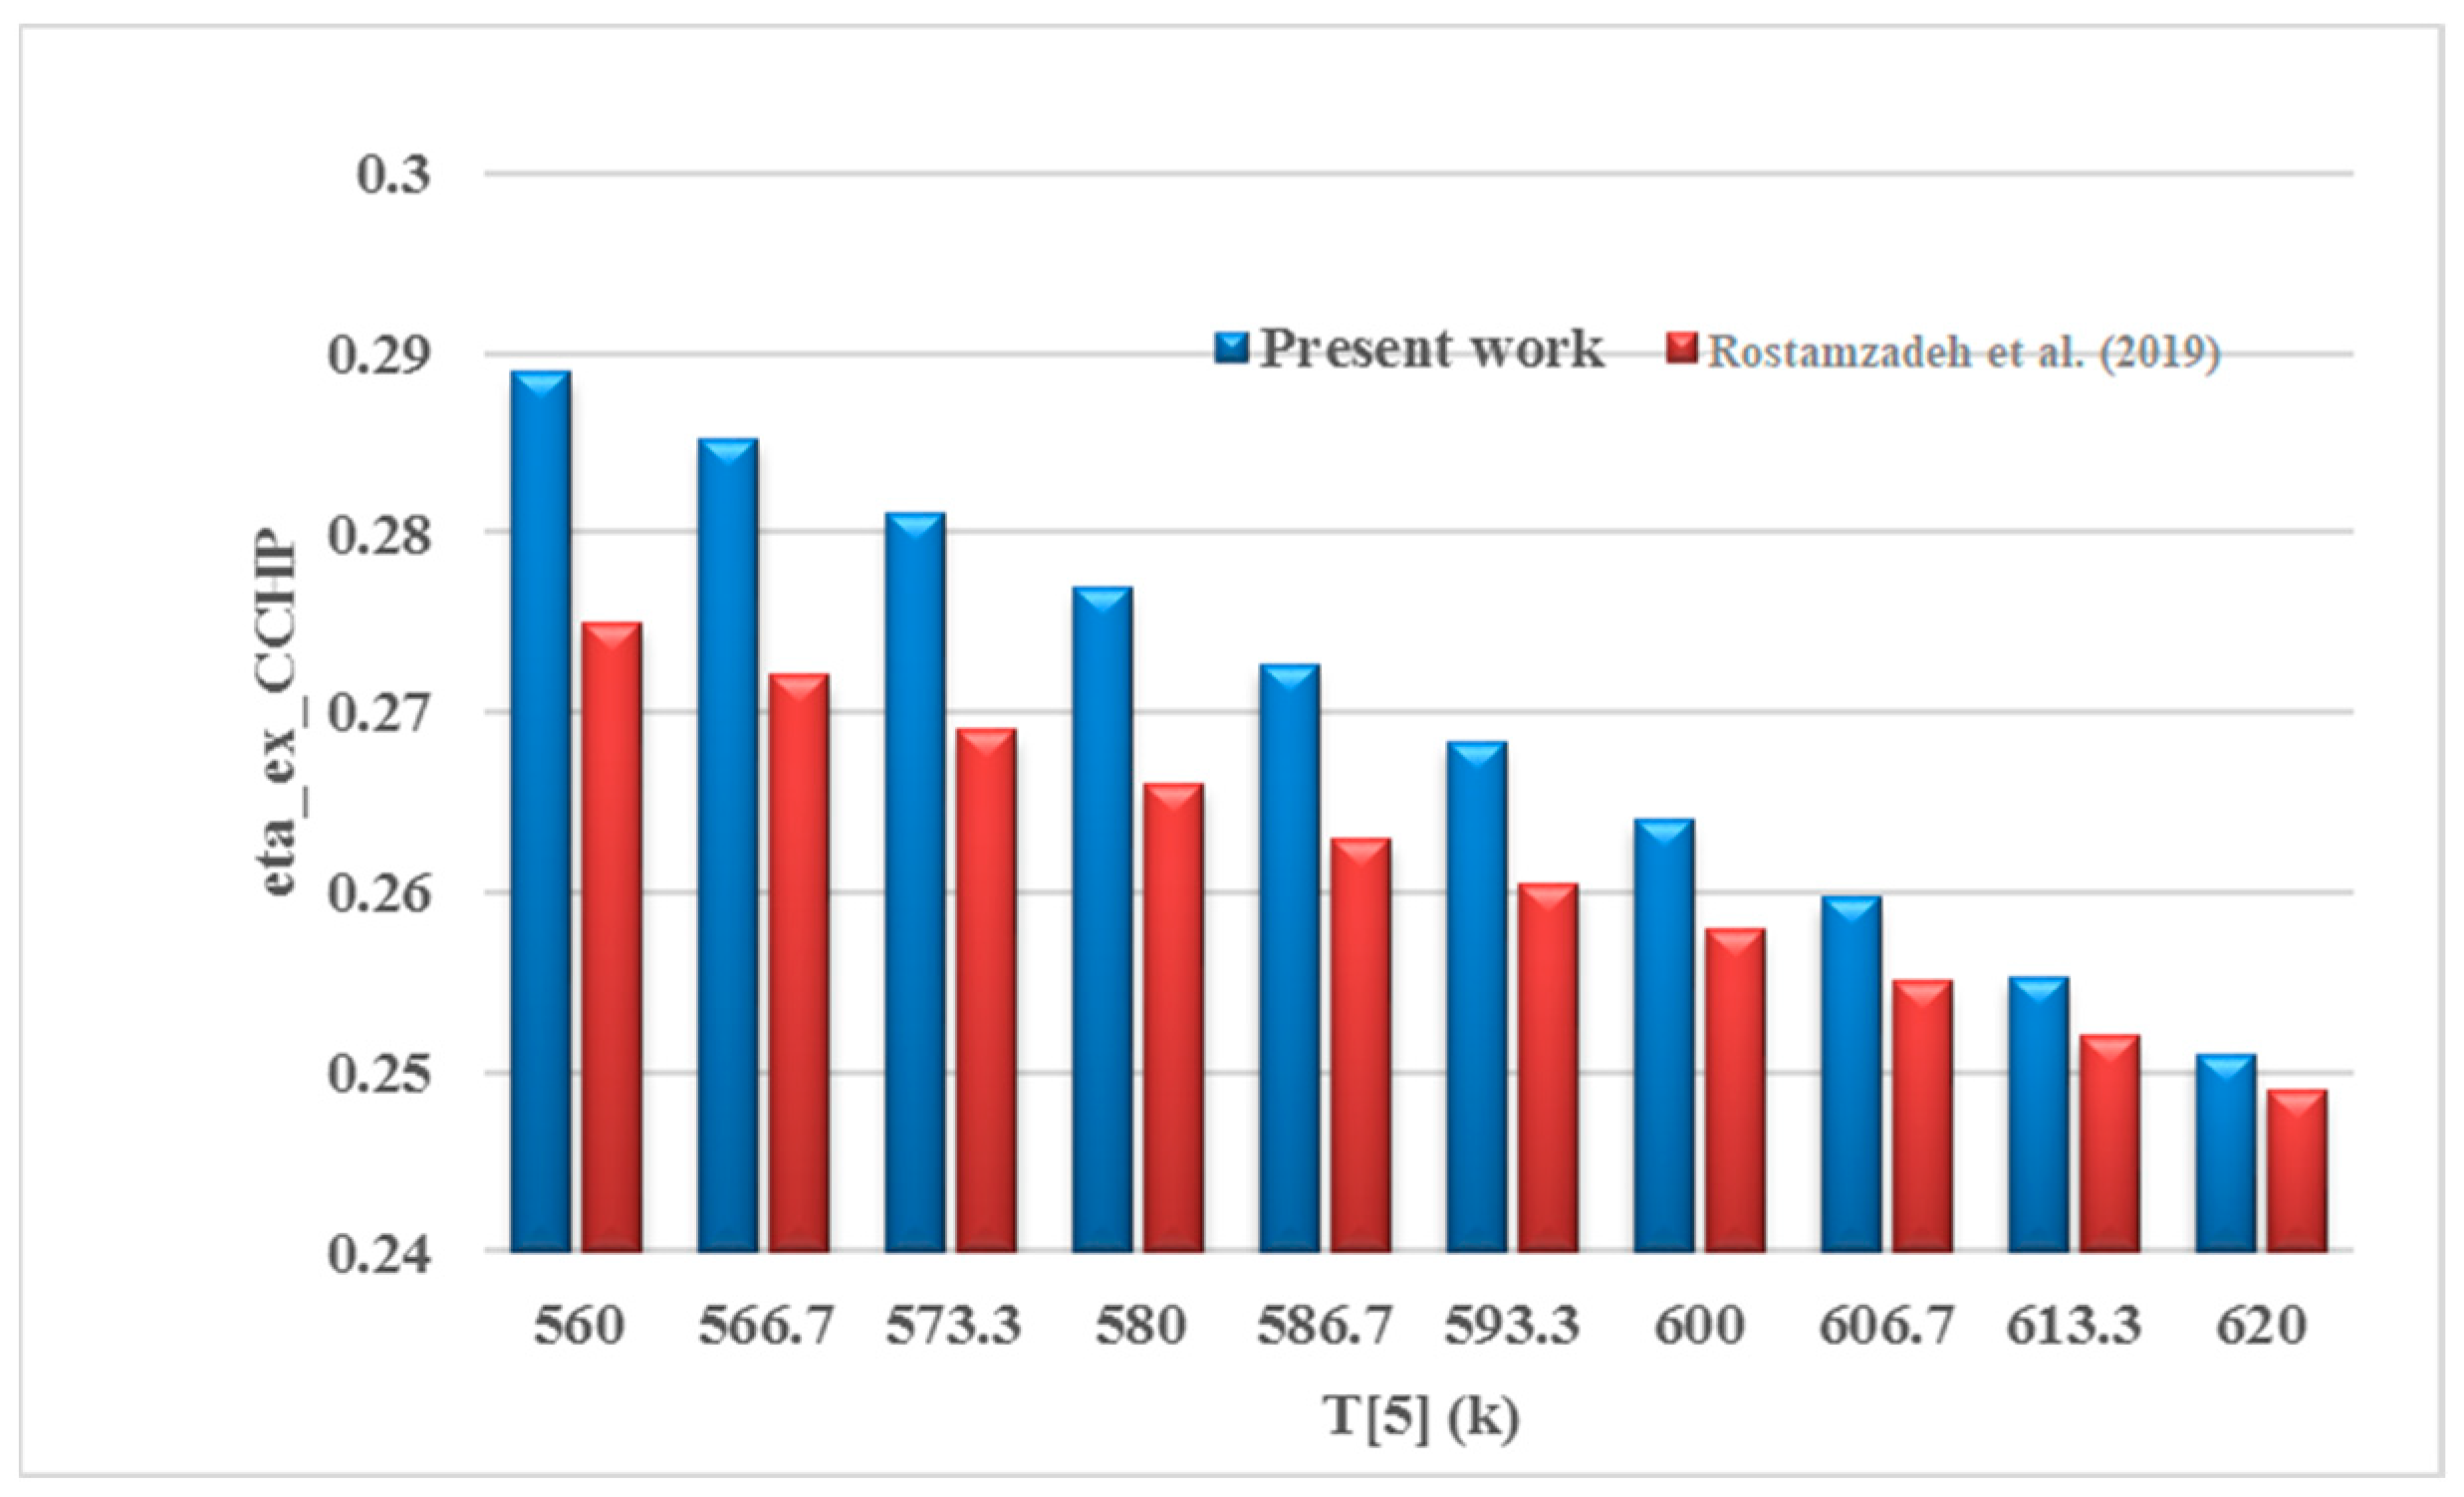
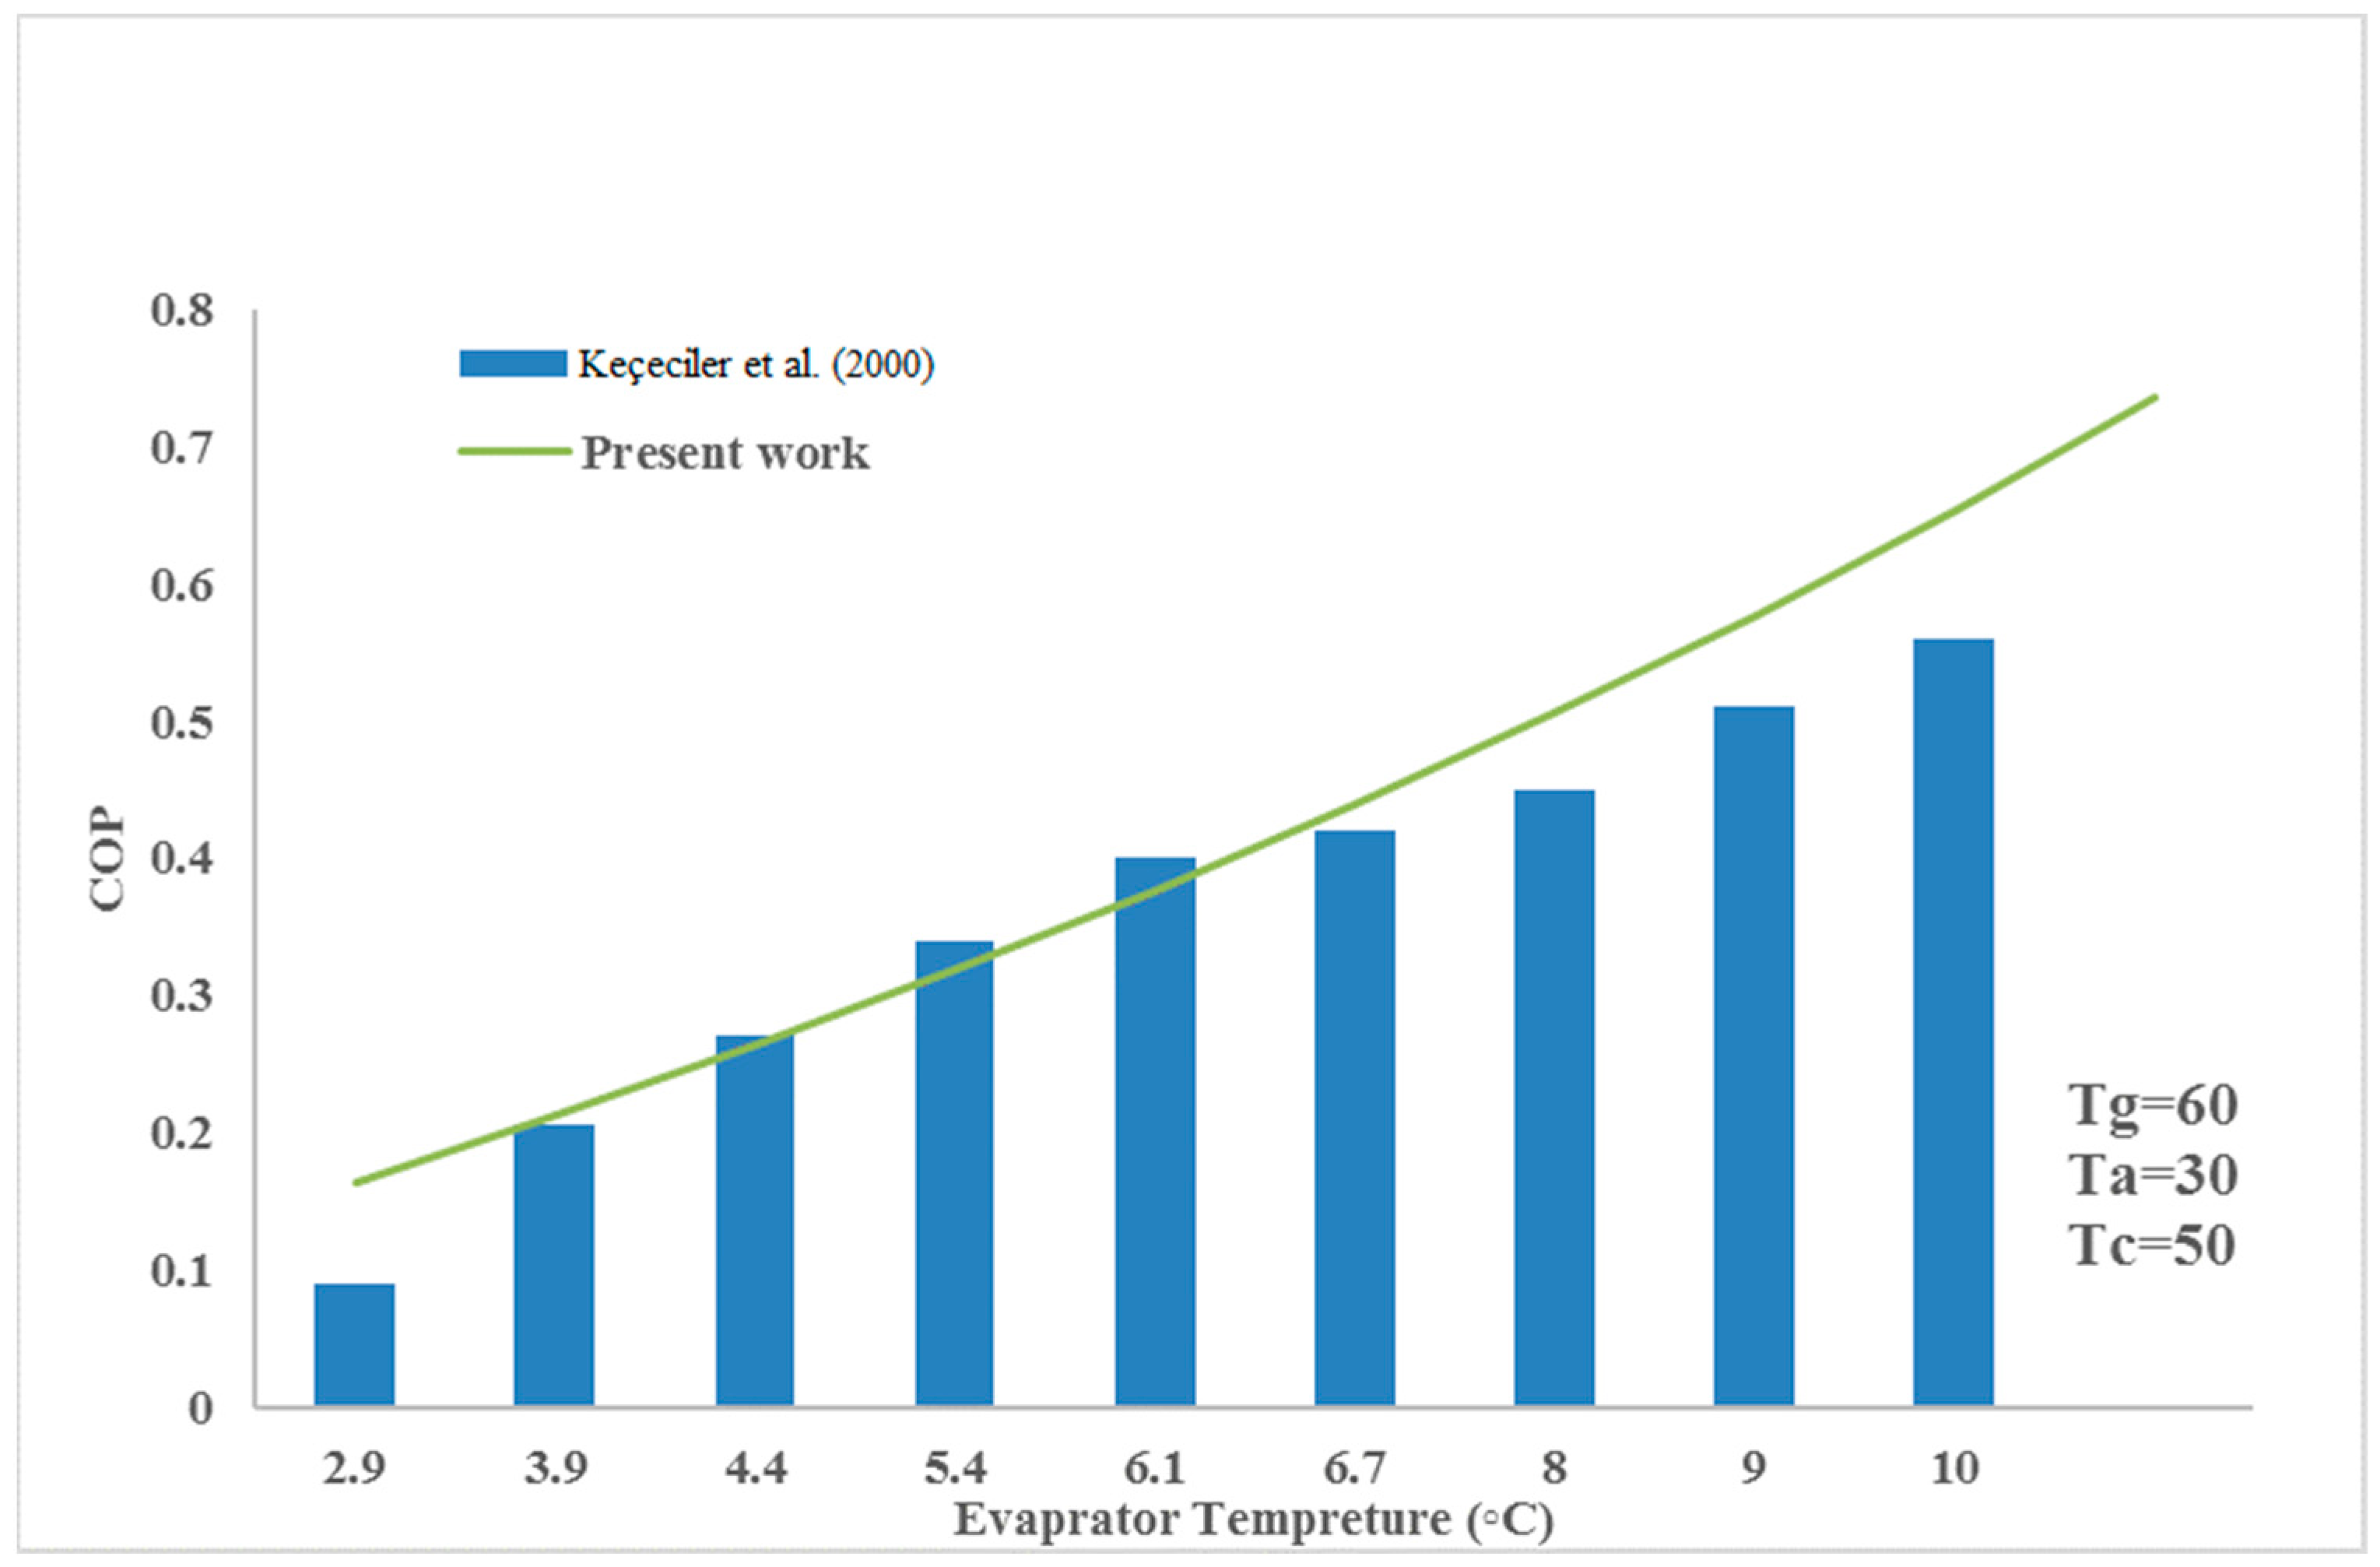
3.1. Validation
3.2. Parametric Study Results
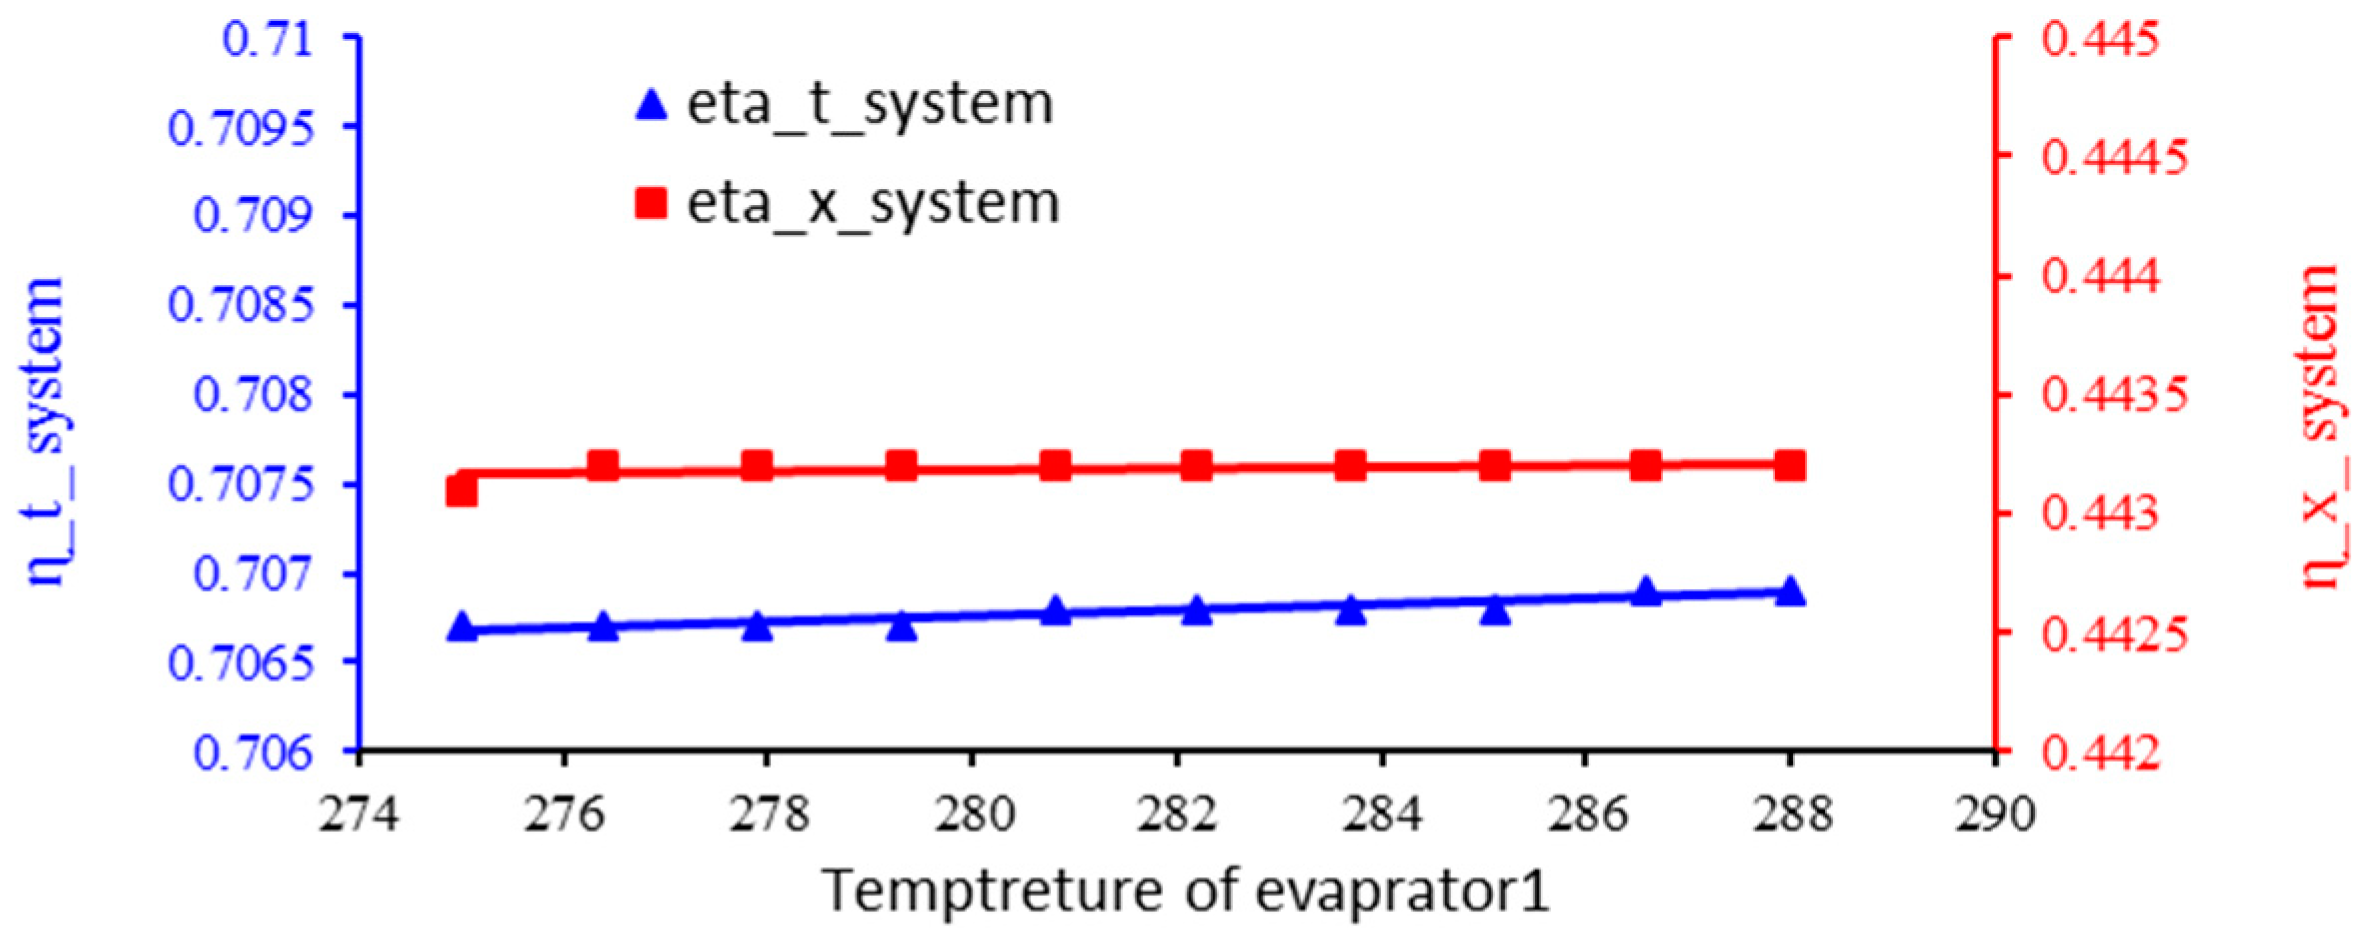
3.3. The Effect of Evaporator 1 Temperature on the Energy Efficiency and Exergy of the System
3.4. The Effect of Ammonia Concentration on the Energy Efficiency and Exergy of the System
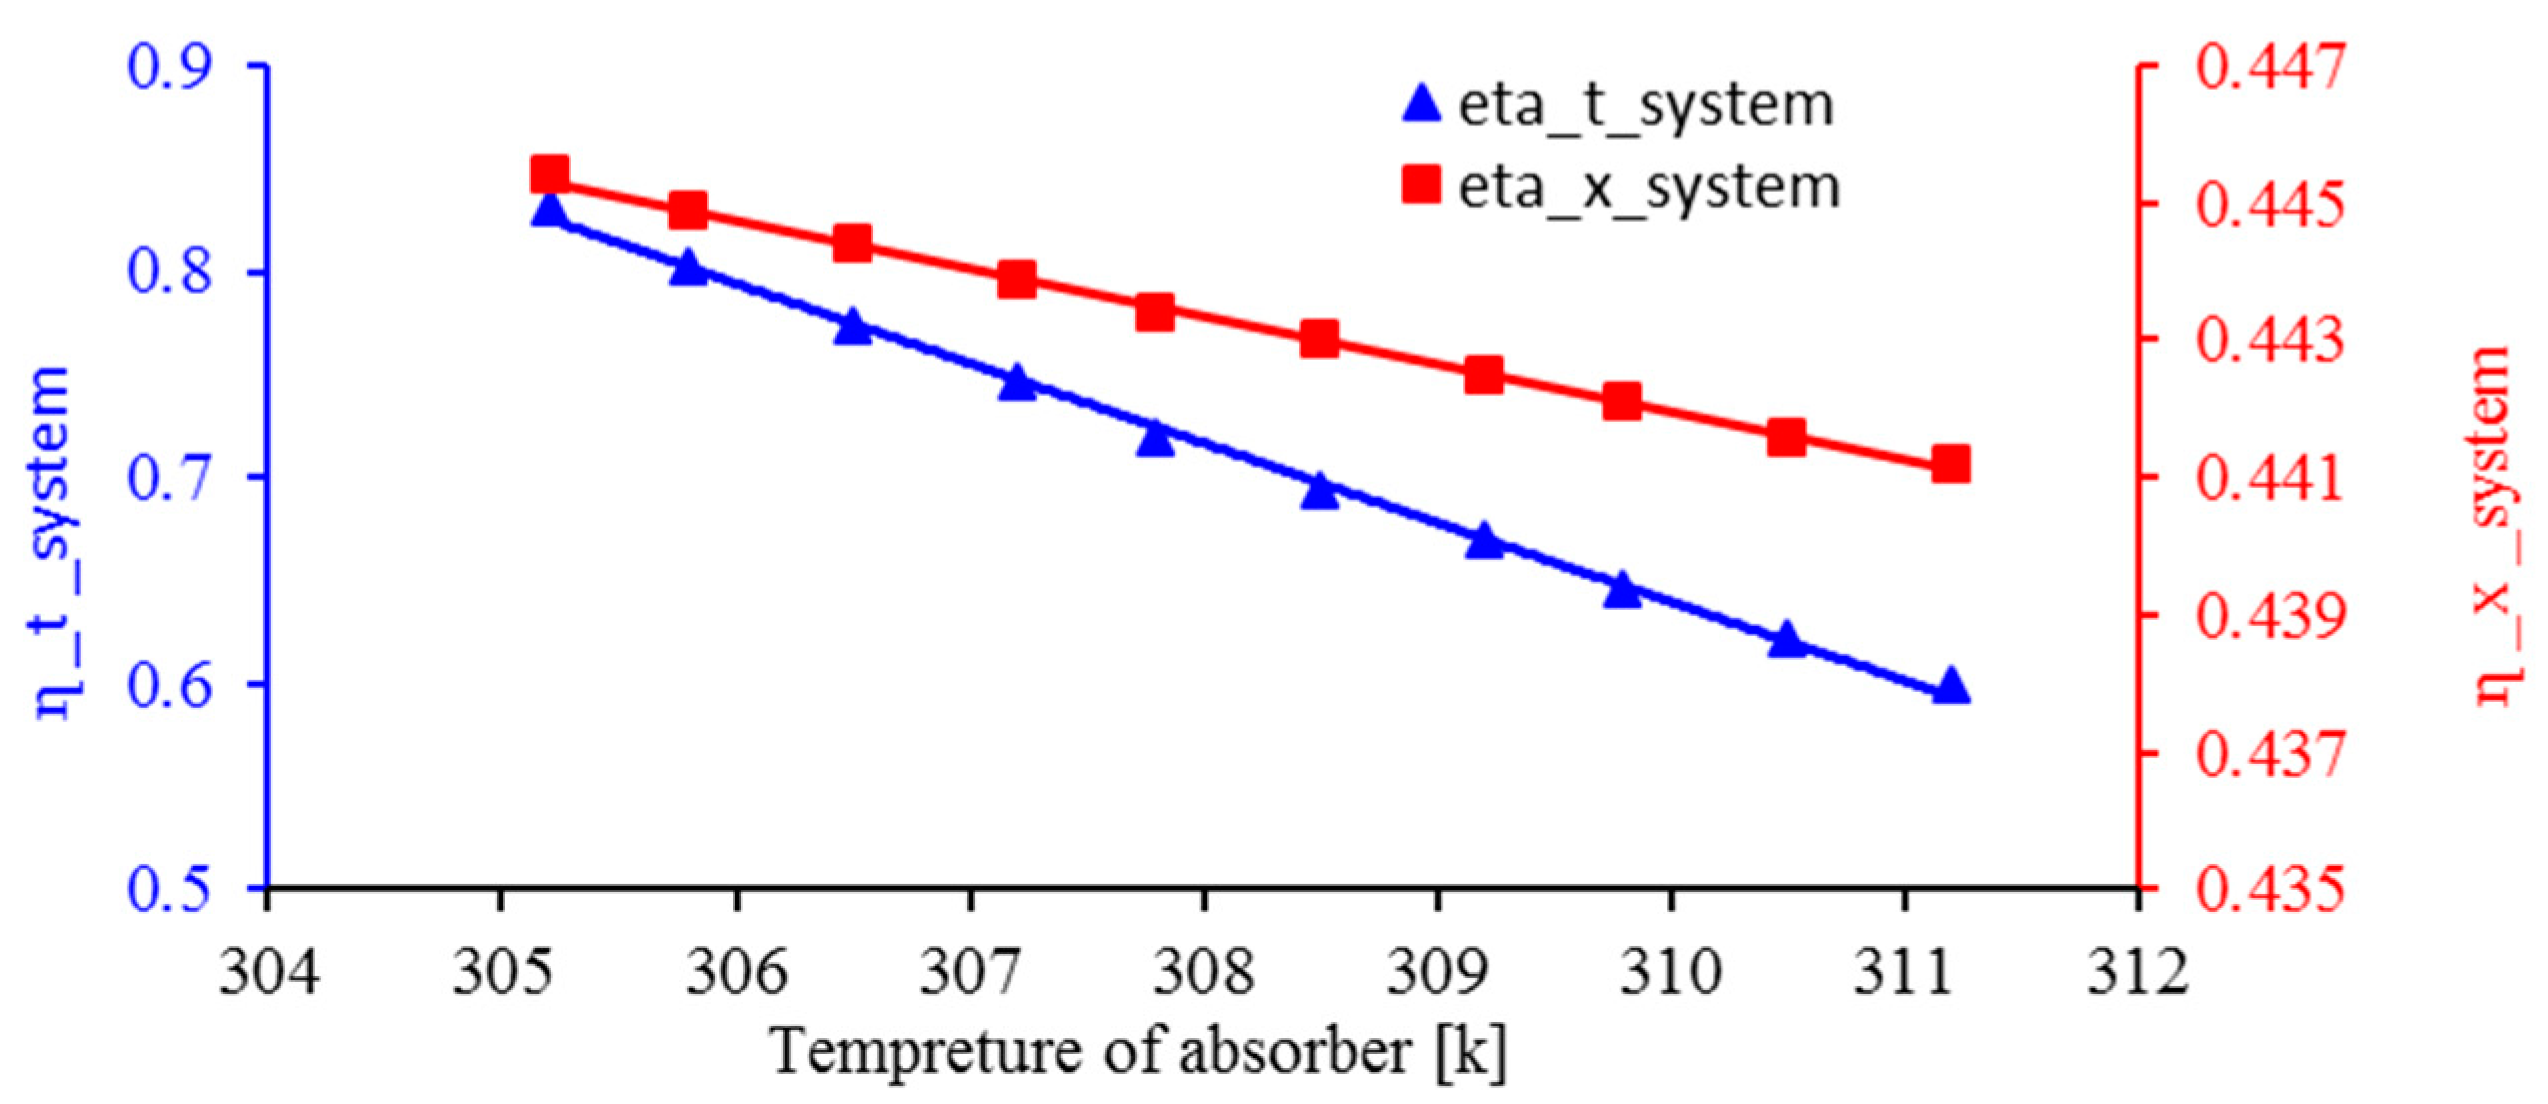
3.5. Effect of Absorber Temperature on Energy Efficiency and Exergy of the System
3.6. Effect of Heater Temperature Difference on Energy Efficiency and Exergy of the System
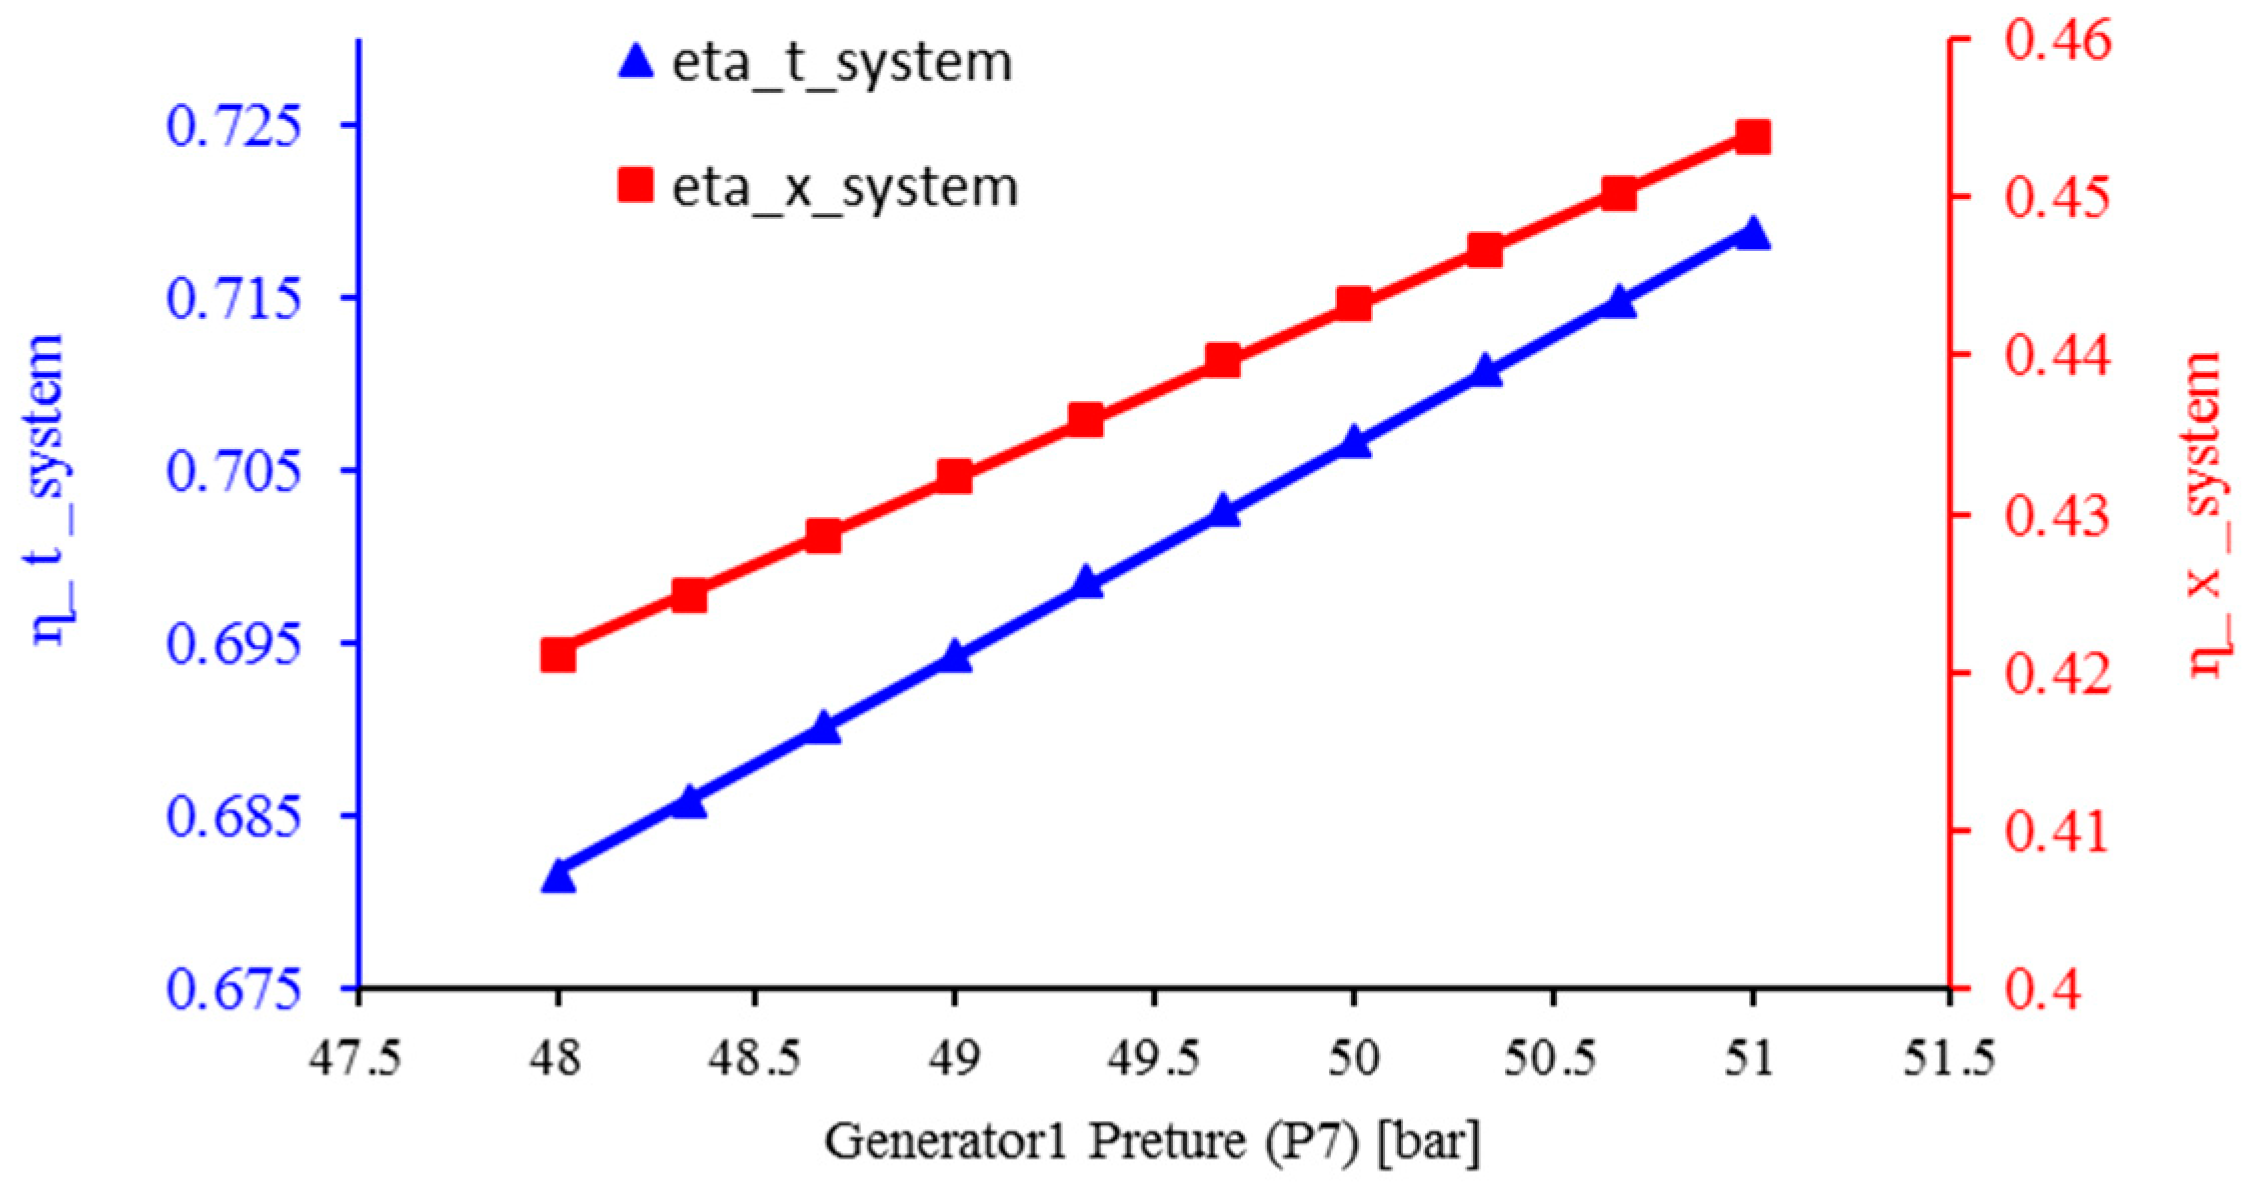
3.7. The Effect of Generator Pressure on Energy Efficiency and Exergy of the System
3.8. The Effect of Heat Source Temperature on Energy Efficiency and Exergy of the System
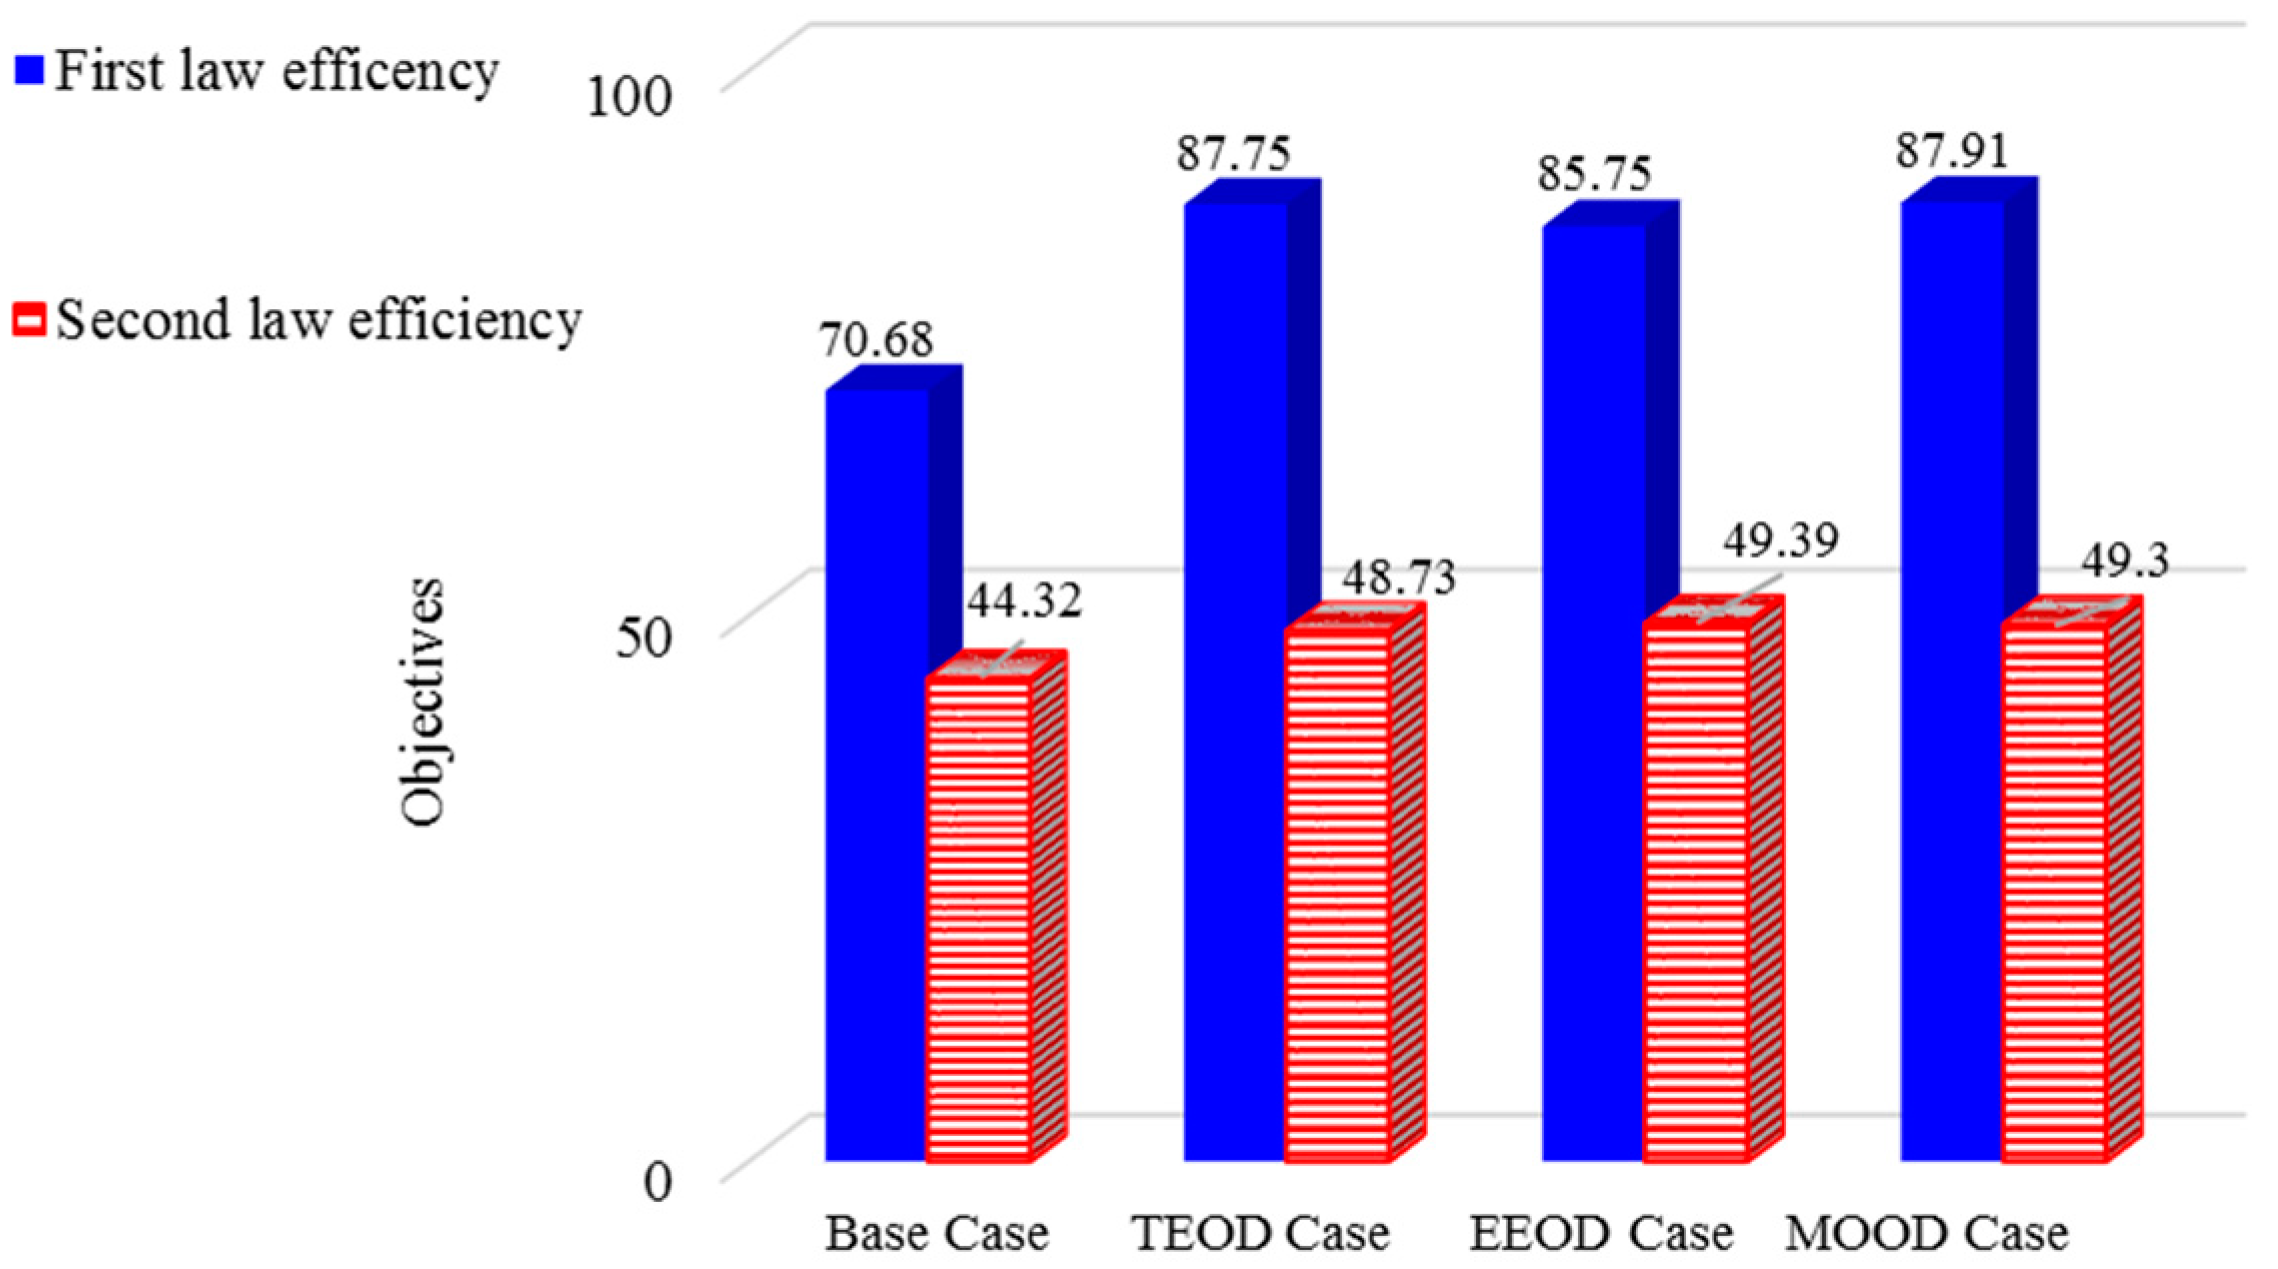
3.9. Optimization Results
- Comparing the optimization results between the basic study and TEOD shows that in the TEOD mode, energy efficiency and exergy efficiency improved by 24.15% and 9.9%. In this case, from the point of view of the first law, the results are very satisfactory.
- The comparison of the optimization results between the basic study and EEOD shows that in EEOD, the energy efficiency and exergy efficiency improved by 21.32% and 11.43%. Compared to the TEOD mode, this mode is very satisfactory from the point of view of the second law of results.
- The comparison of the optimization results between the basic study and MOOD shows that in MOOD, the energy efficiency and exergy efficiency improved by 24.37% and 11.23%. In this case, the net production power, the heat of the evaporators and the amount of freshwater produced increased compared to the initial state.
4. Conclusions
- The maximum amount of energy efficiency and exergy of the whole system in the range of heat source temperature between 740 and 750 is equal to 74.2 and 47.7.
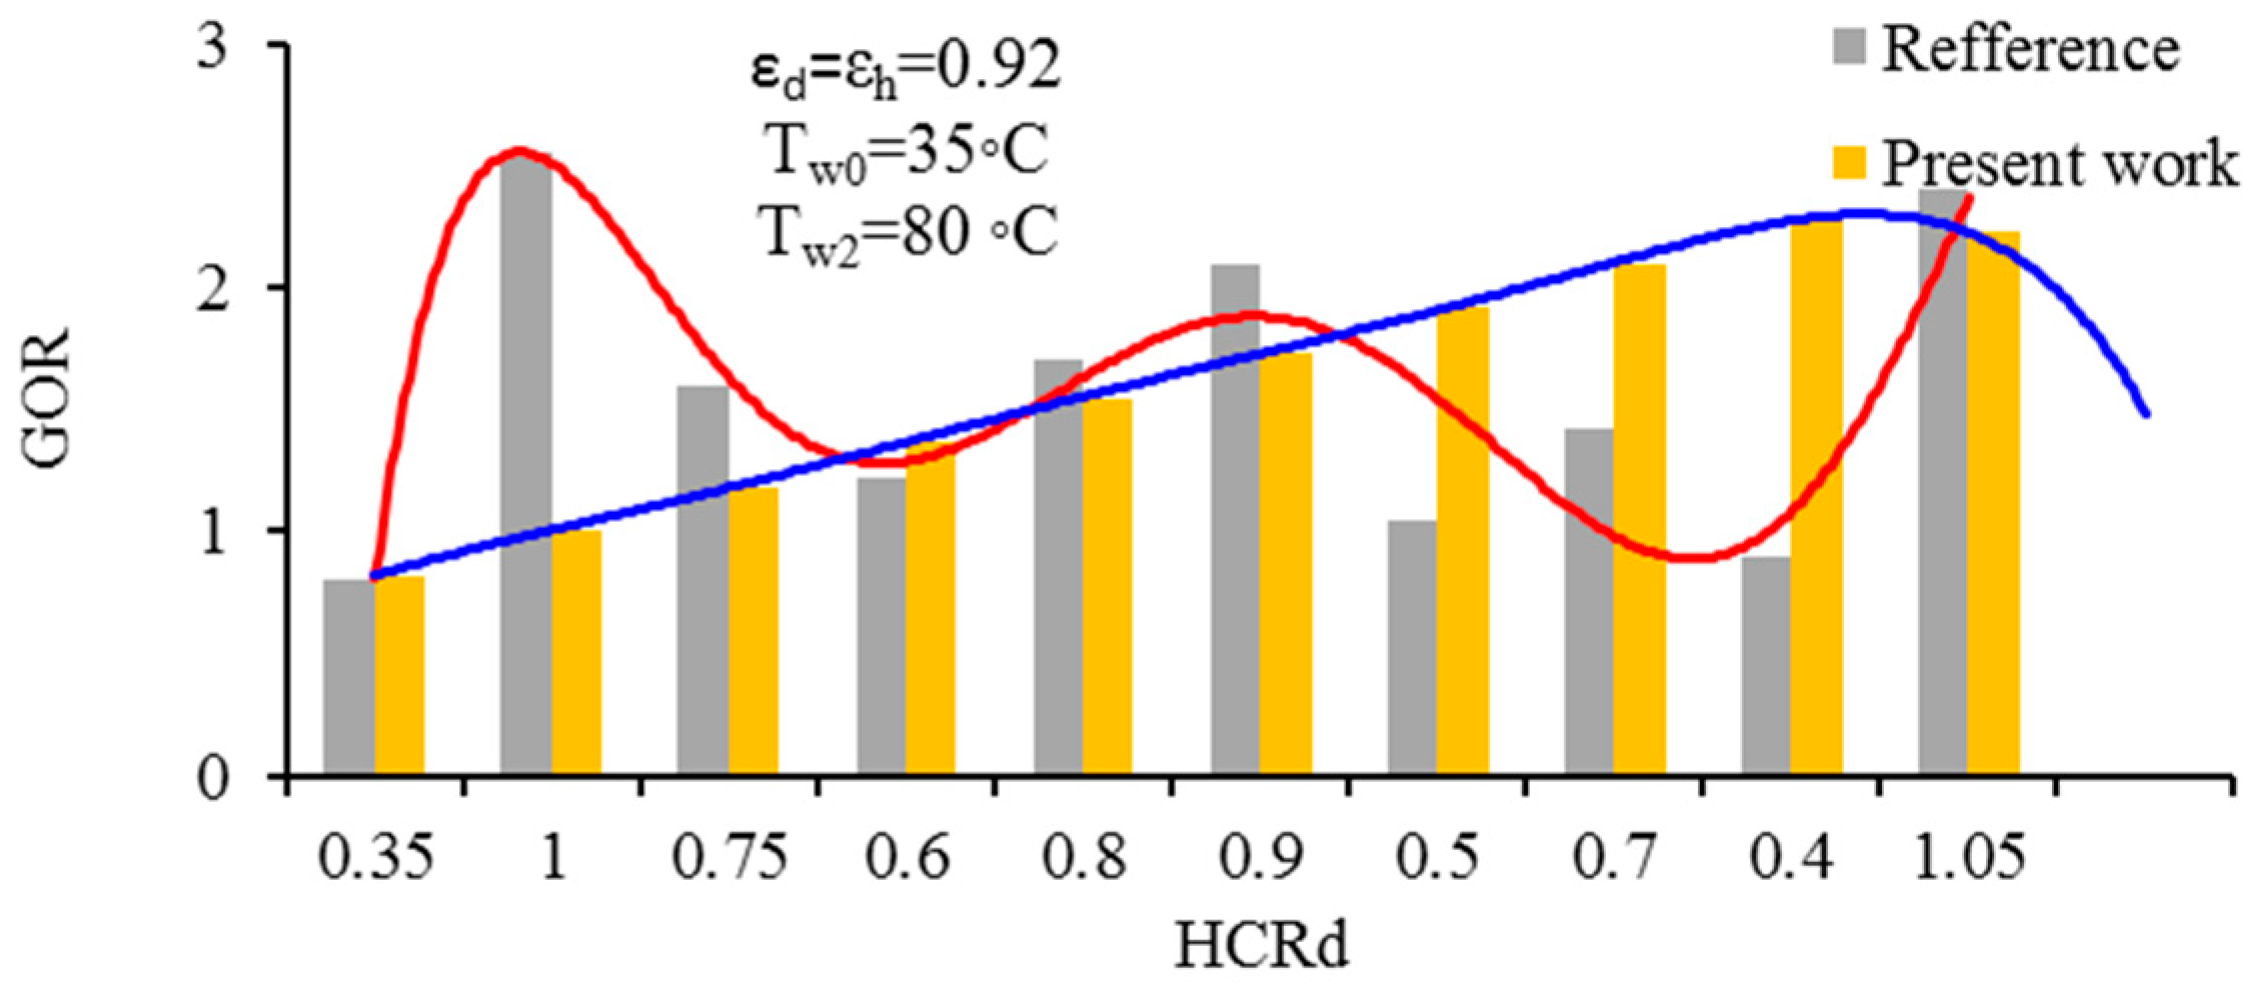
- The dehumidifier plays an important role in the freshwater production system. By increasing the dehumidifier performance coefficient (HCRd), the performance of the water softener system (GOR) increases.
- By increasing the temperature of the thermal pool, the temperature of the evaporator improves the overall system performance and increases the energy efficiency and exergy of the system.
- An increase in the concentration of ammonia in the Kalina cycle agent fluid solution and an increase in the temperature difference in the heater (decreasing the efficiency of the heater) will decrease the energy efficiency and exergy of the overall system.
- The flow rate of fresh water produced in the optimal conditions of the overall system was calculated as 0.5 g/s. For future work, the following topics could be addressed:
Author Contributions
Funding
Institutional Review Board Statement
Informed Consent Statement
Data Availability Statement
Conflicts of Interest
References
- Al-Sulaiman, F.A.; Dincer, I.; Hamdullahpur, F. Energy and exergy analyses of a biomass trigeneration system using an organic Rankine cycle. Energy 2012, 45, 975–985. [Google Scholar] [CrossRef]
- Kearnry, D. EIA’s Outlook Through 2035; U.S. Energy Information Administration (EIA): Washington, DC, USA, 2010.
- Wu, D.W.; Wang, R.Z. Combined cooling, heating and power: A review. Prog. Energy Combust. Sci. 2006, 32, 459–495. [Google Scholar] [CrossRef]
- Alayi, R.; Rouhi, H. Techno-economic analysis of electrical energy generation from urban waste in Hamadan, Iran. Int. J. Des. Nat. Ecodynamics 2020, 15, 337–341. [Google Scholar] [CrossRef]
- Alayi, R.; Sobhani, E.; Najafi, A. Analysis of environmental impacts on the characteristics of gas released from biomass. Anthropog. Pollut. 2020, 4, 1–14. [Google Scholar]
- Alayi, R.; Sadeghzadeh, M.; Shahbazi, M.; Seyednouri, S.R.; Issakhov, A. Analysis of 3E (energy-economical-environmental) for biogas production from landfill: A case study. Int. J. Chem. Eng. 2022, 2022, 3033701. [Google Scholar] [CrossRef]
- Alayi, R.; Jahangeri, M.; Monfared, H. Optimal location of electrical generation from urban solid waste for biomass power plants. Anthropog. Pollut. 2020, 4, 44–51. [Google Scholar]
- Geng, D.; Gao, X. Thermodynamic and exergoeconomic optimization of a novel cooling, desalination and power multigeneration system based on ocean thermal energy. Renew. Energy 2023, 202, 17–39. [Google Scholar] [CrossRef]
- Wang, A.; Wang, S.; Ebrahimi-Moghadam, A.; Farzaneh-Gord, M.; Moghadam, A.J. Techno-economic and techno-environmental assessment and multi-objective optimization of a new CCHP system based on waste heat recovery from regenerative Brayton cycle. Energy 2021, 241, 122521. [Google Scholar] [CrossRef]
- Xing, L.; Li, J. Proposal of biomass/geothermal hybrid driven poly-generation plant centering cooling, heating, power, and hydrogen production with CO2 capturing: Design and 3E evaluation. Fuel 2022, 330, 125593. [Google Scholar] [CrossRef]
- Wang, J.; Chen, B.; Che, Y. Bi-level sizing optimization of a distributed solar hybrid CCHP system considering economic, energy, and environmental objectives. Int. J. Electr. Power Energy Syst. 2023, 145, 108864. [Google Scholar] [CrossRef]
- Delgado-Gonzaga, J.; Rivera, W.; Juárez-Romero, D. Integration of cycles by absorption for the production of desalinated water and cooling. Appl. Therm. Eng. 2023, 220, 119718. [Google Scholar] [CrossRef]
- Askari, I.B.; Shahsavar, A. The exergo-economic analysis of two novel combined ejector heat pump/humidification-dehumidification desalination systems. Sustain. Energy Technol. Assess. 2022, 53, 102561. [Google Scholar] [CrossRef]
- Bejan, A.; Tsatsaronis, G.; Moran, M.J. Thermal Design and Optimization; John Wiley & Sons: Hoboken, NJ, USA, 1995. [Google Scholar]
- Szargut, J. Exergy Method: Technical and Ecological Applications; WIT Press: Billerica, MA, USA, 2005; Volume 18. [Google Scholar]
- Basu, P. Combustion and Gasification in Fluidized Beds; CRC Press: Boca Raton, FL, USA, 2006. [Google Scholar]
- Keçeciler, A.; Acar, H.; Doğan, A. Thermodynamic analysis of the absorption refrigeration system with geothermal energy: An experimental study. Energy Convers. Manag. 2000, 41, 37–48. [Google Scholar] [CrossRef]
- Narayan, G.P.; Sharqawy, M.H.; Leinhard, V.J.H.; Zubair, S.M. Thermodynamic analysis of humidification dehumidification desalination cycles. Desalin. Water Treat. 2010, 16, 339–353. [Google Scholar] [CrossRef] [Green Version]
- Narayan, G.P.; Lienhard, V.J.H.; Zubair, S.M. Entropy generation minimization of combined heat and mass transfer devices. Int. J. Therm. Sci. 2010, 49, 2057–2066. [Google Scholar] [CrossRef]
- Ghaebi, H.; Parikhani, T.; Rostamzadeh, H.; Farhang, B. Proposal and assessment of a novel geothermal combined cooling and power cycle based on Kalina and ejector refrigeration cycles. Appl. Therm. Eng. 2018, 130, 767–781. [Google Scholar] [CrossRef]
- Rostamzadeh, H.; Rostamzadeh, J.; Matin, P.S.; Ghaebi, H. Novel dual-loop bi-evaporator vapor compression refrigeration cycles for freezing and air-conditioning applications. Appl. Therm. Eng. 2018, 138, 563–582. [Google Scholar] [CrossRef]
- Sun, F.; Zhou, W.; Ikegami, Y.; Nakagami, K.; Su, X. Energy–exergy analysis and optimization of the solar-boosted Kalina cycle system 11 (KCS-11). Renew. Energy 2014, 66, 268–279. [Google Scholar] [CrossRef]
- Sag, N.B.; Ersoy, H.; Hepbasli, A.; Halkaci, H. Energetic and exergetic comparison of basic and ejector expander refrigeration systems operating under the same external conditions and cooling capacities. Energy Convers. Manag. 2015, 90, 184–194. [Google Scholar] [CrossRef]
- Rostamzadeh, H.; Ebadollahi, M.; Ghaebi, H.; Shokri, A. Comparative study of two novel micro-CCHP systems based on organic Rankine cycle and Kalina cycle. Energy Convers. Manag. 2019, 183, 210–229. [Google Scholar] [CrossRef]
- Zare, V.; Mahmoudi, S.; Yari, M.; Amidpour, M. Thermoeconomic analysis and optimization of an ammonia–water power/cooling cogeneration cycle. Energy 2012, 47, 271–283. [Google Scholar] [CrossRef]


| Parameter | Calculated Value | [22] | Error % |
|---|---|---|---|
| (kW) | 3982 | 3905 | 1/9 |
| , Kalina | 287/5 | 285/6 | 0/66 |
| X [12] (%) | 95/43 | 99/97 | 4/5 |
| ɳt, Kalina | 7/219 | 7/17 | 0/68 |
| Parameter | Calculated Value | [23] | Error % |
|---|---|---|---|
| (kW) | 4/367 | 4/3 | 1/5 |
| (kW) | 1/6 | 1/52 | 5/2 |
| Parameter | Base Case | TEOD Case | EEOD Case | MOOD Case |
|---|---|---|---|---|
| - | 1 | 0 | 0.5 | |
| - | 0 | 1 | 0.5 | |
| 3 | 4.469 | 2.547 | 3.367 | |
| 0.9 | 0.873 | 0.8705 | 0.8716 | |
| (k) | 280 | 274.5 | 274 | 274.6 |
| (k) | 293.2 | 290.7 | 295.3 | 294.8 |
| (k) | 750 | 750 | 750 | 750 |
| (k) | 308.2 | 305.2 | 305.7 | 305.2 |
| (bar) | 50 | 50.84 | 51 | 51 |
| (kw) | 661.4 | 738.9 | 743 | 724.3 |
| (kw) | 4.367 | 4.25 | 7.239 | 4.251 |
| 1.185 | 1.088 | 1.218 | 1.1618 | |
| (kw) | 1339 | 1357 | 1357 | 1357 |
| (kw) | 1339 | 1357 | 1357 | 1357 |
Disclaimer/Publisher’s Note: The statements, opinions and data contained in all publications are solely those of the individual author(s) and contributor(s) and not of MDPI and/or the editor(s). MDPI and/or the editor(s) disclaim responsibility for any injury to people or property resulting from any ideas, methods, instructions or products referred to in the content. |
© 2023 by the authors. Licensee MDPI, Basel, Switzerland. This article is an open access article distributed under the terms and conditions of the Creative Commons Attribution (CC BY) license (https://creativecommons.org/licenses/by/4.0/).
Share and Cite
Harahap, T.H.; Candra, O.; Sabawi, Y.A.; Kareem, A.K.; Mohsen, K.S.; Alawadi, A.H.; Morovati, R.; Mohamed, E.M.; Khan, I.; Madsen, D.Ø. Thermodynamic Analysis and Optimization of the Micro-CCHP System with a Biomass Heat Source. Sustainability 2023, 15, 4273. https://doi.org/10.3390/su15054273
Harahap TH, Candra O, Sabawi YA, Kareem AK, Mohsen KS, Alawadi AH, Morovati R, Mohamed EM, Khan I, Madsen DØ. Thermodynamic Analysis and Optimization of the Micro-CCHP System with a Biomass Heat Source. Sustainability. 2023; 15(5):4273. https://doi.org/10.3390/su15054273
Chicago/Turabian StyleHarahap, Tua Halomoan, Oriza Candra, Younis A. Sabawi, Ai Kamil Kareem, Karrar Shareef Mohsen, Ahmed Hussien Alawadi, Reza Morovati, Ehab Mahamoud Mohamed, Imran Khan, and Dag Øivind Madsen. 2023. "Thermodynamic Analysis and Optimization of the Micro-CCHP System with a Biomass Heat Source" Sustainability 15, no. 5: 4273. https://doi.org/10.3390/su15054273