
A Meta-Synthesis Review of Occupant Comfort Assessment in Buildings (2002–2022)


Abstract
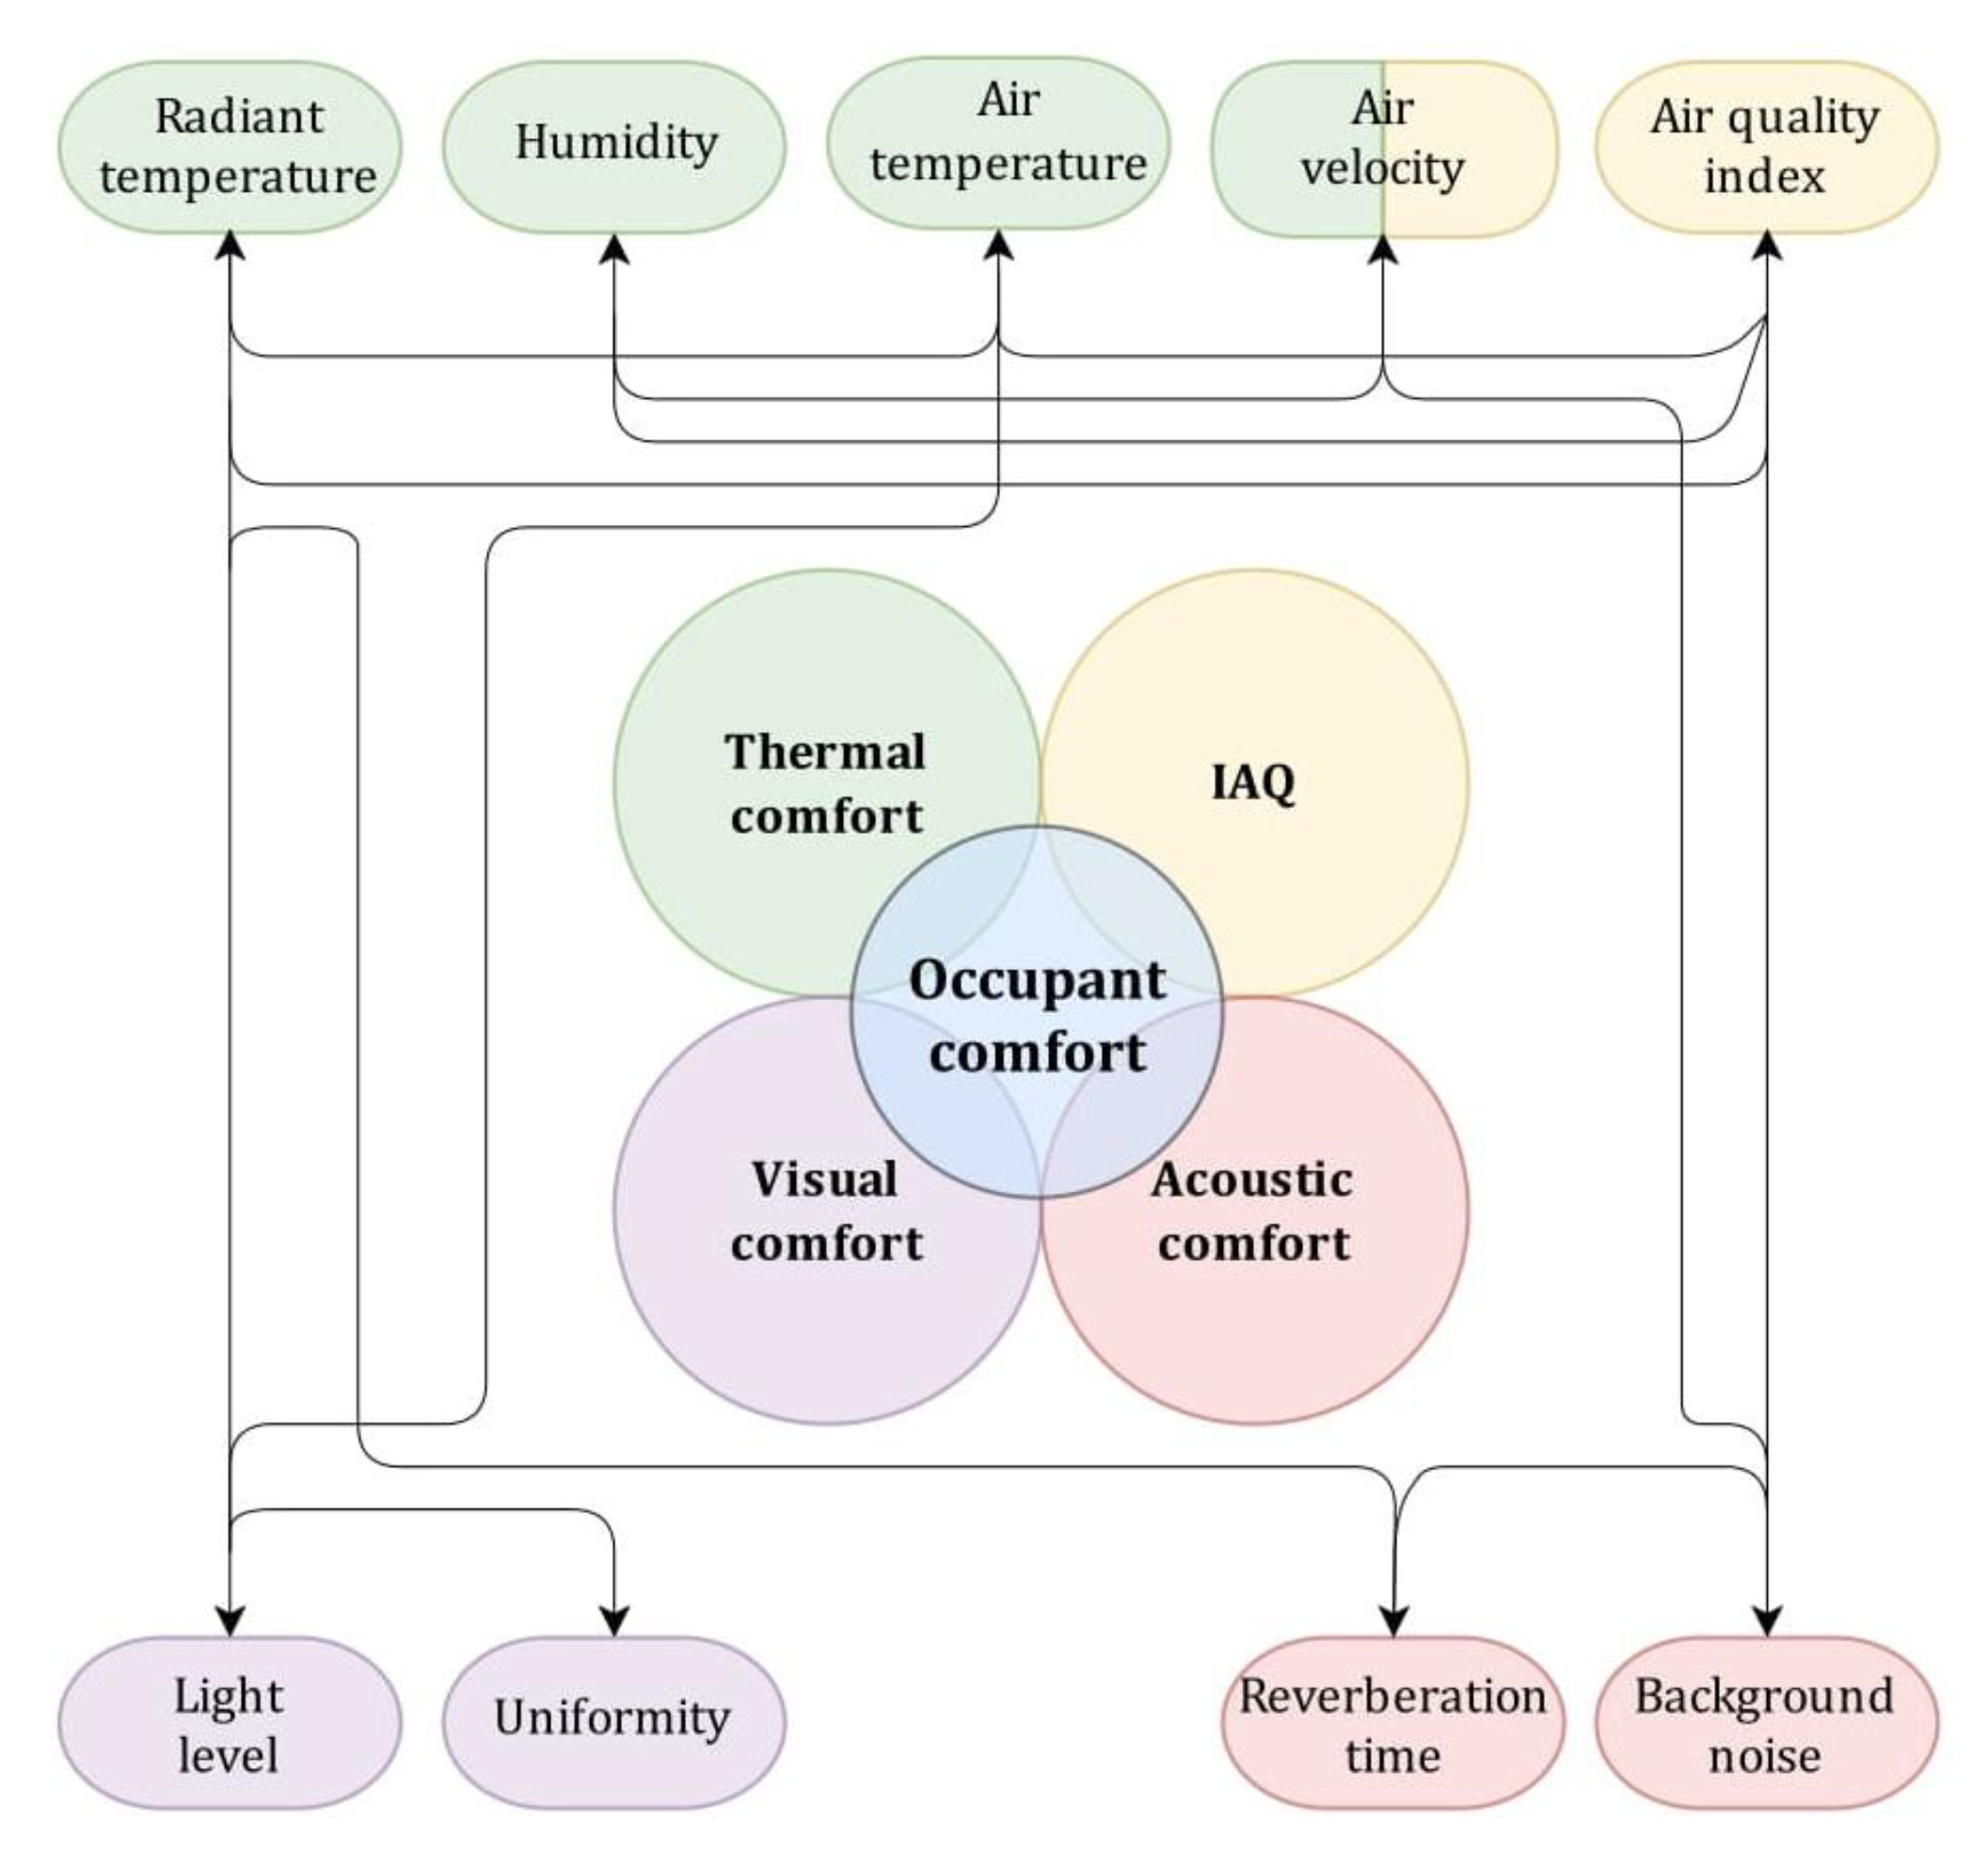
:1. Introduction
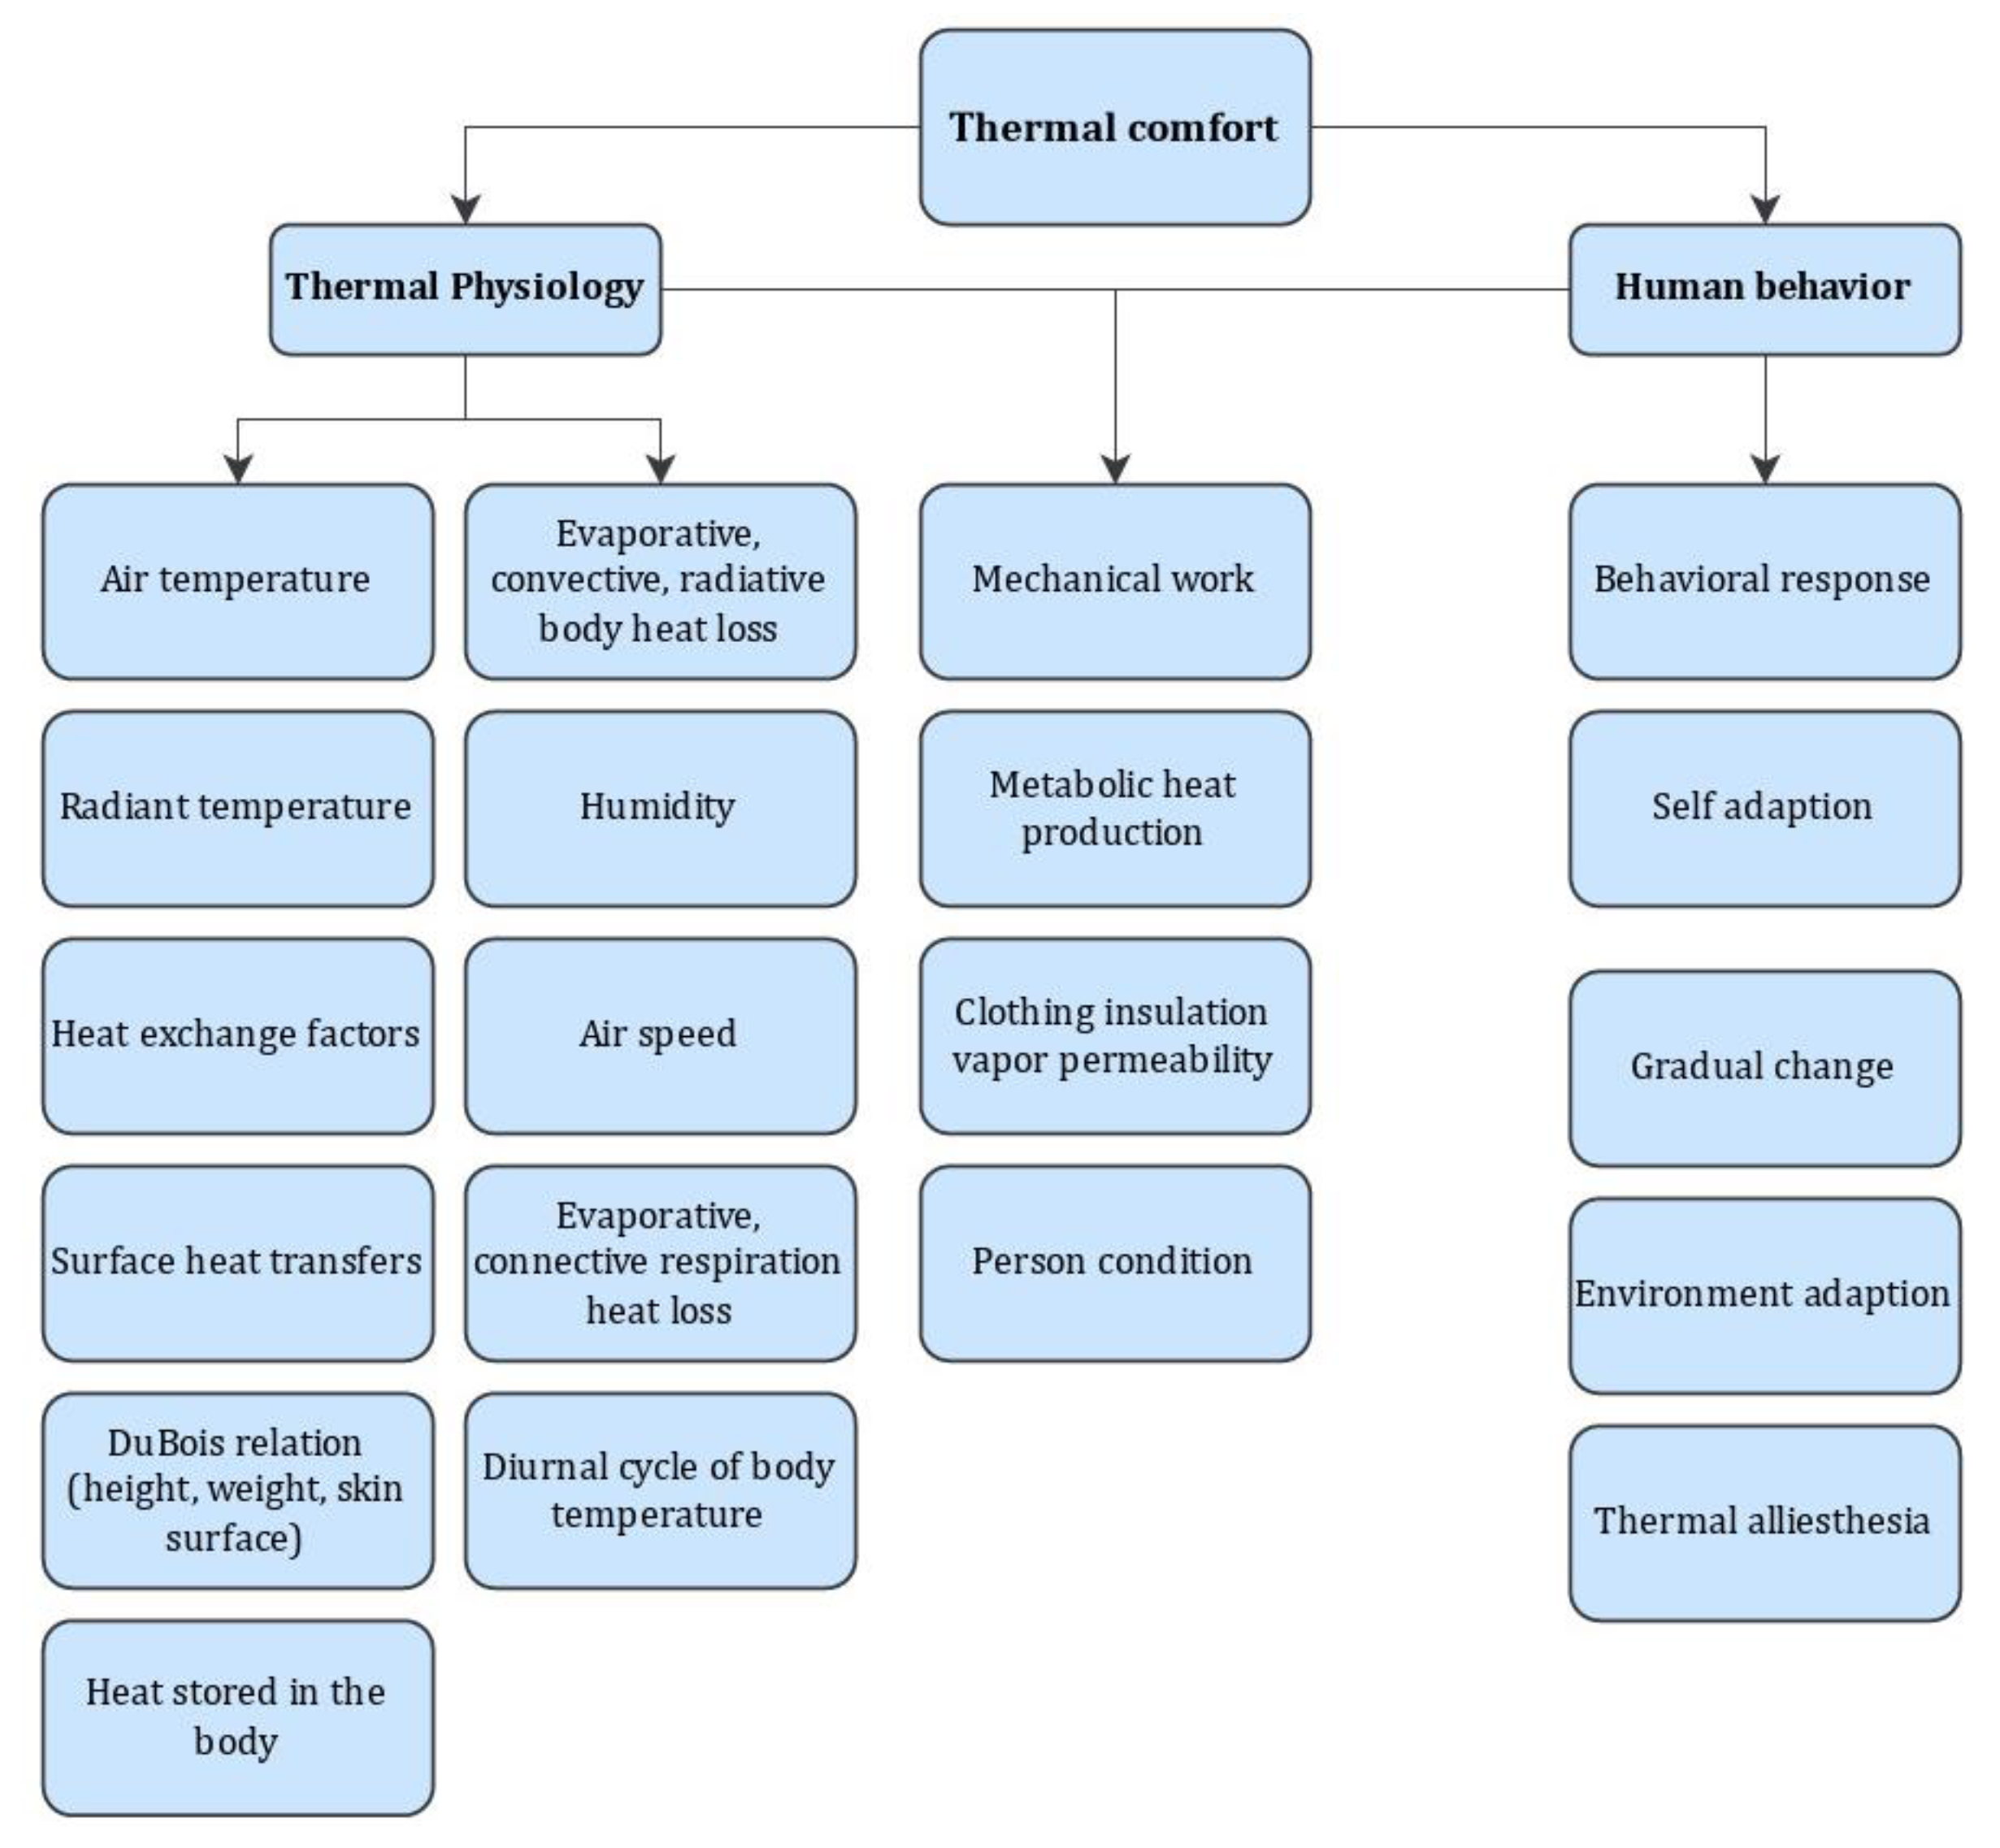
1.1. Thermal Comfort
1.2. Visual Comfort
1.3. Acoustic Comfort
1.4. IAQ
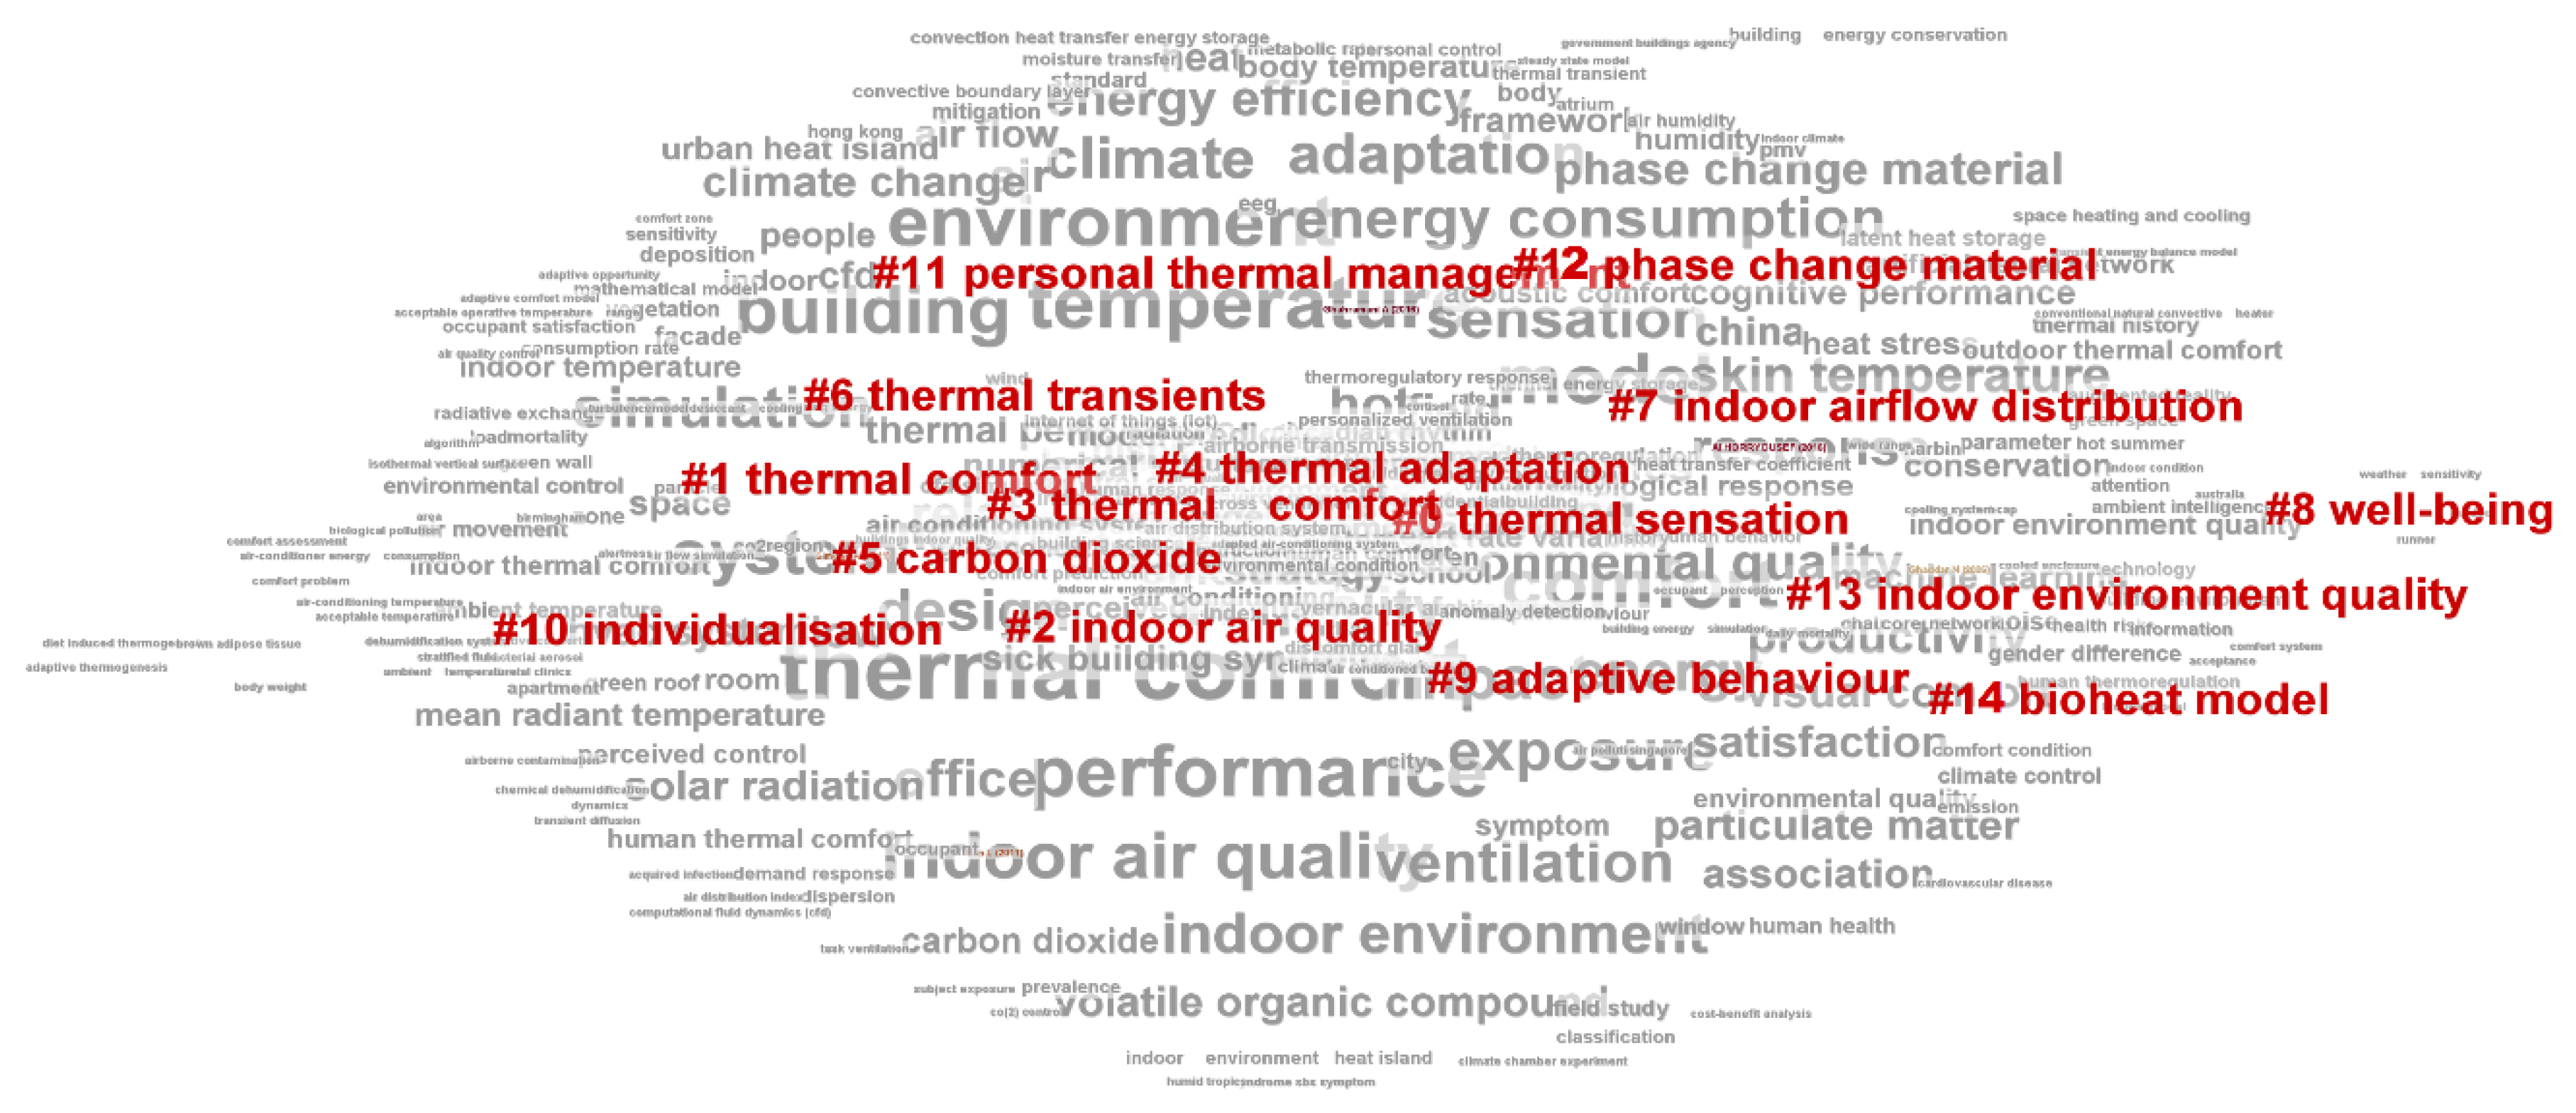
1.5. Meta-Synthesis Analysis
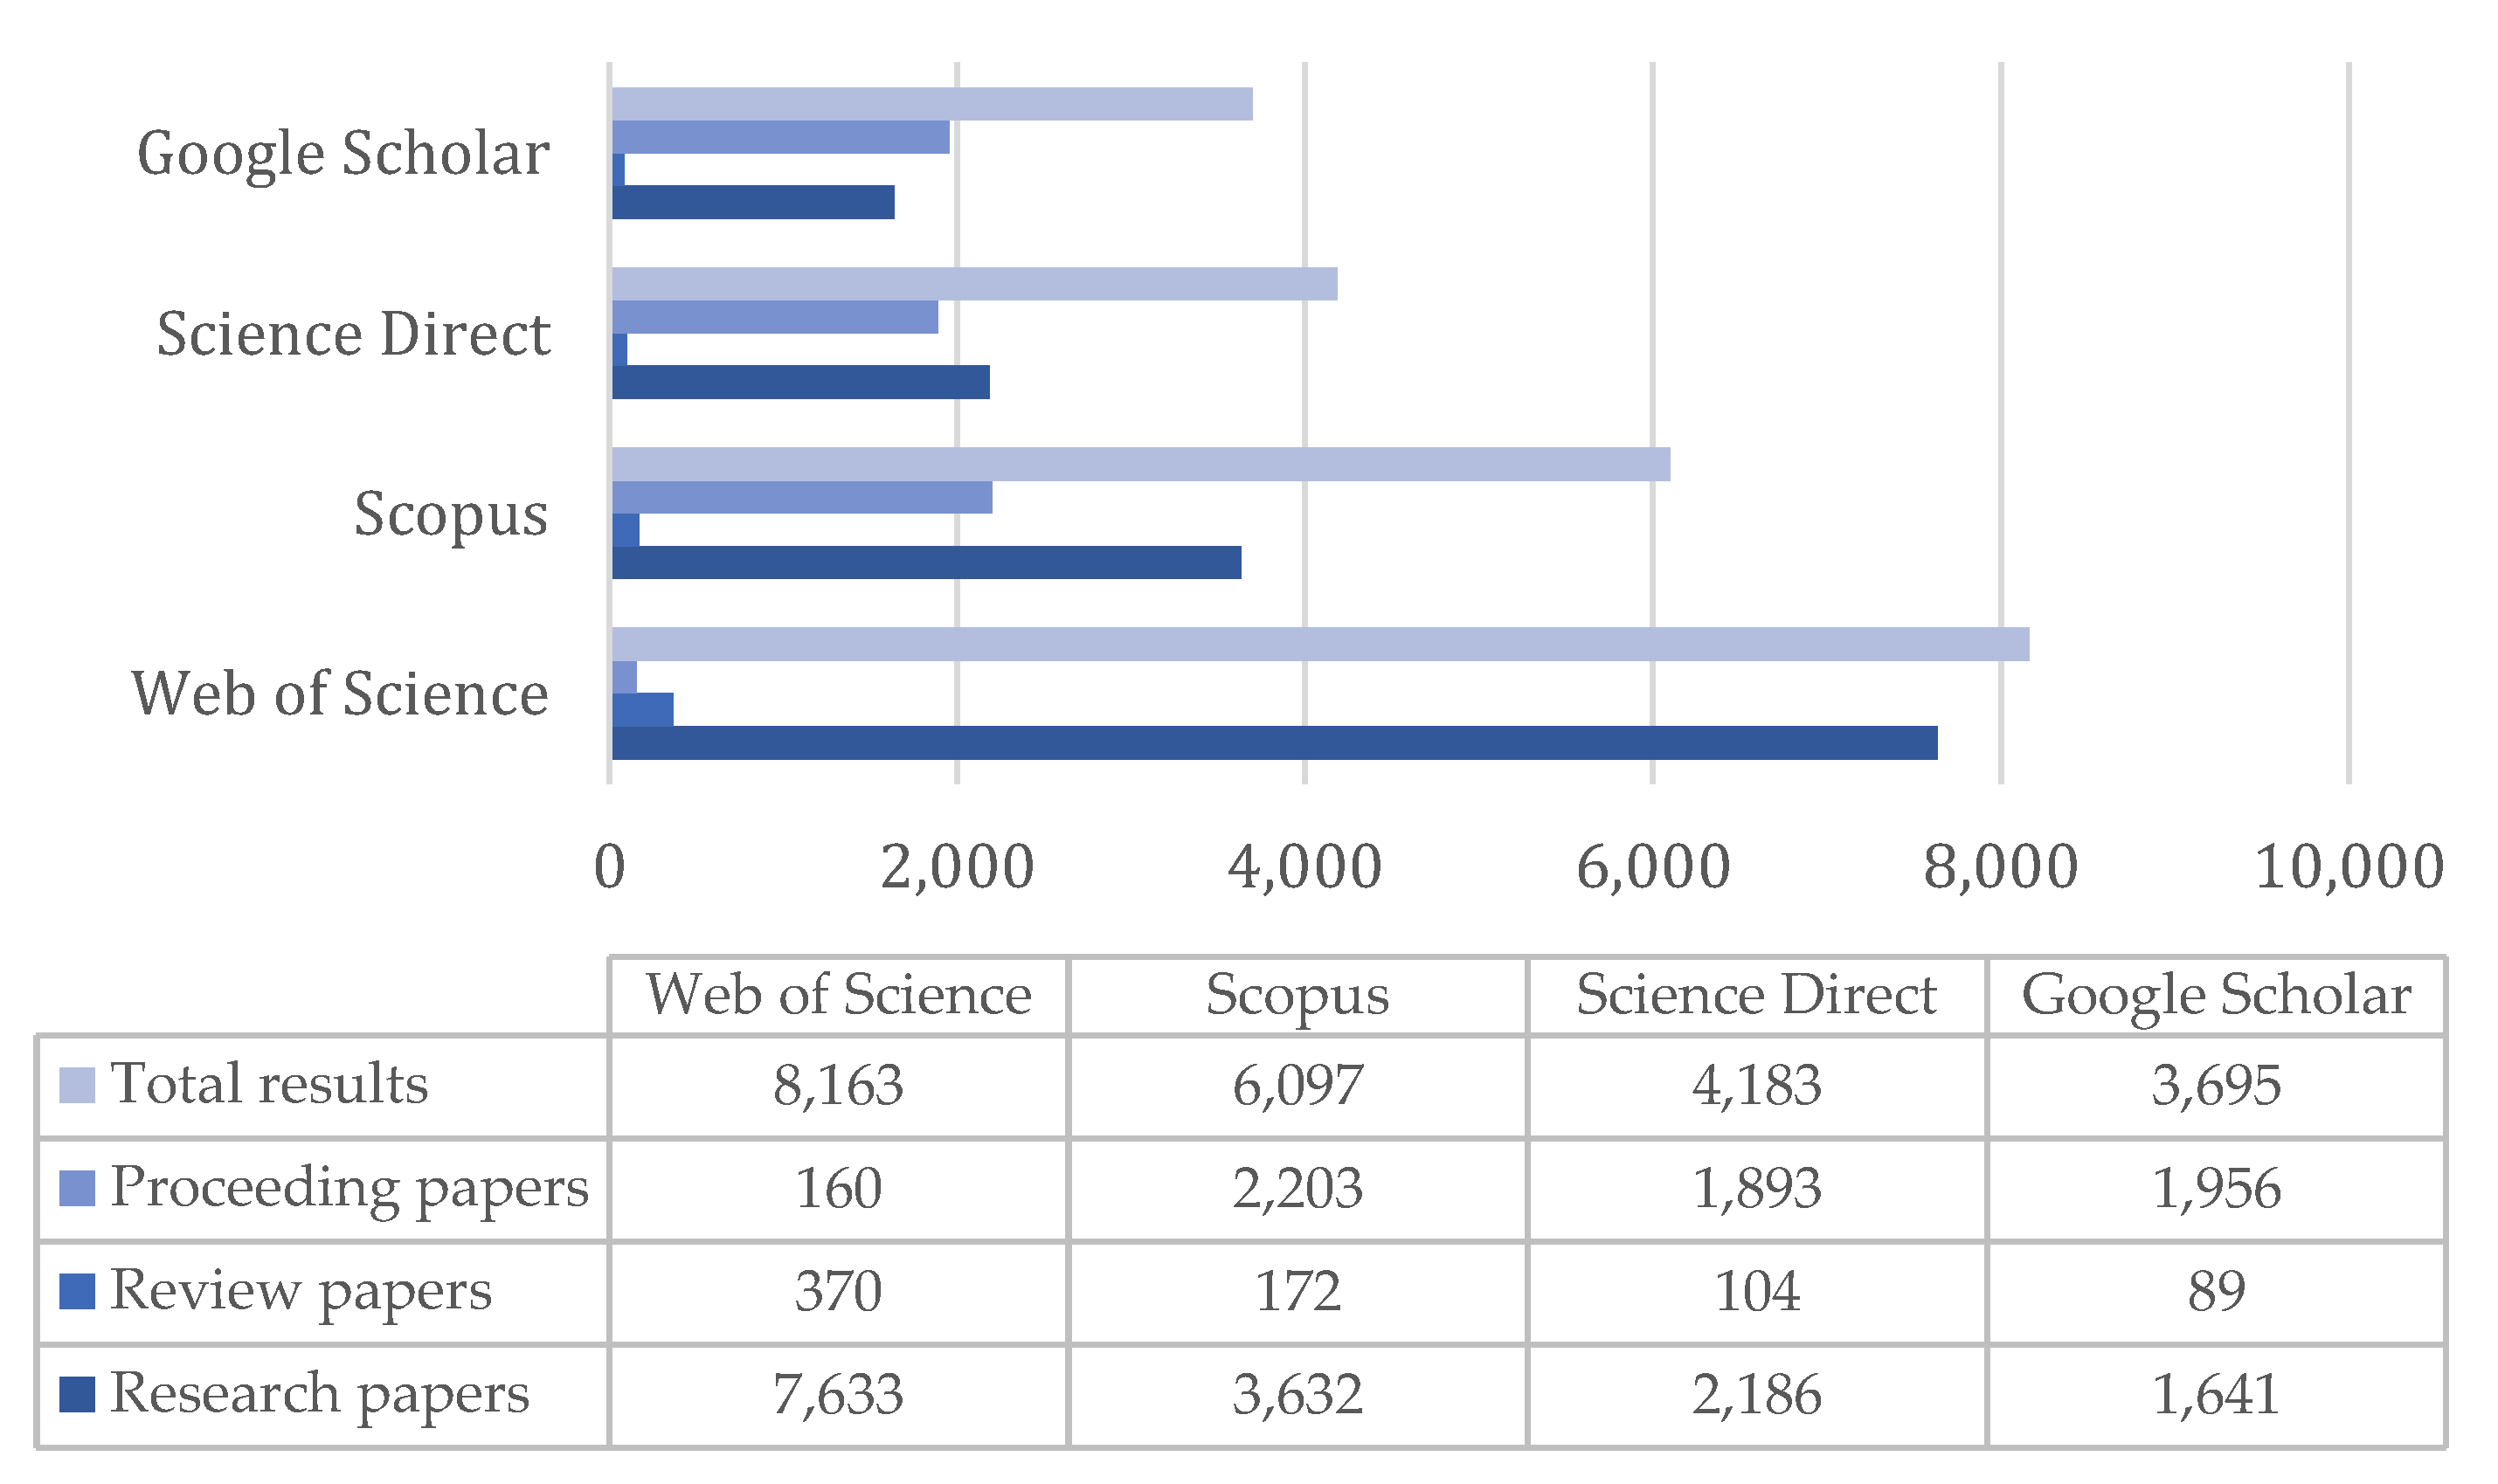
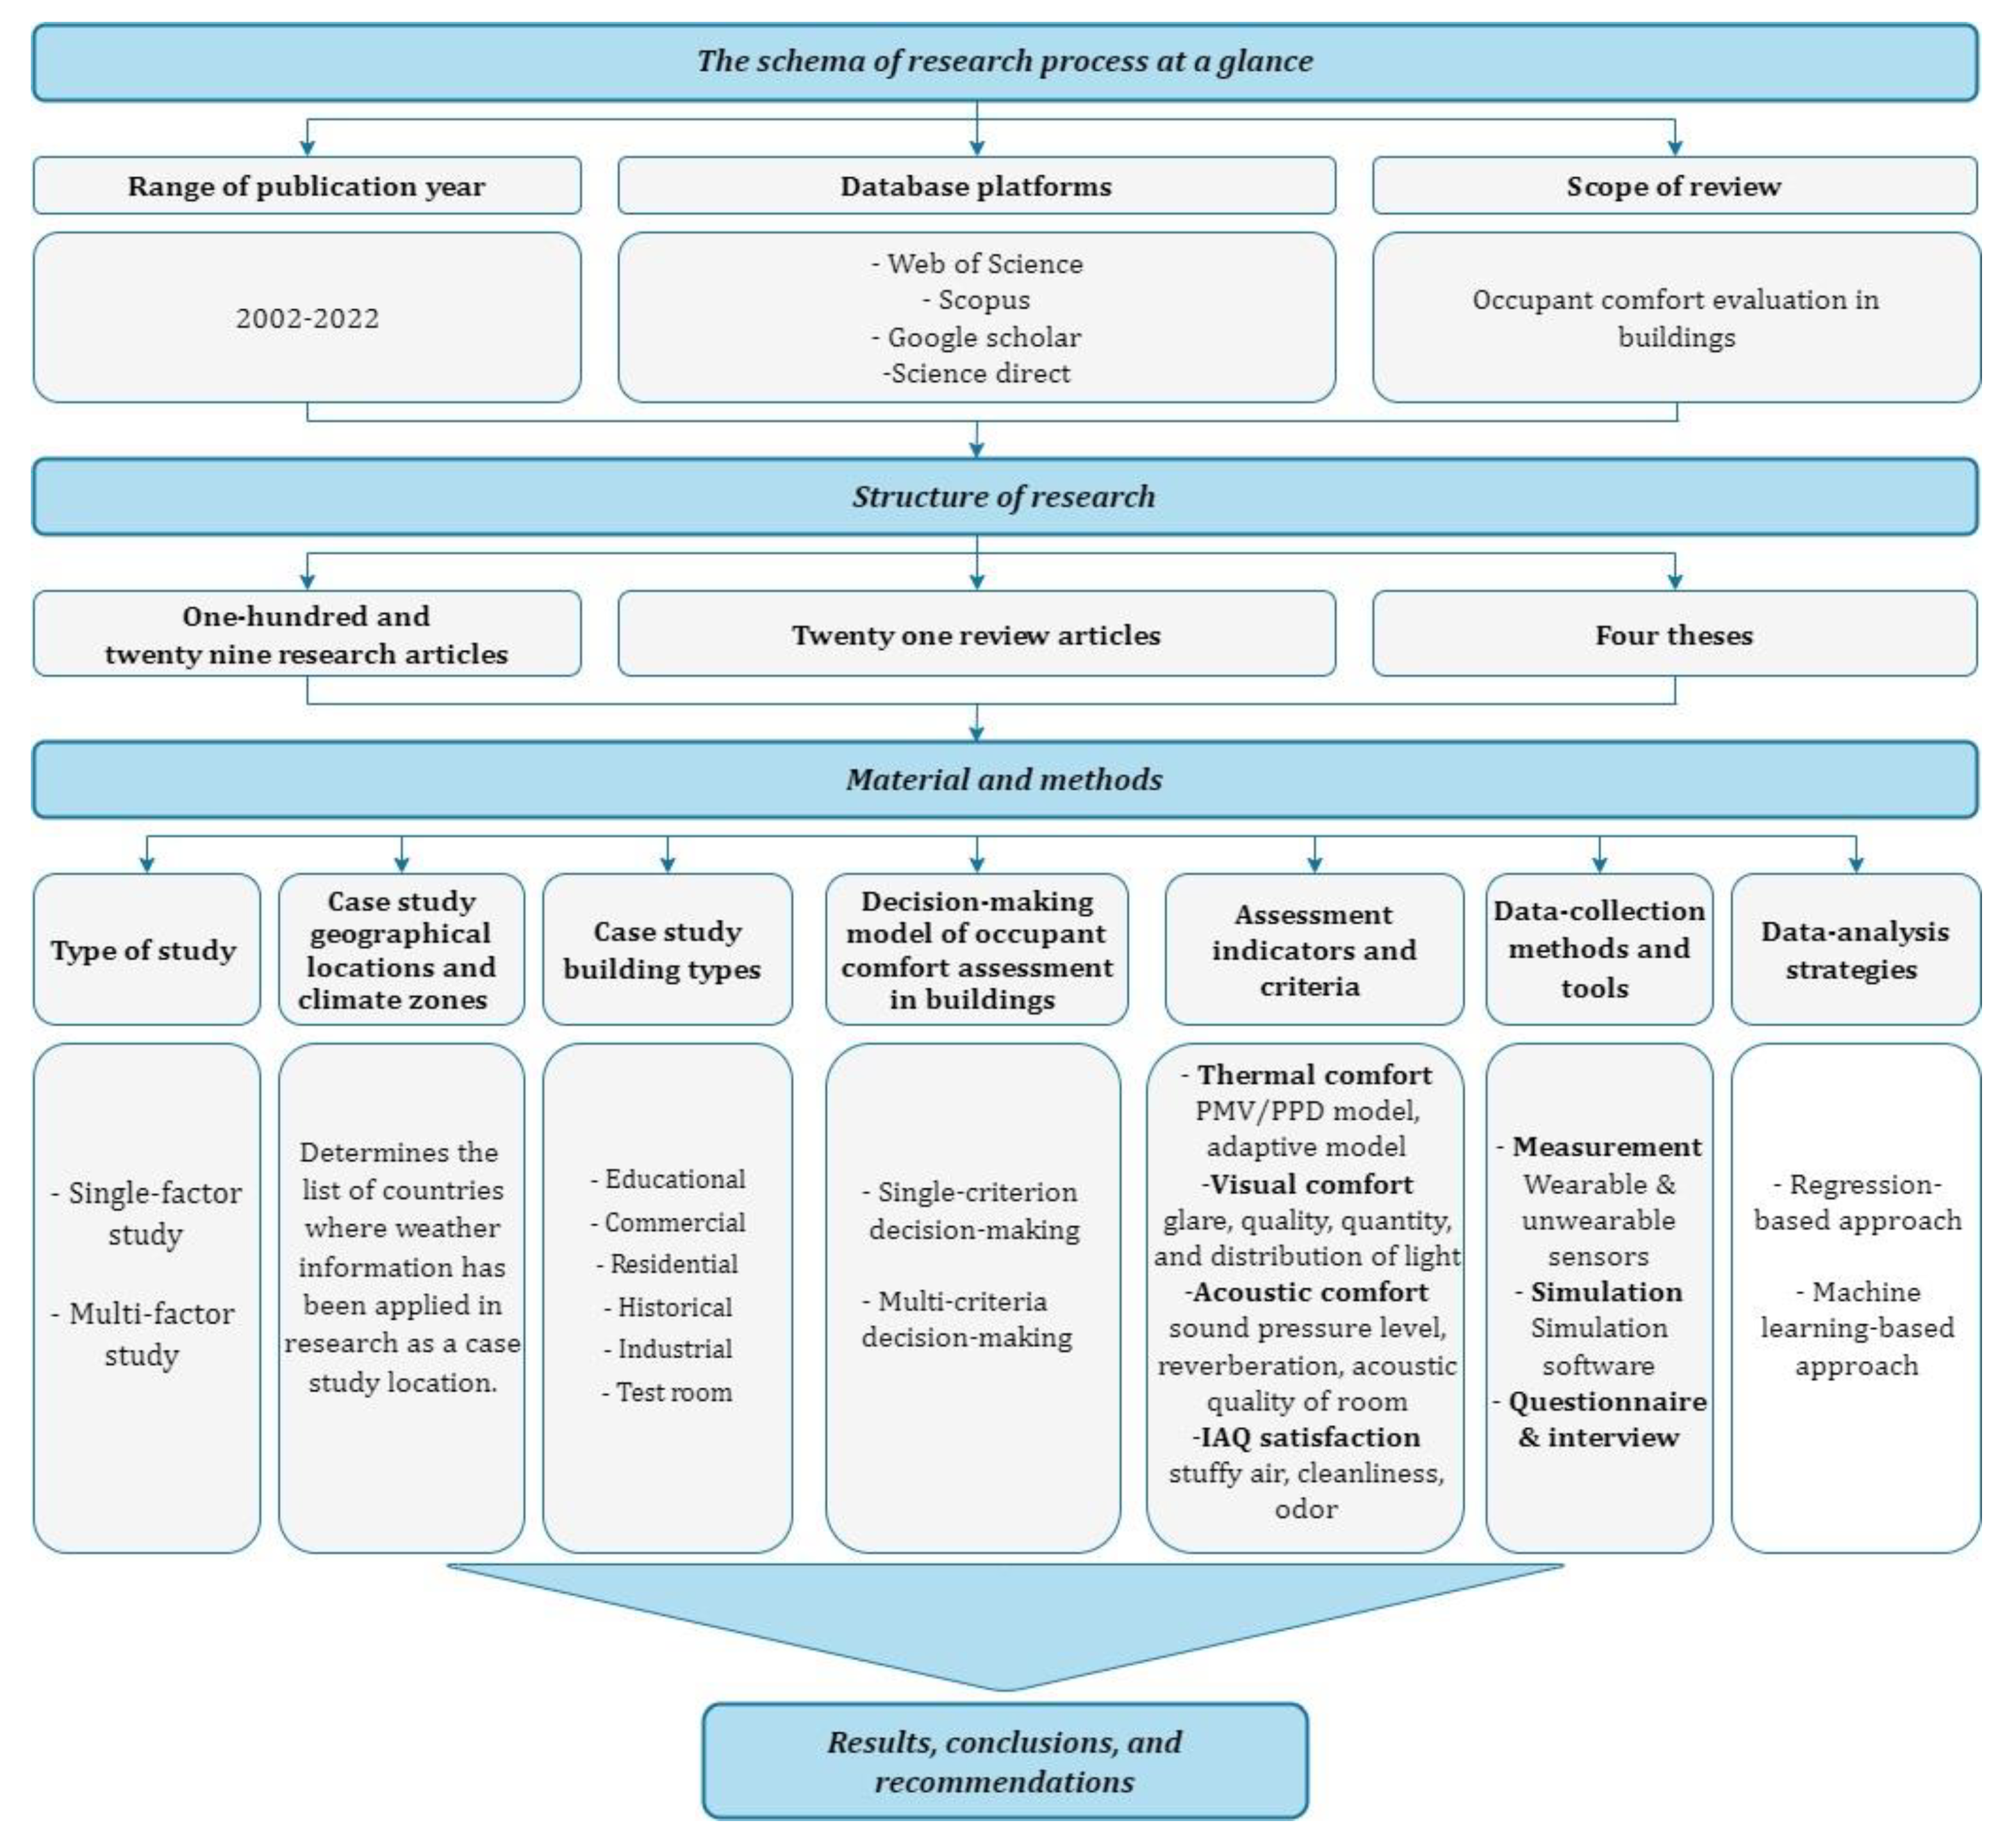
2. Material and Methods
- —
- Type of study (Section 3.1) indicates the two main approaches implemented by studies.
- —
- Case study geographical locations and climate zones (Section 3.2) specifies the set of countries where weather information has been used in previous studies as case study locations.
- —
- Case study building types (Section 3.3) categorizes the case study documents by building type based on their occupancy and usage categorizations, such as residential, educational, and commercial.
- —
- Decision-making model of occupant comfort assessment in buildings (Section 3.4) detects the significance and the method of decision-making in occupant comfort studies.
- —
- Assessment indicators and criteria (Section 3.5) determines the main indicators for indoor human comfort and relevant comfort criteria.
- —
- Data-collection methods and tools (Section 3.6) illustrates methods and tools applied to collect environmental and occupant data.
- —
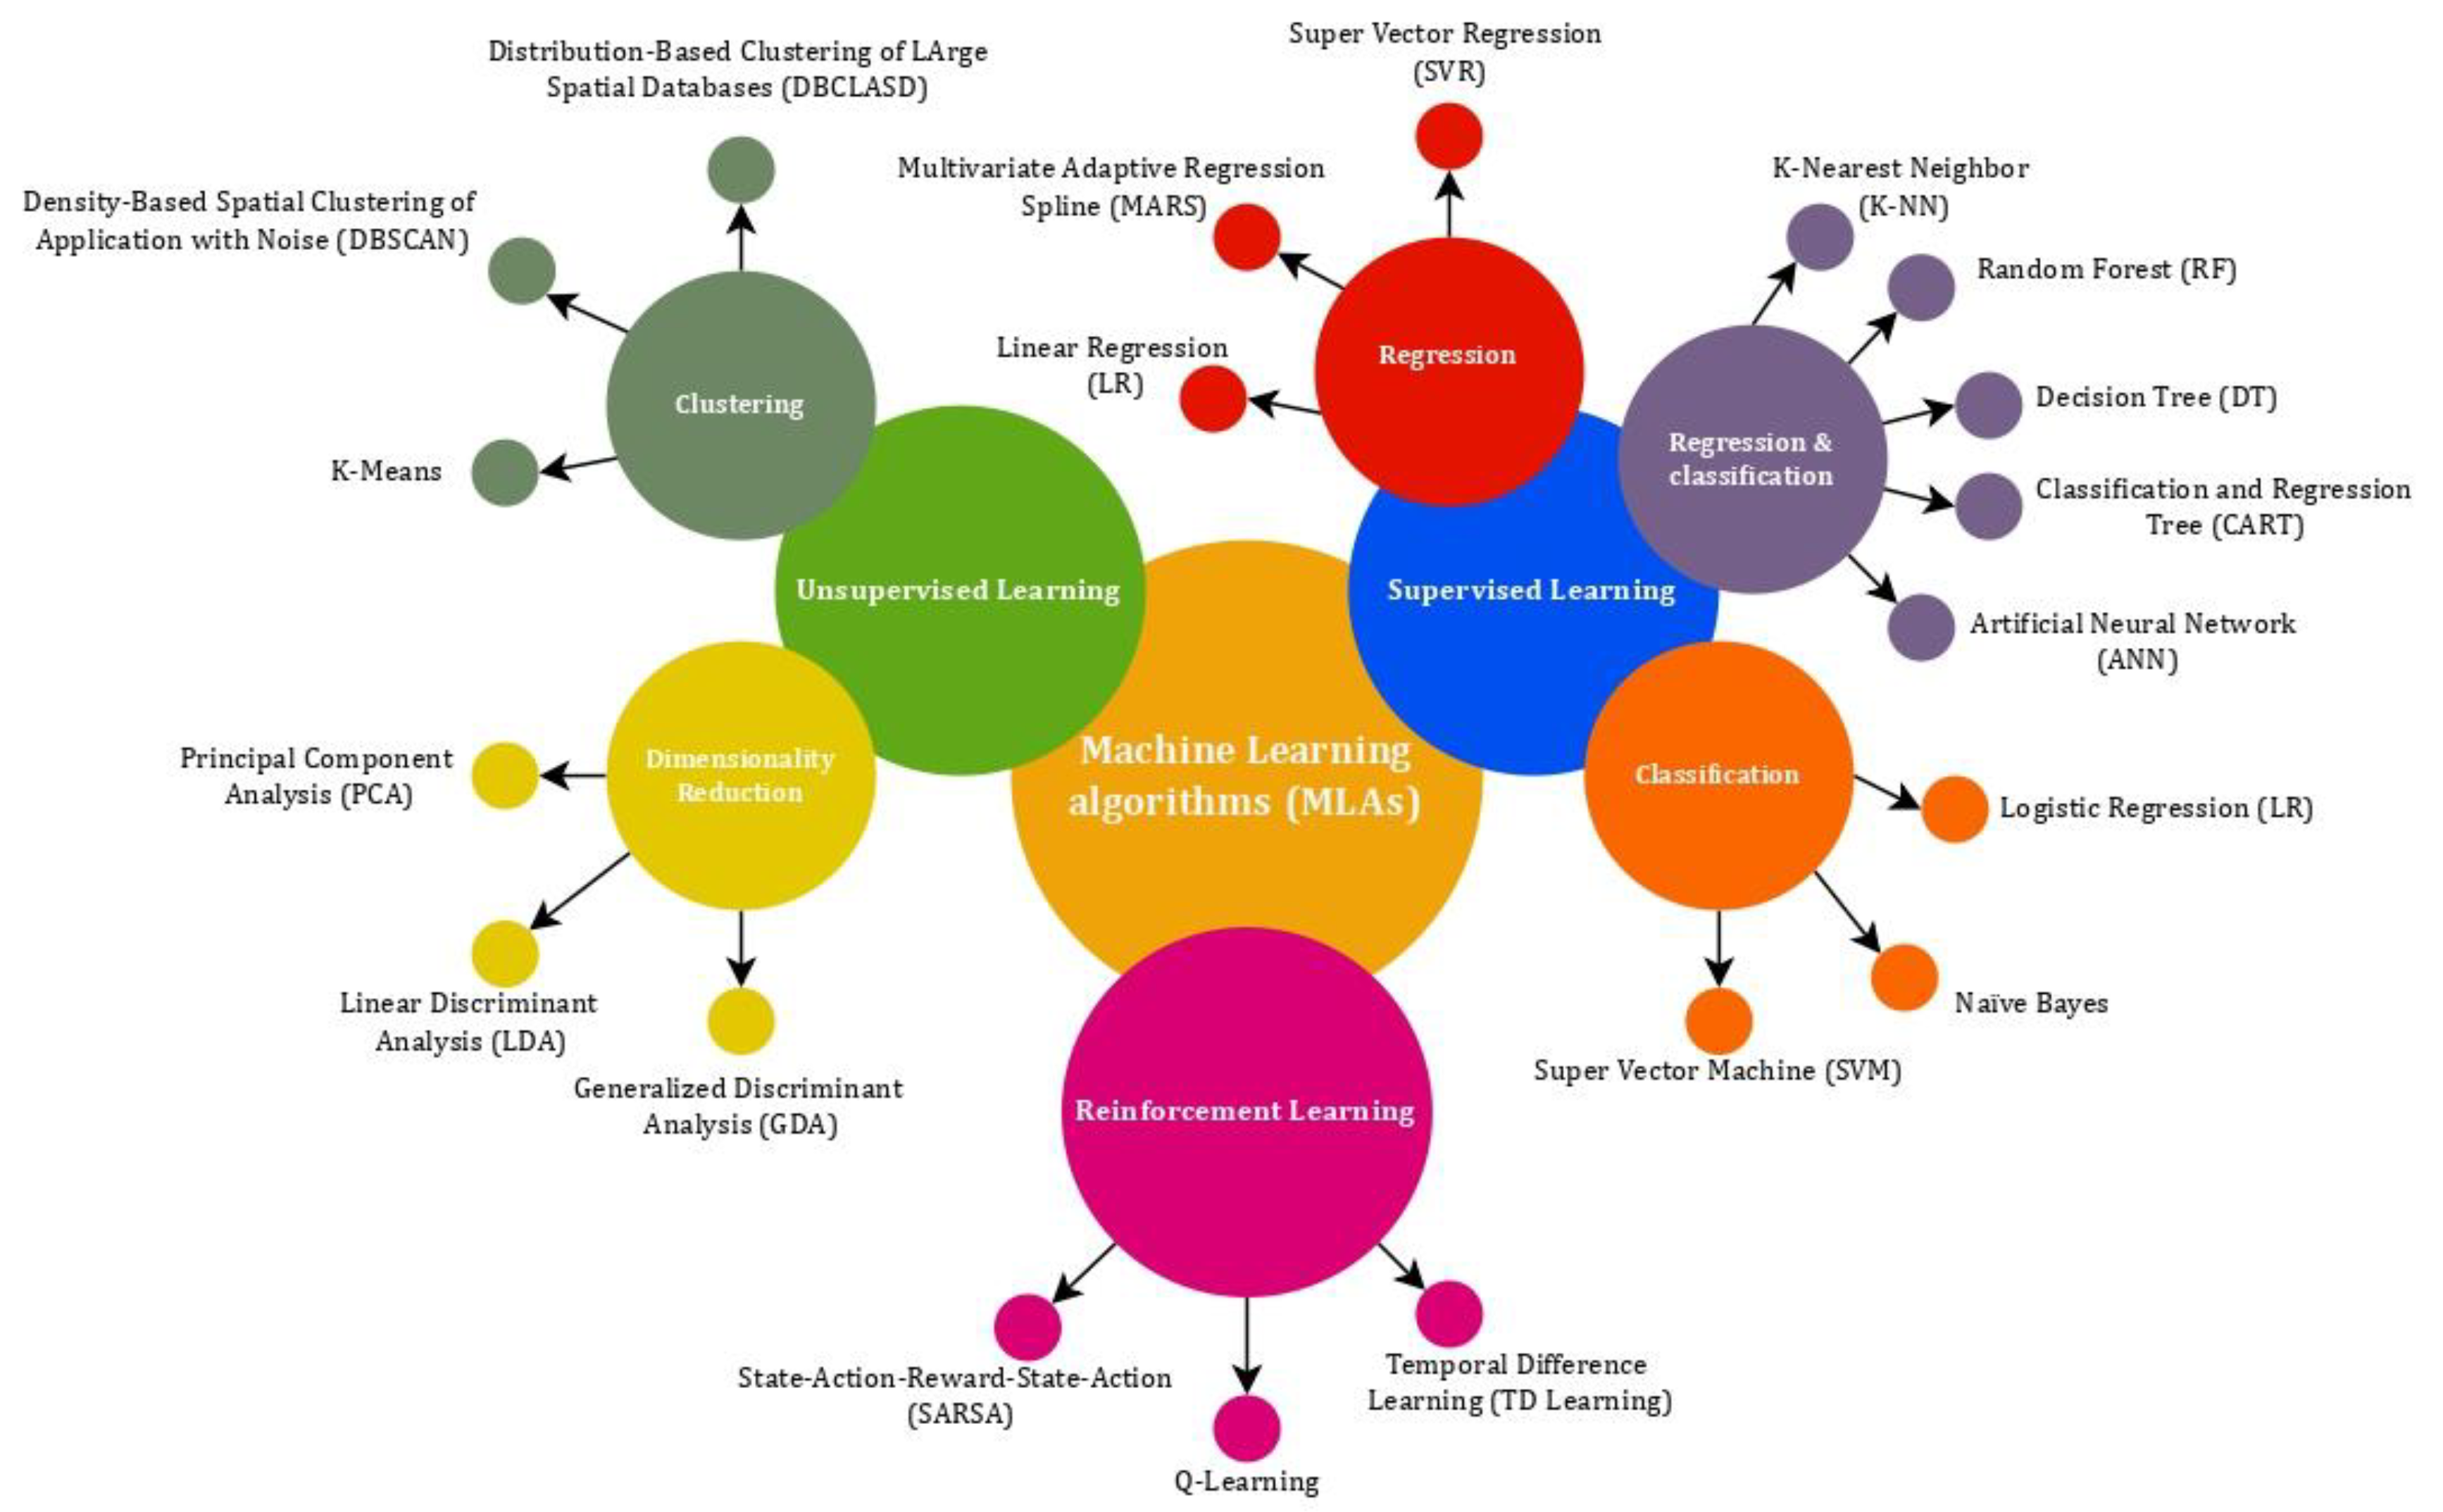
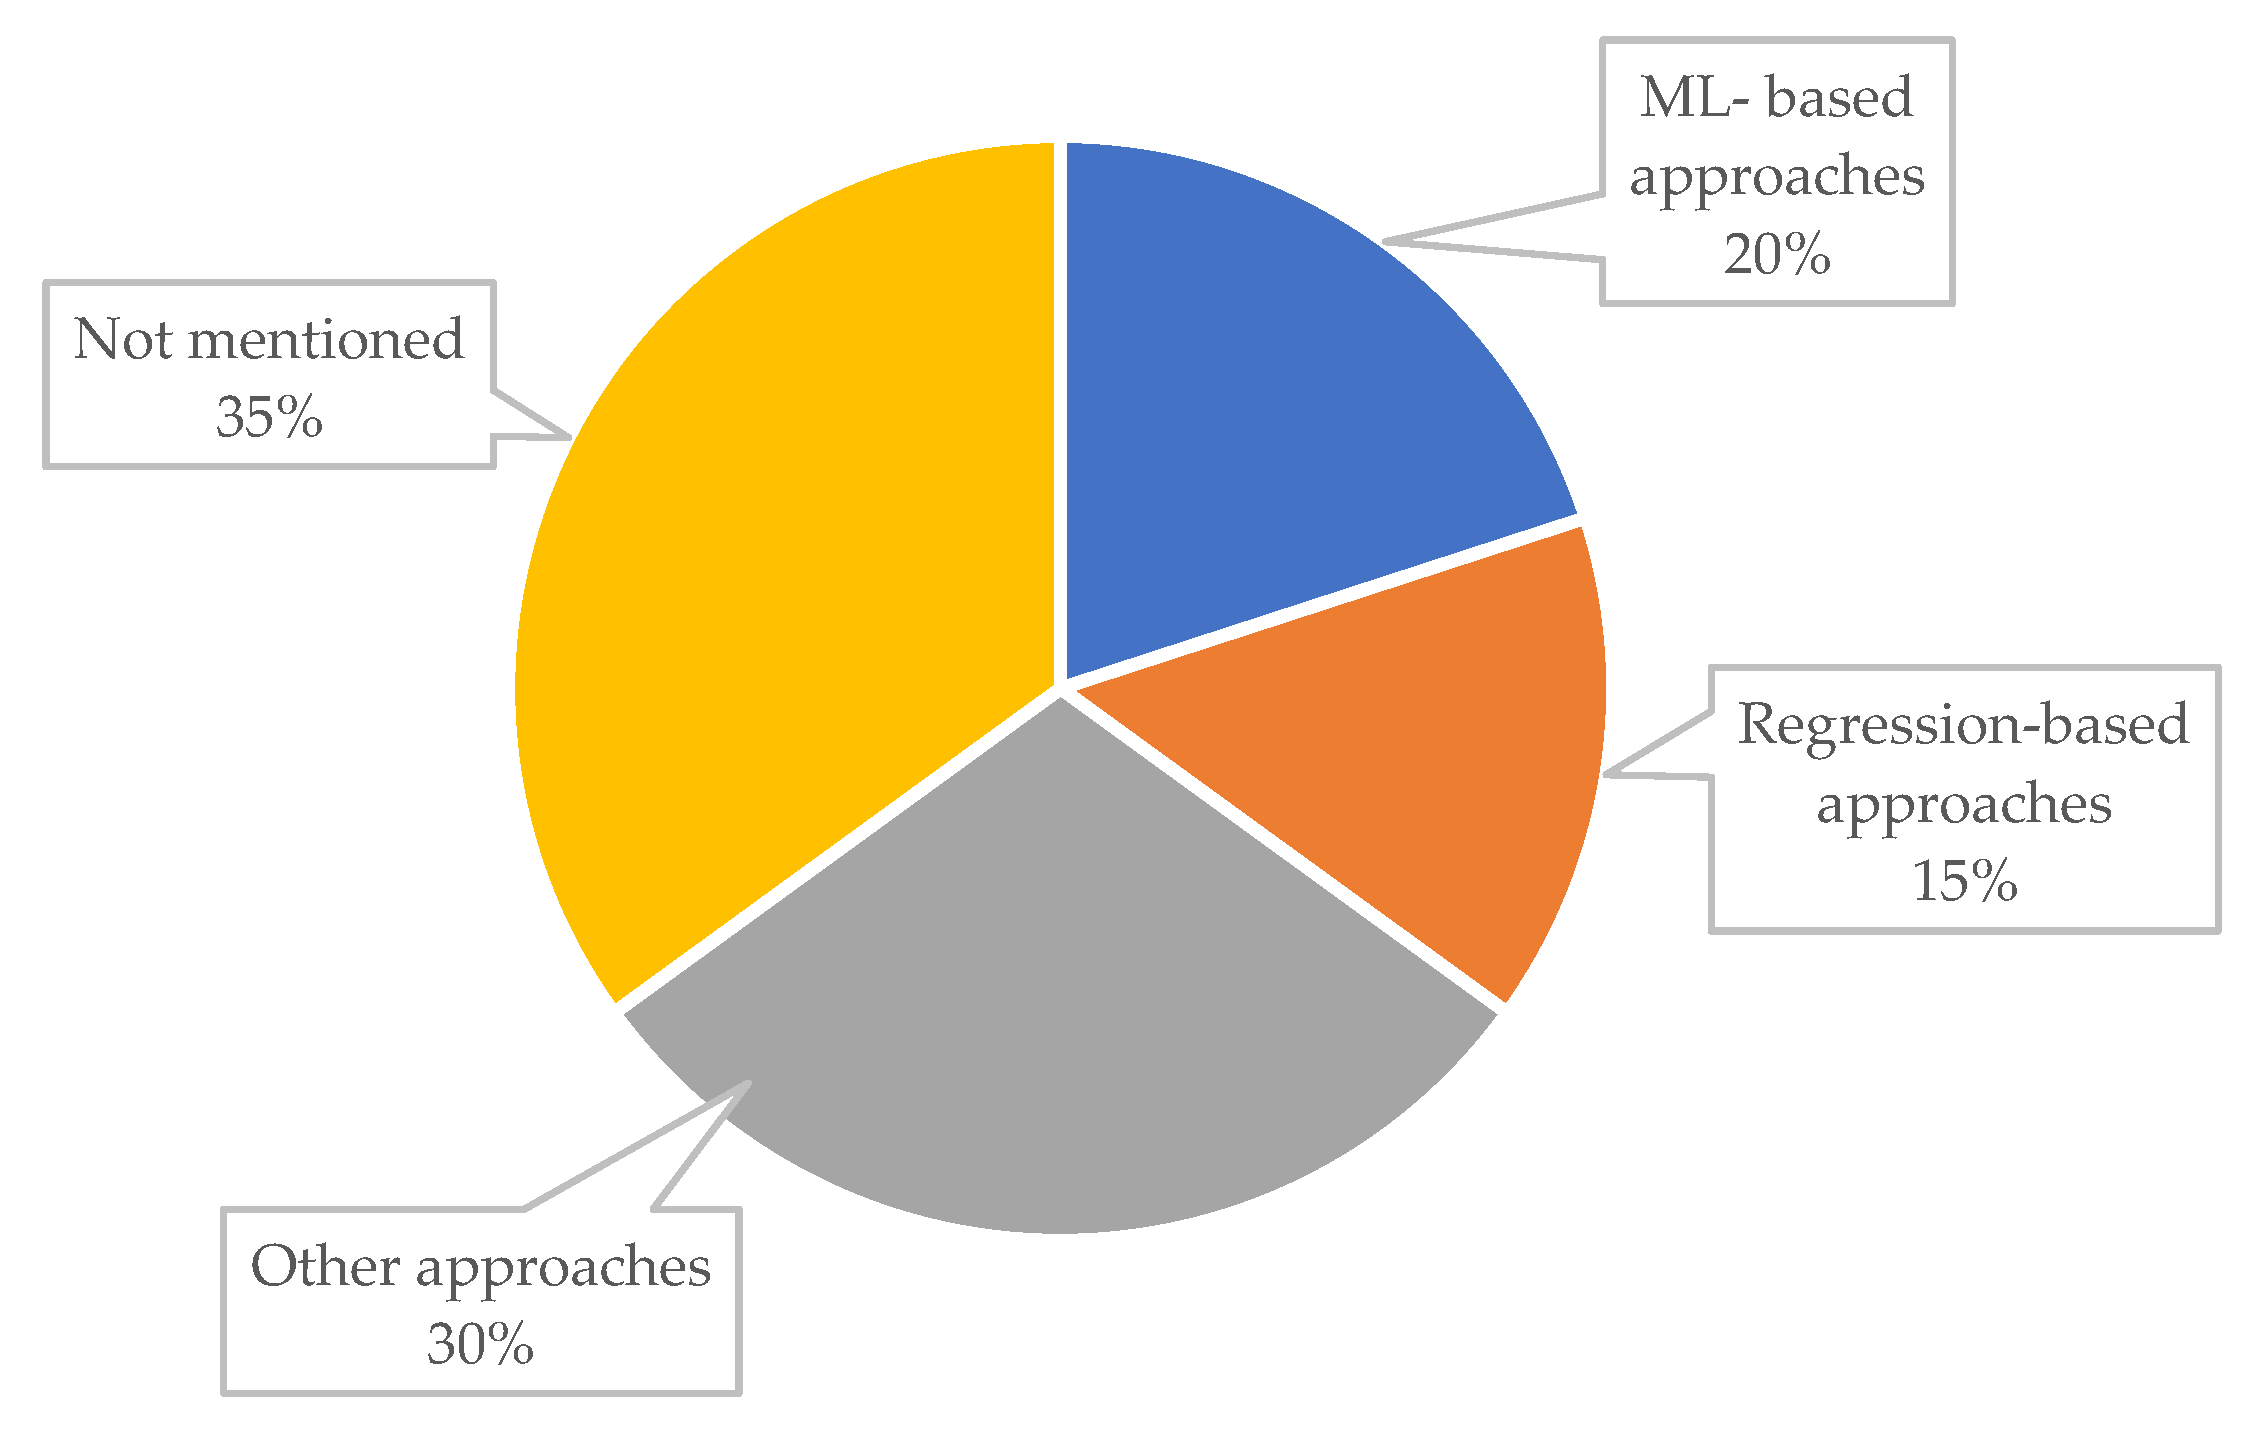
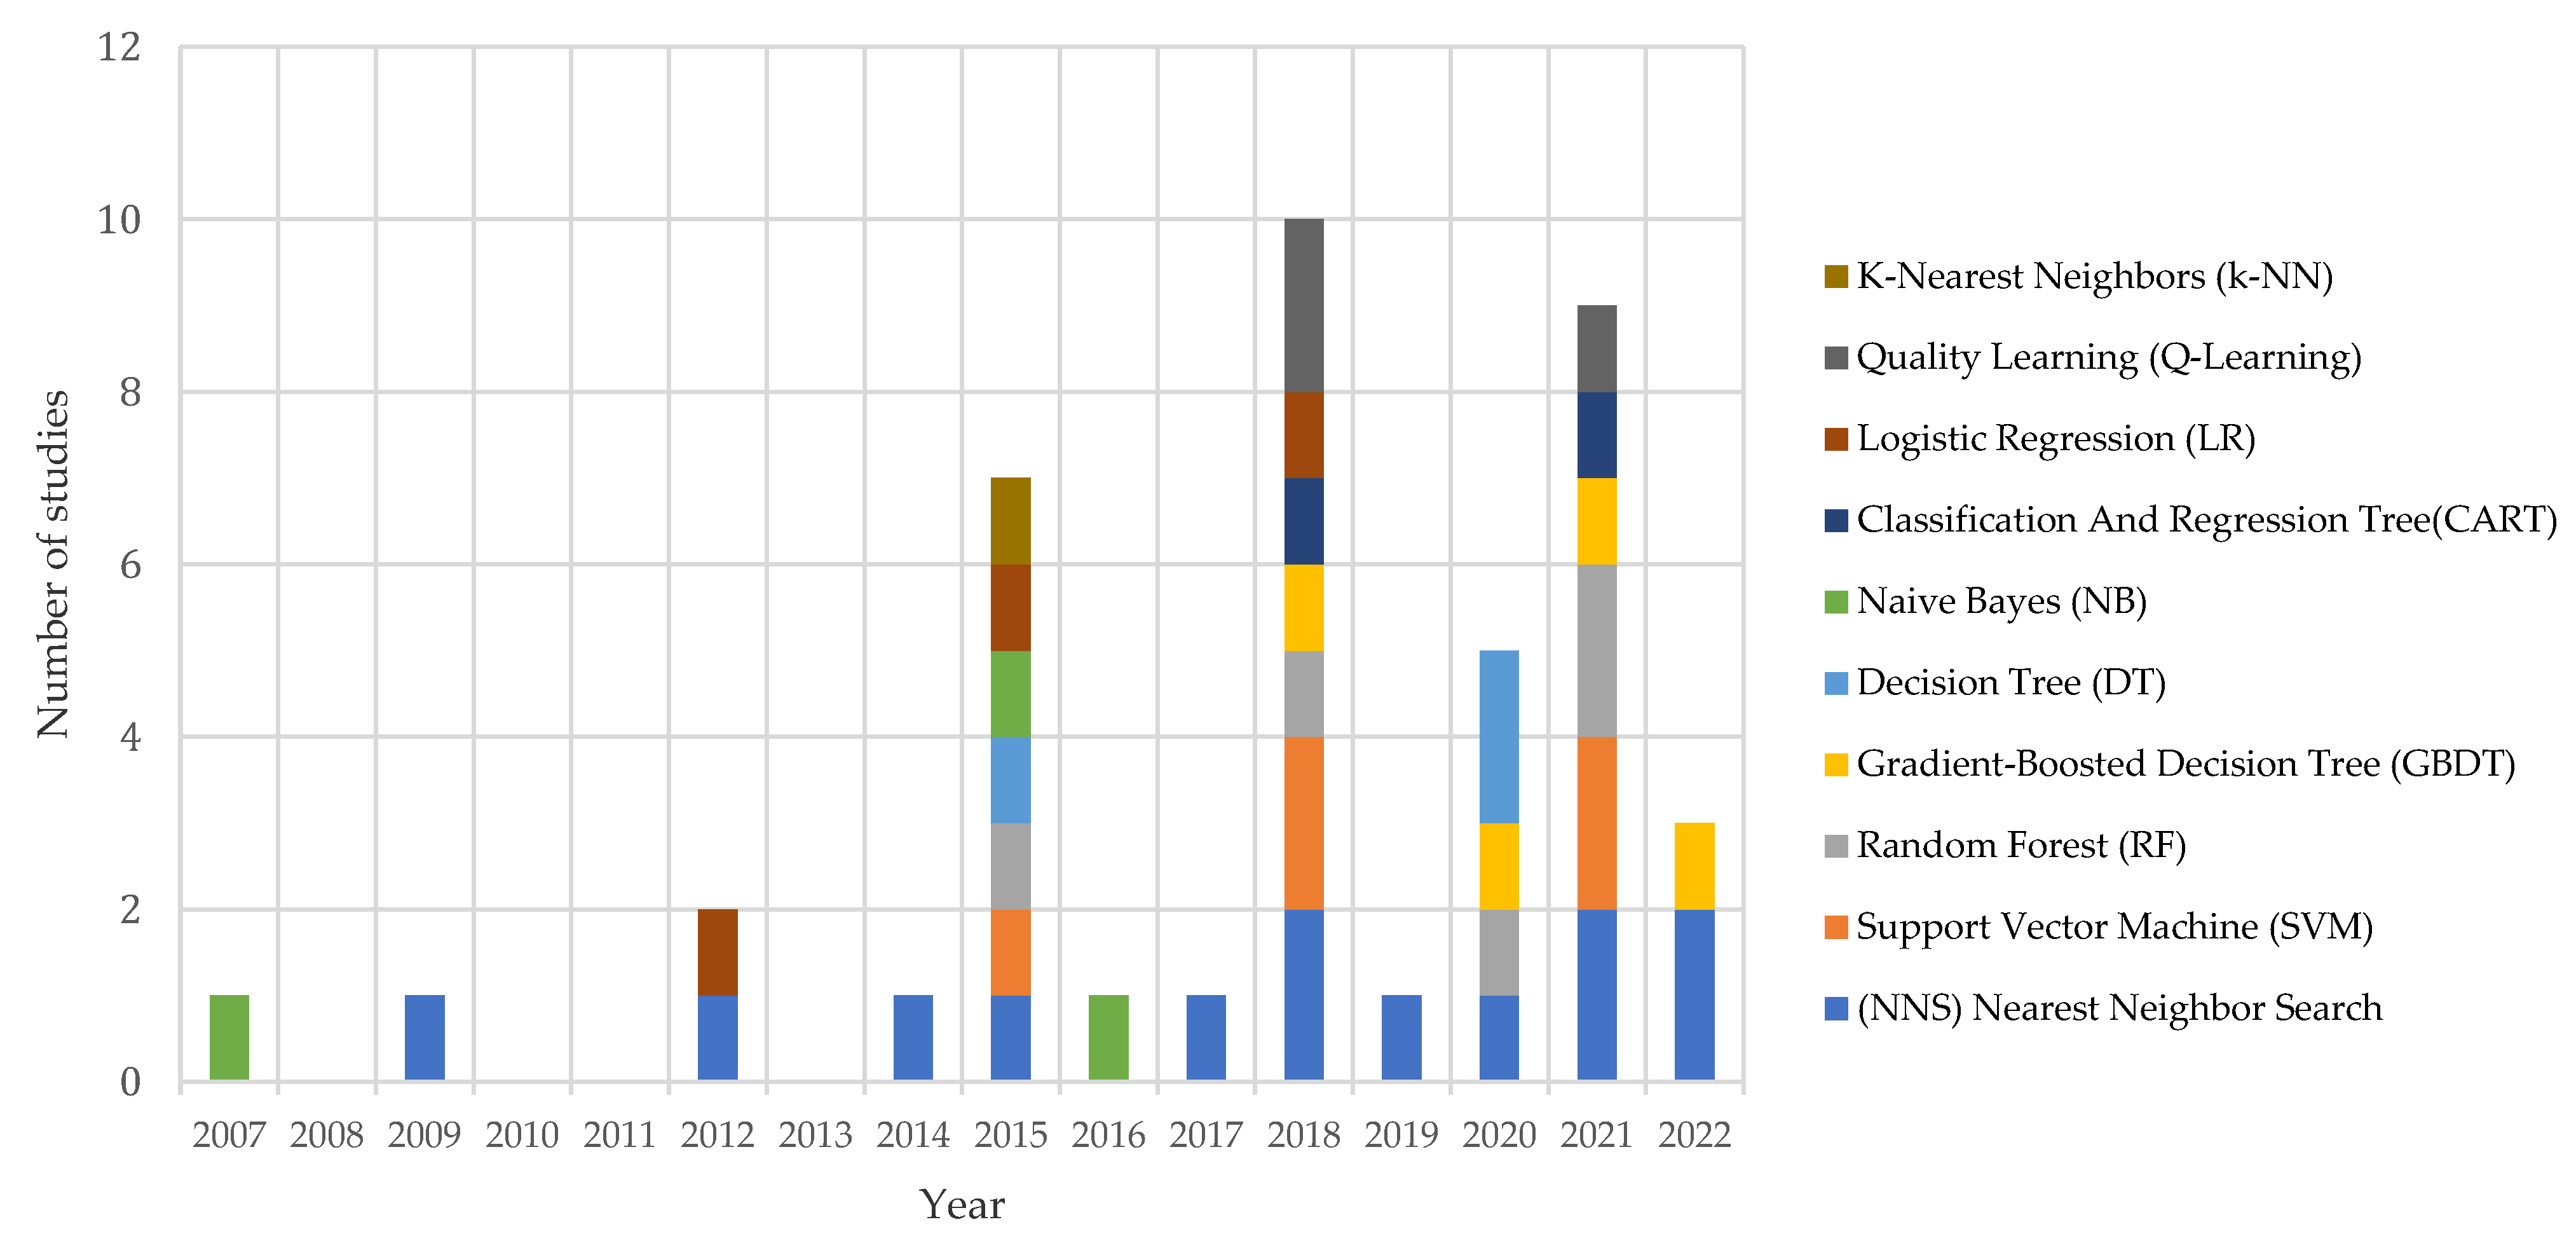
- Data-analysis strategies (Section 3.7) introduces data analysis methods applied for obtaining the occupant comfort model.
3. Results
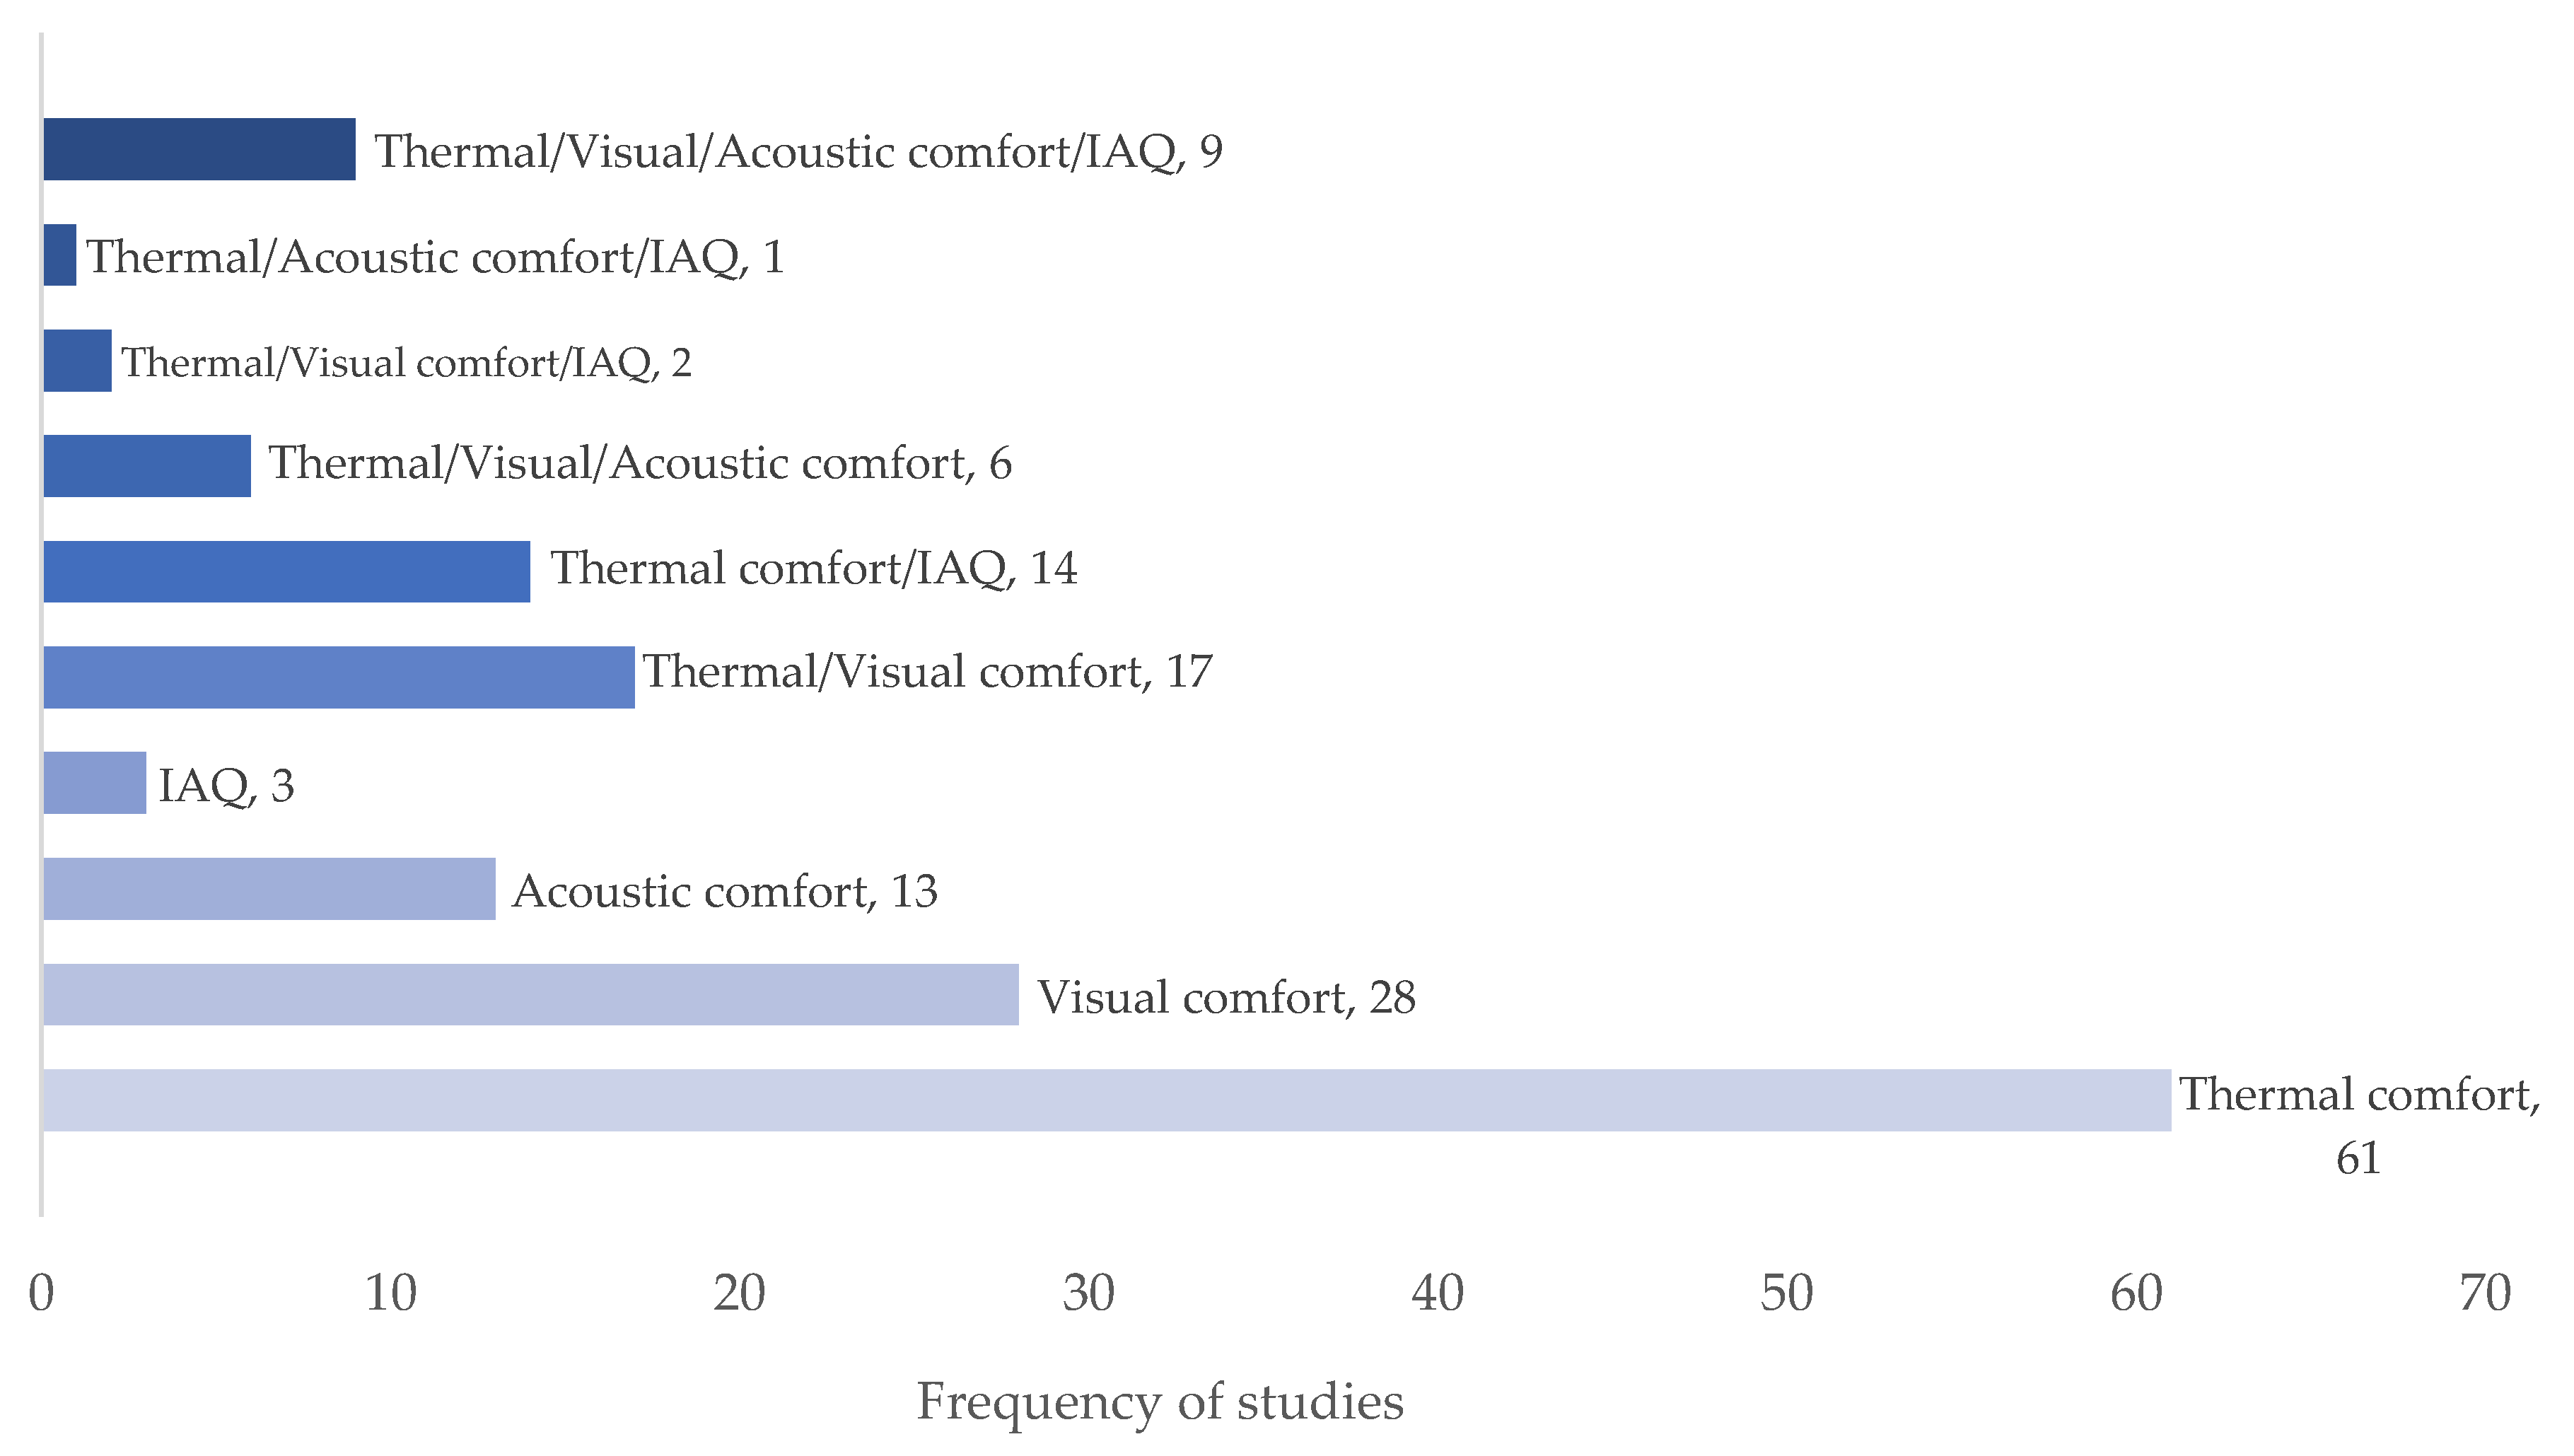
3.1. Types of Study
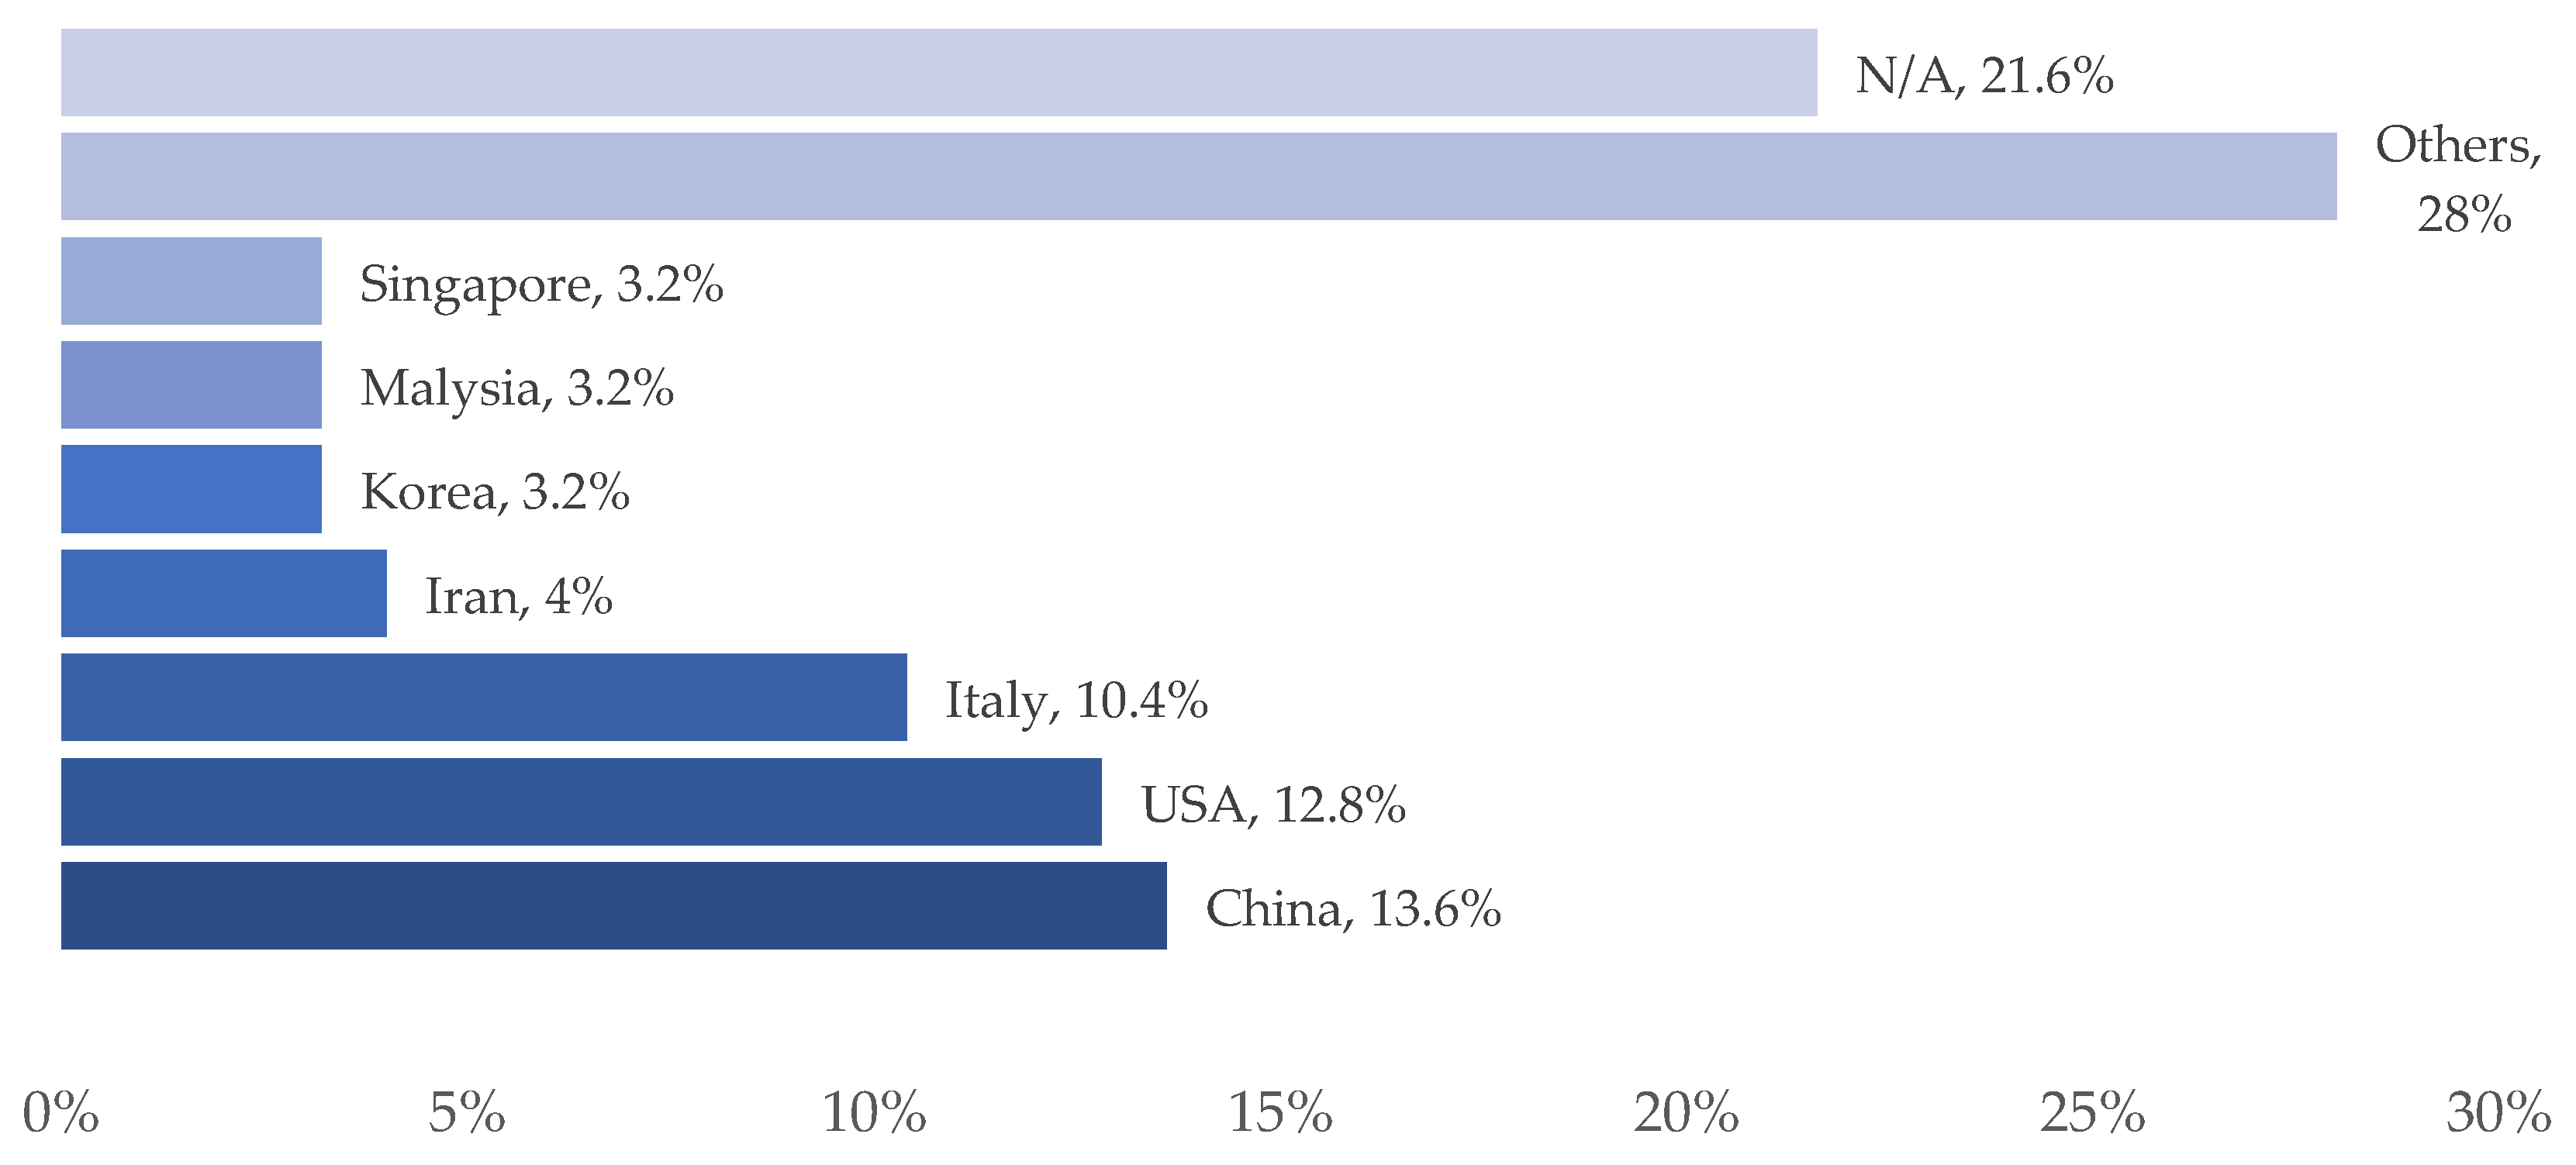
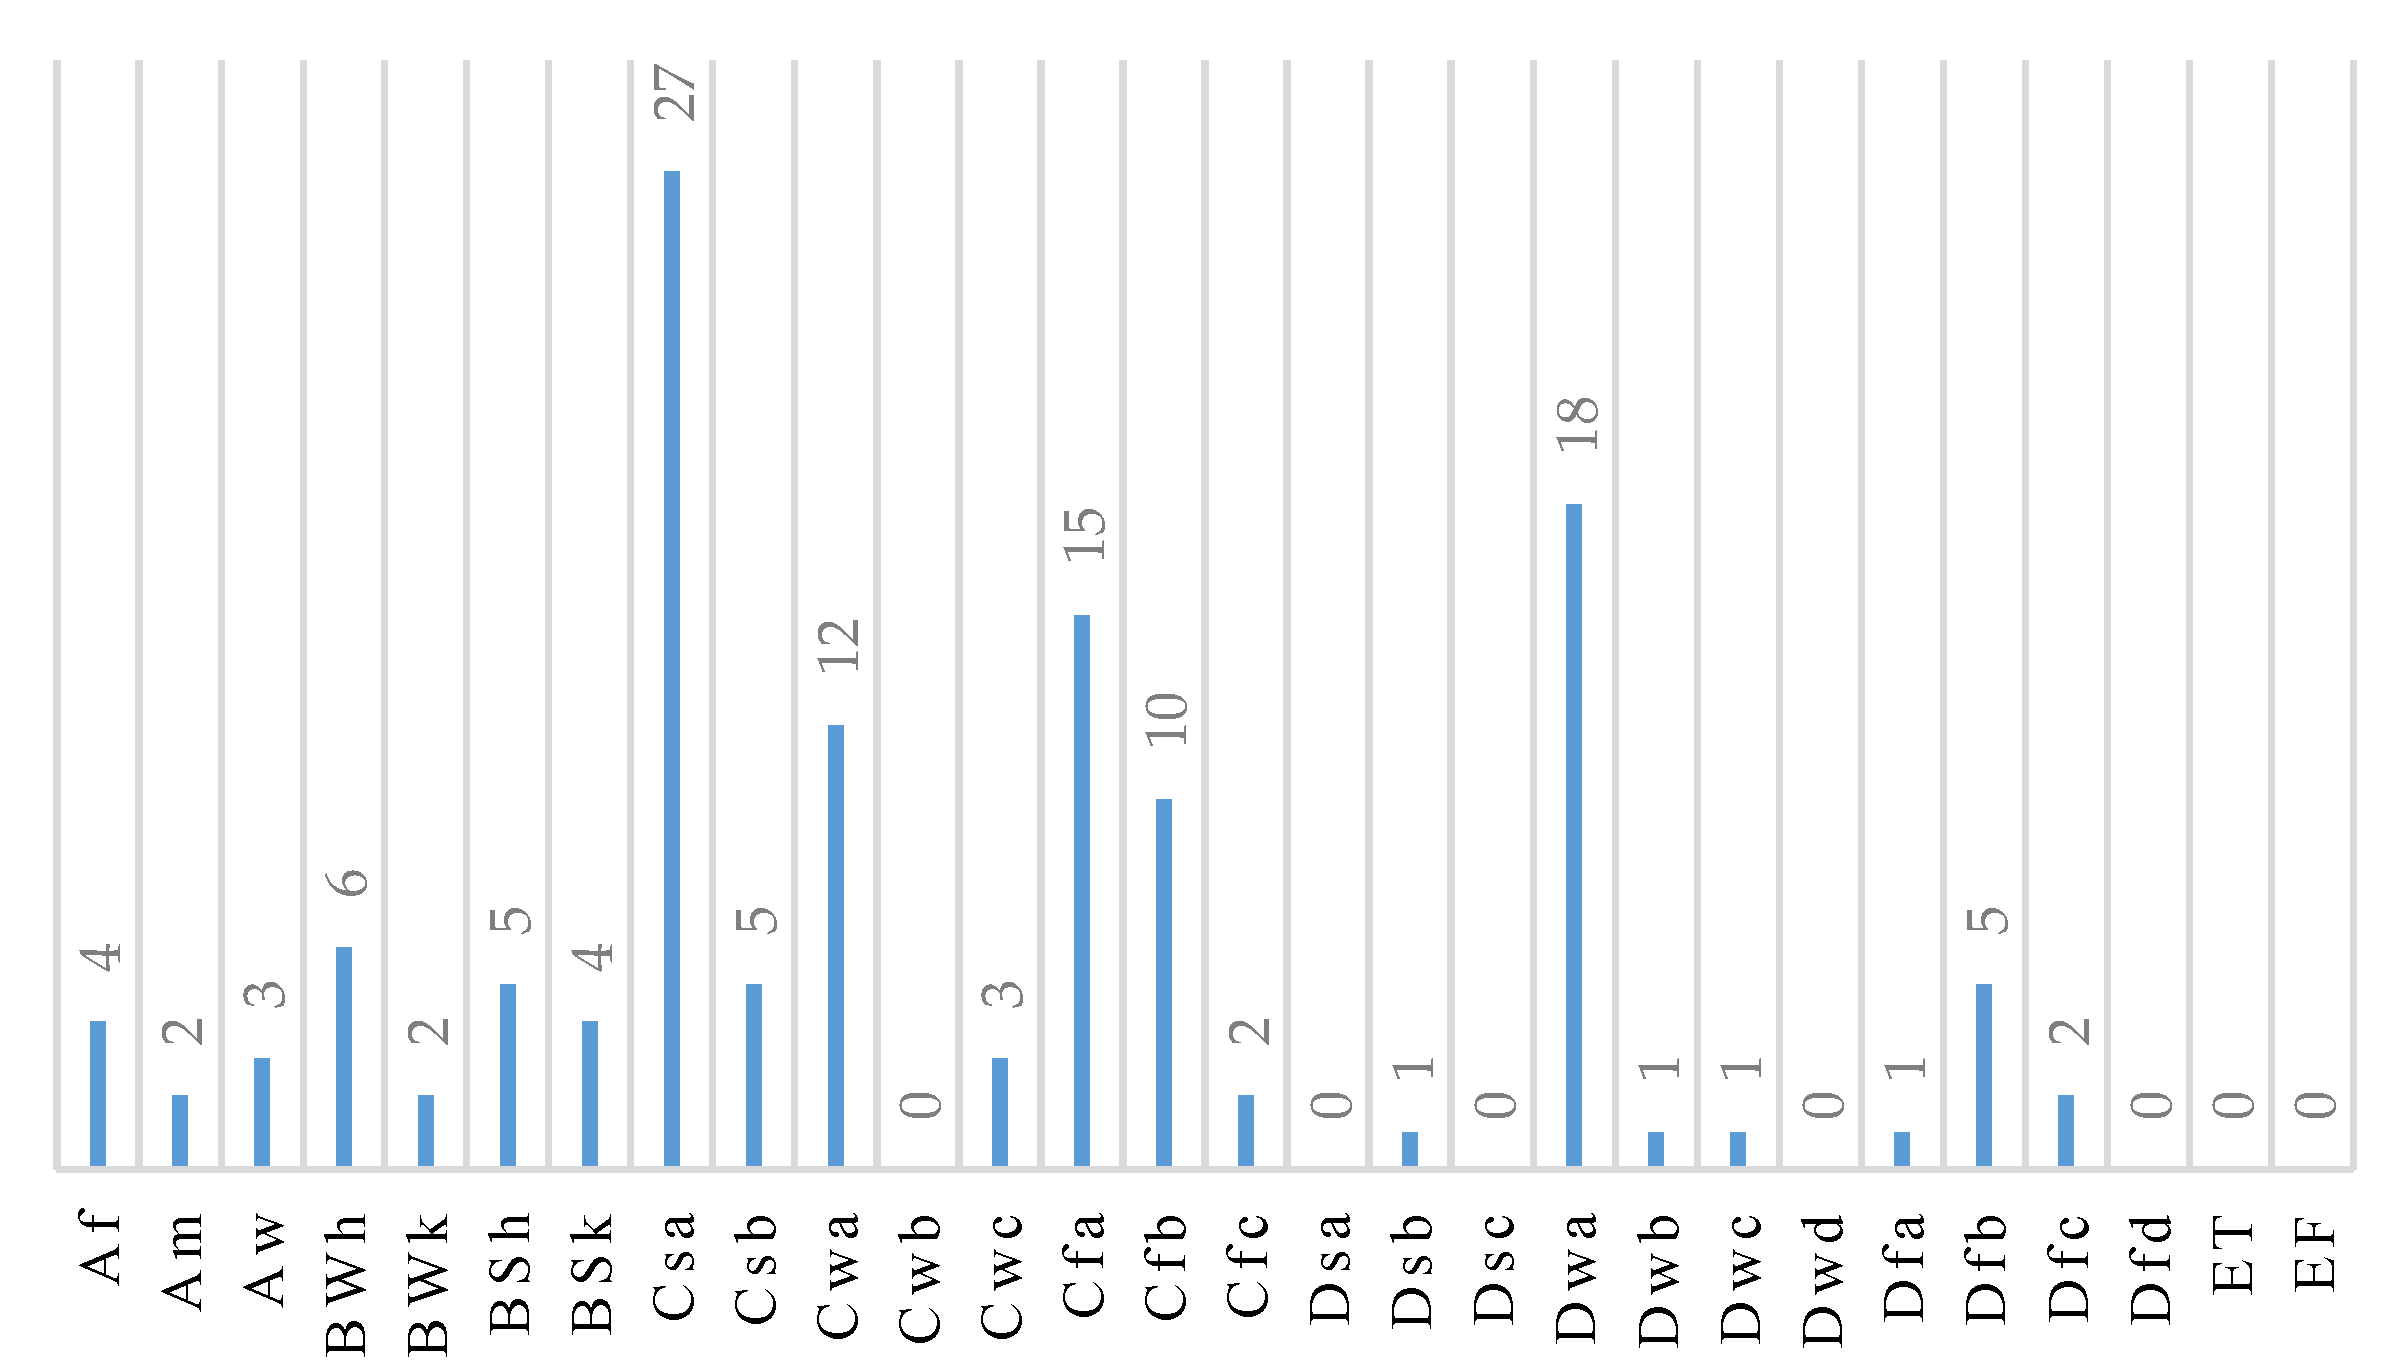
3.2. Case Study Geographical Locations and Climate Zones

| Case Study | Status | Frequency of References | References |
| Yes | 129 | [1,5,6,7,8,9,13,14,15,17,20,24,29,40,44,46,47,48,50,51,52,54,55,56,57,58,59,60,62,63,64,65,66,67,68,69,70,71,72,76,77,78,79,80,81,82,83,84,85,86,87,88,89,90,91,92,93,94,95,96,97,98,99,100,101,102,103,104,105,106,107,108,109,110,111,112,113,114,115,116,117,118,119,120,121,122,123,124,125,126,127,128,129,130,131,132,133,134,135,136,137,138,139,140,141,142,143,144,145,146,147,148,149,150,151,152] | |
| No | 25 | [10,25,27,33,41,42,43,45,49,53,153,154,155,156,157,158,159,160,161,162,163,164,165,166,167] |
3.3. Case Study Building Types
3.4. Decision-Making Model of Occupant Comfort Assessment in Buildings
3.5. Assessment Indicators and Criteria
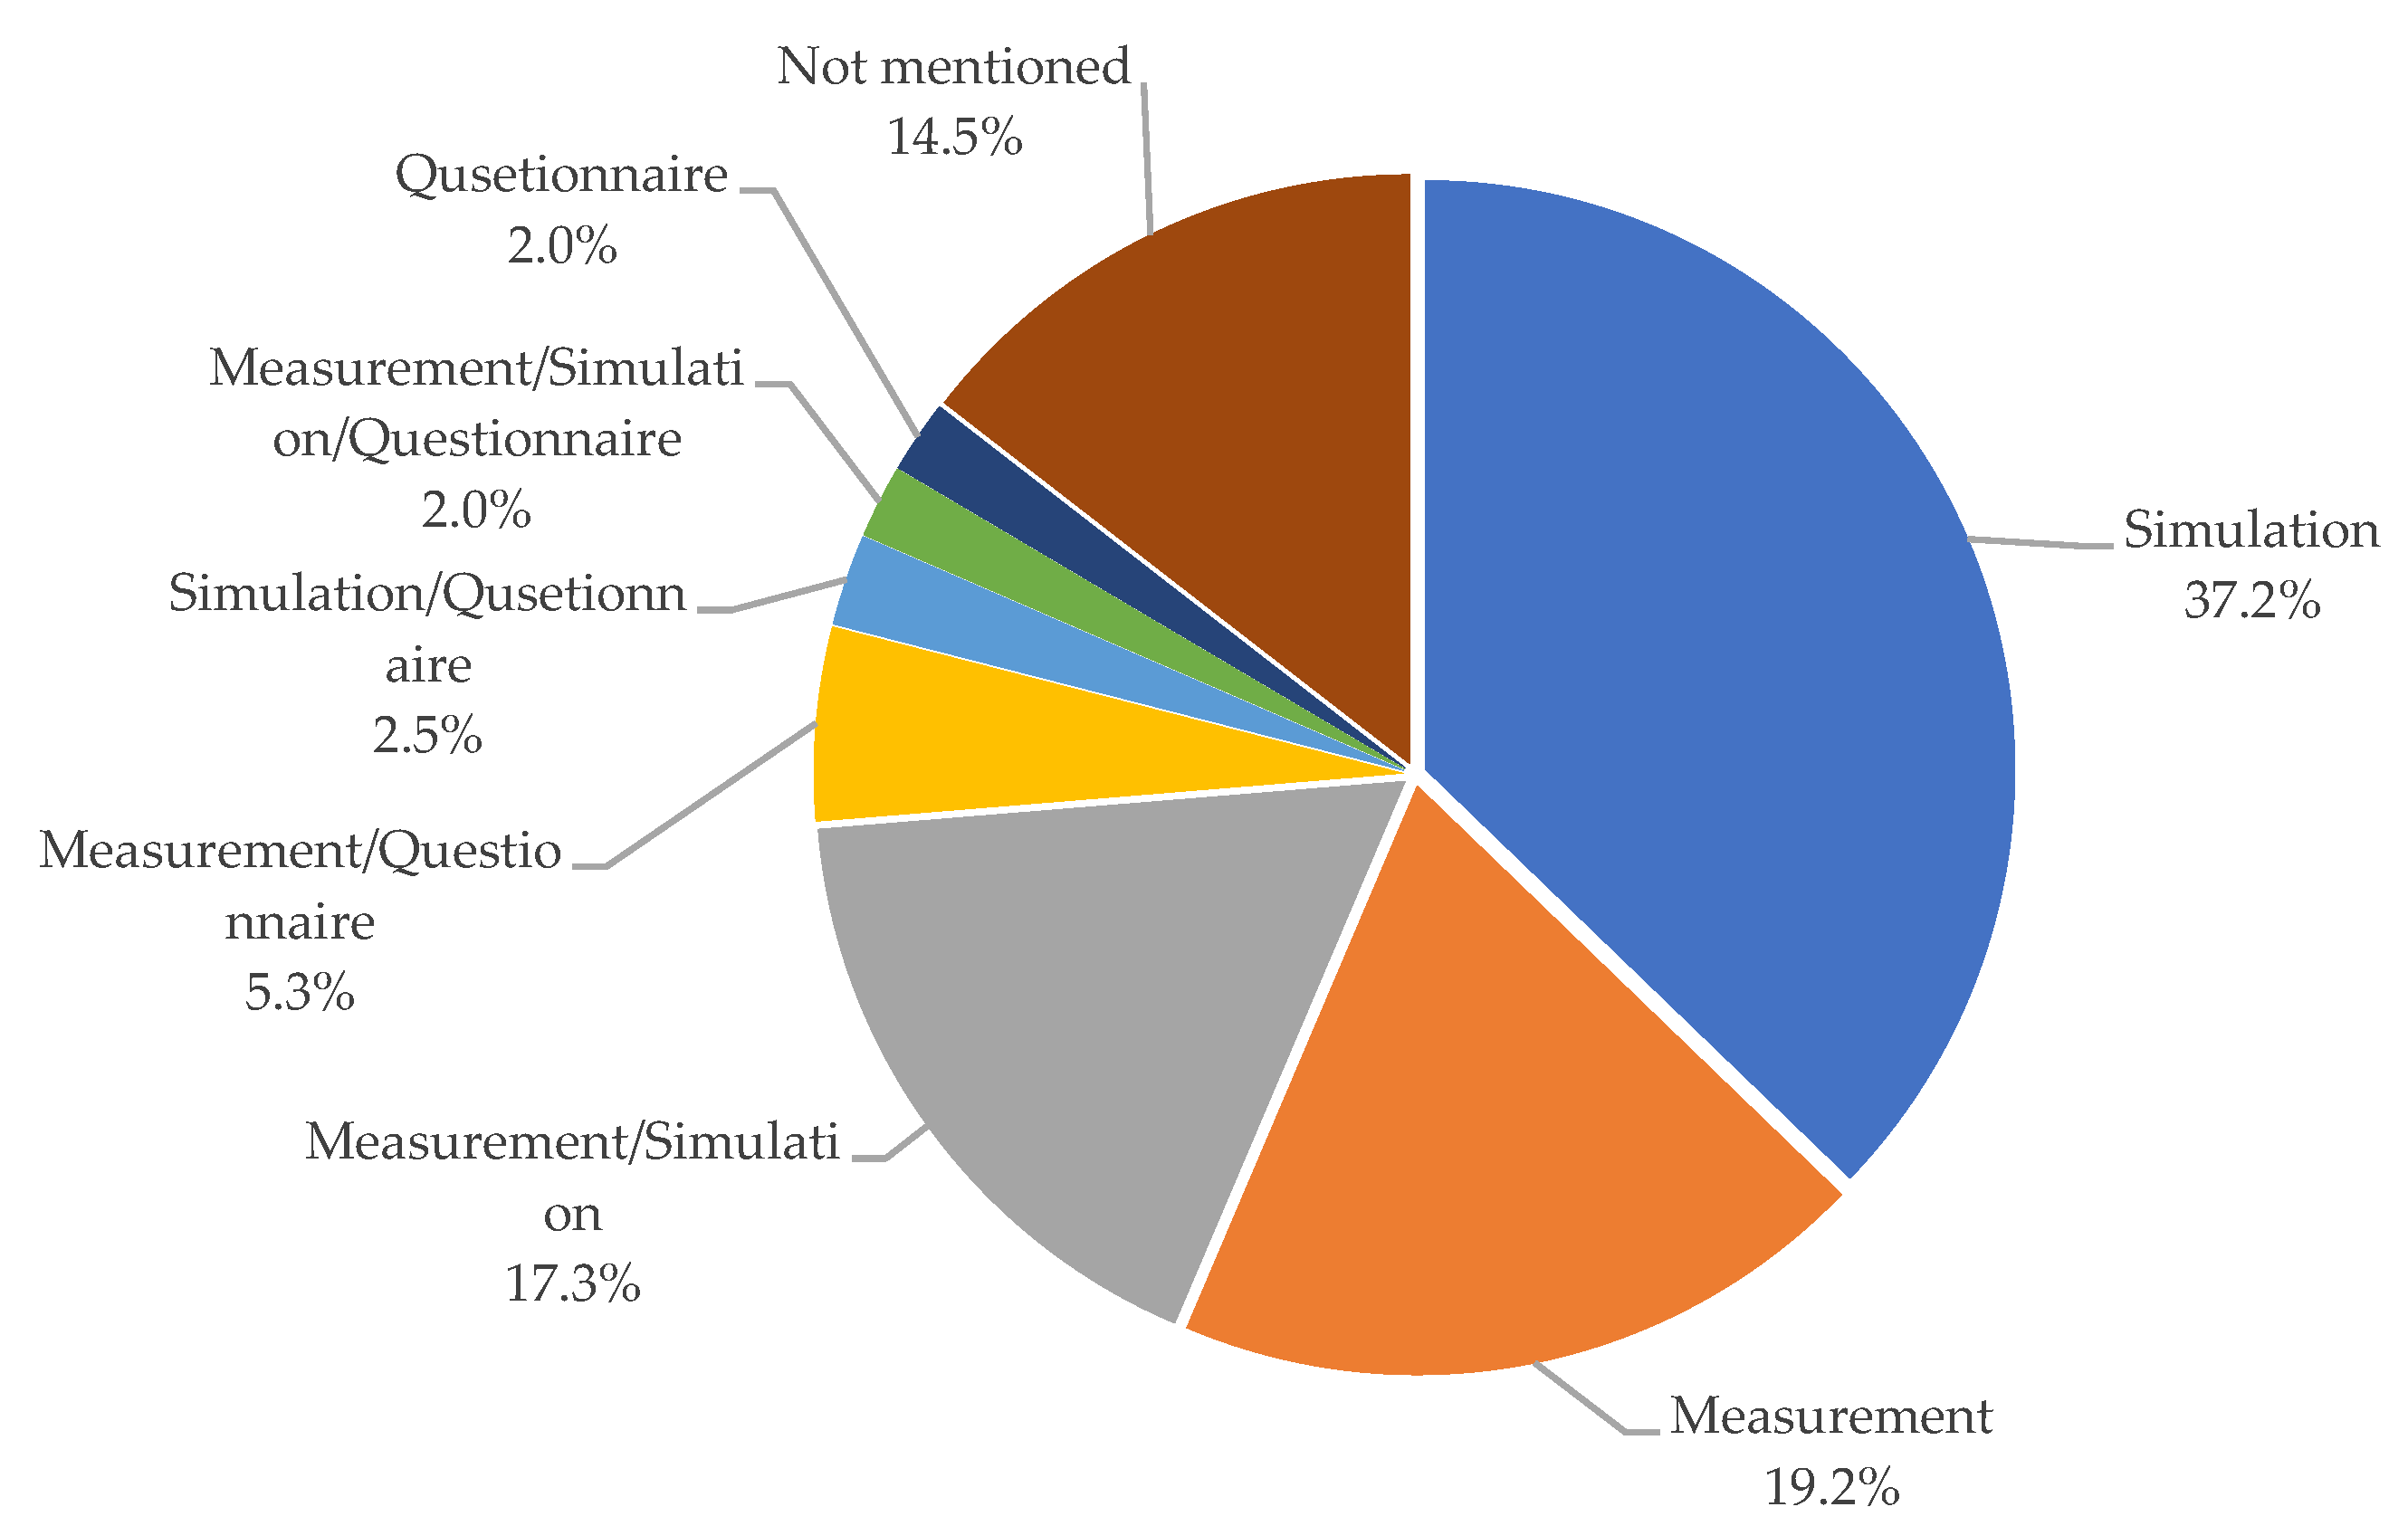
3.6. Data Collection Methods and Tools
3.7. Data Analysis Strategies
4. Conclusions and Recommendations
- The potential of more building types, such as health and treatment centers (hospitals, nursery homes, etc.), public transportation centers (terminals, subway stations, etc.), banks, and hotels to improve indoor occupant comfort by applying the appropriate comfort models should be evaluated.
- It is advisable to study all four aspects of human comfort (thermal, visual, acoustic, and IAQ satisfaction) simultaneously because they are closely interrelated.
- Using specific physiological factors to replace the survey method and measuring factors by wearable sensors or wearable devices.
- More focus should be applied to objective indices to train the comfort model and to present the comfort level.
- There is a need to investigate the incorporation of pertinent physiological parameters (such as gender, age, etc.) into the comfort models, because the selection of appropriate parameters has a significant effect on the quality of the evaluation of occupant comfort perception.
- Applying ML algorithms in studies to learn occupants’ visual preferences.
- Customization of comfort models in order to adapt them to individual occupants’ preferences.
- Designing an intelligent decision-making model for occupant comfort based on physical parameters and human behavior.
- Providing a more comfortable and responsive indoor environment by adopting improved indices of occupant comfort.
- More precise control of building HVAC systems by applying accurate and reliable predictive models to create smart buildings with improved energy efficiency.
- Performing long-term measurements of occupant comfort in different types of buildings in order to validate the available comfort models.
- Building occupant comfort analysis should include a comparison between summer and winter in different geographical locations. Comparative study on effective occupant comfort indices and models in the evaluation of individual occupants’ comfort based on various climate conditions (cold, Mediterranean, warm, etc.) should be considered.
- Evaluating personalized conditioning in real conditions via different types of questionnaires and field tests.
Author Contributions
Funding
Conflicts of Interest
Appendix A
| No. | Year | Author(s) | No. | Year | Author(s) | No. | Year | Author(s) |
|---|---|---|---|---|---|---|---|---|
| 1 | 2022 | (Y. Yilmaz et al.) [40] | 53 | 2020 | (L. Zhu, B. Wang, & Y. Sun) [123] | 105 | 2016 | (W. Abou Hweij et al.) [160] |
| 2 | 2022 | (A. M. Selim & D. M. Saeed) [97] | 54 | 2020 | (A. Dietz et al.) [124] | 106 | 2016 | (Y. Tae-hwan et al.) [152] |
| 3 | 2022 | (H. Wu & T. Zhang) [98] | 55 | 2020 | (S. Salimi & A. Hammad) [125] | 107 | 2016 | (Y.-J. Choi) [63] |
| 4 | 2022 | (E. Noorzai, P. Bakmohammadi, & M. A. Garmaroudi) [99] | 56 | 2020 | (P. Bakmohammadi and E. Noorzai) [126] | 108 | 2016 | (F. Stazi, E. Tomassoni, & C. Di Perna) [64] |
| 5 | 2022 | (F. Diker & I. Erkan) [100] | 57 | 2020 | (J. Zhao & Y. Du) [1] | 109 | 2016 | (X. Chen, Q. Wang, & J. Srebric) [65] |
| 6 | 2022 | (Z. Kong et al.) [180] | 58 | 2019 | (T. Daniela-roxana et al.) [127] | 110 | 2016 | (Y. Al horr et al.) [7] |
| 7 | 2022 | (Z. R. Kahaki et al.) [101] | 59 | 2019 | (W. Valladares et al.) [128] | 111 | 2015 | (Y. Wang et al.) [66] |
| 8 | 2022 | (A. A. Glean, S. D. Gatland II, & I. Elzeyadi) [102] | 60 | 2019 | (A. A.-W. Hawila et al.) [177] | 112 | 2015 | (W. Yu et al.) [46] |
| 9 | 2022 | (N. Abdollahzadeh et al.) [103] | 61 | 2019 | (J. Malik & R. Bardhan) [129] | 113 | 2015 | (S. Carlucci et al.) [27] |
| 10 | 2022 | (A. Omidi, N. Golchin, & S. E. Masoud) [104] | 62 | 2019 | (T. Song, F. Mao, & Q. Liu) [9] | 114 | 2015 | (A. Salvatore et al.) [67] |
| 11 | 2022 | (A. B. Kuri & S. J. Pérez R.) [105] | 63 | 2019 | (Z. S. Zomorodian & M. Tahsildoost) [94] | 115 | 2015 | (X. Chen, Q. Wang, & J. Srebric) [68] |
| 12 | 2022 | (N. Mahyuddin et al.) [106] | 64 | 2019 | (I. Ballarini et al.) [131] | 116 | 2015 a | (F. Ascione et al.) [52] |
| 13 | 2022 | (L. Qabbal, Z. Younsi, & H. Naji) [107] | 65 | 2019 | (F. M. M. Khanmohamadi & M. Pourahmadi) [182] | 117 | 2015 | (A. Ghahramani, C. Tang, & B. Becerik-Gerber) [69] |
| 14 | 2022 | (Z. Li & E. Kim) [13] | 66 | 2019 | (P. Kar et al.) [20] | 118 | 2015 | (J. Ortiz et al.) [70] |
| 15 | 2022 | (F. Lolli, A. M. Coruzzolo, & E. Balugani) [108] | 67 | 2019 | (M. S. Andargie & E. Azar) [132] | 119 | 2015 b | (F. Ascione et al.) [71] |
| 16 | 2022 | (H. Tang et al.) [165] | 68 | 2019 | (J. K. Day et al.) [181] | 120 | 2015 | (N. Moenssens et al.) [72] |
| 17 | 2022 | (F. Vittori et al.) [109] | 69 | 2019 | (Y. Zhai et al.) [170] | 121 | 2014 | (A. Rackes & M. S. Waring) [79] |
| 18 | 2021 | (C. Berger & A. Mahdavi) [110] | 70 | 2019 | (I. Montiel et al.) [133] | 122 | 2014 | (A. Ehsan et al.) [44] |
| 19 | 2021 | (L. Bourikas et al.) [8] | 71 | 2019 | (J. Xiong et al.) [134] | 123 | 2014 | (M. Veselý & W. Zeiler) [161] |
| 20 | 2021 | (N. A. Khan & B. Bhattacharjee) [166] | 72 | 2019 | (D. Russo & A. Ruggiero) [135] | 124 | 2014 | (M. Frascarolo, S. Martorelli, & V. Vitale) [80] |
| 21 | 2021 | (R. Elnaklah, I. Walker, & S. Natarajan) [6] | 73 | 2019 | (N. G. Vardaxis, D. Bard, & K. Persson Waye) [156] | 125 | 2014 | (P. Taylor, A. T. Nguyen, & S. Reiter) [51] |
| 22 | 2021 | (C.Y. Yeh & Y.S. Tsay) [93] | 74 | 2019 | (C. Papayiannis, C. Evers, & P. A. Naylor) [96] | 126 | 2014 | (K. Horikiri, Y. Yao, & J. Yao) [81] |
| 23 | 2021 | (A. Yüksel et al.) [24] | 75 | 2018 | (J. Y. Suk) [29] | 127 | 2013 | (L. Faculty & A. Sciences) [82] |
| 24 | 2021 | (S. Oh & S. Song) [111] | 76 | 2018 | (J. Kim et al.) [17] | 128 | 2013 | (W. J. N. Turner & I. S. Walker) [83] |
| 25 | 2021 | (P. Nejat et al.) [112] | 77 | 2018 | (T. Chaudhuri et al.) [183] | 129 | 2013 | (A. Lenoir et al.) [84] |
| 26 | 2021 | (N. Ma, D. Aviv, H. Guo, & W. W. Braham) [33] | 78 | 2018 | (K. Katić, R. Li, J. Verhaart, & W. Zeiler) [187] | 130 | 2012 | (D. Griego, M. Krarti, & A. Hernández-guerrero) [85] |
| 27 | 2021 | (R. Amini et al.) [113] | 79 | 2018 | (H. Sghiouri, A. Mezrhab, & H. Naji) [136] | 131 | 2012 | (S. Wu & J.-Q. Q. Sun) [59] |
| 28 | 2021 | (K.-H. Yu et al.) [76] | 80 | 2018 | (M. Ferrara, E. Sirombo, & E. Fabrizio) [137] | 132 | 2012 | (S. Wu & J.-Q. Sun) [55] |
| 29 | 2021 | (Q. Zhao, Z. Lian, & D. Lai) [167] | 81 | 2018 | (M. Alizadeh & S. M. Sadrameli) [157] | 133 | 2012 | (C. E. Ochoa et al.) [48] |
| 30 | 2021 | (G. Ma & X. Pan) [77] | 82 | 2018 | (A. Schieweck et al.) [174] | 134 | 2012 | (G. Y. Yun et al.) [58] |
| 31 | 2021 | (J. Xue, Y. Wang, & M. Wang) [78] | 83 | 2018 | (I. Ballarini et al.) [138] | 135 | 2012 | (G. M. Stavrakakis et al.) [50] |
| 32 | 2021 | (R. M. ElBatran & W. S. E. Ismaeel) [62] | 84 | 2018 | (A. Michael, S. Gregoriou, & S. A. Kalogirou) [139] | 136 | 2012 | (Y. Cheng, J. Niu, & N. Gao) [86] |
| 33 | 2021 | (R. A. Rizi & A. Eltaweel) [179] | 85 | 2018 | (S. Gou et al.) [140] | 137 | 2012 | (R. Z. Homod et al.) [49] |
| 34 | 2021 | (R. Lapisa et al.) [114] | 86 | 2018 | (Y. Zhang et al.) [178] | 138 | 2011 | (M. Frontczak & P. Wargocki) [25] |
| 35 | 2021 | (A. A. S. Bahdad et al.) [115] | 87 | 2018 | (P. Potočnik et al.) [141] | 139 | 2011 | (M. Hamdy, A. Hasan, & K. Siren) [54] |
| 36 | 2021 | (R. Abarghooie et al.) [94] | 88 | 2018 | (R. F. Pérez) [95] | 140 | 2010 | (N. Djongyang, R. Tchinda, & D. Njomo) [43] |
| 37 | 2021 | (A. Kaushik et al.) [116] | 89 | 2017 | (R. Debnath, R. Bardhan, & R. K. Jain) [142] | 141 | 2009 | (M. Castilla et al.) [57] |
| 38 | 2021 | (L. R. Jia et al.) [117] | 90 | 2017 | (S. Kang, D. Ou, & C. M. Mak) [143] | 142 | 2009 | (J. Conraud-Bianchi) [87] |
| 39 | 2021 | (A. Davoodi, P. Johansson, & M. Aries) [60] | 91 | 2017 | (A. Mukhtar, K. C. Ng, & M. Z. Yusoff) [144] | 143 | 2008 | (R. Z. Freire, G. H. C. Oliveira, & N. Mendes) [45] |
| 40 | 2020 | (S. Nundy & A. Ghosh) [172] | 92 | 2017 | (F. Stazi et al.) [145] | 144 | 2008 | (L. Bellia et al.) [162] |
| 41 | 2020 | (T. Parkinson, R. de Dear, & G. Brager) [118] | 93 | 2017 | (A. Gramez & F. Boubenider) [173] | 145 | 2007 | (D. Lindelöf) [88] |
| 42 | 2020 | (H. Wu, X. Sun, & Y. Wu) [14] | 94 | 2017 | (D. Enescu) [158] | 146 | 2007 | (N. Djuric et al.) [89] |
| 43 | 2020 | (L. Huang & Z. Zhai) [153] | 95 | 2017 | (s. Zhang et al.) [5] | 147 | 2006 | (R. Z. Freire, G. H. C. Oliveira, & N. Mendes) [163] |
| 44 | 2020 | (R. De Dear et al.) [154] | 96 | 2017 | (F. Bre, F. Pii, & F. Bre) [56] | 148 | 2005 | (W. K. E. Osterhaus) [164] |
| 45 | 2020 | (K. Karyono et al.) [10] | 97 | 2017 | (D. Zhai & Y. C. Soh) [146] | 149 | 2005 | (A. Melikov et al.) [90] |
| 46 | 2020 | (N. S. Shafavi et al.) [155] | 98 | 2017 | (A. Zhang et al.) [147] | 150 | 2004 | (E. L. Krüger and P. H. T. Zannin) [92] |
| 47 | 2020 | (E. Schito et al.) [168] | 99 | 2016 | (C. D. Korkas et al.) [47] | 151 | 2004 | (G. K. Oral, A. K. Yener, & N. T. Bayazit) [91] |
| 48 | 2020 | (S. Yang et al.) [15] | 100 | 2016 | (T. Moore et al.) [148] | 152 | 2003 | (E. Prianto & P. Depecker) [53] |
| 49 | 2020 | (A. Ebrahimi-moghadam, P. Ildarabadi, & K. Aliakbari) [119] | 101 | 2016 | (B. El-Fil, N. Ghaddar, & K. Ghali) [149] | 153 | 2002 | (J. F. Nicol & M. A. Humphreys) [41] |
| 50 | 2020 | (M. Marzouk, M. Elsharkawy, & A. Eissa) [120] | 102 | 2016 | (N. Delgarm, B. Sajadi, & S. Delgarm) [150] | 154 | 2002 | (Fanger, P.O & Toftum, J) [42] |
| 51 | 2020 | (F. Bünning et al.) [121] | 103 | 2016 | (P. H. Shaikh et al.) [159] | |||
| 52 | 2020 | (R. Wang, S. Lu, & W. Feng) [122] | 104 | 2016 | (J. Kim et al.) [151] |
References
- Zhao, J.; Du, Y. Multi-objective optimization design for windows and shading configuration considering energy consumption and thermal comfort: A case study for office building in different climatic regions of China. Sol. Energy 2020, 206, 997–1017. [Google Scholar] [CrossRef]
- Santamouris, M.; Feng, J. Recent Progress in Daytime Radiative Cooling: Is It the Air Conditioner of the Future? Buildings 2018, 8, 168. [Google Scholar] [CrossRef] [Green Version]
- Petre, S.G.; Isopescu, D.N.; Pruteanu, M.; Cojocaru, A. Effect of Exposure to Environmental Cycling on the Thermal Conductivity of Expanded Polystyrene. Materials 2022, 15, 6921. [Google Scholar] [CrossRef]
- Santamouris, M.; Vasilakopoulou, K. Present and future energy consumption of buildings: Challenges and opportunities towards decarbonisation. e-Prime Adv. Electr. Eng. Electron. Energy 2021, 1, 100002. [Google Scholar] [CrossRef]
- Zhang, S.; Cheng, Y.; Fang, Z.; Huan, C.; Lin, Z. Optimization of room air temperature in stratum-ventilated rooms for both thermal comfort and energy saving. Appl. Energy 2017, 204, 420–431. [Google Scholar] [CrossRef]
- Elnaklah, R.; Walker, I.; Natarajan, S. Moving to a green building: Indoor environment quality, thermal comfort and health. Build. Environ. 2021, 191, 107592. [Google Scholar] [CrossRef]
- Al Horr, Y.; Arif, M.; Katafygiotou, M.; Mazroei, A.; Kaushik, A.; Elsarrag, E. Impact of indoor environmental quality on occupant well-being and comfort: A review of the literature. Int. J. Sustain. Built Environ. 2016, 5, 1–11. [Google Scholar] [CrossRef]
- Bourikas, L.; Gauthier, S.; En, N.K.S.; Xiong, P. Effect of Thermal, Acoustic and Air Quality Perception Interactions on the Comfort and Satisfaction of People in Office Buildings. Energies 2021, 14, 333. [Google Scholar] [CrossRef]
- Song, T.; Mao, F.; Liu, Q. Human Comfort in Indoor Environment: A Review on Assessment Criteria, Data Collection and Data Analysis Methods. IEEE Access 2019, 7, 119774–119786. [Google Scholar] [CrossRef]
- Karyono, K.; Abdullah, B.M.; Cotgrave, A.J.; Bras, A. The adaptive thermal comfort review from the 1920s, the present, and the future. Dev. Built Environ. 2020, 4, 100032. [Google Scholar] [CrossRef]
- Mudarri, D.H. Building Codes and Indoor Air Quality; US EPA: Washington, DC, USA, 2010.
- Alker, R.O.J.; Malanca, M.; Pottage, C. Productivity in Offices The next chapter for green building. World Green Build. Counc. 2015, 1, 46. [Google Scholar]
- Li, Z.; Kim, E. Effects of different environment combinations on the comfort and productivity of researchers in winter. Indoor Built Environ. 2022, 31, 1675–1687. [Google Scholar] [CrossRef]
- Wu, H.; Sun, X.; Wu, Y. Investigation of the relationships between thermal, acoustic, illuminous environments and human perceptions. J. Build. Eng. 2020, 32, 101839. [Google Scholar] [CrossRef]
- Yang, S.; Wan, M.P.; Chen, W.; Ng, B.F.; Dubey, S. Model predictive control with adaptive machine-learning-based model for building energy efficiency and comfort optimization. Appl. Energy 2020, 271, 115147. [Google Scholar] [CrossRef]
- Hamdi, M.; Lachiver, G.; Michaud, F. A new predictive thermal sensation index of human response. Energy Build. 1999, 29, 167–178. [Google Scholar] [CrossRef]
- Kim, J.; Zhou, Y.; Schiavon, S.; Raftery, P.; Brager, G. Personal comfort models: Predicting individuals’ thermal preference using occupant heating and cooling behavior and machine learning. Build. Environ. 2018, 129, 96–106. [Google Scholar] [CrossRef] [Green Version]
- Pasini, D.; Reda, F.; Häkkinen, T. User engaging practices for energy saving in buildings: Critical review and new enhanced procedure. Energy Build. 2017, 148, 74–88. [Google Scholar] [CrossRef]
- Ahmad, M.W.; Mourshed, M.; Mundow, D.; Sisinni, M.; Rezgui, Y. Building energy metering and environmental monitoring—A state-of-the-art review and directions for future research. Energy Build. 2016, 120, 85–102. [Google Scholar] [CrossRef] [Green Version]
- Kar, P.; Shareef, A.; Kumar, A.; Harn, K.T.; Kalluri, B.; Panda, S.K. ReViCEE: A recommendation based approach for personalized control, visual comfort & energy efficiency in buildings. Build. Environ. 2019, 152, 135–144. [Google Scholar] [CrossRef]
- Saha, H.; Florita, A.R.; Henze, G.P.; Sarkar, S. Occupancy sensing in buildings: A review of data analytics approaches. Energy Build. 2019, 188–189, 278–285. [Google Scholar] [CrossRef]
- ISO 7730:1994. Moderate Thermal Environments — Determination of the PMV and PPD Indices and Specification of the Conditions for Thermal Comfort. Available online: https://www.iso.org/standard/14567.html (accessed on 17 August 2022).
- American National Standards Institute. Thermal environmental conditions for human occupancy. ANSI/ASHRAE Stand. 2017, 55, 60. [Google Scholar]
- Yüksel, A.; Arıcı, M.; Krajčík, M.; Civan, M.; Karabay, H. A review on thermal comfort, indoor air quality and energy consumption in temples. J. Build. Eng. 2020, 35, 102013. [Google Scholar] [CrossRef]
- Frontczak, M.; Wargocki, P. Literature survey on how different factors influence human comfort in indoor environments. Build. Environ. 2011, 46, 922–937. [Google Scholar] [CrossRef]
- Pérez-Lombard, L.; Ortiz, J.; Pout, C. A review on buildings energy consumption information. Energy Build. 2008, 40, 394–398. [Google Scholar] [CrossRef]
- Carlucci, S.; Causone, F.; De Rosa, F.; Pagliano, L. A review of indices for assessing visual comfort with a view to their use in optimization processes to support building integrated design. Renew. Sustain. Energy Rev. 2015, 47, 1016–1033. [Google Scholar] [CrossRef] [Green Version]
- Steemers, K. Daylighting design: Enhancing energy efficiency and visual quality. Renew. Energy 1994, 5, 950–958. [Google Scholar] [CrossRef]
- Suk, J.Y. Luminance and vertical eye illuminance thresholds for occupants’ visual comfort in daylit office environments. Build. Environ. 2018, 148, 107–115. [Google Scholar] [CrossRef]
- Sorooshnia, E.; Rashidi, M.; Rahnamayiezekavat, P.; Samali, B. Optimizing Window Configuration Counterbalancing Energy Saving and Indoor Visual Comfort for Sydney Dwellings. Buildings 2022, 12, 1823. [Google Scholar] [CrossRef]
- Sorooshnia, E.; Rashidi, M.; Rahnamayiezekavat, P.; Rezaei, F.; Samali, B. Optimum external shading system for counterbalancing glare probability and daylight illuminance in Sydney’s residential buildings. Eng. Constr. Archit. Manag. 2021; ahead of print. [Google Scholar] [CrossRef]
- Navai, M.; Veitch, J.A. Acoustic Satisfaction in Open-Plan Offices: Review and Recommendations; Institute for Research in Construction: Ottawa, ONT, Canada, 2003. [Google Scholar] [CrossRef]
- Ma, N.; Aviv, D.; Guo, H.; Braham, W.W. Measuring the right factors: A review of variables and models for thermal comfort and indoor air quality. Renew. Sustain. Energy Rev. 2021, 135, 110436. [Google Scholar] [CrossRef]
- Koontz, N.; Zarus, G.M.; Stunder, M.J. Nagda. Air Toxics Risk Assessment. 1991. Available online: https://www.in.gov/idem/toxic/air-risk-assessment/ (accessed on 12 August 2022).
- Weed, M. ‘Meta interpretation’: A method for the interpretive synthesis of qualitative research. Forum Qual. Sozialforsch. 2005, 6. Available online: http://nbn-resolving.de/urn:nbn:de:0114-fqs0501375 (accessed on 12 August 2022).
- Saldana, J.M. The Coding Manual for Qualitative Researchers, 3rd ed.; SAGE Publications: London, UK, 2015. [Google Scholar]
- Hoon, C. Meta-Synthesis of Qualitative Case Studies: An Approach to Theory Building. Organ. Res. Methods 2013, 16, 522–556. [Google Scholar] [CrossRef] [Green Version]
- Li, J.; Liu, N. The perception, optimization strategies and prospects of outdoor thermal comfort in China: A review. Build. Environ. 2019, 170, 106614. [Google Scholar] [CrossRef]
- Chen, C. CiteSpace: A Practical Guide for Mapping Scientific Literature; Nova Science Publishers: Hauppauge, NY, USA, 2016. [Google Scholar]
- Yılmaz, Y.; Şansal, K.E.; Aşcıgil-Dincer, M.; Kültür, S.; Tanrıöver, S.H. A methodology to determine appropriate façade aperture sizes considering comfort and performance criteria: A primary school classroom case. Indoor Built Environ. 2022, 31, 1874–1891. [Google Scholar] [CrossRef]
- Nicol, J.F.; Humphreys, M.A. Adaptive thermal comfort and sustainable thermal standards for buildings. Energy Build. 2002, 34, 563–572. [Google Scholar] [CrossRef]
- Fanger, P.O.; Toftum, J. Extension of the PMV model to non-air-conditioned buildings in warm climates. Energy Build. 2002, 34, 533–536. [Google Scholar] [CrossRef]
- Djongyang, N.; Tchinda, R.; Njomo, D. Thermal comfort: A review paper. Renew. Sustain. Energy Rev. 2010, 14, 2626–2640. [Google Scholar] [CrossRef]
- AAsadi, E.; da Silva, M.G.; Antunes, C.H.; Dias, L.; Glicksman, L. Multi-Objective Optimization For Building Retrofit: A Model Using Genetic Algorithm And Artificial Neural Network And An Application. Energy Build. 2014, 81, 444–456. [Google Scholar] [CrossRef]
- Freire, R.Z.; Oliveira, G.H.C.; Mendes, N. Predictive controllers for thermal comfort optimization and energy savings. Energy Build. 2008, 40, 1353–1365. [Google Scholar] [CrossRef]
- Yu, W.; Li, B.; Jia, H.; Zhang, M.; Wang, D. Application of multi-objective genetic algorithm to optimize energy efficiency and thermal comfort in building design. Energy Build. 2015, 88, 135–143. [Google Scholar] [CrossRef]
- Korkas, C.D.; Baldi, S.; Michailidis, I.; Kosmatopoulos, E.B. Occupancy-based demand response and thermal comfort optimization in microgrids with renewable energy sources and energy storage. Appl. Energy 2016, 163, 93–104. [Google Scholar] [CrossRef]
- Ochoa, C.E.; Aries, M.B.C.; van Loenen, E.J.; Hensen, J.L.M. Considerations on design optimization criteria for windows providing low energy consumption and high visual comfort. Appl. Energy 2012, 95, 238–245. [Google Scholar] [CrossRef] [Green Version]
- Homod, R.Z.; Sahari, K.S.M.; Almurib, H.A.; Nagi, F.H. RLF and TS fuzzy model identification of indoor thermal comfort based on PMV/PPD. Build. Environ. 2012, 49, 141–153. [Google Scholar] [CrossRef]
- Stavrakakis, G.; Zervas, P.; Sarimveis, H.; Markatos, N. Optimization of window-openings design for thermal comfort in naturally ventilated buildings. Appl. Math. Model. 2012, 36, 193–211. [Google Scholar] [CrossRef]
- Nguyen, A.T.; Reiter, S. Passive designs and strategies for low-cost housing using simulation-based optimization and different thermal comfort criteria. J. Build. Perform. Simul. 2013, 7, 68–81. [Google Scholar] [CrossRef] [Green Version]
- Ascione, F.; Bianco, N.; De Masi, R.F.; Mauro, G.M.; Vanoli, G.P. Design of the building envelope: A novel multi-objective approach for the optimization of energy performance and thermal comfort. Sustainability 2015, 7, 10809–10836. [Google Scholar] [CrossRef] [Green Version]
- Prianto, E.; Depecker, P. Optimization of architectural design elements in tropical humid region with thermal comfort approach. Energy Build. 2003, 35, 273–280. [Google Scholar] [CrossRef]
- Hamdy, M.; Hasan, A.; Siren, K. Impact of adaptive thermal comfort criteria on building energy use and cooling equipment size using a multi-objective optimization scheme. Energy Build. 2011, 43, 2055–2067. [Google Scholar] [CrossRef]
- Wu, S.; Sun, J.-Q. Two-stage regression model of thermal comfort in office buildings. Build. Environ. 2012, 57, 88–96. [Google Scholar] [CrossRef]
- Bre, F.; Fachinotti, V.D. A computational multi-objective optimization method to improve energy efficiency and thermal comfort in dwellings. Energy Build. 2017, 154, 283–294. [Google Scholar] [CrossRef] [Green Version]
- Castilla, M.D.M.; Álvarez, J.D.; Berenguel, M.; Pérez, M.; Guzmán, J.L.; Rodríguez, F. Comfort optimization in a solar energy research center. IFAC Proc. Vol. 2009, 43, 36–41. [Google Scholar] [CrossRef]
- Yun, G.Y.; Kong, H.J.; Kim, H.; Kim, J.T. A field survey of visual comfort and lighting energy consumption in open plan offices. Energy Build. 2012, 46, 146–151. [Google Scholar] [CrossRef]
- Wu, S.; Sun, J.-Q. A physics-based linear parametric model of room temperature in office buildings. Build. Environ. 2012, 50, 1–9. [Google Scholar] [CrossRef]
- Davoodi, A.; Johansson, P.; Aries, M. The Implementation of Visual Comfort Evaluation in the Evidence-Based Design Process Using Lighting Simulation. Appl. Sci. 2021, 11, 4982. [Google Scholar] [CrossRef]
- Sakka, A.; Santamouris, M.; Livada, I.; Nicol, F.; Wilson, M. On the thermal performance of low income housing during heat waves. Energy Build. 2012, 49, 69–77. [Google Scholar] [CrossRef]
- ElBatran, R.M.; Ismaeel, W.S. Applying a parametric design approach for optimizing daylighting and visual comfort in office buildings. Ain Shams Eng. J. 2021, 12, 3275–3284. [Google Scholar] [CrossRef]
- Choi, Y.-J. Effect of occupancy on acoustical conditions in university classrooms. Appl. Acoust. 2016, 114, 36–43. [Google Scholar] [CrossRef]
- Stazi, F.; Tomassoni, E.; Di Perna, C. Super-insulated wooden envelopes in Mediterranean climate: Summer overheating, thermal comfort optimization, environmental impact on an Italian case study. Energy Build. 2017, 138, 716–732. [Google Scholar] [CrossRef]
- Chen, X.; Wang, Q.; Srebric, J. Occupant feedback based model predictive control for thermal comfort and energy optimization: A chamber experimental evaluation. Appl. Energy 2016, 164, 341–351. [Google Scholar] [CrossRef]
- Wang, Y.; Kuckelkorn, J.; Zhao, F.-Y.; Liu, D.; Kirschbaum, A.; Zhang, J.-L. Evaluation on classroom thermal comfort and energy performance of passive school building by optimizing HVAC control systems. Build. Environ. 2015, 89, 86–106. [Google Scholar] [CrossRef]
- Carlucci, S.; Cattarin, G.; Causone, F.; Pagliano, L. Multi-objective optimization of a nearly zero-energy building based on thermal and visual discomfort minimization using a non-dominated sorting genetic algorithm (NSGA-II). Energy Build. 2015, 104, 378–394. [Google Scholar] [CrossRef] [Green Version]
- Chen, X.; Wang, Q.; Srebric, J. Model Predictive Control for Indoor Thermal Comfort and Energy Optimization Using Occupant Feedback. Energy Build. 2015, 102, 357–369. [Google Scholar] [CrossRef] [Green Version]
- Ghahramani, A.; Tang, C.; Becerik-Gerber, B. An online learning approach for quantifying personalized thermal comfort via adaptive stochastic modeling. Build. Environ. 2015, 92, 86–96. [Google Scholar] [CrossRef] [Green Version]
- Ortiz, J.; Fonseca, A.; Salom, J.; Russo, V.; Garrido, N.; Fonseca, C.P. Optimization of Energy Renovation of Residential Sector in Catalonia Based on Comfort, Energy and Costs. In Proceedings of the IBPSA 2015 Proceedings, Hyderabad, India, 7–9 December 2015. [Google Scholar]
- Ascione, F.; Bianco, N.; De Stasio, C.; Mauro, G.M.; Vanoli, G.P. Simulation-based model predictive control by the multi-objective optimization of building energy performance and thermal comfort. Energy Build. 2015, 111, 131–144. [Google Scholar] [CrossRef]
- Moenssens, N. A Parametrical Study for the Optimization of Daylighting in Advanced Façades. In Proceedings of the Conference on Advanced Building Skins, Bern, Switzerland, 3–4 November 2015. [Google Scholar]
- ASHRAE. Ventilation for Acceptable Indoor Air Quality. J. Phys. A Math. Theor. 2016, 44, 085201. [Google Scholar]
- SHosseini, S.M.; Mohammadi, M.; Rosemann, A.; Schröder, T.; Lichtenberg, J. A morphological approach for kinetic façade design process to improve visual and thermal comfort: Review. Build. Environ. 2019, 153, 186–204. [Google Scholar] [CrossRef]
- Rodriguez, C.M.; Medina, J.M.; Coronado, M.C.; D’alessandro, M. The Development of Data-Collection Methods for Thermal Comfort Assessment in Tropical Countries. IOP Conf. Ser. Mater. Sci. Eng. 2019, 603, 052001. [Google Scholar] [CrossRef]
- Yu, K.-H.; Chen, Y.-A.; Jaimes, E.; Wu, W.-C.; Liao, K.-K.; Liao, J.-C.; Lu, K.-C.; Sheu, W.-J.; Wang, C.-C. Optimization of thermal comfort, indoor quality, and energy-saving in campus classroom through deep Q learning. CASE Stud. Therm. Eng. 2021, 24, 100842. [Google Scholar] [CrossRef]
- Ma, G.; Pan, X. Research on a Visual Comfort Model Based on Individual Preference in China through Machine Learning Algorithm. Sustainability 2021, 13, 7602. [Google Scholar] [CrossRef]
- Xue, J.; Wang, Y.; Wang, M. Smart Design of Portable Indoor Shading Device for Visual Comfort-A Case Study of a College Library. Appl. Sci. 2021, 11, 10644. [Google Scholar] [CrossRef]
- Rackes, A.; Waring, M.S. Using multiobjective optimizations to discover dynamic building ventilation strategies that can improve indoor air quality and reduce energy use. Energy Build. 2014, 75, 272–280. [Google Scholar] [CrossRef]
- Frascarolo, M.; Martorelli, S.; Vitale, V. An innovative lighting system for residential applicationwhich optimize visual comfort and energy saving for different Usersneeds. Energy Build. 2014, 83, 217–224. [Google Scholar] [CrossRef]
- Horikiri, K.; Yao, Y.; Yao, J. Numerical optimisation of thermal comfort improvement for indoor environment with occupants and furniture. Energy Build. 2014, 88, 303–315. [Google Scholar] [CrossRef] [Green Version]
- Faculty, L.; Sciences, A. Sustainable Housing in Vietnam: Climate Responsive Design Strategies to Optimize Thermal Comfort. Ph.D. Thesis, Université de Liège, Liège, Belgium, 2013. [Google Scholar]
- Turner, W.J.; Walker, I.S. Using a ventilation controller to optimise residential passive ventilation for energy and indoor air quality. Build. Environ. 2013, 70, 20–30. [Google Scholar] [CrossRef]
- Lenoir, A.; Cory, S.; Donn, M.; Garde, F. Optimisation Methodology for the Design of Solar Shading for Thermal and Visual Comfort in Tropical Climates Piment Laboratory. In Proceedings of the 13th Conference of International Building Performance Simulation Association, Chambéry, France, 26–28 August 2013; pp. 3086–3095. [Google Scholar]
- Griego, D.; Krarti, M.; Hernández-Guerrero, A. Optimization of energy efficiency and thermal comfort measures for residential buildings in Salamanca, Mexico. Energy Build. 2012, 54, 540–549. [Google Scholar] [CrossRef]
- Cheng, Y.; Niu, J.; Gao, N. Stratified air distribution systems in a large lecture theatre: A numerical method to optimize thermal comfort and maximize energy saving. Energy Build. 2012, 55, 515–525. [Google Scholar] [CrossRef]
- Conraud-Bianchi, J. A Methodology for the Optimization of Building Energy, Thermal, and Visual Performance. Master’s Thesis, Concordia University, Montreal, QC, Canada, 2008. [Google Scholar]
- Lindelöf, D. Bayesian Optimization of Visual Comfort; EPFL: Lausanne, Switzerland, 2007; Volume 3918. [Google Scholar]
- Djuric, N.; Novakovic, V.; Holst, J.; Mitrovic, Z. Optimization of energy consumption in buildings with hydronic heating systems considering thermal comfort by use of computer-based tools. Energy Build. 2007, 39, 471–477. [Google Scholar] [CrossRef] [Green Version]
- Melikov, A.; Pitchurov, G.; Naydenov, K.; Langkilde, G. Field study on occupant comfort and the office thermal environment in rooms with displacement ventilation. Indoor Air 2005, 15, 205–214. [Google Scholar] [CrossRef]
- Oral, G.K.; Yener, A.K.; Bayazit, N.T. Building envelope design with the objective to ensure thermal, visual and acoustic comfort conditions. Build. Environ. 2004, 39, 281–287. [Google Scholar] [CrossRef]
- Krüger, E.L.; Zannin, P.H. Acoustic, thermal and luminous comfort in classrooms. Build. Environ. 2004, 39, 1055–1063. [Google Scholar] [CrossRef]
- Yeh, C.-Y.; Tsay, Y.-S. Using Machine Learning to Predict Indoor Acoustic Indicators of Multi-Functional Activity Centers. Appl. Sci. 2021, 11, 5641. [Google Scholar] [CrossRef]
- Abarghooie, R.; Zomorodian, Z.S.; Tahsildoost, M.; Shaghaghian, Z. A Machine-learning Framework for Acoustic Design Assessment in Early Design Stages. arXiv Preprint 2021, arXiv:2109.06459. [Google Scholar]
- Pérez, R.F. Machine-Learning-Based Estimation of Room Acoustic Parameters. Master’s Thesis, Aalto University, Espoo, Finland, 2018. [Google Scholar]
- Papayiannis, C.; Evers, C.; Naylor, A. Detecting Sound-Absorbing Materials in a Room from a Single Impulse Response Using a CRNN. 4–10 January 2019. Available online: http://arxiv.org/abs/1901.05852 (accessed on 17 August 2022).
- Selim, A.M.; Saeed, D.M. Enhancing the classroom acoustic environment in Badr University, Egypt: A case study. Build. Acoust. 2022, 29, 577–596. [Google Scholar] [CrossRef]
- Wu, H.; Zhang, T. Multi-objective optimization of energy, visual, and thermal performance for building envelopes in China?s hot summer and cold winter climate zone. J. Build. Eng. 2022, 59, 105034. [Google Scholar] [CrossRef]
- Noorzai, E.; Bakmohammadi, P.; Garmaroudi, M.A. Optimizing daylight, energy and occupant comfort performance of classrooms with photovoltaic integrated vertical shading devices. Arch. Eng. Des. Manag. 2022, 18, 1–25. [Google Scholar] [CrossRef]
- Diker, F.; Erkan, I. The Fuzzy Logic Method in Assessing Window Design for the Visual Comfort of Classrooms at the Early Design Stage. J. Archit. Eng. 2022, 28, 04022013. [Google Scholar] [CrossRef]
- Kahaki, Z.R.; Jahangiri, H.; Smith, A.; Kazemi, R. Subjective and objective survey of office lighting: Effects on alertness, comfort, satisfaction, and safety. Med. DEL Lav. 2022, 113, e2022024. [Google Scholar] [CrossRef]
- Glean, A.A.; Gatland, S.D.; Elzeyadi, I. Visualization of Acoustic Comfort in an Open-Plan, High-Performance Glass Building. Buildings 2022, 12, 338. [Google Scholar] [CrossRef]
- Abdollahzadeh, N.; Farahani, A.V.; Soleimani, K.; Zomorodian, Z.S. Indoor environmental quality improvement of student dormitories in Tehran, Iran. Int. J. Build. Pathol. Adapt. 2022; ahead of print. [Google Scholar] [CrossRef]
- Omidi, A.; Golchin, N.; Masoud, S.E. Evaluating the visual comfort of Orosi windows in hot and semi-arid climates through climate-based daylight metrics: A quantitative study. J. Asian Archit. Build. Eng. 2022, 21, 2114–2130. [Google Scholar] [CrossRef]
- Kuri, A.B.; Pérez, S.J.R. Acoustic study and architectural proposals to improve acoustic comfort in a university campus of Mexico City. Appl. Acoust. 2022, 185, 108416. [Google Scholar] [CrossRef]
- Mahyuddin, N.; Samzadeh, M.; Zaid, S.M.; Ab Ghafar, N. Towards nearly zero energy building concept—Visual comfort and energy efficiency assessments in a classroom. Open House Int. 2022, 47, 167–187. [Google Scholar] [CrossRef]
- Qabbal, L.; Younsi, Z.; Naji, H. An indoor air quality and thermal comfort appraisal in a retrofitted university building via low-cost smart sensor. Indoor Built Environ. 2022, 31, 586–606. [Google Scholar] [CrossRef]
- Lolli, F.; Coruzzolo, A.M.; Balugani, E. The Indoor Environmental Quality: A TOPSIS-based approach with indirect elicitation of criteria weights. Saf. Sci. 2022, 148, 105652. [Google Scholar] [CrossRef]
- Vittori, F.; Chiatti, C.; Pigliautile, I.; Pisello, A. The NEXT.ROOM: Design principles and systems trials of a novel test room aimed at deepening our knowledge on human comfort. Build. Environ. 2022, 211, 108744. [Google Scholar] [CrossRef]
- Berger, C.; Mahdavi, A. Exploring Cross-Modal Influences on the Evaluation of Indoor-Environmental Conditions. Front. Built Environ. 2021, 7, 676607. [Google Scholar] [CrossRef]
- Oh, S.; Song, S. Detailed Analysis of Thermal Comfort and Indoor Air Quality Using Real-Time Multiple Environmental Monitoring Data for a Childcare Center. Energies 2021, 14, 643. [Google Scholar] [CrossRef]
- Nejat, P.; Ferwati, M.S.; Calautit, J.; Ghahramani, A.; Sheikhshahrokhdehkordi, M. Passive cooling and natural ventilation by the windcatcher (Badgir): An experimental and simulation study of indoor air quality, thermal comfort and passive cooling power. J. Build. Eng. 2021, 41, 102436. [Google Scholar] [CrossRef]
- Amini, R.; Ghaffarianhoseini, A.; Ghaffarianhoseini, A.; Berardi, U. Numerical investigation of indoor thermal comfort and air quality for a multi-purpose hall with various shading and glazing ratios. Therm. Sci. Eng. Prog. 2021, 22, 100812. [Google Scholar] [CrossRef]
- Lapisa, R.; Karudin, A. Experimental study of window shading effect on building thermal-visual comfort in a tropical region. Int. J. Geomate 2021, 21, 79–86. [Google Scholar] [CrossRef]
- Bahdad, A.A.S.; Fadzil, S.F.S.; Onubi, H.O.; BenLasod, S.A. Sensitivity analysis linked to multi-objective optimization for adjustments of light-shelves design parameters in response to visual comfort and thermal energy performance. J. Build. Eng. 2021, 44, 102996. [Google Scholar] [CrossRef]
- Kaushik, A.; Arif, M.; Ebohon, O.J.; Arsalan, H.; Rana, M.Q.; Obi, L. Effect of indoor environmental quality on visual comfort and productivity in office buildings. J. Eng. Des. Technol. 2021; ahead of print. [Google Scholar] [CrossRef]
- Jia, L.-R.; Han, J.; Chen, X.; Li, Q.-Y.; Lee, C.-C.; Fung, Y.-H. Interaction between Thermal Comfort, Indoor Air Quality and Ventilation Energy Consumption of Educational Buildings: A Comprehensive Review. Buildings 2021, 11, 591. [Google Scholar] [CrossRef]
- Parkinson, T.; de Dear, R.; Brager, G. Nudging the adaptive thermal comfort model. Energy Build. 2019, 206, 109559. [Google Scholar] [CrossRef]
- Ebrahimi-Moghadam, A.; Ildarabadi, P.; Aliakbari, K.; Fadaee, F. Sensitivity analysis and multi-objective optimization of energy consumption and thermal comfort by using interior light shelves in residential buildings. Renew. Energy 2020, 159, 736–755. [Google Scholar] [CrossRef]
- Marzouk, M.; ElSharkawy, M.; Eissa, A. Optimizing thermal and visual efficiency using parametric configuration of skylights in heritage buildings. J. Build. Eng. 2020, 31, 101385. [Google Scholar] [CrossRef]
- Bünning, F.; Huber, B.; Heer, P.; Aboudonia, A.; Lygeros, J. Experimental demonstration of data predictive control for energy optimization and thermal comfort in buildings. Energy Build. 2020, 211, 109792. [Google Scholar] [CrossRef] [Green Version]
- Wang, R.; Lu, S.; Feng, W. A three-stage optimization methodology for envelope design of passive house considering energy demand, thermal comfort and cost. Energy 2020, 192, 116723. [Google Scholar] [CrossRef]
- Zhu, L.; Wang, B.; Sun, Y. Multi-objective optimization for energy consumption, daylighting and thermal comfort performance of rural tourism buildings in north China. Build. Environ. 2020, 176, 106841. [Google Scholar] [CrossRef]
- Dietz, A.; Vera, S.; Bustamante, W.; Flamant, G. Multi-objective optimization to balance thermal comfort and energy use in a mining camp located in the Andes Mountains at high altitude. Energy 2020, 199, 117121. [Google Scholar] [CrossRef]
- Salimi, S.; Hammad, A. Optimizing energy consumption and occupants comfort in open-plan offices using local control based on occupancy dynamic data. Build. Environ. 2020, 176, 106818. [Google Scholar] [CrossRef]
- Bakmohammadi, P.; Noorzai, E. Optimization ofthe design ofthe primary school classrooms in terms ofenergy and daylight performance considering occupants’ thermal and visual comfort. Energy Rep. 2020, 6, 1590–1607. [Google Scholar] [CrossRef]
- Tămaş-Gavrea, D.-R.; Munteanu, C.; Iştoan, R.F.; Loghin, A. Acoustic optimization optimization of of a a music music practice practice classroom. Procedia Manuf. 2019, 32, 167–170. [Google Scholar] [CrossRef]
- Valladares, W.; Galindo, M.; Gutiérrez, J.; Wu, W.-C.; Liao, K.-K.; Liao, J.-C.; Lu, K.-C.; Wang, C.-C. Energy optimization associated with thermal comfort and indoor air control via a deep reinforcement learning algorithm. Build. Environ. 2019, 155, 105–117. [Google Scholar] [CrossRef]
- Malik, J.; Bardhan, R. Energy target pinch analysis for optimising thermal comfort in low-income dwellings. J. Build. Eng. 2019, 28, 101045. [Google Scholar] [CrossRef]
- Zomorodian, Z.S.; Tahsildoost, M. Assessing the effectiveness of dynamic metrics in predicting daylight availability and visual comfort in classrooms. Renew. Energy 2019, 134, 669–680. [Google Scholar] [CrossRef]
- Ballarini, I.; De Luca, G.; Paragamyan, A.; Pellegrino, A.; Corrado, V. Transformation of an Office Building into a Nearly Zero Energy Building (nZEB): Implications for Thermal and Visual Comfort and Energy Performance. Energies 2019, 12, 895. [Google Scholar] [CrossRef] [Green Version]
- Andargie, M.; Azar, E. An applied framework to evaluate the impact of indoor office environmental factors on occupants’ comfort and working conditions. Sustain. Cities Soc. 2019, 46, 101447. [Google Scholar] [CrossRef]
- Montiel, I.; Mayoral, A.M.; Pedreño, J.N.; Maiques, S. Acoustic comfort in learning spaces: Moving towards sustainable development goals. Sustainability 2019, 11, 3573. [Google Scholar] [CrossRef] [Green Version]
- Xiong, J.; Tzempelikos, A.; Bilionis, I.; Karava, P. A personalized daylighting control approach to dynamically optimize visual satisfaction and lighting energy use. Energy Build. 2019, 193, 111–126. [Google Scholar] [CrossRef]
- Russo, D.; Ruggiero, A. Choice of the optimal acoustic design of a school classroom and experimental verification. Appl. Acoust. 2018, 146, 280–287. [Google Scholar] [CrossRef]
- Sghiouri, H.; Mezrhab, A.; Karkri, M.; Naji, H. Shading devices optimization to enhance thermal comfort and energy performance of a residential building in Morocco. J. Build. Eng. 2018, 18, 292–302. [Google Scholar] [CrossRef]
- Ferrara, M.; Sirombo, E.; Fabrizio, E. Automated optimization for the integrated design process: The energy, thermal and visual comfort nexus. Energy Build. 2018, 168, 413–427. [Google Scholar] [CrossRef]
- Ballarini, I.; De Luca, G.; Paragamyan, A.; Pellegrino, A.; Corrado, V. Integration of Thermal and Visual Comfort in the Retrofit of Existing Buildings. In Proceedings of the 2018 IEEE International Conference on Environment and Electrical Engineering and 2018 IEEE Industrial and Commercial Power Systems Europe (EEEIC/I&CPS Europe), Palermo, Italy, 12–15 June 2018. [Google Scholar]
- Michael, A.; Gregoriou, S.; Kalogirou, S. Environmental assessment of an integrated adaptive system for the improvement of indoor visual comfort of existing buildings. Renew. Energy 2018, 115, 620–633. [Google Scholar] [CrossRef]
- Gou, S.; Nik, V.M.; Scartezzini, J.-L.; Zhao, Q.; Li, Z. Passive design optimization of newly-built residential buildings in Shanghai for improving indoor thermal comfort while reducing building energy demand. Energy Build. 2018, 169, 484–506. [Google Scholar] [CrossRef]
- Potočnik, P.; Vidrih, B.; Kitanovski, A.; Govekar, E. Analysis and optimization of thermal comfort in residential buildings by means of a weather-controlled air-to-water heat pump. Build. Environ. 2018, 140, 68–79. [Google Scholar] [CrossRef] [Green Version]
- Debnath, R.; Bardhan, R.; Jain, R.K. A data-driven and simulation approach for understanding thermal performance of slum redevelopment in Mumbai, India. In Proceedings of the 15th IBPSA Conference, San Francisco, CA, USA, 7–9 August 2017; pp. 2745–2752. [Google Scholar]
- Kang, S.; Ou, D.; Mak, C.M. The impact of indoor environmental quality on work productivity in university open-plan research offices. Build. Environ. 2017, 124, 78–89. [Google Scholar] [CrossRef]
- Mukhtar, A.; Ng, K.; Yusoff, M. Design optimization for ventilation shafts of naturally-ventilated underground shelters for improvement of ventilation rate and thermal comfort. Renew. Energy 2018, 115, 183–198. [Google Scholar] [CrossRef]
- Stazi, F.; Naspi, F.; Ulpiani, G.; Di Perna, C. Indoor air quality and thermal comfort optimization in classrooms developing an automatic system for windows opening and closing. Energy Build. 2017, 139, 732–746. [Google Scholar] [CrossRef]
- Zhai, D.; Soh, Y.C. Balancing indoor thermal comfort and energy consumption of ACMV systems via sparse swarm algorithms in optimizations. Energy Build. 2017, 149, 1–15. [Google Scholar] [CrossRef]
- Zhang, A.; Bokel, R.; van den Dobbelsteen, A.; Sun, Y.; Huang, Q.; Zhang, Q. Optimization of thermal and daylight performance of school buildings based on a multi-objective genetic algorithm in the cold climate of China. Energy Build. 2017, 139, 371–384. [Google Scholar] [CrossRef]
- Moore, T.; Ridley, I.; Strengers, Y.; Maller, C.; Horne, R. Dwelling performance and adaptive summer comfort in low-income Australian households. Build. Res. Inf. 2016, 45, 443–456. [Google Scholar] [CrossRef]
- El-Fil, B.; Ghaddar, N.; Ghali, K. Optimizing performance of ceiling-mounted personalized ventilation system assisted by chair fans: Assessment of thermal comfort and indoor air quality. Sci. Technol. Built Environ. 2016, 22, 412–430. [Google Scholar] [CrossRef]
- Delgarm, N.; Sajadi, B.; Delgarm, S. Multi-objective optimization of building energy performance and indoor thermal comfort: A new method using artificial bee colony (ABC). Energy Build. 2016, 131, 42–53. [Google Scholar] [CrossRef]
- Kim, J.; Hong, T.; Jeong, J.; Koo, C.; Jeong, K. An optimization model for selecting the optimal green systems by considering the thermal comfort and energy consumption. Appl. Energy 2016, 169, 682–695. [Google Scholar] [CrossRef]
- Yu, T.-H.; Kwon, S.-Y.; Im, K.-M.; Lim, J.-H. An RTP-based Dimming Control System for Visual Comfort Enhancement and Energy Optimization. Energy Build. 2016, 144, 433–444. [Google Scholar] [CrossRef]
- Huang, L.; Zhai, Z. Critical review and quantitative evaluation of indoor thermal comfort indices and models incorporating solar radiation effects. Energy Build. 2020, 224, 110204. [Google Scholar] [CrossRef]
- De Dear, R.; Xiong, J.; Kim, J.; Cao, B. A review of adaptive thermal comfort research since 1998. Energy Build. 2020, 214, 109893. [Google Scholar] [CrossRef]
- Shafavi, N.S.; Zomorodian, Z.S.; Tahsildoost, M.; Javadi, M. Occupants visual comfort assessments: A review of field studies and lab experiments. Sol. Energy 2020, 208, 249–274. [Google Scholar] [CrossRef]
- Vardaxis, N.-G.; Bard, D.; Waye, K.P. Review of acoustic comfort evaluation in dwellings—Part I: Associations of acoustic field data to subjective responses from building surveys. Build. Acoust. 2018, 25, 151–170. [Google Scholar] [CrossRef] [Green Version]
- Alizadeh, M.; Sadrameli, S. Numerical modeling and optimization of thermal comfort in building: Central composite design and CFD simulation. Energy Build. 2018, 164, 187–202. [Google Scholar] [CrossRef]
- Enescu, D. A review of thermal comfort models and indicators for indoor environments. Renew. Sustain. Energy Rev. 2017, 79, 1353–1379. [Google Scholar] [CrossRef]
- Shaikh, P.H.; Nor, N.B.M.; Nallagownden, P.; Elamvazuthi, I. Intelligent Multi-objective Optimization for Building Energy and Comfort Management. J. King Saud Univ. Eng. Sci. 2016, 30, 195–204. [Google Scholar] [CrossRef] [Green Version]
- Hweij, W.A.; Ghaddar, N.; Ghali, K.; Habchi, C. Optimized performance of displacement ventilation aided with chair fans for comfort and indoor air quality. Energy Build. 2016, 127, 907–919. [Google Scholar] [CrossRef]
- Veselý, M.; Zeiler, W. Personalized conditioning and its impact on thermal comfort and energy performance—A review. Renew. Sustain. Energy Rev. 2014, 34, 401–408. [Google Scholar] [CrossRef] [Green Version]
- International Workshop, 31 March 2008, Rome, Italy. Ente per le Nuove Tecnologie, L’Energia e L’Ambiente, ENEA. Available online: www.fedoa.unina.it/1312/1/Bellia_paper.pdf (accessed on 12 July 2022).
- Freire, R.Z.; Oliveira, G.H.C.; Mendes, N. Non-Linear Predictive Controllers for Thermal Comfort Optimization and Energy Saving. IFAC Proc. 2006, 39, 87–92. [Google Scholar] [CrossRef]
- Osterhaus, W.K. Discomfort glare assessment and prevention for daylight applications in office environments. Sol. Energy 2005, 79, 140–158. [Google Scholar] [CrossRef]
- Tang, H.; Liu, X.; Geng, Y.; Lin, B.; Ding, Y. Assessing the perception of overall indoor environmental quality: Model validation and interpretation. Energy Build. 2022, 259, 111870. [Google Scholar] [CrossRef]
- Khan, N.A.; Bhattacharjee, B. Methodology for Simultaneous Optimization of the Thermal, Visual, and Acoustic Performance of Building Envelope. J. Archit. Eng. 2021, 27, 04021015. [Google Scholar] [CrossRef]
- Zhao, Q.; Lian, Z.; Lai, D. Thermal comfort models and their developments: A review. Energy Built Environ. 2020, 2, 21–33. [Google Scholar] [CrossRef]
- Schito, E.; Conti, P.; Urbanucci, L.; Testi, D. Multi-objective optimization of HVAC control in museum environment for artwork preservation, visitors’ thermal comfort and energy efficiency. Build. Environ. 2020, 180, 107018. [Google Scholar] [CrossRef]
- Hashempour, N.; Taherkhani, R.; Mahdikhani, M. Energy Performance Optimization of Existing Buildings: A Literature Review. Sustain. Cities Soc. 2019, 54, 101967. [Google Scholar] [CrossRef]
- Zhai, Y.; Wang, Y.; Huang, Y.; Meng, X. A multi-objective optimization methodology for window design considering energy consumption, thermal environment and visual performance. Renew. Energy 2018, 134, 1190–1199. [Google Scholar] [CrossRef]
- Halawa, E.; van Hoof, J. The adaptive approach to thermal comfort: A critical overview. Energy Build. 2012, 51, 101–110. [Google Scholar] [CrossRef]
- Nundy, S.; Ghosh, A. Thermal and visual comfort analysis of adaptive vacuum integrated switchable suspended particle device window for temperate climate. Renew. Energy 2020, 156, 1361–1372. [Google Scholar] [CrossRef]
- Gramez, A.; Boubenider, F. Acoustic comfort evaluation for a conference room: A case study. Appl. Acoust. 2017, 118, 39–49. [Google Scholar] [CrossRef]
- Schieweck, A.; Uhde, E.; Salthammer, T.; Salthammer, L.C.; Morawska, L.; Mazaheri, M.; Kumar, P. Smart homes and the control of indoor air quality. Renew. Sustain. Energy Rev. 2018, 94, 705–718. [Google Scholar] [CrossRef]
- OSHA. OSHA Technical Manual-Section III: Chapter 2: Indoor Air Quality; Occupational Safety & Health Administration: Washington, DC, USA, 1999.
- WHO. WHO Guidelines for Indoor Air Quality: Selected Pollutants; World Health Organization. Regional Office for Europe: Copenhagen, Denmark, 2010.
- Hawila, A.A.-W.; Merabtine, A.; Troussier, N.; Bennacer, R. Combined use of dynamic building simulation and metamodeling to optimize glass facades for thermal comfort. Build. Environ. 2019, 157, 47–63. [Google Scholar] [CrossRef]
- Zhang, Y.; Zhong, Y.; Gong, Y.; Zheng, L. The optimization of visual comfort and energy consumption induced by natural light based on PSO. Sustainability 2018, 11, 49. [Google Scholar] [CrossRef] [Green Version]
- Rizi, R.A.; Eltaweel, A. A user detective adaptive facade towards improving visual and thermal comfort. J. Build. Eng. 2021, 33, 101554. [Google Scholar] [CrossRef]
- Kong, Z.; Zhang, R.; Ni, J.; Ning, P.; Kong, X.; Wang, J. Towards an integration of visual comfort and lighting impression: A field study within higher educational buildings. Build. Environ. 2022, 216, 108989. [Google Scholar] [CrossRef]
- Day, J.K.; Futrell, B.; Cox, R.; Ruiz, S.N.; Amirazar, A.; Zarrabi, A.H.; Azarbayjani, M. Blinded by the light: Occupant perceptions and visual comfort assessments of three dynamic daylight control systems and shading strategies. Build. Environ. 2019, 154, 107–121. [Google Scholar] [CrossRef]
- Khanmohamadi, F.M.M.; Pourahmadi, M. Windows optimization based on the glare performance in educational building of Iran hot and dry climate. J. Archit. Sustain. Urban Plan. 2019, 1, 113–128. [Google Scholar]
- Chaudhuri, T.; Zhai, D.; Soh, Y.C.; Li, H.; Xie, L. Thermal comfort prediction using normalized skin temperature in a uniform built environment. Energy Build. 2018, 159, 426–440. [Google Scholar] [CrossRef]
- Secchi, S.; Sciurpi, F.; Pierangioli, L.; Randazzo, M. Retrofit strategies for the improvement of visual comfort and energy performance of classrooms with large windows exposed to East. Energy Procedia 2015, 78, 3144–3149. [Google Scholar] [CrossRef] [Green Version]
- Papadopoulos, G.; Tolis, E.I.; Panaras, G. IEQ assessment in free-running university classrooms. Sci. Technol. Built Environ. 2022, 28, 823–842. [Google Scholar] [CrossRef]
- Liu, H.; Lee, S.; Kim, M.; Shi, H.; Kim, J.T.; Wasewar, K.L.; Yoo, C. Multi-objective optimization of indoor air quality control and energy consumption minimization in a subway ventilation system. Energy Build. 2013, 66, 553–561. [Google Scholar] [CrossRef]
- Katić, K.; Li, R.; Verhaart, J.; Zeiler, W. Neural network based predictive control of personalized heating systems. Energy Build. 2018, 174, 199–213. [Google Scholar] [CrossRef]
- Wu, H.; Wu, Y.; Sun, X.; Liu, J. Combined effects of acoustic, thermal, and illumination on human perception and performance: A review. Build. Environ. 2020, 169, 106593. [Google Scholar] [CrossRef]
- Nascimento, M.; Lopes, P. Internet of things and machine learning applied to the thermal comfort of internal environments. Indoor Built Environ. 2022, 31, 2274–2290. [Google Scholar] [CrossRef]
- Zhou, Y.; Zheng, S.; Zhang, G. Artificial neural network based multivariable optimization of a hybrid system integrated with phase change materials, active cooling and hybrid ventilations. Energy Convers. Manag. 2019, 197, 111859. [Google Scholar] [CrossRef]
- Rudin, C.; Radin, J. Why Are We Using Black Box Models in AI When We Don ’ t Need To ? A Lesson From an Explainable AI Competition. Harv. Data Sci. Rev. 2019, 1, 10–1162. [Google Scholar]
- Huang, B.; Pan, Z.; Liu, Z.; Hou, G.; Yang, H. Acoustic amenity analysis for high-rise building along urban expressway: Modeling traffic noise vertical propagation using neural networks. Transp. Res. Part D Transp. Environ. 2017, 53, 63–77. [Google Scholar] [CrossRef]
- Nannariello, J.; Fricke, F. The prediction of reverberation time using neural network analysis. Appl. Acoust. 1999, 58, 305–325. [Google Scholar] [CrossRef]
- Park, J.; Jeong, B.; Chae, Y.-T.; Jeong, J.-W. Machine learning algorithms for predicting occupants’ behaviour in the manual control of windows for cross-ventilation in homes. Indoor Built Environ. 2021, 30, 1106–1123. [Google Scholar] [CrossRef]
- Bre, F.; Roman, N.; Fachinotti, V.D. An efficient metamodel-based method to carry out multi-objective building performance optimizations. Energy Build. 2019, 206, 109576. [Google Scholar] [CrossRef]


| No. | Title | Author(s) | Type | Case Study | Country | Year | Keywords | Scopes | Findings |
|---|---|---|---|---|---|---|---|---|---|
| Ex. | A methodology to determine appropriate facade aperture sizes considering comfort and performance criteria | (Y. Yilmaz et al.) [40] | Research article | Educational | Turkey | 2022 | facade design; thermal comfort; visual comfort; Acoustic comfort | Suggesting an effective methodology to find out suitable facade aperture sizes | - The effect of aperture orientation was greater than its size. - The smallest aperture was more suitable for achieving better thermal, visual, and acoustic comfort. - The heating setback system seemed to be an applicable variable for thermal comfort as much as the size of aperture. |
| |||||||||
| No. | Authors | Year | No. of Citation | Article Title |
|---|---|---|---|---|
| 1 | J. F. Nicol and M. A. Humphreys [41] | 2002 | 966 | Adaptive thermal comfort and sustainable thermal standards for buildings |
| 2 | M. Frontczak and P. Wargocki [25] | 2011 | 529 | Literature survey on how different factors influence human comfort in indoor environments |
| 3 | P. O. Fanger, J. Toftum [42] | 2002 | 432 | Extension of the PMV model to non-air-conditioned buildings in warm climates |
| 4 | N. Djongyang, R. Tchinda, and D. Njomo [43] | 2010 | 354 | Thermal comfort: A review paper |
| 5 | A. Ehsan, A. Manuel, S. Carlos, H. A. Lu, and L. Glicksman [44] | 2014 | 258 | Multi-Objective Optimization for Building Retrofit: A Model Using Genetic Algorithm and Artificial Neural Network and an Application |
| 6 | R. Z. Freire, G. H. C. Oliveira, and N. Mendes [45] | 2008 | 240 | Predictive controllers for thermal comfort optimization and energy savings |
| 7 | W. Yu, B. Li, H. Jia, M. Zhang, and D. Wang [46] | 2015 | 218 | Application of multi-objective genetic algorithm to optimize energy efficiency and thermal comfort in building design |
| 8 | C. D. Korkas, S. Baldi, I. Michailidis, and E. B. Kosmatopoulos [47] | 2016 | 216 | Occupancy-based demand response and thermal comfort optimization in microgrids with renewable energy sources and energy storage |
| 9 | J. Kim, Y. Zhou, S. Schiavon, P. Raftery, and G. Brager [17] | 2018 | 194 | Personal comfort models: Predicting individuals’ thermal preference using occupant heating and cooling behavior and machine learning |
| 10 | C. E. Ochoa, M. B. C. Aries, E. J. van Loenen, and J. L. M. Hensen [48] | 2012 | 189 | Considerations on design optimization criteria for windows providing low energy consumption and high visual comfort |
| Building Type | Frequency of Case Studies |
|---|---|
| Educational | |
| School | 22 |
| University | 19 |
| Laboratory | 4 |
| Commercial | |
| Office | 37 |
| Commercial | 3 |
| Residential | |
| Residential | 35 |
| Historical | |
| Historical residential | 2 |
| Historical museum | 1 |
| Historic | 1 |
| Industrial | |
| Factories | 2 |
| Warehouses | 1 |
| Test room | 2 |
| Not mentioned | 25 |
| No. | Indicator | Description | Reference(s) |
|---|---|---|---|
| 1 | Predicted Mean Vote (PMV) | This index is calculated using the Fanger comfort equation for human body heat exchange. The PMV provides a mathematical model to predict the thermal sensation of a large group of people according to environmental and personal factors. | [7,9,10,24,42,43,44,49,69,145,153,154,158,167,171] |
| 2 | Adaptive Predicted Mean Vote (aPMV) | The PMV index is not applicable for hot and humid climates, so the aPMV is applied to establish occupants’ thermal comfort. This index applies the same optimum operative temperature as the analytical PMV approach, but instead of clothing insulation, metabolic rate, relative humidity, and air velocity factors, it uses the mean outdoor effective temperature as the only input. | [33,43,154,158] |
| 3 | Extended Predicted Mean Vote (ePMV) | Fanger and Toftum proposed the ePMV index by reducing the metabolic heat parameter. Whereas the PMV is used for air-conditioned buildings, the ePMV is only adequate for buildings without air conditioning or air ventilation. In addition, this index is suitable in hot and humid climates where the indoor air temperature increases significantly. | [9,154,158] |
| 4 | Empirical PMV (epPMV) | The original PMV model is not practical for real-time control systems or design purposes. These limitations led to the development of the PMV index. The epPMV is defined as a function that depends only on temperature and partial vapor pressure. | [9,55] |
| 5 | New Predicted Mean Vote (nPMV) | The nPMV was introduced by Humphreys and Nicol, and intends to equilibrate the difference between the predicted PMV results and the actual thermal sensation of occupants in air-conditioned buildings. | [33,158] |
| 6 | Total percentage of discomfort hours (TPMVD) | To formulate thermal comfort, the total percentage of cumulative time with discomfort over the whole year during the occupancy period is considered as the TPMVD. It is a two-tailed index that calculates thermal discomfort throughout the whole year. | [44] |
| 7 | Actual Mean Vote (AMV) | The AMV is a 7-point scale index that is defined as the occupants’ thermal sensation in a certain comfort space. This index is used in tropical regions and is determined based on the behavior and psychology of the occupants. Unlike the PMV, the AMV is the thermal comfort perceived by occupants during the voting. | [24,43,65,68,154,158] |
| 8 | Predicted Percentage Dissatisfied (PPD) | This index is applied to estimate the percentage of people who are dissatisfied with a certain thermal condition. The PPD is closely dependent to the PMV, and this dependency is introduced in the equation developed by Fanger. This index, like the PMV, can be applied to predict human thermal perception in buildings equipped with mechanical cooling systems. | [9,10,24,25,44,51,71,81,119,123,150,158] |
| 9 | The maximum hourly value of PPD () | The relates to the maximum hourly value of the PPD, which depends on Fanger’s theory, during the examined day. | [158] |
| 10 | PPD-weighted criterion (PPDwC) | This index is only suggested for the Fanger comfort model. The PPDwC assumes that time during which the PMV exceeds the comfort boundaries is weighted with a weighting factor, . | [145] |
| 11 | Transient Predicted Percentage Dissatisfied (TPPD) | The TPPD is a new index that is applicable for transient conditions. This index is presented based on replacing the Steady-State Energy Balance model with the Two-Node Energy Balance model in transient conditions. | [158,161] |
| 12 | Lowest Possible Percentage Dissatisfied (LPPD) | The LPPD is adequate for non-uniform thermal environments. This index is more practical for big rooms and its value should be less than 10% in occupied areas. If the LPPD value is more than 10%, two solutions are recommended (insulating the building, using an air distribution system, or both). | [158] |
| 13 | Thermal Discomfort time Percentage (TDP) | Based on the experimental outcomes, the values of the TSP (Thermal Satisfaction Percentage) index were different in non-uniform environments even under the same operative temperature (top). Moreover, the temperature difference between surface temperature and air temperature (△t) can, remarkably, have an effect on humans’ thermal satisfaction. Therefore, to remain in accordance with the terms of percentage dissatisfied in the ASHRAE standard, the TDP (Thermal Dissatisfied Percentage) was proposed to assess the two types of non-uniform indoor thermal environments. | [98] |
| 14 | Human Thermal Model (HTM) | The HTM can be used in both steady-state and transient conditions. This index is defined based on true anatomy and physiology of the human body. The HTM is calculated, like the PPD, by replacing the PMV with the overall thermal sensation. | [158] |
| 15 | Adaptive Model | The adaptive model has been developed based on collected data from environments where occupants have the possibility to interact with their environment. In this model, occupants can interact with the environment by opening and closing windows, turning fans on and off, etc. In the adaptive model, gender, age, and physical disabilities will affect thermal comfort. | [9,10,15,17,24,33,43,75,118,145,154,171] |
| No. | Usage | Index | Description |
|---|---|---|---|
| 1 | Music/Speech | Reverberation Time (T) | Perceived as the time for the sound to die away. This acoustic index is one of the more convenient and useful among the indices. |
| 2 | Early Decay Time (EDT) | Related to the initial and highest-level part of decaying energy. | |
| 3 | Clarity (C) | The ratio of early to late sound energy in a room impulse response. The variants of C50 and C80 are commonly used in room acoustics. | |
| 4 | Definition (D) | Can be expressed as a greater complexity of sounds in a given soundscape, and is mostly applied for speech cases. | |
| 5 | Center Time (TS) | Corresponds to the center of gravity of the squared impulse response. | |
| 6 | Speech | Speech Transmission Index (STI) | The most commonly used objective index in common spaces. Using the physical phenomenon of sound mixing, it provides an objective value for sound transmission. |
| 7 | Common Intelligibility Scale (CIS) | A method for ranking articulation based on a mathematical relation with the STI. | |
| 8 | Speech Intelligibility Index (SII) | Evaluated by speech perception tests given to a group of talkers and listeners. | |
| 9 | Articulation Index (AI) | Assesses speech intelligibility under a wide range of communication situations. | |
| 10 | Privacy Index (PI) | Related to the acoustic performance of everything in a space, and it determines the level of speech privacy between spaces. | |
| 11 | Percentage Articulation Loss of Consonants (ALC%) | It is based on the reception of words by listeners. |
| Organization | Value | Reference(s) |
|---|---|---|
| ASHRAE (American Society of Heating, Refrigerating and Air-Conditioning Engineers) | 600–700 ppm | [73] |
| EPA (Environmental Protection Agency) | 600–1000 ppm | [11,34] |
| OSHA (Occupational Safety and Health Administration) | 800 ppm | [175] |
| WHO (World Health Organization) | 1000 ppm | [176] |
| Classification | Aspect Type | Criteria Type | Number of Studies | Indicators | References |
|---|---|---|---|---|---|
| Assessment criteria and indicators | Thermal comfort | PMV-PPD model | 37 | PMV (17)- PPD (8)- PMV/PPD (6)-LPPD (1)-TPMVD (1)- PPDwC (1)- (1)- TDP (2) | [5,15,44,45,46,47,49,52,53,57,64,67,68,71,76,81,85,87,89,90,98,99,119,123,125,128,141,145,146,150,151,157,160,163,168,172,177] |
| Adaptive model | 22 | ePMV (10)- epPMV (5)- Not mentioned (7) | [17,54,56,59,66,69,82,111,112,118,121,122,124,126,131,136,138,140,142,144,148] | ||
| Visual comfort | Quantity of light | 33 | UDI (12)- DF (6)- DA (3)- sDA (5)- ASE (2)- IVD (1)- Illuminance (2)- Not mentioned (2) | [13,58,60,62,67,72,78,80,84,87,88,91,98,104,106,114,115,116,120,123,126,130,131,132,137,139,147,152,159,166,170,178,179,180] | |
| Glare | 15 | DGI (5)- DGP (7)- sDGP (1)- Luminance ratio (1)- Not mentioned (1) | [29,48,60,67,99,100,115,126,130,134,165,166,172,181,182] | ||
| Quality of light | 7 | CIE (5)- Not mentioned (2) | [29,101,103,108,109,131,172] | ||
| Distribution of light | 3 | Illuminance Uniformity (1)- Not mentioned (2) | [14,40,110] | ||
| Acoustic comfort | Sound pressure level, reverberation, acoustic quality of the rooms | 30 | Reverberation Time (T20, T30, T60) (9)- STI (5)- LeqA (3)- Clarity (C50, C80) (3)- STC (2)- EDT (2)- NSV (1)- Sound Pressure Level (SPL) (1)- Req (1)- ANLs (1)- Background Noise (1)- Definition (D50) (1) | [8,13,14,40,63,91,93,94,97,102,103,105,108,109,110,127,132,133,135,143,165,166,173] | |
| IAQ satisfaction | Stuffy air, cleanliness, odor | 22 | CO2 concentration level (11)- IIAQ (4)- ICONE air containment index (1)-TVOC level (1)- PM10 (1)- Not mentioned (5) | [6,8,76,79,81,83,103,107,108,109,110,111,112,113,128,132,143,145,149,159,160,165] |
| Classification | Aspect Type | Instruments Type | Number of Studies | Indicators | References |
|---|---|---|---|---|---|
| Data collection protocols | Thermal comfort | Wearable sensor or device | 7 | PCS chair (2)- Thermal manikin (2)- Virtual Reality (1)- Wristband (1)- Not mentioned (1) | [9,17,109,146,149,160,183] |
| Unwearable sensor | 29 | Sensors and data loggers (21)- Smart sensors and IOT (3)- BEMS sensors (3)- User Interface (UI) system (2) | [5,6,8,13,15,20,47,55,57,59,60,65,66,68,69,76,82,90,92,107,111,112,121,125,128,132,142,145,148] | ||
| Simulation tool | 42 | EnergyPlus (16)- Grasshopper Plug-in (5)-CFD (6)- TRNSYS (4)- BINAYATE (1)- ESP-r (1)- PowerDomus (2)- N3S (1)- Not mentioned (6) | [1,44,45,46,49,50,51,52,53,54,56,67,70,71,81,84,85,86,87,89,103,113,115,119,122,123,124,126,136,137,138,140,141,144,147,150,151,157,163,166,168,170] | ||
| Questionnaire and interview | 14 | Likert scale (8)- Rating scales (1)- Qualitative semi-structured (1)- Not mentioned (4) | [6,8,13,90,118,123,129,131,132,143,148,177,183,187] | ||
| Visual comfort | Sensing system | 16 | Multiple sensors (7)- User Interface (UI) system (3)- Smart sensors and IOT (2)- Occupancy sensor (2)- Sensors and data loggers (1)- Virtual Reality (1) | [13,20,29,58,60,77,78,80,88,92,106,109,132,134,152,178] | |
| Camera | 4 | Digital camera (1)- HDR image (3) | [29,110,126,181] | ||
| Simulation tool | 15 | DIVA (5)- Grasshopper Plug-in (4)-EVALGLARE (1)- Daysim (1)- EnergyPlus (1)- Ecotect (1)- Not mentioned (2) | [40,48,60,62,84,103,115,120,123,137,138,139,147,166,182] | ||
| Questionnaire and interview | 14 | Likert scale (9)- Online survey (2)- Not mentioned (3) | [8,13,29,58,60,77,101,123,130,131,132,143,180,181] | ||
| Acoustic comfort | Measurement instrument | 11 | Data loggers (5)- Brüel and Kjaer equipment (4)- Not mentioned (1) | [8,63,92,93,95,97,102,110,127,135,173] | |
| Simulation tools | 5 | Odeon (2)- Pachyderm (1)- Not mentioned (2) | [93,94,96,103,166] | ||
| Questionnaire & Interview | 5 | Likert scale (4)- Face-to-face semi-structured (1) | [13,102,132,133,143] | ||
| IAQ satisfaction | Sensor & measurement device | 13 | Sensors & data loggers (8)- Smart sensors & IOT (4)- Virtual Reality (1) | [8,76,107,109,110,111,112,128,132,142,145,149,160] | |
| Simulation tool | 4 | CFD (2)- Not mentioned (2) | [79,81,103,113] | ||
| Questionnaire | 3 | Likert scale (3) | [8,132,143] |
Disclaimer/Publisher’s Note: The statements, opinions and data contained in all publications are solely those of the individual author(s) and contributor(s) and not of MDPI and/or the editor(s). MDPI and/or the editor(s) disclaim responsibility for any injury to people or property resulting from any ideas, methods, instructions or products referred to in the content. |
© 2023 by the authors. Licensee MDPI, Basel, Switzerland. This article is an open access article distributed under the terms and conditions of the Creative Commons Attribution (CC BY) license (https://creativecommons.org/licenses/by/4.0/).
Share and Cite
Faraji, A.; Rashidi, M.; Rezaei, F.; Rahnamayiezekavat, P. A Meta-Synthesis Review of Occupant Comfort Assessment in Buildings (2002–2022). Sustainability 2023, 15, 4303. https://doi.org/10.3390/su15054303
Faraji A, Rashidi M, Rezaei F, Rahnamayiezekavat P. A Meta-Synthesis Review of Occupant Comfort Assessment in Buildings (2002–2022). Sustainability. 2023; 15(5):4303. https://doi.org/10.3390/su15054303
Chicago/Turabian StyleFaraji, Amir, Maria Rashidi, Fatemeh Rezaei, and Payam Rahnamayiezekavat. 2023. "A Meta-Synthesis Review of Occupant Comfort Assessment in Buildings (2002–2022)" Sustainability 15, no. 5: 4303. https://doi.org/10.3390/su15054303