Article

Heavy Metals and Their Ecological Risk Assessment in Surface Sediments of the Changjiang River Estuary and Contiguous East China Sea

Instrumental Analysis Center, Qingdao Agricultural University, Qingdao 266109, China
*
Author to whom correspondence should be addressed.
Sustainability 2023, 15(5), 4323; https://doi.org/10.3390/su15054323
Submission received: 20 December 2022 / Revised: 9 February 2023 / Accepted: 24 February 2023 / Published: 28 February 2023

Abstract

:
Marine heavy metal pollution has been an important global environmental issue in recent years. Concentrations of nine heavy metals (Pb, Cr, Ni, Cu, Zn, Co, Cd, As, and Hg) from marine sediments (2015, n = 38) in the Changjiang River Estuary and contiguous East China Sea were determined. The total contents of nine heavy metals ranged from 134.0 μg/g to 357.8 μg/g, with Cr as the most abundant component. Pearson correlation coefficient matrix of the heavy metals, granularity, and total organic carbon (TOC) in the samples were determined, and a preliminary ecological risk assessment was conducted in three aspects. According to the investigation, heavy metals were commonly found in samples and affected by terrestrial inputs to a large extent. Their concentration distributions were significantly affected by granularity as well as TOC. Preliminary ecological risk assessment showed that Cd and Hg were identified as the dominant heavy metals in the sediment samples from the study areas and showed a strong ecological risk. Overall, the situation of heavy metal pollution in the sediments of the Changjiang River Estuary and contiguous East China Sea was not optimistic in 2015, and it is worthy of further investigation into whether the environmental condition has improved with the strengthening of governmental environmental protection.

1. Introduction

With rapid economic development, ever-increasing port throughput, and the strengthening exploitation of ocean resources, marine pollution has considerably increased and is a cause for serious concern worldwide [1,2]. As an increasingly severe threat to the environment, heavy metals have been widely recognized for their diverse origins [3,4,5,6,7], persistence [8,9], toxicity [10,11], and bioaccumulation performance [12,13]. Worse, biomagnification of many heavy metals across the food chain has resulted in high concentrations and potential effects in the topmost food chain, particularly in humans [14,15]. Given that, heavy metal pollution has been increasingly studied worldwide [16,17,18].
Once heavy metals are discharged into nature, they can enter coasts and oceans by surface runoff [19,20]. Surface sediment, as an important material cycling node, is of vital importance for sorption and transport of heavy metals in water [21,22,23]. China has a long coastline, in which a great number of economically developed cities are located. Anthropogenic activities greatly impact these estuarine and coastal areas, which are a typical region of active land–sea interactions [24]. According to a survey, heavy metals that drain from rivers into the ocean reached about 24,000 tons, which included 16,243 tons of Zn (zinc), 3318 tons of Cu (copper), 3188 tons of As (arsenic), 858 tons of Pb (lead), 83 tons of Cd (cadmium), and 49 tons of Hg (mercury) in the year of 2015 [25]. Wang et al. analyzed the ecological risk assessment of heavy metals in sediments of China’s coastal waters and figured out that certain hotspots existed had relatively high ecological risks [26].
Heavy metals in sediments of the Changjiang River estuary area and contiguous East China Sea were selected in 2015 as research objects in the current study. Mainland area contiguous with the present study area ranks among best developed regions in China, into which rivers such as the Changjiang River, Qiantang, Oujiang, and Minjiang enter. Although the origins of these heavy metals vary, the release of the upper and local streams of these water systems serves as a major mass transport [27,28]. For instance, up to ~12,000 tons of heavy metals directly flowed from the Changjiang River to the East China Sea in 2015 alone [25]. Many related studies have been reported. The levels of heavy metals in sediments of the Changjiang River estuary area were analyzed by Han et al. [29] and He et al. [30]. Li et al. [31] researched heavy metals’ inter-annual variability and distribution in the Changjiang River estuary sediments. In addition, Chen et al. [32] investigated the pollution characteristics of heavy metals in sediments of the intertidal zone of typical bays in Zhejiang Province. All the investigates in this region substantiated that the concentrations in the inner estuary were overall higher than those in coastal and offshore areas. Thus, a comprehensive study of heavy metals in these areas is of great significance in environmental assessment.
The current study investigated the spatial distributions of nine heavy metal concentrations in sediments of the Changjiang River Estuary and contiguous East China Sea and focused on the relationships between heavy metal distributions and dynamic influence factors, including sediment physicochemical properties and environmental factors. Meanwhile, the primary environmental risk evaluation of typical heavy metals in the investigated regions was conducted. This study aims at a more comprehensive understanding of the overall heavy metal situation in sediments of the study region.

2. Materials and Methods

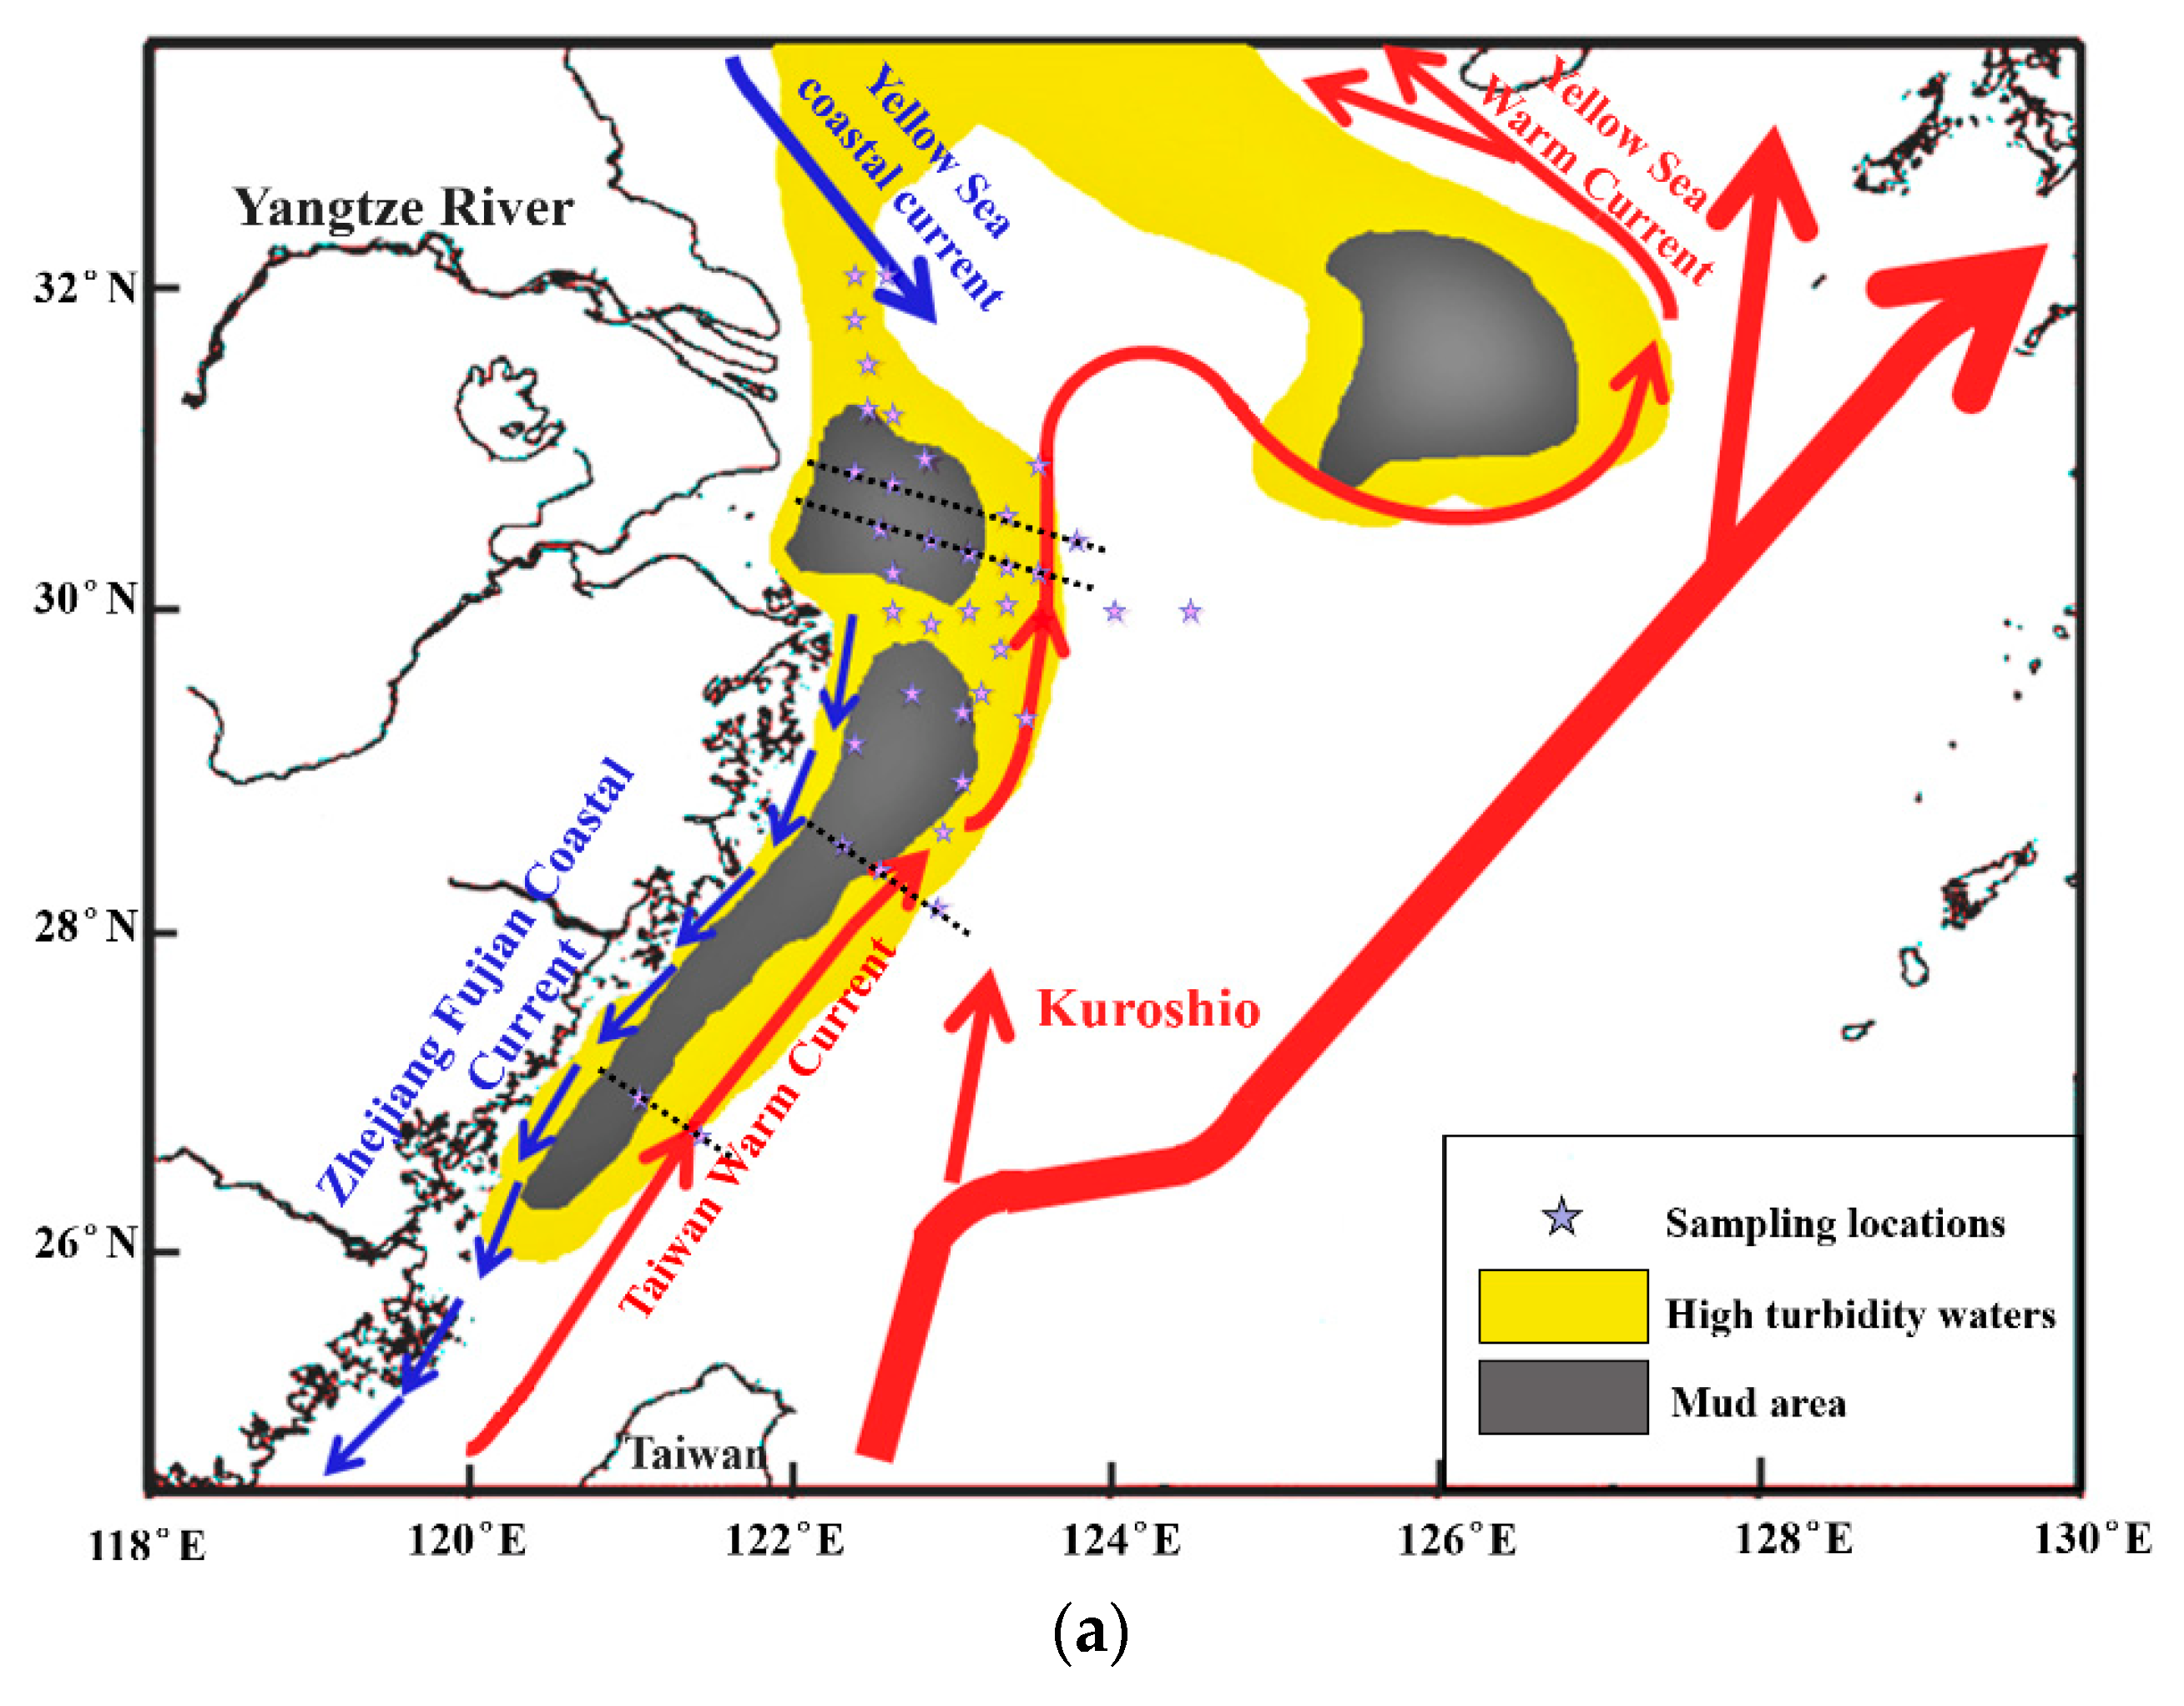
2.1. Study Area and Sampling

In this study, samples were taken from the Changjiang River Estuary (March 2015, n = 27) and contiguous zone of East China Sea (June 2015, n = 11), the locations of which were ascertained based on the Science Fund’s Shared Voyage (Figure 1). The top 2 cm of sediment samples were collected using a box-grab, stored in polyethylene sealed packets, and frozen at −20 °C before experimentation.

2.2. Chemical Analysis

For the analyses of heavy metal concentrations, sediment samples were air-dried in the laboratory, put through the homogenization process with an agate mortar, and sifted through an 80-mesh (180 µm) sieve to remove non-sediment impurities such as crustacean tissues. For the measurement of elements Pb, Cr (chromium), Ni (nickel), Cu, Zn, Co (cobalt), Cd, and Al (aluminum), about 0.3 g of powdered dry samples were thoroughly dissolved in sealed Teflon containers using concentrated HF–HNO3–HClO4 and analyzed by inductively coupled plasma optical emission spectrometer (ICP-OES, Perkin Elmer, Optma 8000DV). In addition, atomic fluorescence spectrometer (AFS, Beijing Jitian Instruments Co., Ltd., AFS-933, Beijing, China) was used to measure contents of As and Hg after the sediment samples were digested by an aqua regia–H2O solution system [33].
The crystallite dimension of sediment samples was measured by a laser particle analyzer (Bettersize Instruments Ltd., BT-9300ST). Organics and carbonates in fresh subsamples should be eliminated by immersion in H2O2 of 10% and HCl of 1 mol/L before particle size analysis. A total organic carbon (TOC) analyzer (Elementar, Liquid TOC II)) was utilized to determine the TOC of the surface sediment.

2.3. Quality Assurance and Quality Control

All laboratory vessels were pre-cleaned with nitric acid and ultra-pure water to avoid unintended contamination. Parallel specimens were collected about every 10 stations. Procedural blanks were run through the whole testing process. The limit of quantitation (LOQ) was determined using a signal-to-noise ratio (S/N) of 10:1 for the analytes. Method accuracy and precision were tested by the recovery (RE) of standard substances. Precision was likewise determined by standard deviation (SD) of ten replicate analyses of a single sample. The results were expressed by using 95% confidence interval determined using a two-tailed Student’s t distribution. The statistical software was Origin, and the graphs of heavy metals distributions were obtained by Surfer. Information on method performance is detailed in Table 1. The units (µg/g) for linear range and LOQ referred to the weight of sediment digested and dissolved, which can be obtained by entering the parameters in the instrument workstation, such as quantitative volume and sample quality.

2.4. Data Analysis

In this study, enrichment factor (EF), geoaccumulation index (Igeo), and pollution load index (PLI) were investigated to conduct the preliminary ecological risk assessment.
EF represents the enrichment level of heavy metal concentrations in sediments investigated in comparison to levels of background free of pollution; it can be calculated with equation:
EF = ( C / X ) s a m p l e ( C / X ) b a s e l i n e
where C represents the target heavy metal and X is the reference element mainly combined with silicate minerals [34]. Al was selected as the reference element to calculate EF in this paper. Based on the synthesized previous research on soil geochemical baselines of eastern coastal China [35], the background concentrations of target elements are 30.0, 24.3, 68.0, 0.090, 13.4, 72.4, 22.5, 9.29, and 0.040 μg/g for Ni, Pb, Zn, Cd, Co, Cr, Cu, As, and Hg, respectively [36]. When the EF value is less than 2, it indicates that given elements might entirely derive from the earth crust under nature weathering, suggesting no or minimal pollution. When the EF value is between 2 and 5, 5 and 20, and 20 and 40, it suggests moderate enrichment, significant enrichment, and very highly enriched, respectively. Meanwhile, when the EF value is over 40, it indicates extremely enriched and that a part or a majority of elements might originate from non-crustal materials, including pollution from human behaviors [37].
Igeo quantitatively evaluates the degree of heavy metal contamination while synthetically considering human activities and natural geological processes. The specific calculation formula is shown as follows:
I geo = log 2 ( C i k B i )
where Ci is the measured concentration of the examined metal i, Bi is the background concentration of metal i, and factor k (k = 1.5) is introduced as the possible variation in background values due to anthropogenic influences or lithologic variations [38]. On the basis of increasing values, Igeo assesses the degree of metal pollution in terms of seven classes to express different contamination levels ([39]; Table 2).
PLI quantitatively evaluates the degree of heavy metal contamination while synthetically considering pollution contributions of multiple elements. The specific calculation formula is showed as follows:
C F i = c i c o i ,   PLI = C F 1 × C F 2 × C F 3 × × C F n n
where ci and coi represent the measured concentration and background concentration of element i, CFi and PLI represent single contamination factor of element i and total pollution load of all elements. Based on increasing values, PLI assesses pollution level in terms of four classes to express different contamination levels [40].

3. Results and Discussion

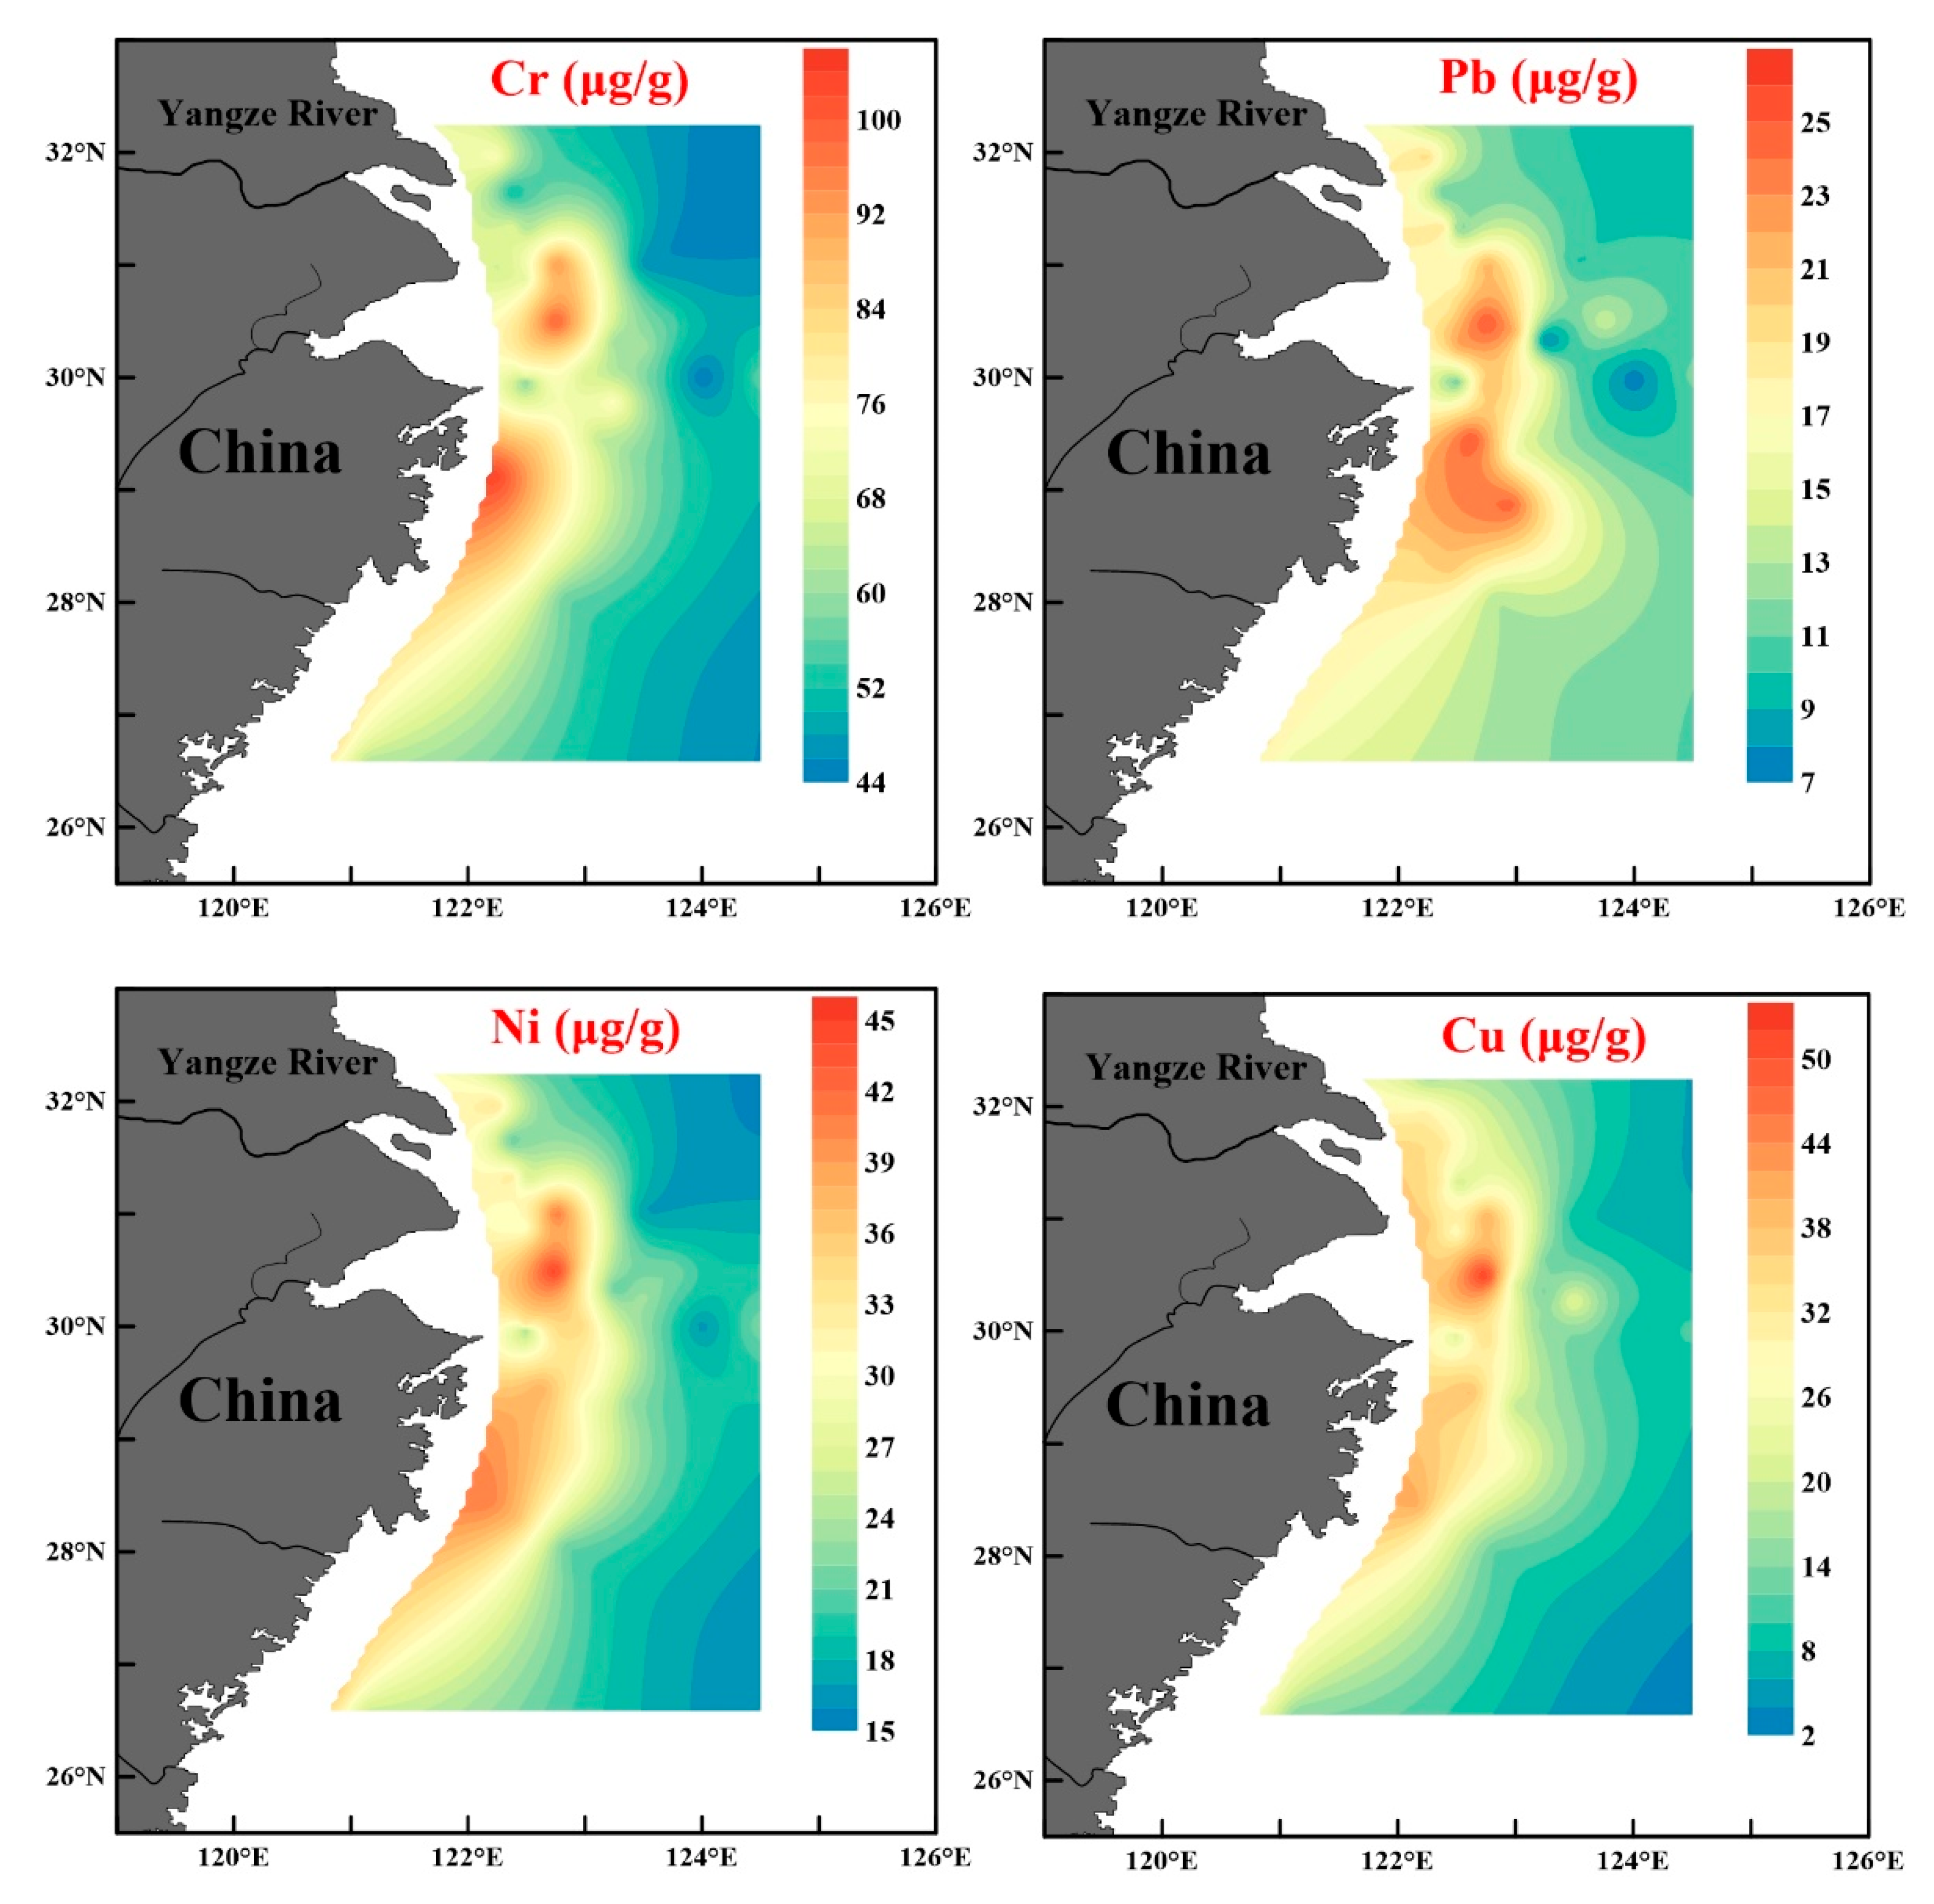
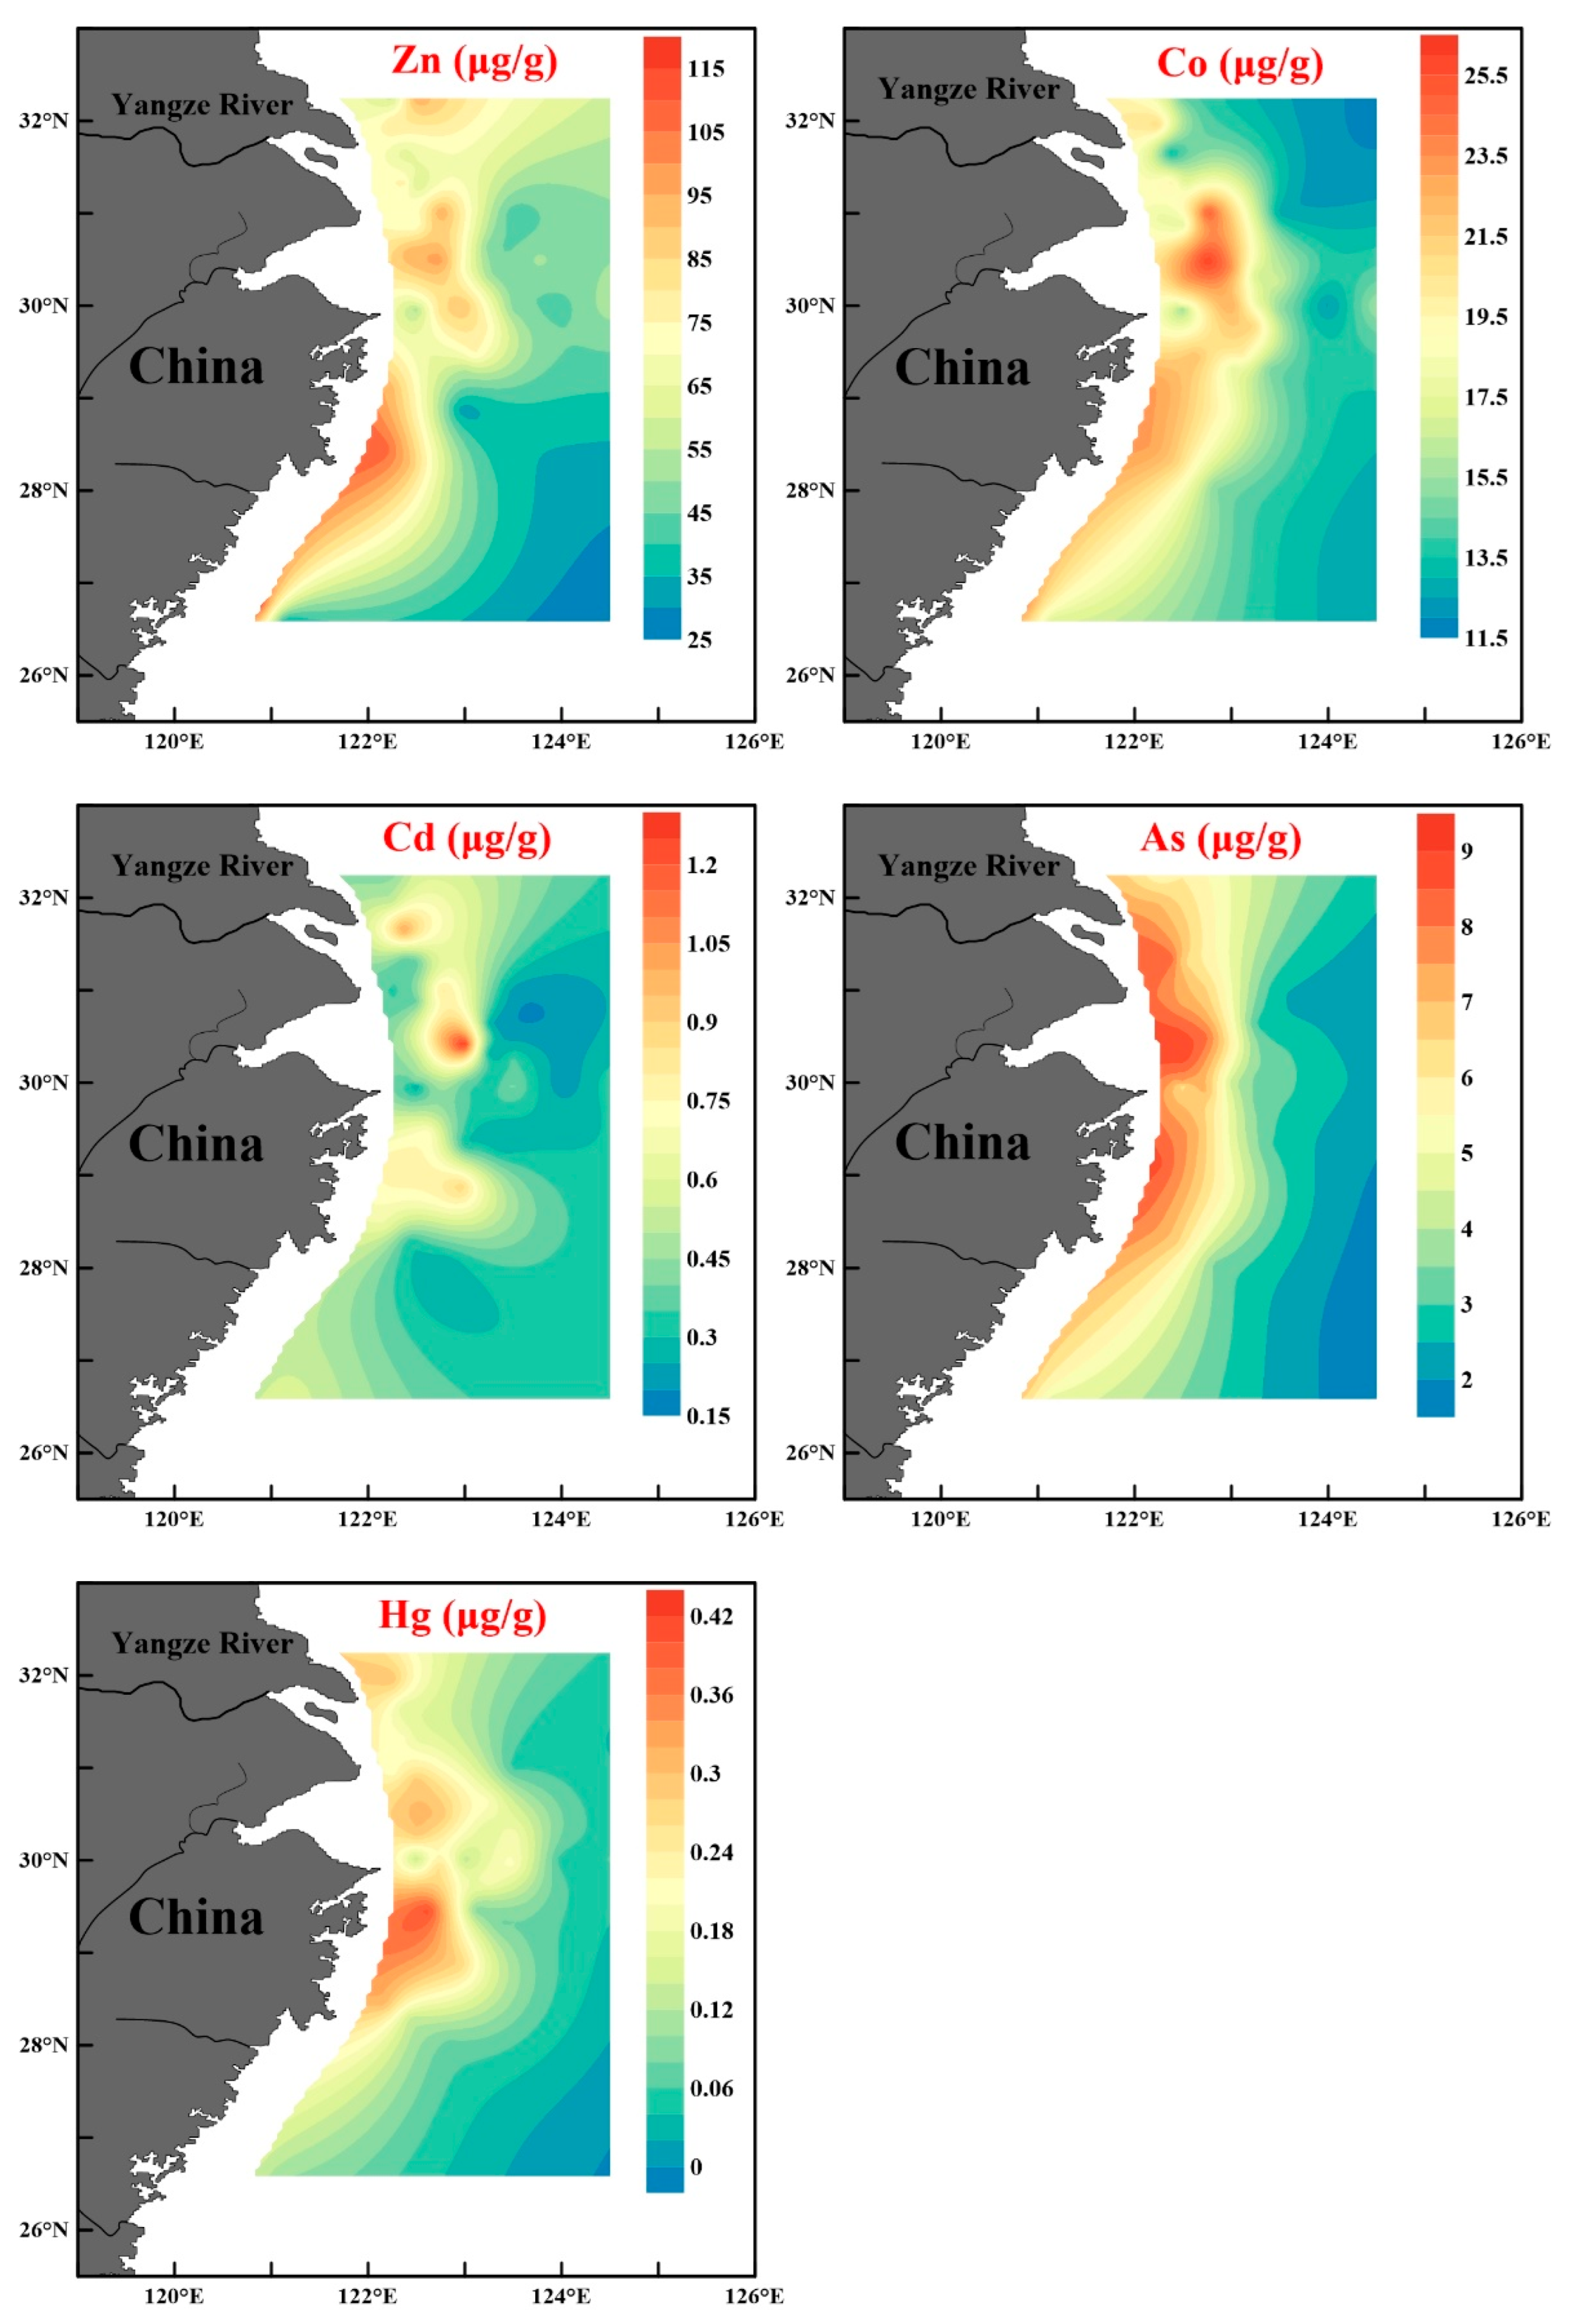
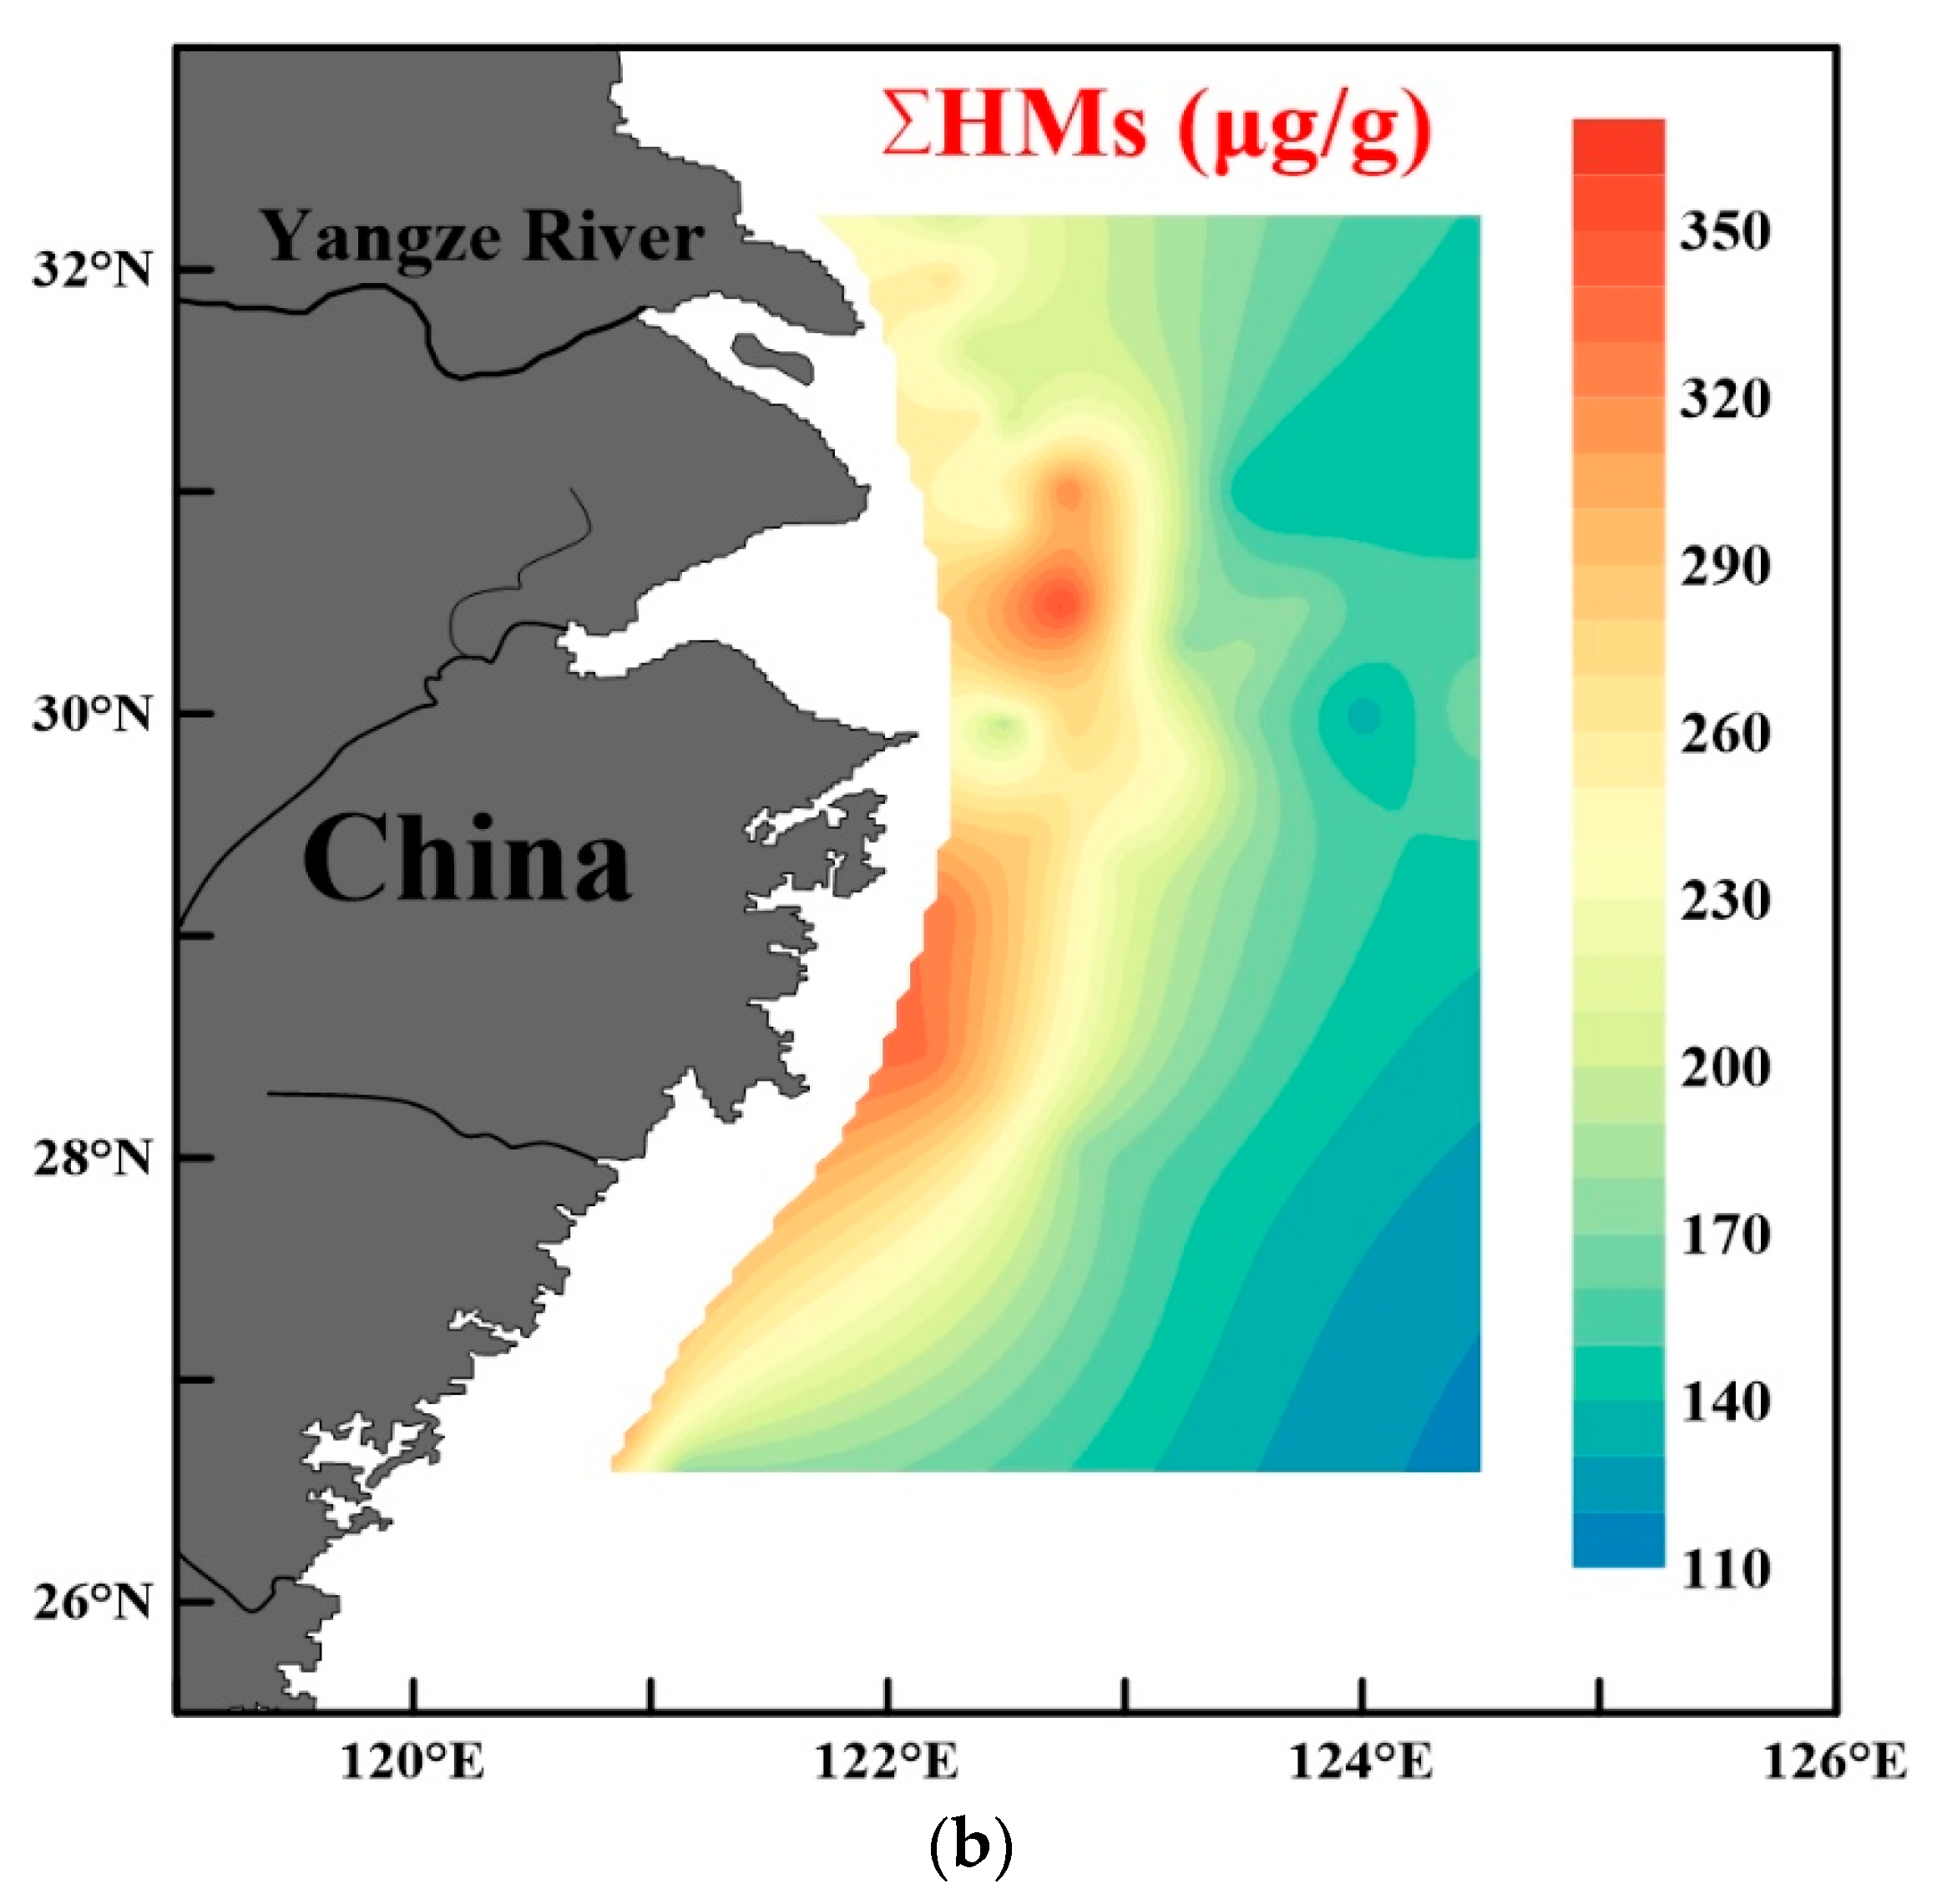
3.1. Spatial Distribution of Heavy Metals in Surface Sediments of the Changjiang River Estuary and Contiguous East China Sea

The concentrations of nine heavy metals are depicted in Figure 2 and summarized in Table 3, indicating that the average values (μg/g) follow the order of Cr (69.2) > Zn (68.7) > Ni (29.3) > Cu (24.5) > Co (18.8) > Pb (16.1) > As (5.6) > Cd (0.48) > Hg (0.19).
Ni, Co, Cr, Pb, and Cu exhibited a similar spatial distribution pattern throughout the studied areas, that is, high concentrations were generally observed in the outer Hangzhou Bay and Zhejiang coast with mud areas. This finding was aligned with the Pearson correlation coefficient matrix for the heavy metals (Table 4), that is, Ni, Co, Cr, Pb, and Cu yielded highly positive correlations among one another. This observation suggested that these heavy metals might come from identical sources or have comparable geochemical behavior during deposition, such as their enrichments in close-grained deposits. Several other heavy metals were also partly correlated, but each one had a different characteristic. Zn contents had relatively high values in the outer Hangzhou Bay, whereas much higher concentrations were mainly distributed in the coast adjacent to the borderline between Zhejiang and Fujian. The localities with high Hg contents mostly occurred in the Zhejiang coast. The high contents of As were mostly located in the coastal areas close to the mainland, especially in the estuary areas of the Changjiang and Qiantang rivers. Overall, of all the nine analyzed heavy metals, the concentration of Cd had the worst correlation with the other ones. This condition might be related to its strong migration ability and active chemical property or its different anthropogenic sources [41]. The high Cd concentrations were mainly observed in the Changjiang River estuary area, Hangzhou Bay, and the coastal waters of Zhejiang.
Generally, in our research, nine heavy metals in sediments of the Changjiang River Estuary showed higher level distribution compared with those in the sediments of the East China Sea, except for zinc. This is possible because of the high zinc concentrations distributed throughout the coast adjacent to the borderline between Zhejiang and Fujian, rather than the Changjiang River Estuary. Meanwhile, compared with other research on Changjiang River Estuary [29,30,31], the whole concentration of heavy metals was similar to the research in this study. We also obtained a slightly higher level of Hg, probably due to an optimized test condition [33]. The tendency of heavy metals’ spatial distribution was obviously decreased with increasing distance from the mainland, which also demonstrated the influence of human activities on the distribution of heavy metals in this area. The anthropogenic factor brought by the highly developed economy of the mainland area contiguous with the present study area might be an underlying cause of the high levels of heavy metals.
Table 5 shows the comparisons of heavy metal levels of samples in our study and other coastline regions in the world. Most heavy metal concentrations in surface sediments of the Changjiang River Estuary and contiguous zone of East China Sea were lower than those in other Chinese coastal areas [42,43,44]. The study of Wang et al. also proved that the ecological risks of China’s coastal waters decreased in the following order: Bohai Sea > Yellow Sea > South China Sea > East China Sea [26]. However, this finding could not prove that the contamination of heavy metals in this region was optimistic, which was illustrated by the comparison of heavy metals in the sediments of China’s coastal areas with other coastal zones in the world. Most of these other countries’ studied zones are not adjacent to the open ocean, but are situated on the shores of inland seas or gulfs. Even so, China’s coastal areas as a whole retained a relatively high pollution level of heavy metals [20,45,46,47]. Different hydrological environments and sampling times, of course, may also contribute to different pollution levels in the studies. Meanwhile, particle size must also be taken into account in the objective comparisons of heavy metal levels in the sediments of the study area and other coastal zones in the world. Moreover, the literature results have validated the influence of human activities or anthropogenic sources on heavy metal pollution in offshore sediments.

3.2. Dynamic Influence Factors of Heavy Metal Distribution

Our data showed that with the increase of distance from mainland, the concentrations of heavy metals in samples were gradually reduced, and the concentration in the coastal sites was relatively high. This pattern suggested that heavy metals in this area were partly affected by terrigenous input. In addition, the coefficient of variation (CVs) representing the discreteness of heavy metal distribution can also reflect the non-natural influence, which is manifested as the higher the CV value, the stronger the interference. According to Wilding’s standard, CVs are classified into three grades as follows: CV < 15% is slight variation; 15–36% is moderate variation; CV > 36% is high variation [48]. Investigation showed that none of the nine target heavy metals’ CV values were classified to slight variation, but the numbers of CV values classified to moderate variation and high variation were five and four, respectively. Thus, the influence of unnatural factors such as land-based pollutants caused by highly industrialized coastal regions and the inputs of great rivers should not be neglected.
The factors that influence the dispersion patterns of heavy metals are complex [6,49,50]; they can be heavy metal terrigenous sources, sediment characteristics, hydrologic factors, and geochemical processes. Herein, we analyzed a number of these influence factors by applying statistical analyses. The compositions of granularity and TOC fraction are listed in Table 3. Pearson correlation coefficient matrix for heavy metal concentrations, granularity, and TOC in the samples is depicted in Table 4.
Median granularity ranged between 0.7 and 189 μm, with a mean of 31.6 μm. In general, fine-grained samples were dispersed in the interior estuary and nearshore area. Sediments gradually became coarse in the nearshore to the seaward direction, and the mean sediment granularity increased. Table 4 indicates that there is an inverse correlation between heavy metal concentrations and grain sizes generally. The data are in line with previous studies showing that the smaller the particle size of sediments is, the greater the adsorption capacity of the heavy metals will be [51]. In view of the strong influence of grain sizes on the distribution of heavy metals, sediment sieving sizes were investigated in the comparisons of heavy metal levels in this study and previous research (Table 5). The levels of most heavy metals in sediments of study area increased with decreasing particle sizes at the similar sampling time. This condition may be explained by the fact that the smaller the particle size of sediments is, the larger the specific surface area will be, and the greater the amount of equilibrium adsorption of heavy metals will be. Furthermore, a previous study confirmed that many heavy metals in in fine sediments had the potential to be mobilized and metabolized in addition to their potential to be enriched [52]. Overall, the sorption of the heavy metals by the sediments greatly depends on the particle size distribution.
The TOC contents of sediments were 0.36–0.88%, with a mean value of 0.73%. The high contents of TOC were generally located in the estuary areas close to the mainland. Studies have found that the distribution of heavy metals has a correlation with TOC contents to some extent [53,54]. A phenomenon in which heavy metal concentration level had a positive correlation with TOC contents (Table 4) was revealed through correlation analyses. This observation might be related to the great affinity and numerous polar functional groups of organic matter, which can be more combined with heavy metals. In addition, the organic fraction of the sediments with high levels of nutrients can be metabolized, which supports microbial activity as well as bottom feeding organisms [52]. However, none of the correlations between metals and TOC, with the exception of Hg, were significant. Thus, compared with sediment grain sizes, TOC contents exerted a weaker influence on heavy metal distribution patterns.
Studies also have focused on the influence of the hydrological environment on heavy metals’ distribution [27,30]. The shelf circulation in the East China Sea is constituted by the Zhejiang Fujian Coastal Current (ZFCC), Taiwan Warm Current (TWC), and Kuroshio Current (Figure 3, [55]). Among them, the ZFCC is a part of the Chinese longshore current system, which originates from the Changjiang River estuary and Hangzhou Bay area, with many other river systems flowing into it along the way. It generally flows from north to south along the coast, though its path varies with the seasons of the year [56]. According to the existing hydrologic analysis and short-term measurement, the TWC persistently flows to the north for the whole year. Meanwhile, a warm and salty Kuroshio Current flows northward along the East China Sea shelf break. This formed the mud areas in the Yangtze Estuary and Fujian and Zhejiang coasts. High TOC values in sediments were observed mainly at the center of the mud areas, which were negatively correlated with particle sizes. This is contradictory to the distribution regularities in the field of soil science, that show that high TOC contents may result in larger particle size. This unique hydrological phenomenon affected the distribution of heavy metals in this area. The findings visually suggested a high consistency between argillaceous zone and high heavy metal concentration zone (Figure 3). All the five sampling positions (A14, D7, D10, A8, and A26) with a total concentration more than 300 μg/g are located in the mud areas. Furthermore, the heavy metal contents in sediments of four sampling cross-sections across the muddy areas also confirm this phenomenon, that the pollution level of heavy metals in muddy areas is higher than that in non-muddy areas.
Furthermore, the spread of terrigenous pollutants into the ocean is slowed down by the TWC, which flows from south to north throughout the year. This may be a cause of large deposits of heavy metals in the coastal areas of Zhejiang and Fujian (Figure 2 and Figure 3). This resistance gradually increases from north to south, resulting in a relatively stable sedimentary environment in the south East China Sea. Heavy metal contents at two sets of sites located on either side of the TWC (D7, DH8, D9 and D10, D11) support preliminary yet convincing evidence of this phenomenon. To illustrate this point, the heavy metal at site D7 amounted to 330.5 μg/g and dropped to 280.4 μg/g at site D8, which is a reasonable result based on the influence of mud area distribution. Yet, the heavy metal content dropped by a factor of x2 at site D9 (177.8 μg/g), which was much greater compared with another site pair with similar geographical distance. Hence, the heavy metal transport and occurrence in sediments could be partly controlled by the circulation of oceanic currents in this area.
In addition to seasonal changes in ocean currents, climatic factors such as the amount of rainfall and seasonal changes in industrial activity should also be responsible for the differences in the diffusion trends of heavy metal concentrations. In southern China, the wet season is usually from April to September, which may lead to a higher amount of terrigenous pollutants from land. This tendency was roughly consistent with the data from the East China Sea Branch of the State Oceanic Administration [25]. The sampling time for the East Sea was June, during the wet season. Oppositely, the sampling time in the Changjiang Estuary was March, during the dry season. That may be the reason that the heavy metal concentrations in some sites in the East China Sea are higher than those in the Changjiang River estuary. Furthermore, considering the complexity of sources of heavy metals in sediments, heavy metals that were transported via the particulate phase into the sea and deposited with the particles also should be further investigated.

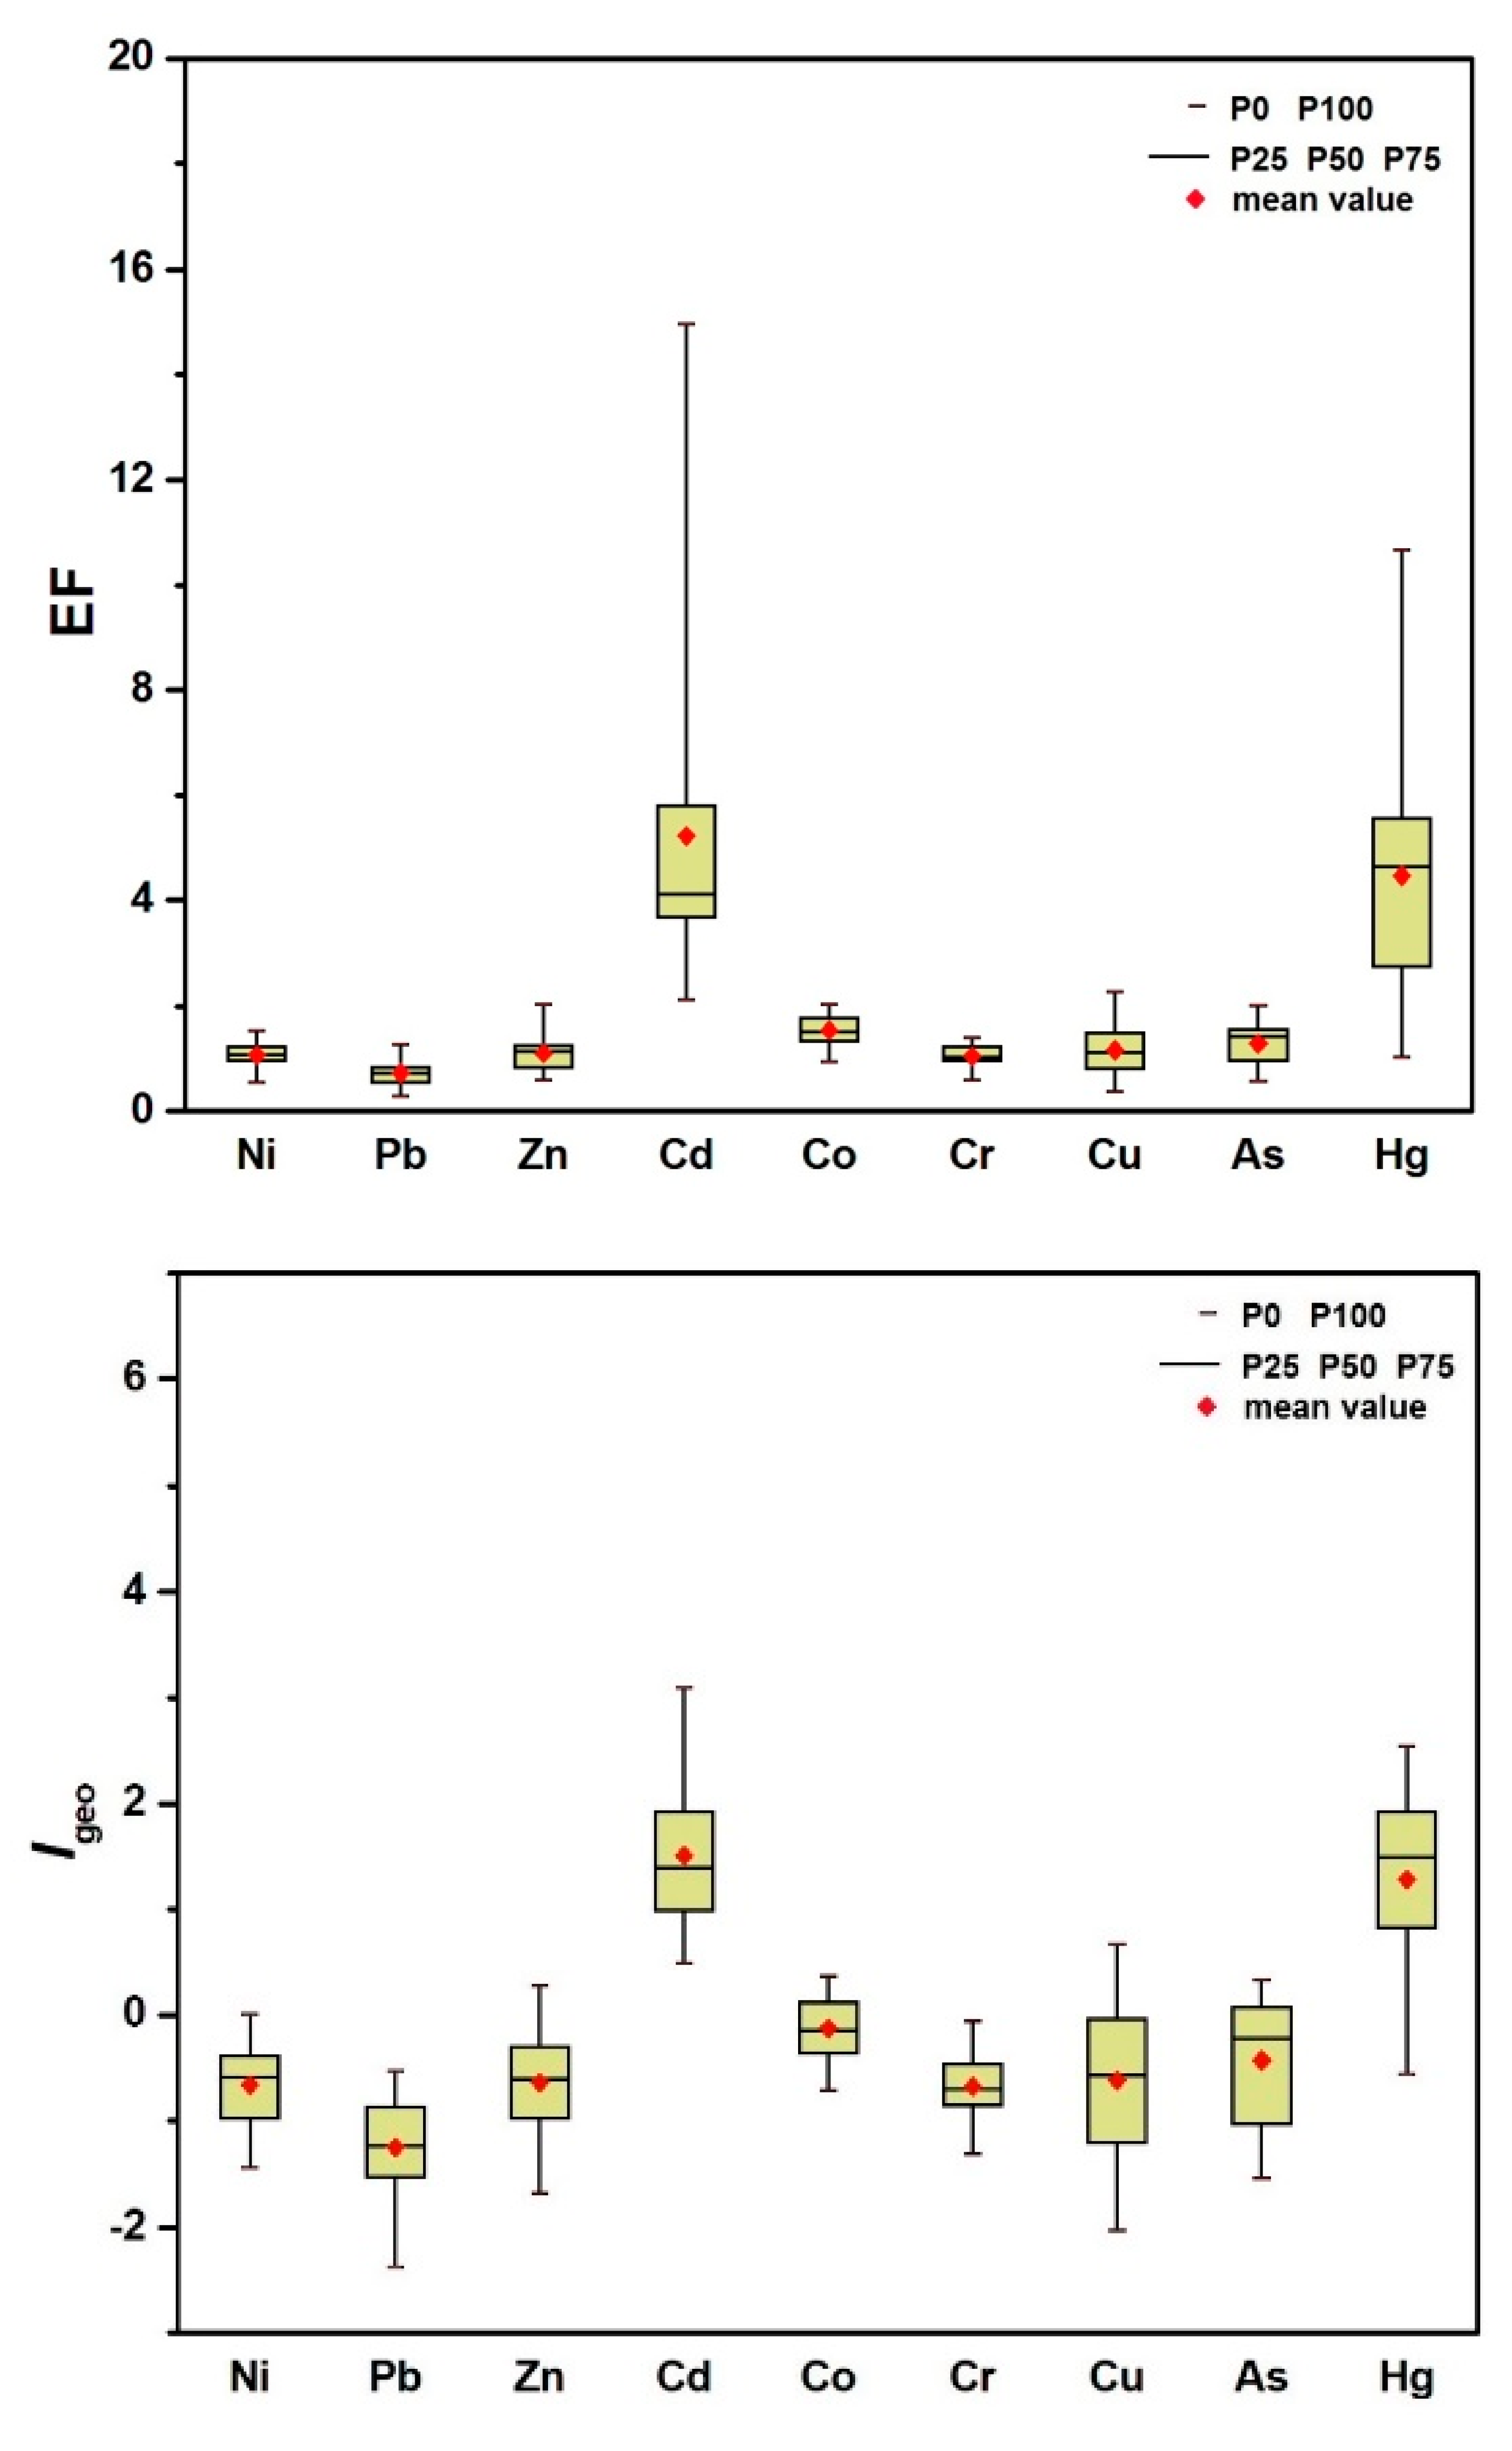
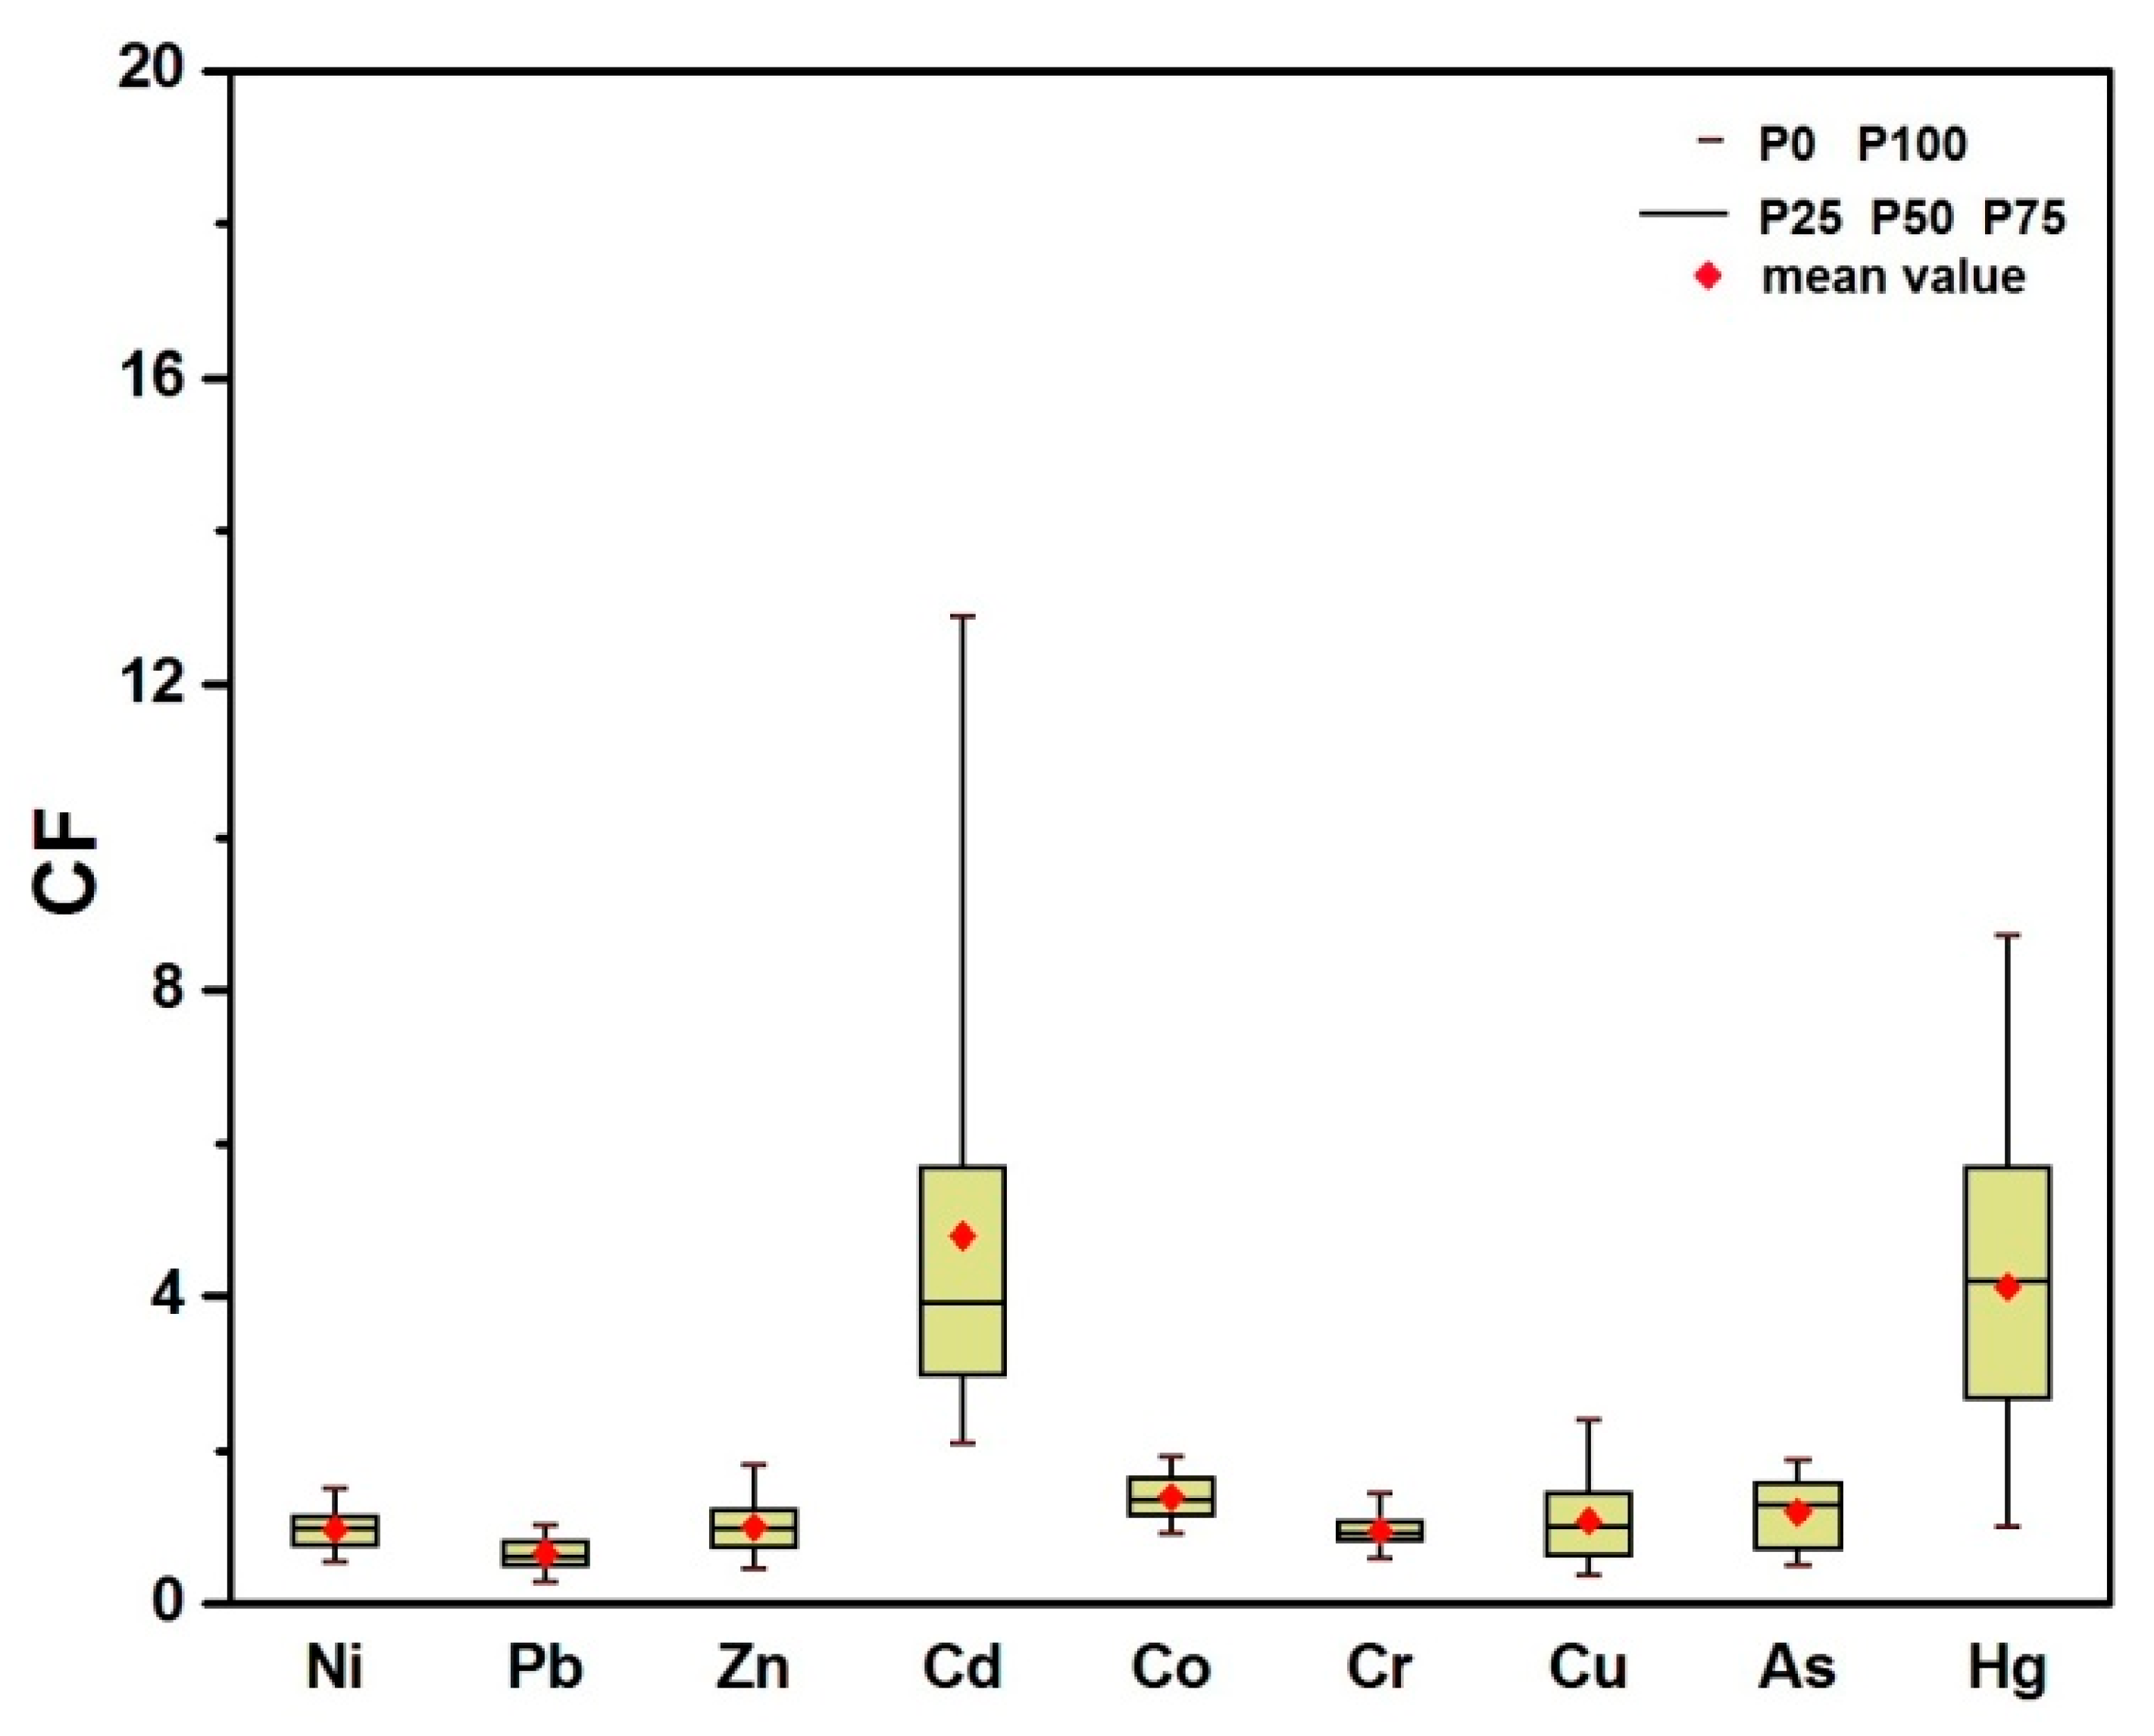
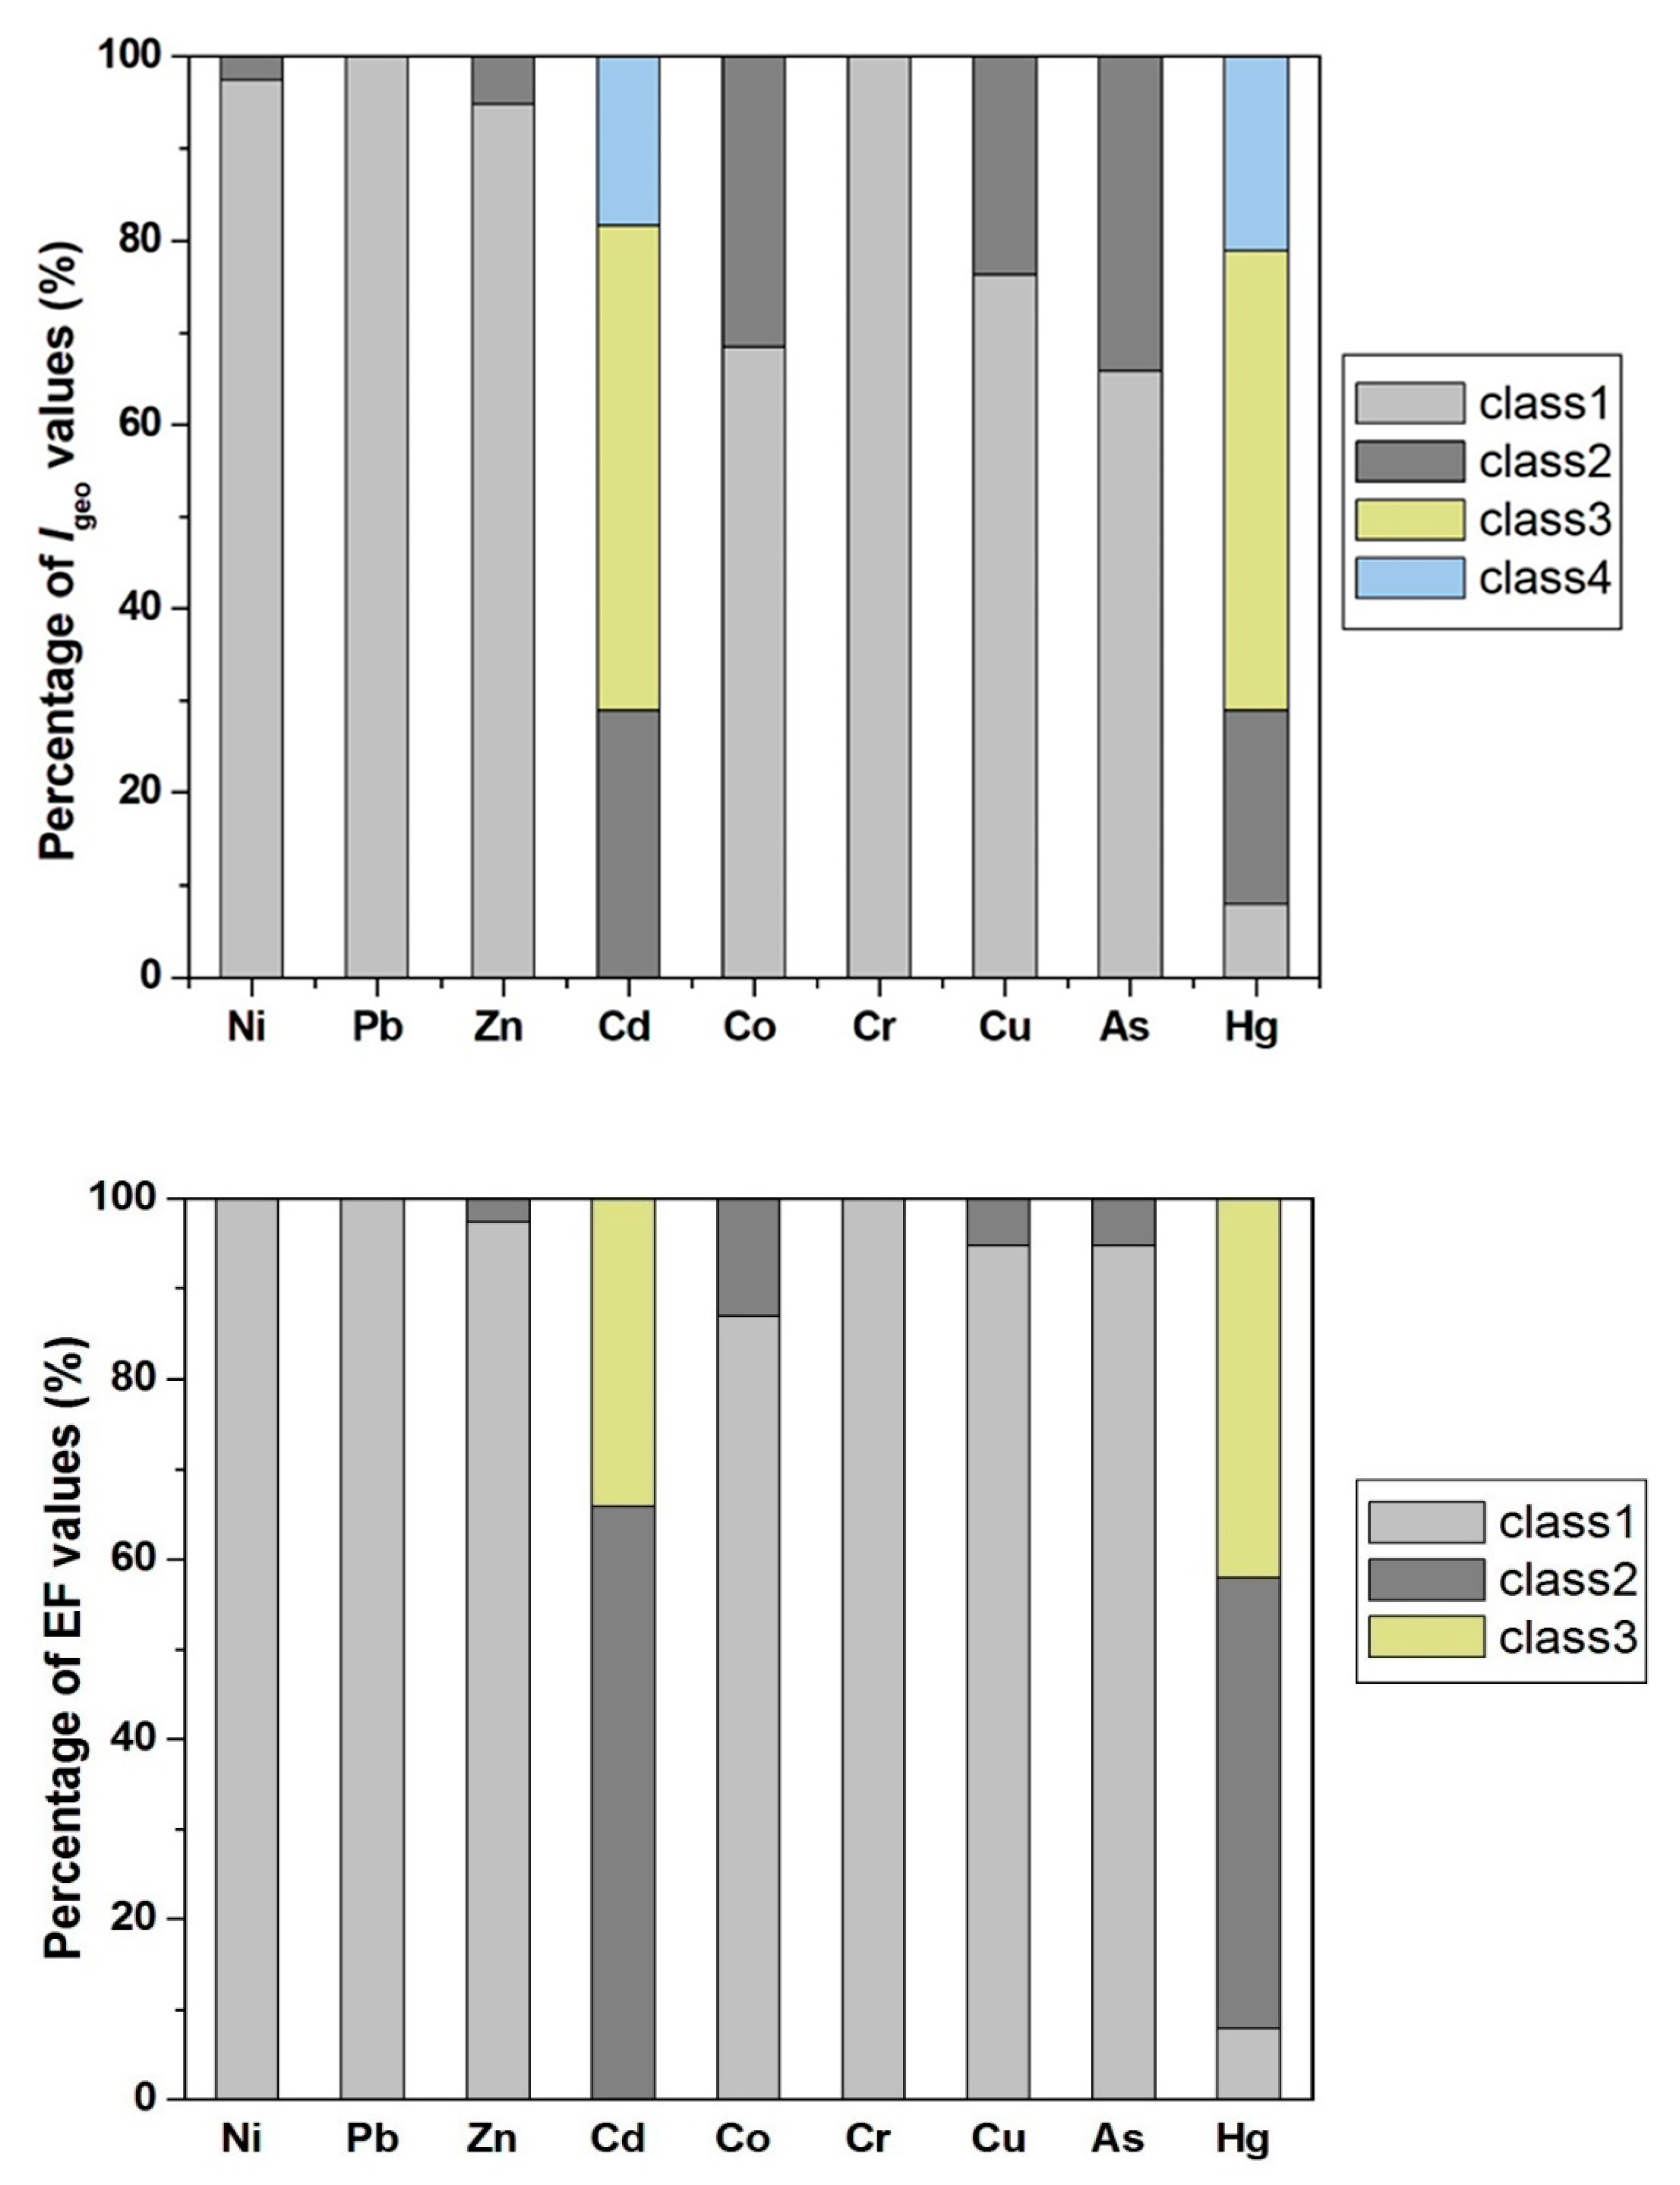
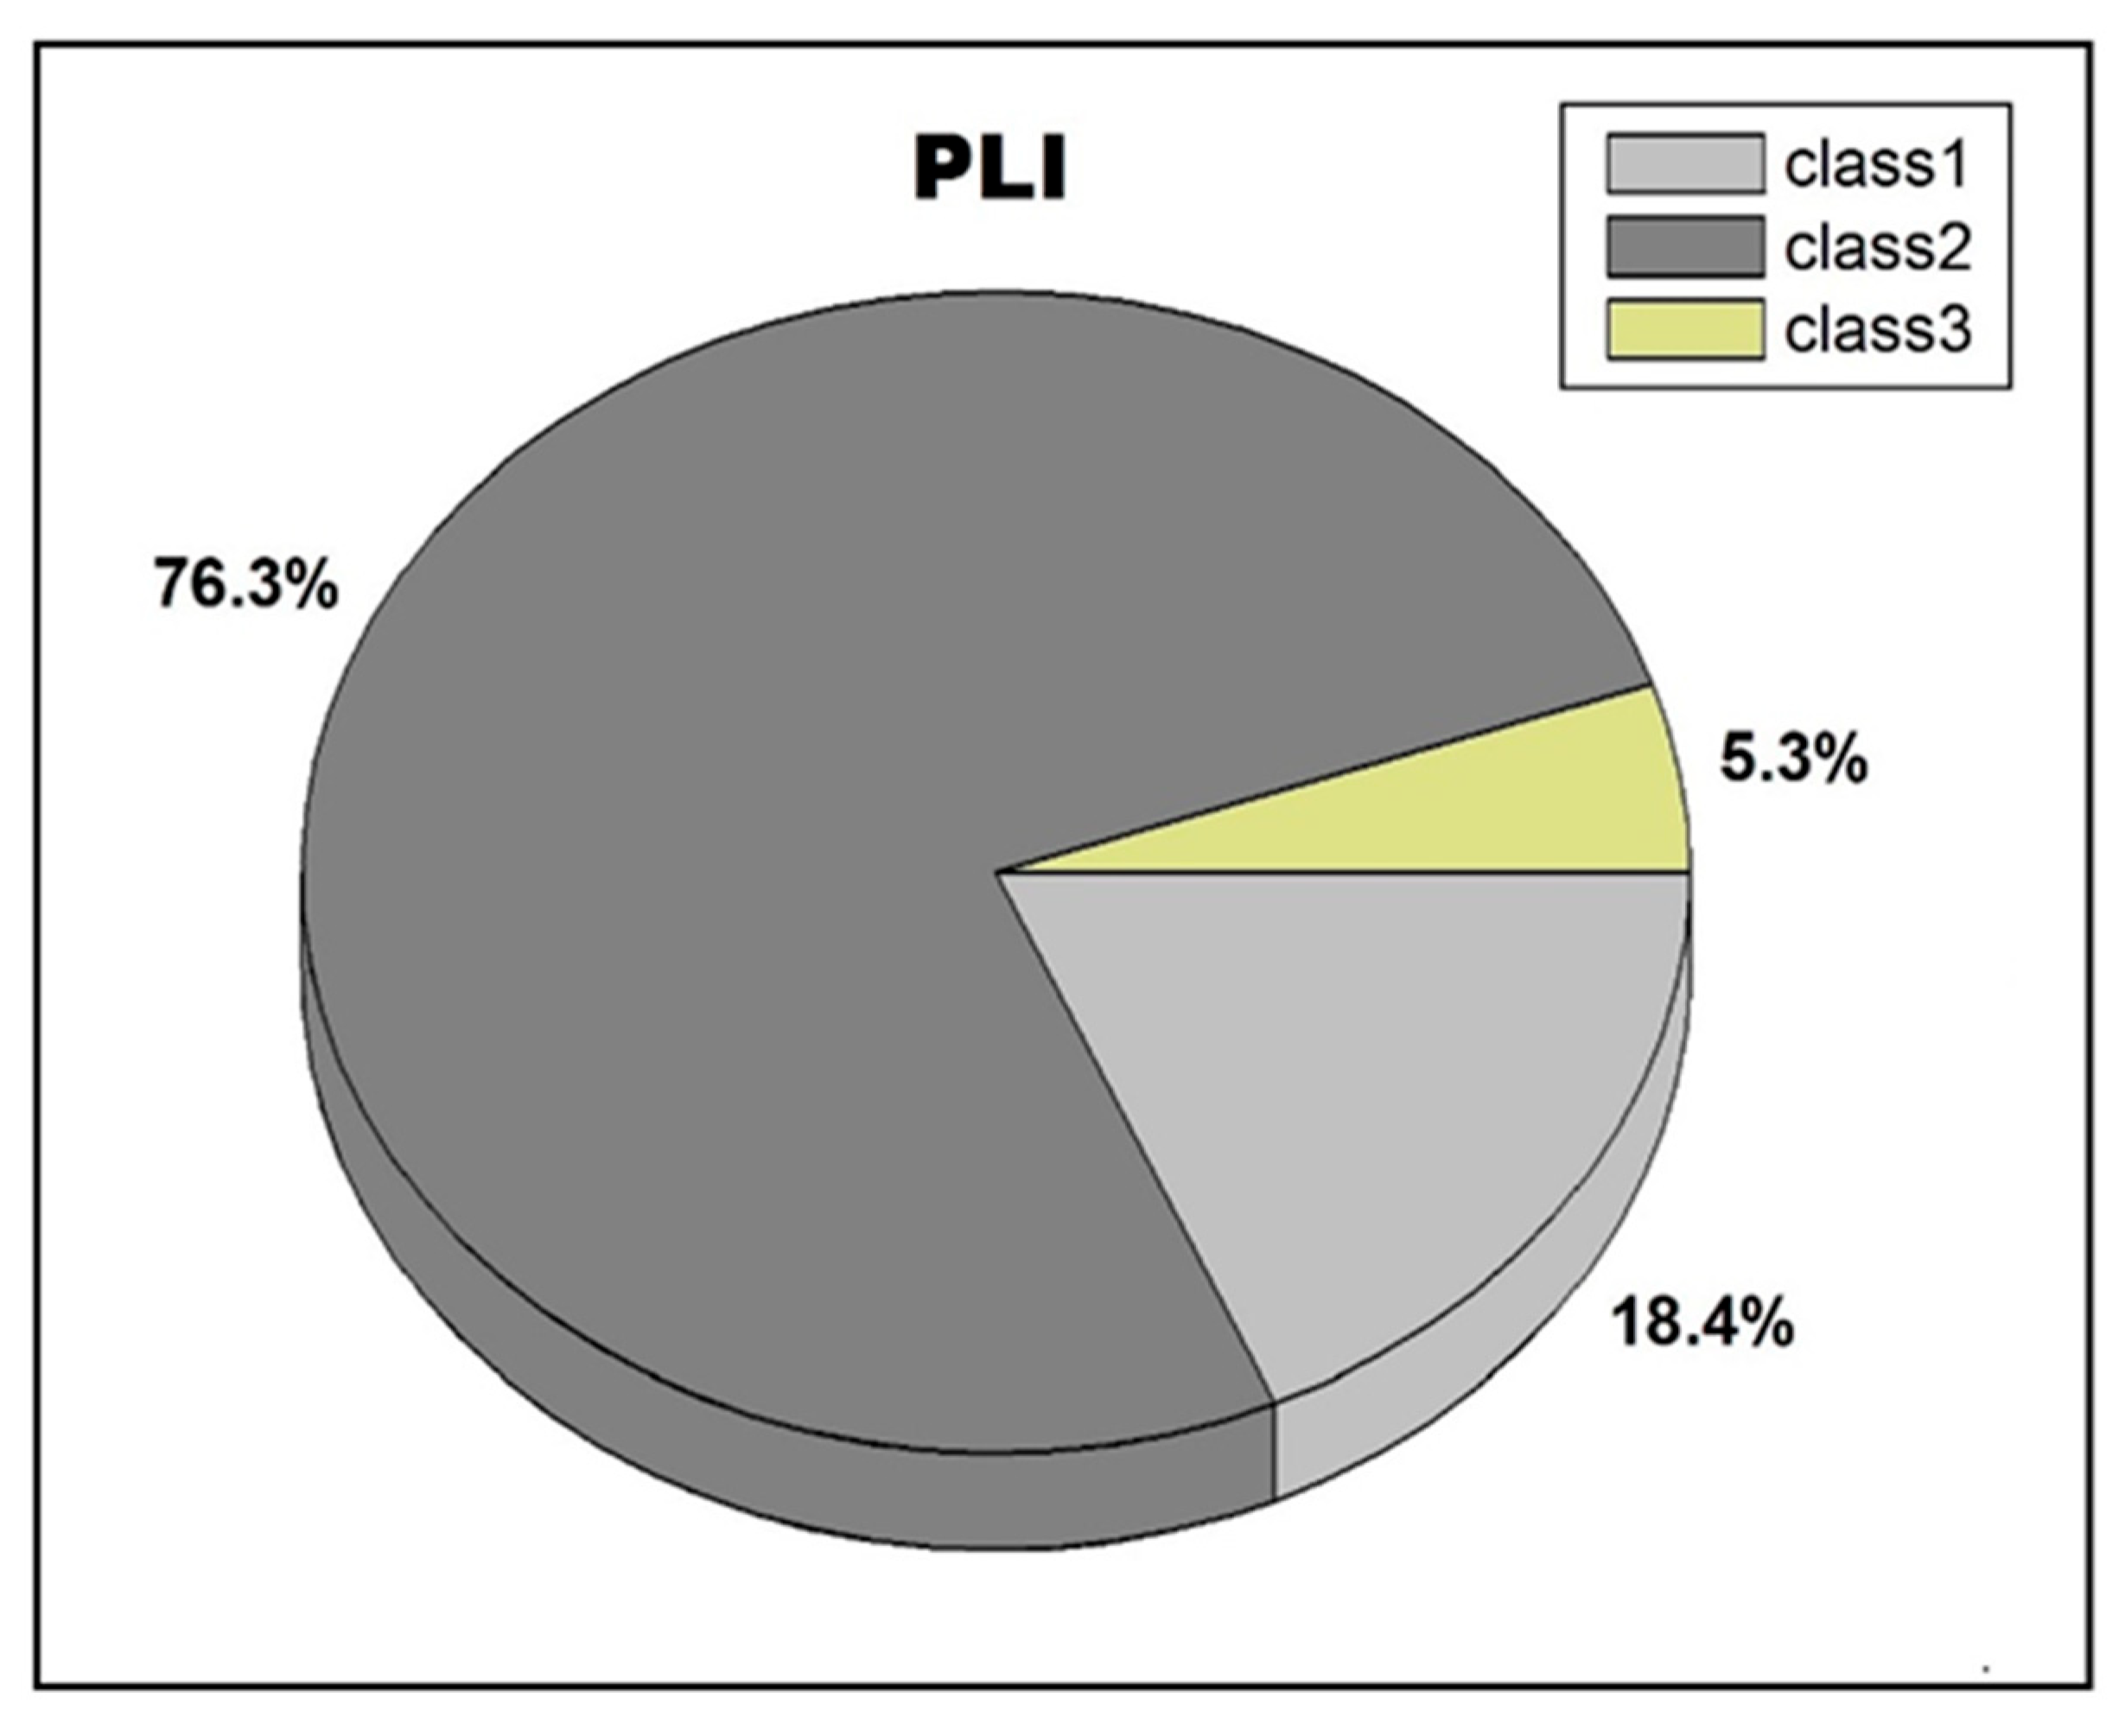
3.3. Preliminary Ecological Risk Assessment

Heavy metals in sediments that change affected by the external environment may cause secondary pollution by being released back into the water. An appropriate evaluation method must thus be selected to accurately reflect the pollutant situation via the ecological risk assessment of heavy metals. This work discusses preliminary ecological risk evaluation of the heavy metals in the exterior sediments of the Changjiang River estuary area and contiguous East China Sea in three aspects (EF, PLI, and RI), as shown in Table 6 and Figure 4, Figure 5 and Figure 6.
EF is a broadly applied proxy to estimate anomalies in geochemistry and impact of human behaviors on sediment chemistry. The EF values in the investigated samples ranged between 0.10 and 14.98. The descending order of average EF values was Cd (5.23) > Hg (4.46) > Co (1.54) > As (1.29) > Cu (1.17) > Zn (1.10) > Ni (1.07) > Cr (1.05) > Pb (0.73). All the EF values of Pb, Cr, and Ni belonged to class 1, demonstrating no enrichment of these elements in the investigated samples. Analogously, an overwhelming majority of As, Cu, and Zn EF values also belonged to class 1, and barely a few values belonged to class 2. Statistical analysis showed that average EF values of As, Cu, Zn, Ni, Cr, and Pb were between 0.73 and 1.29, which again suggested the primary natural sources of these metals. Co had a slightly higher average EF value, close to 1.5, and 13% of the values belonged to class 2. However, the worst negative conclusion was on Cd and Hg. None of the Cd EF values and only 8% of Hg EF values belonged to class 1. Meanwhile, average EF values of Cd (5.23) and Hg (4.46) were significantly above the line of minimal enrichment level, showing obvious contaminant enrichments. Cd and Hg in the investigated regions might be mostly derived from non-crustal sources and are indicative of contamination in the Changjiang River catchment and study area.
Igeo is another frequently used proxy to evaluate heavy metal enrichment in sediments. The Igeo values of these heavy metals in the investigated samples ranged from −2.37 to 3.10. The mean values of Igeo mostly varied less than 0 and showed the decreasing order of Cd (1.51) > Hg (1.28) > Co (−0.13) > As (−0.43) > Cu (−0.62) > Zn (−0.64) > Ni (−0.66) > Cr (−0.68) > Pb (−1.25). According to the classification of Igeo (Müller, 1979), Pb and Cr in all the investigated samples were unpolluted in terms of the relatively low Igeo values (<0). The Igeo values of Ni, Zn, and Cu in a vast majority of the samples were also less than 0. On the contrary, approximately one third of the samples with higher Igeo values (>0) for As and Co suggested weak enrichments in some stations of the study area. The worst case of heavy metal pollution still included Cd and Hg with great Igeo values; the Igeo values of Cd were greater than 0 in all the studied samples. From Müller’s classification, Cd and Hg in the sediments of the study area indicated slight to moderate pollution degrees.
PLI is another frequently used proxy to assess heavy metal enrichment in sediments, which ranged from 0.67 to 2.26 in the investigated samples. PLI is calculated from the CFof every single element. The results of the CF were close to EF on account of the similar definition. The mean values of CF showed the decreasing order of Cd (4.79) > Hg (4.12) > Co (1.40) > As (1.20) > Cu (1.09) > Zn (1.01) > Ni (0.98) > Cr (0.96) > Pb (0.66). The data again revealed that the enrichment of Cd and Hg in the study areas was significant. Based on the contribution of these two elements, the analytical results of PLI showed a certain degree of heavy metal pollution. According to Tomlinson’s classification (Tomlinson et al., 1980), PLIs of class 1, class 2, and class 3 were 18.4%, 76.3%, and 5.3%, respectively. Overall, the vast majority of sites indicated a slight to moderate pollution level.
Overall, similar results of the EF and Igeo indices suggested that Pb, Cr, Ni, Zn, and Cu in the studied samples did not exhibit obvious enrichments. Although As and Co showed slight enrichments in some cases, Eri values investigations indicated that they and the above five types of heavy metals all showed slight potential ecological risk. However, all the three evaluation methods indicated that Hg and Cd strongly polluted the sediments of the Changjiang River Estuary and contiguous East China Sea. The dominant position of heavy metals in samples with the source of weathering detritus in the downstream and estuary of the Changjiang River can also be revealed from previous investigations [57], but anthropogenic activities have caused enrichments of Cd, Hg, and other heavy metals in recent years [29,30].
In addition, the Chinese government has made notable efforts on environmental protection [58,59]. The Chinese Government Information Publicity showed that pollutant emissions are effectively controlled with the active economy. By taking the mass control of contaminants carried by the Changjiang River as an example, the pollutions of heavy metals have been significantly reduced in recent years. Additionally, the amount of the most threatened Cd and Hg released directly into the East China Sea showed a wavelike decrease change during 2016–2020 according to the filing (Figure 7) [60,61,62,63,64]. Li et al. also confirmed that the quality of the ecological environment of this sea area demonstrated a trend of fluctuating improvement over time, especially after 2015, after a long period of macro-control against environmental protection [31]. The sampling time of this study was in 2015; at this time node, the heavy metal pollution situation in the sediments of the Changjiang River Estuary and contiguous East China Sea is alarming.

4. Conclusions

Nine target heavy metals (Pb, Cr, Ni, Cu, Zn, Co, Cd, As, and Hg) in surface sediment samples obtained in 2015 from the Changjiang River Estuary and contiguous zone of the East China Sea were quantitatively analyzed. The average contents (μg/g) of nine heavy metals ranked with the descending order of Cr (69.2) > Zn (68.7) > Ni (29.3) > Cu (24.5) > Co (18.8) > Pb (16.1) > As (5.6) > Cd (0.48) > Hg (0.19). Most of the heavy metals exhibited a similar spatial distribution pattern throughout the studied area and were strongly influenced by terrigenous input. Meanwhile, both granularity and TOC had a certain influence on heavy metal concentrations; particularly, the former had a stronger correlation than the latter. Cd and Hg were considered to be main heavy metals in samples collected in the study area and showed a strong ecological risk. Cd was the most substantial element enriched in the sediments, with an average EF value of 5.04. Hg showed the greatest ecological risk and contribution to RI value due to its high toxic response factor, with Eri values ranging from 40.82 to 349.15, with a mean of 164.89. Whether the macro-control policy has a positive effect on the distribution of heavy metals and their mixture toxicity assessment in the sediments of this area should be further investigated.

Author Contributions

Q.W. conceptualization, methodology, validation, writing—review and editing; X.H. formal analysis, supervision, funding acquisition; Y.Z. methodology, validation. All authors have read and agreed to the published version of the manuscript.

Funding

This research was financed by the Experimental Technology Research Project of Qingdao Agricultural University (SYJS202115) and Qingdao Agricultural University Doctoral Start-Up Fund (Nos. 663/1119027).

Institutional Review Board Statement

Not applicable.

Informed Consent Statement

Not applicable.

Data Availability Statement

Not applicable.

Acknowledgments

We are very grateful to Guipeng Yang from Ocean University of China for his technical assistance. Thanks for the supporting of sample testing by Instrumental Analysis Center of Qingdao Agricultural University. Meanwhile, we are grateful to the captain and crew of the R/V “Run Jiang No.1” for help and cooperation during the cruise.

Conflicts of Interest

The authors declare no conflict of interest.

References

  1. Ali, L.; Rashid, A.; Khattak, A.S.; Gao, X.; Jehan, S.; Javed, A. Geochemical modeling, fate distribution, and risk exposure of potentially toxic metals in the surface sediment of the Shyok suture zone, northern Pakistan. Int. J. Sediment Res. 2021, 36, 656–667. [Google Scholar] [CrossRef]
  2. Siddiqui, A.S.; Saher, N.U. Distribution profile of heavy metals and associated contamination trend with the sedimentary environment of Pakistan coast bordering the Northern Arabian Sea. Environ. Sci. Pollut. R 2021, 28, 30121–30138. [Google Scholar] [CrossRef] [PubMed]
  3. Duodu, G.O.; Goonetilleke, A.; Ayoko, G.A. Potential bioavailability assessment, source apportionment and ecological risk of heavy metals in the sediment of Brisbane River estuary, Australia. Mar. Pollut. Bull. 2017, 117, 523–531. [Google Scholar] [CrossRef]
  4. Luo, L.; Mei, K.; Qu, L.; Zhang, C.; Chen, H.; Wang, S.; Di, D.; Huang, H.; Wang, Z.; Xia, F.; et al. Assessment of the geographical detector method for investigating heavy metal source apportionment in an urban watershed of eastern China. Sci. Total Environ. 2019, 653, 714–722. [Google Scholar] [CrossRef] [Green Version]
  5. Mojtaba, M.; Alireza, H.; Aziz, B.; Fatemeh, M.; Hossein, E.; Mohammad, R.J.; Sara, J. Separation of Ni (II) from industrial wastewater by kombucha scoby as a colony consisted from bacteria and yeast: Kinetic and equilibrium studies. Acta Chim. Slov. 2019, 66, 865–873. [Google Scholar] [CrossRef]
  6. Kostka, A.; Leśniak, A. Spatial and geochemical aspects of heavy metal distribution in lacustrine sediments, using the example of Lake Wigry (Poland). Chemosphere 2020, 240, 124879. [Google Scholar] [CrossRef]
  7. Ouma, K.O.; Shane, A.; Syampungani, S. Aquatic ecological risk of heavy-metal pollution associated with degraded mining landscapes of the Southern Africa River Basins: A review. Minerals 2022, 12, 225. [Google Scholar] [CrossRef]
  8. Mousavi, S.M.; Hashemi, S.A.; Amani, A.M.; Esmaeili, H.; Ghasemi, Y.; Babapoor, A.; Mojoudi, F.; Arjomand, O. Pb (II) removal from synthetic wastewater using kombucha scoby and graphene oxide/Fe3O4. Phys. Chem. Res. 2018, 6, 759–771. [Google Scholar]
  9. Beau, F.; Bustamante, P.; Michaud, B.; Brischoux, F. Environmental causes and reproductive correlates of mercury contamination in European pond turtles (Emys orbicularis). Environ. Res. 2019, 172, 338–344. [Google Scholar] [CrossRef]
  10. Szymkowicz, D.B.; Sims, K.C.; Schwendinger, K.L.; Tatnall, C.M.; Powell, R.R.; Bruce, T.F.; Bridges, W.C.; Bain, L.J. Exposure to arsenic during embryogenesis impairs olfactory sensory neuron differentiation and function into adulthood. Toxicology 2019, 420, 73–84. [Google Scholar] [CrossRef]
  11. Kladsomboon, S.; Jaiyen, C.; Choprathumma, C.; Tusai, T.; Apilux, A. Heavy metals contamination in soil, surface water, crops, and resident blood in Uthai District, Phra Nakhon Si Ayutthaya, Thailand. Environ. Geochem. Health 2020, 42, 545–561. [Google Scholar] [CrossRef]
  12. Liu, S.; Zhao, H.; Lehmler, H.; Cai, X.; Chen, J. Antibiotic Pollution in Marine Food Webs in Laizhou Bay, North China: Trophodynamics and Human Exposure Implication. Environ. Sci. Technol. 2017, 51, 2392–2400. [Google Scholar] [CrossRef] [Green Version]
  13. Govaerts, A.; Verhaert, V.; Covaci, A.; Jaspers, V.L.B.; Berg, O.K.; Addo-Bediako, A.; Jooste, A.; Bervoets, L. Distribution and bioaccumulation of POPs and mercury in the Ga-Selati River (South Africa) and the rivers Gudbrandsdalslågen and Rena (Norway). Environ. Int. 2018, 212, 1319–1330. [Google Scholar] [CrossRef]
  14. Atique Ullah, A.K.M.; Akter, M.; Musarrat, M.; Quraishi, S.B. Evaluation of Possible Human Health Risk of Heavy Metals from the Consumption of Two Marine Fish Species Tenualosa ilisha and Dorosoma cepedianum. Biol. Trace Elem. Res. 2019, 191, 485–494. [Google Scholar] [CrossRef]
  15. Khanam, R.; Kumar, A.; Nayak, A.K.; Shahid, M.; Tripathi, R.; Vijayakumar, S.; Bhaduri, D.; Kumar, U.; Mohanty, S.; Panneerselvam, P.; et al. Metal(loid)s (As, Hg, Se, Pb and Cd) in paddy soil: Bioavailability and potential risk to human health. Sci. Total Environ. 2020, 699, 134330. [Google Scholar] [CrossRef]
  16. Aziz, B.; Reza, H.; Seyyed, M.J.; Meysam, P. Biosensor design for detection of mercury in contaminated soil using rhamnolipid biosurfactant and luminescent bacteria. J. Chem. 2020, 30, 120959. [Google Scholar] [CrossRef]
  17. Dong, Y.; Li, Y.; Kong, F.; Zhang, J.; Xi, M. Source, structural characteristics and ecological indication of dissolved organic matter extracted from sediments in the primary tributaries of the Dagu River. Ecol. Indic. 2020, 109, 105776. [Google Scholar] [CrossRef]
  18. Dvorak, P.; Roy, K.; Andreji, J.; Liskova, Z.D.; Mraz, J. Vulnerability assessment of wild fish population to heavy metals in military training area: Synthesis of a framework with example from Czech Republic. Ecol. Indic. 2020, 110, 105920. [Google Scholar] [CrossRef]
  19. Jafarabadi, A.R.; Bakhtiyari, A.R.; Toosi, A.S.; Jadot, C. Spatial distribution, ecological and health risk assessment of heavy metals in marine surface sediments and coastal seawaters of fringing coral reefs of the Persian Gulf, Iran. Chemosphere 2017, 185, 1090–1111. [Google Scholar] [CrossRef]
  20. Kahal, A.Y.; El-Sorogy, A.S.; Alfaifi, H.J.; Almadani, S.; Ghrefat, H.A. Spatial distribution and ecological risk assessment of the coastal surface sediments from the Red Sea, northwest Saudi Arabia. Mar. Pollut. Bull. 2018, 137, 198–208. [Google Scholar] [CrossRef]
  21. Bloom, N.S.; Gill, G.A.; Cappellino, S.; Dobbs, C.; Mcshea, L.; Driscoll, C.; Mason, R.; Rudd, J. Speciation and Cycling of Mercury in Lavaca Bay, Texas, sediments. Environ. Sci. Technol. 1999, 33, 7–13. [Google Scholar] [CrossRef]
  22. Ullrich, S.M.; Tanton, T.W.; Abdrashitova, S.A. Mercury in the Aquatic Environment: A Review of Factors Affecting Methylation. Crit. Rev. Environ. Sci. Technol. 2001, 31, 241–293. [Google Scholar] [CrossRef]
  23. Fitzgerald, W.F.; Lamborg, C.H.; Hammerschmidt, C.R. Marine Biogeochemical Cycling of Mercury. Chem. Rev. 2007, 107, 641–662. [Google Scholar] [CrossRef] [PubMed]
  24. Guo, Y.; Yang, S. Heavy metal enrichments in the Changjiang (Changjiang River River) catchment and on the inner shelf of the East China Sea over the last 150 years. Sci. Total Environ. 2016, 543, 105–115. [Google Scholar] [CrossRef]
  25. State Oceanic Administration, China. China Marine Environmental Quality Bulletin; State Oceanic Administration, China: Beijing, China, 2015.
  26. Wang, M.; Tong, Y.; Chen, C.; Liu, X.; Lu, Y.; Zhang, W.; He, W.; Wang, X.; Zhao, S.; Lin, Y. Ecological risk assessment to marine organisms induced by heavy metals in China’s coastal waters. Mar. Pollut. Bull. 2018, 126, 349–356. [Google Scholar] [CrossRef]
  27. Wang, C.; Zou, X.; Feng, Z.; Hao, Z.; Gao, J. Distribution and transport of heavy metals in estuarine-inner shelf regions of the East China Sea. Sci. Total Environ. 2018, 644, 298–305. [Google Scholar] [CrossRef]
  28. Liu, M.; Chen, J.; Sun, X.; Hu, Z.; Fan, D. Accumulation and transformation of heavy metals in surface sediments from the Changjiang River estuary to the East China Sea shelf. Environ. Pollut. 2019, 245, 111–121. [Google Scholar] [CrossRef]
  29. Han, D.; Cheng, J.; Hu, X.; Jiang, Z.; Mo, L.; Xu, H.; Ma, Y.; Chen, X.; Wang, H. Spatial distribution, risk assessment and source identification of heavy metals in sediments of the Changjiang River River Estuary, China. Mar. Pollut. Bull. 2017, 115, 141–148. [Google Scholar] [CrossRef]
  30. He, Z.; Li, F.; Dominech, S.; Wen, X.; Yang, S. Heavy metals of surface sediments in the Changjiang (Changjiang River River) Estuary: Distribution, speciation and environmental risks. J. Geochem. Explor. 2019, 198, 18–28. [Google Scholar] [CrossRef]
  31. Li, L.; Jiang, M.; Liu, Y.; Shen, X. Heavy metals inter-annual variability and distribution in the Yangtze River estuary sediment, China. Mar. Pollut. Bull. 2019, 141, 514–520. [Google Scholar] [CrossRef]
  32. Chen, S.; Song, L.; Liu, X.; Liu, R.; Yu, J. Evaluation on sediment pollution and potential ecological risks in the intertidal zone of typical bays in Zhejiang Province. China Environ. Sci. 2020, 40, 1771–1781. (In Chinese) [Google Scholar]
  33. Zhang, Y.; Wang, Q. Determination and ecological risk assessment of arsenic and mercury in sediments from the Changjiang River Estuary and adjacent East China Sea. Acta Oceanol. Sin. 2021, 40, 32–38. [Google Scholar] [CrossRef]
  34. Lee, D.S.; Garland, J.A.; Fox, A.A. Atmospheric concentrations of trace elements in urban areas of the United Kingdom. Atmos. Environ. 1994, 28, 2691–2713. [Google Scholar] [CrossRef]
  35. Yan, M.; Gu, T.; Chi, Q.; Wang, C. Abundance of chemical elements of soils in China and supergenesis geochenmistry characteristics. Geophys. Geochem. Explor. 1997, 21, 161–167. (In Chinese) [Google Scholar]
  36. Chen, G.G.; Xi, X.H.; Liang, X.H.; Liu, H.Y.; Zhang, M.; Tian, F.J. Soil geochemicalbaselines of the Yangtze River Delta and their significances. Geoscience 2008, 22, 1041–1048. (In Chinese) [Google Scholar]
  37. Sutherland, R.A. Bed sediment-associated trace metals in an urban stream, Oahu, Hawaii. Environ. Geol. 2000, 39, 611–627. [Google Scholar] [CrossRef]
  38. Müller, G. Heavy metals in the sediment of the Rhine-changes since 1971. Umsch. Wiss. Und Tech. Umsch. Wiss. 1979, 79, 778–783. [Google Scholar]
  39. Förstner, U.A.W.; Calmano, W.; Kersten, M. Sediment criteria development. In Sediment Environment Geochemistry; Springer: Berlin/Heidelberg, Germany, 1990; pp. 311–338. [Google Scholar]
  40. Tomlinson, D.L.; Wilson, J.G.; Harris, C.R.; Jeffrey, D.W. Problems in the assessment of heavy-metal levels in estuaries and the formation of a pollution index. Helgoländer Meeresunters. 1980, 33, 566–575. [Google Scholar] [CrossRef] [Green Version]
  41. Bejarano-Ramirez, I.; Jurado, J.M.; Muñz-Valencia, R.; Alcázar, Á.; Ceballos-Magaña, S.G.; Olivos-Ortiz, A.; Rangel, O. Comparative study of As, Cd, Cu, Cr, Mg, Mn, Ni, Pb and Zn concentrations between sediment and water from estuary and port. Int. J. Environ. Sci. Technol. 2017, 14, 1333–1342. [Google Scholar] [CrossRef]
  42. Hu, B.; Li, J.; Zhao, J.; Yang, J.; Bai, F.; Dou, Y. Heavy metal in surface sediments of the Liaodong Bay, Bohai Sea: Distribution, contamination, and sources. Environ. Monit. Assess. 2013, 185, 5071–5083. [Google Scholar] [CrossRef]
  43. Zhao, G.; Lu, Q.; Ye, S.; Yuan, H.; Ding, X.; Wang, J. Assessment of heavy metal contamination in surface sediments of the west Guangdong coastal region, China. Mar. Pollut. Bull. 2016, 108, 268–274. [Google Scholar] [CrossRef] [PubMed]
  44. Lu, J.; Li, A.; Huang, P. Distribution, sources and contamination assessment of heavy metals in surface sediments of the South Yellow Sea and northern part of the East China Sea. Mar. Pollut. Bull. 2017, 124, 470–479. [Google Scholar] [CrossRef] [PubMed]
  45. Otansev, P.; Taşkın, H.; Başsarı, A.; Varinlioğlu, A. Distribution and environmental impacts of heavy metals and radioactivity in sediment and seawater samples of the Marmara Sea. Chemosphere 2016, 154, 266–275. [Google Scholar] [CrossRef] [PubMed]
  46. Mali, M.; Dell’Anna, M.M.; Mastrorilli, P.; Damiani, L.; Piccinni, A.F. Assessment and source identification of pollution risk for touristic ports: Heavy metals and polycyclic aromatic hydrocarbons in sediments of 4 marinas of the Apulia region (Italy). Mar. Pollut. Bull. 2017, 114, 768–777. [Google Scholar] [CrossRef] [PubMed]
  47. Sreenivasulu, G.; Jayaraju, N.; Sundara Raja Reddy, B.C.; Lakshmanna, B.; Rajasekhar, M.; Nirmala, K.; Lakshmi Prasad, T. Assessment of heavy metal pollution from the sediment of Tupilipalem Coast, southeast coast of India. Int. J. Sediment Res. 2018, 33, 294–302. [Google Scholar] [CrossRef]
  48. Wilding, L.P. Spatial variability: Its documentation, accommodation and implication to soil surveys. In Soil Spatial Variability; Nielsen, D.R., Ed.; Wageningen, Press: Wageningen, The Netherlands, 1985; pp. 166–194. [Google Scholar]
  49. Kuijpers, A.; Dennegård, B.; Albinsson, Y.; Jensen, A. Sediment transport pathways in the Skagerrak and Kattegat as indicated by sediment Chernobyl radioactivity and heavy metal concentrations. Mar. Geol. 1993, 111, 231–244. [Google Scholar] [CrossRef]
  50. França, S.; Vinagre, C.; Caçador, I.; Cabral, H.N. Heavy metal concentrations in sediment, benthic invertebrates and fish in three salt marsh areas subjected to different pollution loads in the Tagus Estuary (Portugal). Mar. Pollut. Bull. 2005, 50, 998–1003. [Google Scholar] [CrossRef]
  51. Spagnoli, F.; Andresini, A. Biogeochemistry and sedimentology of Lago di Lesina (Italy). Sci. Total Environ. 2018, 643, 868–883. [Google Scholar] [CrossRef]
  52. Berrin, T.; Syed, R. Heavy metal content in relation to particle size and organic content of surficial sediments in Miami River and transport potential. Int. J. Sediment Res. 2016, 31, 324–329. [Google Scholar] [CrossRef]
  53. Alshemmari, H.; Talebi, L. Heavy metal concentrations in the surface sediments of the northwestern Arabian Gulf, Kuwait. Arab. J. Geosci. 2019, 12, 1–9. [Google Scholar] [CrossRef]
  54. Ibanga, L.B.; Nkwoji, J.A.; Usese, A.I.; Onyema, I.C.; Chukwu, L.O. Hydrochemistry and heavy metals concentrations in sediment of Woji creek and Bonny estuary, Niger Delta, Nigeria. Reg. Stud. Mar. Sci. 2019, 25, 100436. [Google Scholar] [CrossRef]
  55. Liu, J.; Xu, K.; Li, A.; Milliman, J.D.; Velozzi, D.M.; Xiao, S.; Yang, Z. Flux and fate of Yangtze River sediment delivered to the East China Sea. Geomorphology 2007, 85, 208–224. [Google Scholar] [CrossRef]
  56. Su, J.; Pan, Y. On the shelf circulation north of Taiwan. Acta Oceanol. Sin. 1987, 6, 1–20. [Google Scholar]
  57. Zhang, J.; Huang, W.; Wang, Q. Concentration and partitioning of particulate trace metals in the Changjiang (Changjiang River River). Water Air Soil Pollut. 1990, 52, 57–70. [Google Scholar] [CrossRef]
  58. Bi, C.; Shi, C. Xi Jinping’s statement on the green development of marine economy. J. Jiangsu Univ. (Soc. Sci. Ed.) 2021, 23, 11–21. (In Chinese) [Google Scholar]
  59. Zhang, F.; Zhou, M.; Li, Y.; Lin, L.; Ma, G.; He, L.; Chen, S. Characteristics of eco-environmental quality changes in China during the 13th five-year plan period. Environ. Monit. China 2021, 37, 1–8. (In Chinese) [Google Scholar]
  60. State Oceanic Administration, China. China Marine Environmental Quality Bulletin; State Oceanic Administration, China: Beijing, China, 2016.
  61. State Oceanic Administration, China. China Marine Environmental Quality Bulletin; State Oceanic Administration, China: Beijing, China, 2017.
  62. State Oceanic Administration, China. China Marine Environmental Quality Bulletin; State Oceanic Administration, China: Beijing, China, 2018.
  63. State Oceanic Administration, China. China Marine Environmental Quality Bulletin; State Oceanic Administration, China: Beijing, China, 2019.
  64. State Oceanic Administration, China. China Marine Environmental Quality Bulletin; State Oceanic Administration, China: Beijing, China, 2020.
Figure 1. Sampling locations of the Changjiang River Estuary (Sustainability 15 04323 i001) and contiguous East China Sea (Sustainability 15 04323 i002).
Sustainability 15 04323 g001
Figure 2. Distributions of nine heavy metals in the surface sediments of the Changjiang River Estuary and contiguous East China Sea during the study.
Sustainability 15 04323 g002aSustainability 15 04323 g002b
Figure 3. Sampling stations and circulation in the East China Sea ((a), modified after Liu et al., 2007 [55]), and distributions of total nine heavy metals in the surface sediments of the Changjiang River Estuary and contiguous East China Sea (b).
Sustainability 15 04323 g003aSustainability 15 04323 g003b
Figure 4. Enrichment factor (EF), geoaccumulation index (Igeo), and single contamination factor (CF) of heavy metals in the surface sediments.
Sustainability 15 04323 g004aSustainability 15 04323 g004b
Figure 5. Percentage of enrichment factor (EF) and geoaccumulation index (Igeo) values in the surface sediments.
Sustainability 15 04323 g005
Figure 6. Heavy metal polluted gradations of pollution load index (PLI) in all sampling sites.
Sustainability 15 04323 g006
Figure 7. Hg and Cd released directly into the East China Sea from 2016 to 2020.
Sustainability 15 04323 g007
Table 1. Information on method performance in the investigated matrices (n = 10).
ElementLinear Range
(μg/g)
Linearity (R2)LOQ
(μg/g)
Recovery ± SD (%)RSD
(%)
Analytic Method
Pb0–500.99850.01395.1 ± 3.13.26ICP-OES
Cr0–2500.99970.00499.2 ± 5.15.14ICP-OES
Ni0–1000.99980.007103.4 ± 1.41.35ICP-OES
Cu0–1000.99850.00397.5 ± 3.63.69ICP-OES
Zn0–5000.99920.013102.1 ± 2.52.45ICP-OES
Co0–1000.99940.00998.6 ± 2.92.94ICP-OES
Cd0–2.50.99990.001101.4 ± 1.71.68ICP-OES
As0–250.99940.02097.3 ± 3.94.01AFS
Hg0–10.99990.01098.7 ± 2.72.74AFS
Table 2. Dividing standards of enrichment factor, pollution load index, and potential ecological risk index [37,39,40].
ClassificationEnrichment Factor (EF)Geoaccumulation Index (Igeo)Potential Ecological Risk Index (Eri and RI)
EFConcentration LevelIgeoContamination LevelPLIContamination Level
class 1<2Depletion to minimal enrichment suggestive of no or minimal pollution<0Practically unpolluted≤1No pollution
class 22–5Moderate enrichment, suggestive of moderate pollution0–1Unpolluted to moderately polluted1–2Slight pollution
class 35–20Significant enrichment, suggestive of a significant pollution signal1–2Moderate pollution2–3Moderate pollution
class 420–40Very highly enriched, indicating a very strong pollution signal2–3Moderately to heavily polluted>3High pollution
class 5>40Extremely enriched, indicating an extreme pollution signal3–4Heavily polluted
class 6 4–5Heavily to extremely polluted
class7 ≥5Extremely polluted
Table 3. Summary statistics of heavy metals, reference element, crystallite dimension, and TOC in 38 investigated sediment samples.
StatisticsNi
(μg/g)
Pb (μg/g)Zn (μg/g)Cd (μg/g)Co (μg/g)Cr
(μg/g)
Cu (μg/g)As (μg/g)Hg (μg/g)Al
(μg/g)
Grain Size (μm)TOC (%)
Minimum value16.457.0431.930.2112.3243.778.342.390.0564680.660.36
Maximum value45.2725.33124.111.2926.03103.9053.678.770.41111,086189.200.88
Average value29.3216.0968.670.4818.7769.2224.475.590.1983,99031.630.73
Standard deviation7.294.9421.450.263.6313.9511.132.070.0912,48042.400.11
Variable coefficient (%)24.930.731.253.419.320.245.537.045.814.9134.115.3
Average value of the Changjiang River Estuary29.4016.5267.320.5218.8470.2925.924.900.1283,96428.690.76
Average value of the East China Sea29.1415.0371.970.3818.6066.6020.895.860.2384,05238.830.67
Table 4. Pearson correlation coefficient matrix of heavy metals, major elements, crystallite dimension and TOC in the surface sediments.
NiPbZnCdCoCrCuAsHgAlTOCCrystallite Dimension
Ni10.884 **0.745 **0.491 **0.942 **0.934 **0.861 **0.739 **0.653 **0.402 *0.209−0.467 **
Pb 10.546 **0.593 **0.825 **0.832 **0.762 **0.643 **0.699 **0.329 *0.172−0.361 *
Zn 10.2920.729 **0.675 **0.656 **0.628 **0.395 *0.2630.121−0.295
Cd 10.490 **0.557 **0.578 **0.498 **0.520 **0.328 *0.169−0.201
Co 10.925 **0.725 **0.587 **0.586 **0.360 *0.173−0.393 *
Cr 10.778 **0.657 **0.705 **0.400 *0.209−0.384 *
Cu 10.866 **0.708 **0.477 **0.288−0.434 **
As 10.668 **0.2580.295−0.472 **
Hg 10.2260.405 *−0.358 *
Al 10.077−0.098
TOC 1−0.639 **
Crystallite dimension 1
** Correlation is significant at p < 0.01 level (two-tailed); * Correlation is significant at p < 0.05 level (two-tailed).
Table 5. Comparisons of heavy metal mean levels (μg/g) in the sediments of the Changjiang River Estuary and the East China Sea and other coastal zones in the world.
LocationNiPbZnCdCoCrCuAsHgSampling TimeReference
The Changjiang River Estuary, China33.521.089.50.25-84.724.310.30.042007[30]
The Changjiang River Estuary, China-21.7063.920.58- 26.5710.410.1102012–2016[31]
The Changjiang River Estuary, China-30.4766.910.15-34.6417.467.860.052014[29]
The Changjiang River Estuary and contiguous East China Sea29.316.168.70.4818.869.224.55.590.192015In this study
The west Guangdong coastal region, China-44.31400.38-87.043.820.80.132008[43]
The Liaodong Bay, China22.531.871.7--46.419.48.300.042009[42]
The South Yellow Sea and northern part of the East Sea, China30.520.770.3--69.517.4--2009[44]
The Tupilipalem Coast, India6.435.6714.20.71-9.253.55--2015[47]
The Red Sea, Saudi Arabia13.73.5416.8-5.3420.218.7-1.832018[20]
The Apulia region, Italy14.152.282.30.25-19.141.09.100.242010[46]
The Marmara Sea, Turkey49.132.985.5--11539.3--2010[45]
–: no data or unavailable.
Table 6. Enrichment factor, geoaccumulation index, and pollution load index of heavy metals in the surface sediments of the Yangtze Estuary and contiguous East China Sea.
PLIElementEFIgeoCF
MaximumMinimumMaximumMinimumMaximumMinimumMaximumMinimum
ValueSiteValueSiteValueSiteValueSiteValueSiteValueSiteValueSiteValueSite
2.26A140.67D3Ni1.5A240.1A140.01A14−1.45D31.5A140.6D3
Pb1.3A240.1A14−0.53A14−2.37A161.0 A240.3A16
Zn2.1D100.1A140.28D10−1.68A271.8D100.5A27
Cd15A150.9A143.10A150.49D312.9A152.1D3
Co2.1A80.2A140.37A14−0.71D31.9A140.9D3
Cr1.4A80.1A14−0.06A26−1.31D31.4A260.6D3
Cu2.1A240.2A140.67A14−2.02D32.4A140.4D3
As2.0 A180.2A140.33A18−1.54D41.9A180.5D4
Hg11A240.6A142.54A24−0.56D38.7A241.0 D3
Disclaimer/Publisher’s Note: The statements, opinions and data contained in all publications are solely those of the individual author(s) and contributor(s) and not of MDPI and/or the editor(s). MDPI and/or the editor(s) disclaim responsibility for any injury to people or property resulting from any ideas, methods, instructions or products referred to in the content.

