1. Introduction
The water crisis is now ranked as one of the most important global risks, as it may threaten the sustainable development of human societies [
1,
2]. In the coming decades, climate and social changes are expected to further exacerbate water scarcity in many parts of the world [
3]. China is generally facing water shortages due to the uneven spatial and temporal distribution of water resources [
4]. As an important ecological barrier and economic zone in China, the Yellow River Basin has a very important position in China’s economic and social development and ecological security. However, with the in-depth development of industrialization and urbanization in the Yellow River Basin that has occurred, the conflict between the growing water demand and limited water resources has intensified the competition between different water-using regions and industries [
5,
6]. To a certain extent, this has hindered the sustainable socio-economic development of the Yellow River Basin. Therefore, optimizing water resource allocation through a reasonable assessment of water resource utilization in the Yellow River Basin is an important way to achieve ecological protection and high-quality development in the Yellow River Basin.
The introduction of virtual water theory provides a new perspective on water resource management, regulation, and security of water supply and demand. It was first proposed by Professor Allan in 1998 and refers to the amount of water needed to produce goods and services [
7]. Unlike the traditional concept of water resources, virtual water is an integrated concept involving hydrology, socio-economics, and ecology [
8]. The types of virtual water are further divided into blue water, green water, and gray water, where the blue water footprint is the amount of surface runoff and groundwater consumed in production processes; the green water footprint refers mainly to the amount of rainfall stored in the soil consumed by plants; and the gray water footprint refers to the amount of water needed to dilute discharged effluent to meet water quality requirements [
9,
10]. The virtual water strategy refers to the trade of water-scarce countries or regions through imports of water-intensive products (mainly food) to obtain food security and water resource security [
11]. Virtual water research combines economic and social systems with water resource systems, grasping the in-depth patterns of water resource utilization in the process of regional economic and social development more precisely. It is of great practical significance to ensure the security of water supply and demand and to alleviate the contradiction of water shortages in the region [
12].
The quantification of virtual water is the foundation of virtual water research. There are two types of virtual water quantification methods commonly used internationally: the bottom-up method, represented by the production tree method, and the top-down method, represented by the input-output method. The production tree method accumulates the water use of each link in the final product production chain and can reflect the water use of a certain sector in detail, while it ignores the network or relationship between some industrial sectors. Therefore, when accounting for the virtual water of products in multiple industrial sectors at the same time, there is a risk of unclear delineation of water use responsibilities, omissions, or double counting [
13]. Input-output analysis was first proposed by the economist Leontief [
14]. It can reflect the direct and indirect links between the production activities of various industrial sectors in the national economic system [
12], and it is divided into a single-region input-output model and a multi-region input-output model. However, the former can only reveal the dynamics of virtual water flows in a single closed region, ignoring the highly interconnected nature of the virtual water trade system, whereas a multi-regional input-output model can reflect inter-regional trade linkages of products and services [
5]. Based on multi-regional input-output models, environmental extended input-output analysis (EEIOA) incorporates environmental elements and can capture resource flows in a given economic system from a macro perspective [
15]. Therefore, this paper added water resource elements to the traditional MRIO model, constructing a multi-regional water resources input-output model for the Yellow River Basin to provide a more convenient channel for analyzing the water resources flow accompanying economic trade.
In recent years, domestic and foreign researchers have undertaken many studies on the virtual water trade pattern at different levels. In the study of virtual water flow patterns at the global level, Wu (2019) found that about 40% of the freshwater resources consumed in China end up in foreign economies, while only 20% of China’s virtual water use is from external inflows [
16]. Chen (2021) calculated, based on a world multi-regional input–output model, that many of the world’s extremely water-scarce countries are net exporters of virtual water, which exacerbates the uneven distribution of water resources [
17]. At the national level in China, An (2021) simulated the inter-provincial virtual water flow embedded in grain transportation and evaluated the water stress caused by the virtual water flow. The results show that the virtual water flow in North China will severely exceed the local water resource carrying capacity and have a significant negative impact on its sustainable development [
18]. Lin (2019) examined the virtual water implied by trade in the energy sector in China by province, and the flow pattern suggested that energy consumption in the more developed provinces is supported by water use in the less developed provinces, which are severely water-scarce [
19]. At the regional level, Zhang (2021) calculated and assessed the reliance of the Yellow River Delta on external water resources and found that the virtual water trade exacerbates the water shortage in the Yellow River Delta [
20]. Tian (2019) calculated and analyzed the virtual water flow pattern of the Yangtze River economic zone, and the results showed that the virtual water flow patterns in many parts of the Yangtze River basin are not coordinated with the local water resource carrying capacity [
12]. An (2021) simulated the inter-provincial virtual water flow embedded in grain transportation and found that the virtual water flow in North China will seriously exceed its water resource carrying capacity by 2030, which will have a significant negative impact on local sustainable development [
18]. Previous studies have shown that virtual water trade has not really played a role in alleviating water scarcity in China, and that virtual water flows incompatible with water endowments have instead exacerbated water shortages in some areas.
However, the current research has only focused on the measurement of virtual water flows, without analysis of the causes of virtual water flow patterns. In recent years, water shortages have become the biggest bottleneck limiting the high-quality economic development of the Yellow River Basin. There is an urgent need to identify the driving factors of virtual water flow and provide potential solutions to alleviate the water shortages in the basin. The IPAT model can visualize the combined effects of population, affluence, and technology on environmental issues, but it lacks flexibility [
21]. The STIRPAT model is an extension of the IPAT model that was developed by Dietz and Rosa [
22], which has good flexibility and scope for studying virtual water issues. The extended STIRPAT model can add more drivers and is now widely used in the fields of virtual water and water footprints [
23,
24]. Therefore, the extended STIRPAT model was applied in this paper to identify the main positive driving factors of virtual water flows, from which we explore possible options for using virtual water trade to improve the status of water scarcity in the basin.
Based on this, this study aimed to answer the following two questions: How are the virtual water trade patterns of the Yellow River Basin spatially distributed and how do they temporally vary, and what factors have contributed to the formation of virtual water trade patterns of the Yellow River Basin? Therefore, this study took the virtual water flow in nine provinces of the Yellow River Basin as the object of study and constructed a multi-regional input-output (MRIO) model of water resources of the Yellow River Basin to measure and analyze the virtual water flow pattern. Then, an extended STIRPAT model was constructed with 11 possible drivers selected from four aspects (demographic, economic, technological, and natural) to reveal where the driving forces for the formation of the virtual water flow pattern in the Yellow River Basin lie. It is expected to provide reasonable suggestions for the optimal allocation of water resources in the Yellow River Basin, thus achieving the dual goals of ecological protection and high-quality development in the Yellow River Basin.
2. Study Area
The Yellow River is the second largest river in China. The main stream is 5464 km long, with a total basin area of 795,000 km
2 (including 42,000 km
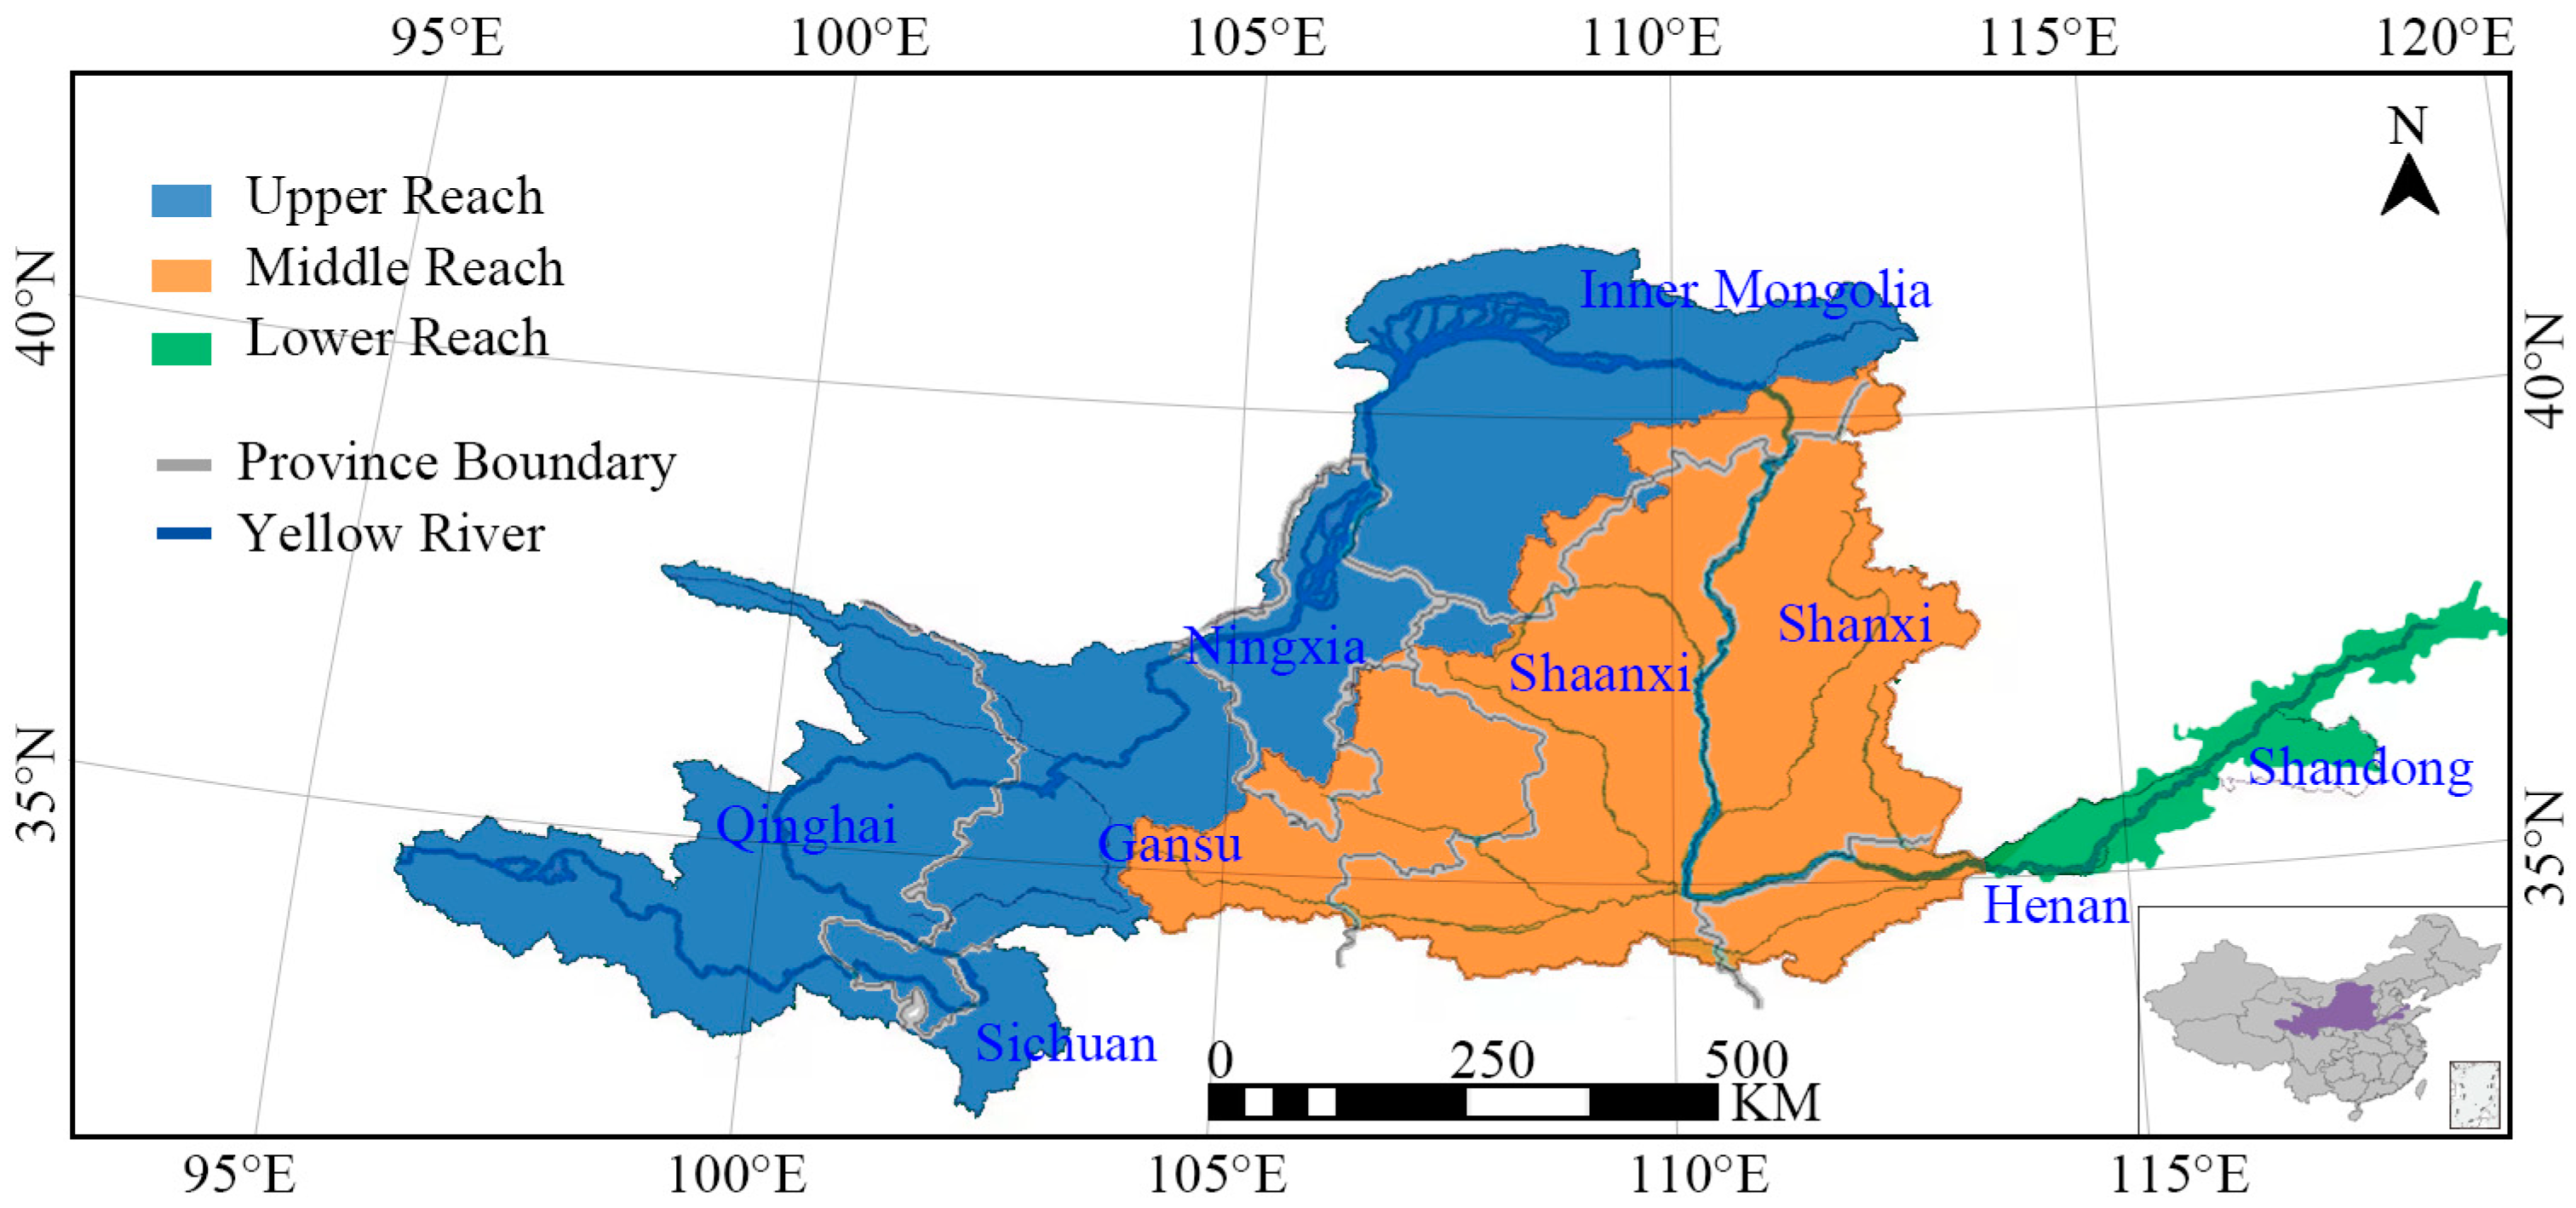
2 of inland flow area). The Yellow River basin is located in the east, at longitude 96°~119°, north latitude 32°~42°. The Yellow River originated in the northern foothills of the Tibetan Plateau Bayankara Mountains, in the ancient Zongli basin, and flows through Qinghai, Sichuan, Gansu, Ningxia, Inner Mongolia, Shanxi, Shaanxi, Henan, and Shandong [
25]. The Yellow River basin is often divided into the following three parts [
26,
27]: upstream provinces (Qinghai, Sichuan, Gansu, Ningxia, Inner Mongolia), midstream provinces (Shanxi, Shaanxi), and downstream provinces (Henan, Shandong) (
Figure 1).
The per capita water resources of the Yellow River are 473 m
3, less than 1/4 of the national average. However, it meets the water needs of 15% of China’s arable land and 12% of the population [
28]. Although the Yellow River basin has scarce water resources, it plays a very important role in China’s economic and social development, as well as ecological security [
29,
30]. An assessment of water resources in the Yellow River Basin showed that the natural runoff in the Yellow River Basin has decreased by 20% since the beginning of the 21st century. The actual exploitation rate of water resources has reached 86%, far exceeding the ecological alert of 40% for a typical river basin, which is exacerbating the current water shortages in the region [
31].
Internationally recognized water scarcity standards are divided into four levels, with per capita water resources below 3000 m
3 for mild water scarcity, below 2000 m
3 for moderate water scarcity, and below 1000 m
3 for severe water scarcity. Below 500 m
3, the water shortage is extreme [
32]. According to this standard, the provinces in the Yellow River Basin are in water shortage, except for Qinghai and Sichuan. Specifically, Shaanxi and Inner Mongolia are in moderate water shortage; Gansu is in severe water shortage; and Ningxia, Shanxi, Shandong, and Henan are in extreme water shortage [
28].
There is also an imbalance between the elemental endowments and the degree of utilization of water resources in each region of the Yellow River Basin. From the comparison of the average total water resources and the average total water consumption of each province in the Yellow River Basin in recent years, Gansu, Ningxia, Shanxi, Henan, and Shandong, as water-scarce regions, use more than half of their total water resources each year, and the total water consumption of Ningxia, which is in the upper reaches, far exceeds their total water resources (
Figure 2). Qinghai, Sichuan, and Inner Mongolia have abundant water resources; their total water consumption only accounts for a very small part of their total water resources. This indicates that some areas in the Yellow River Basin have abundant water resources to be further developed and utilized, or transferred to other water-scarce areas, thus alleviating the water shortage in other areas and realizing the full utilization of water resources. In some areas, however, there are problems of over-exploitation despite severe shortages or excessive transfer of water resources to other areas, which aggravates water shortages.
5. Discussion
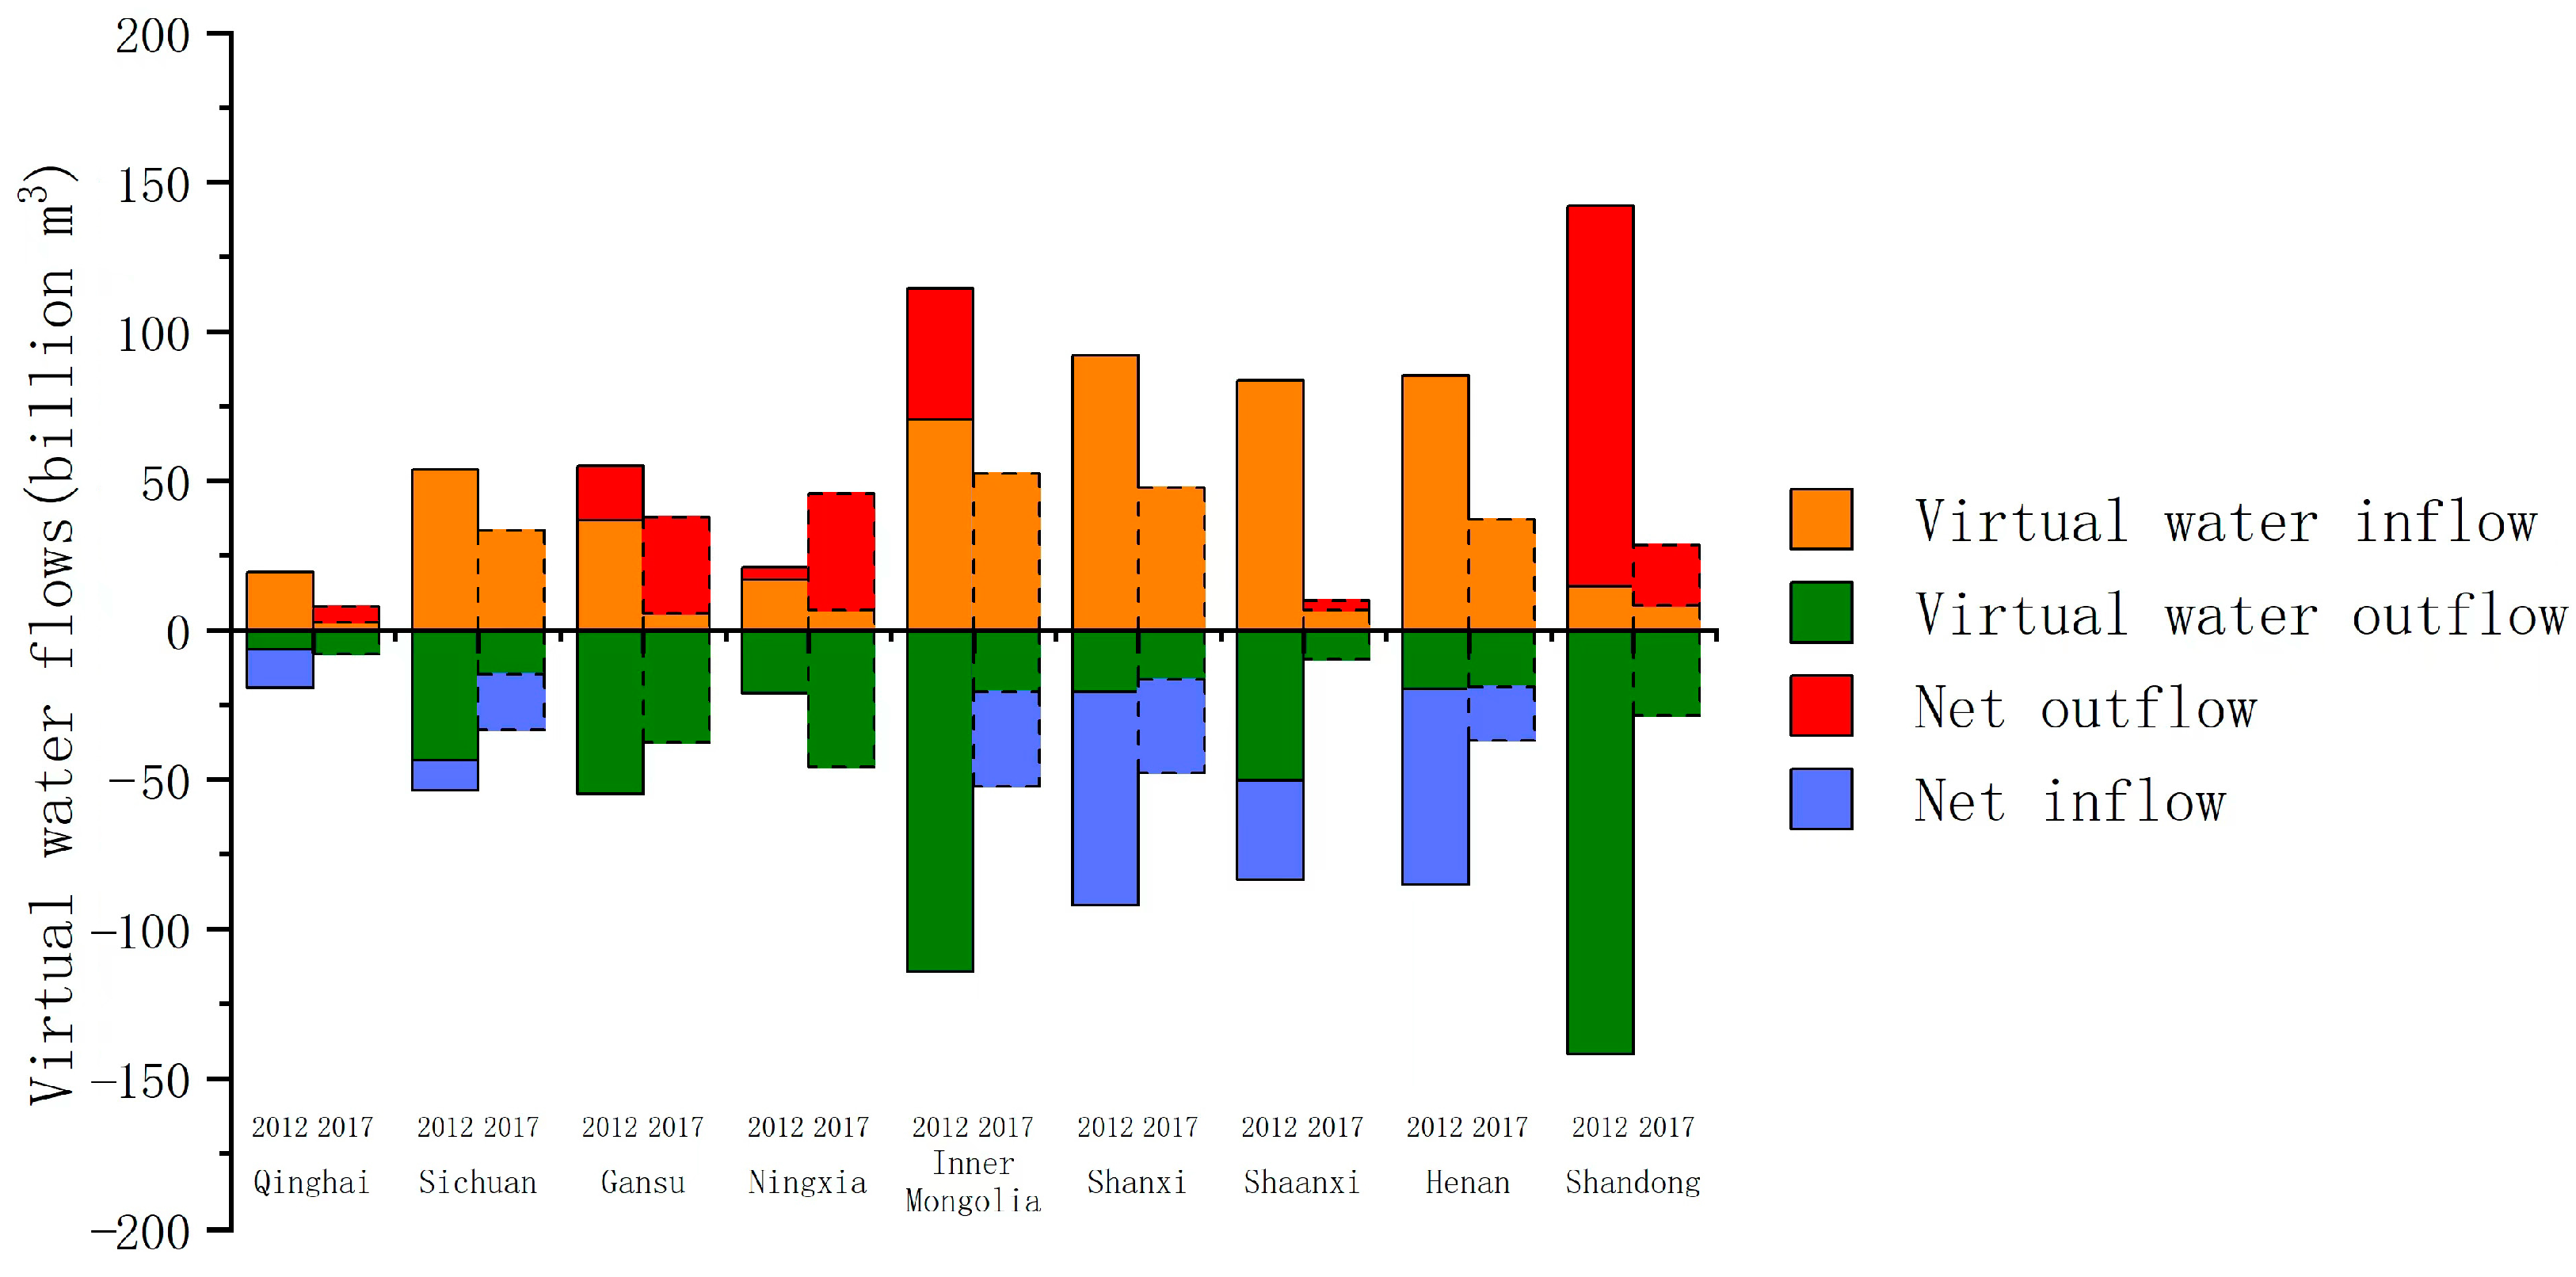
The virtual water trade only relieves the water-poor pressure in some parts of the Yellow River Basin. Some water-scarce areas have a large net export of virtual water, while some water-rich areas have a net inflow of the virtual water trade. The virtual water flow status is not coordinated with the local water resource endowment. As shown in
Figure 5, the net virtual water outflow of Ningxia, which is an area of extreme water shortage, was 4.701 billion m
3 in 2017, much greater than that in 2012. What is more, Shanxi turned into a net virtual water outflow area in 2017, and this shift was contradictory to the current situation of severe water shortage in Shanxi. Therefore, the virtual water flows implied in the trade of products and services not only do not alleviate the current water shortages in these areas, but may also exacerbate their water stress. On the contrary, Qinghai, which is relatively rich in water resources, had a large net inflow of virtual water in 2012, and maintained a balance of incoming and outgoing water in 2017. This indicates that the virtual water trade does not fully optimize water allocation.
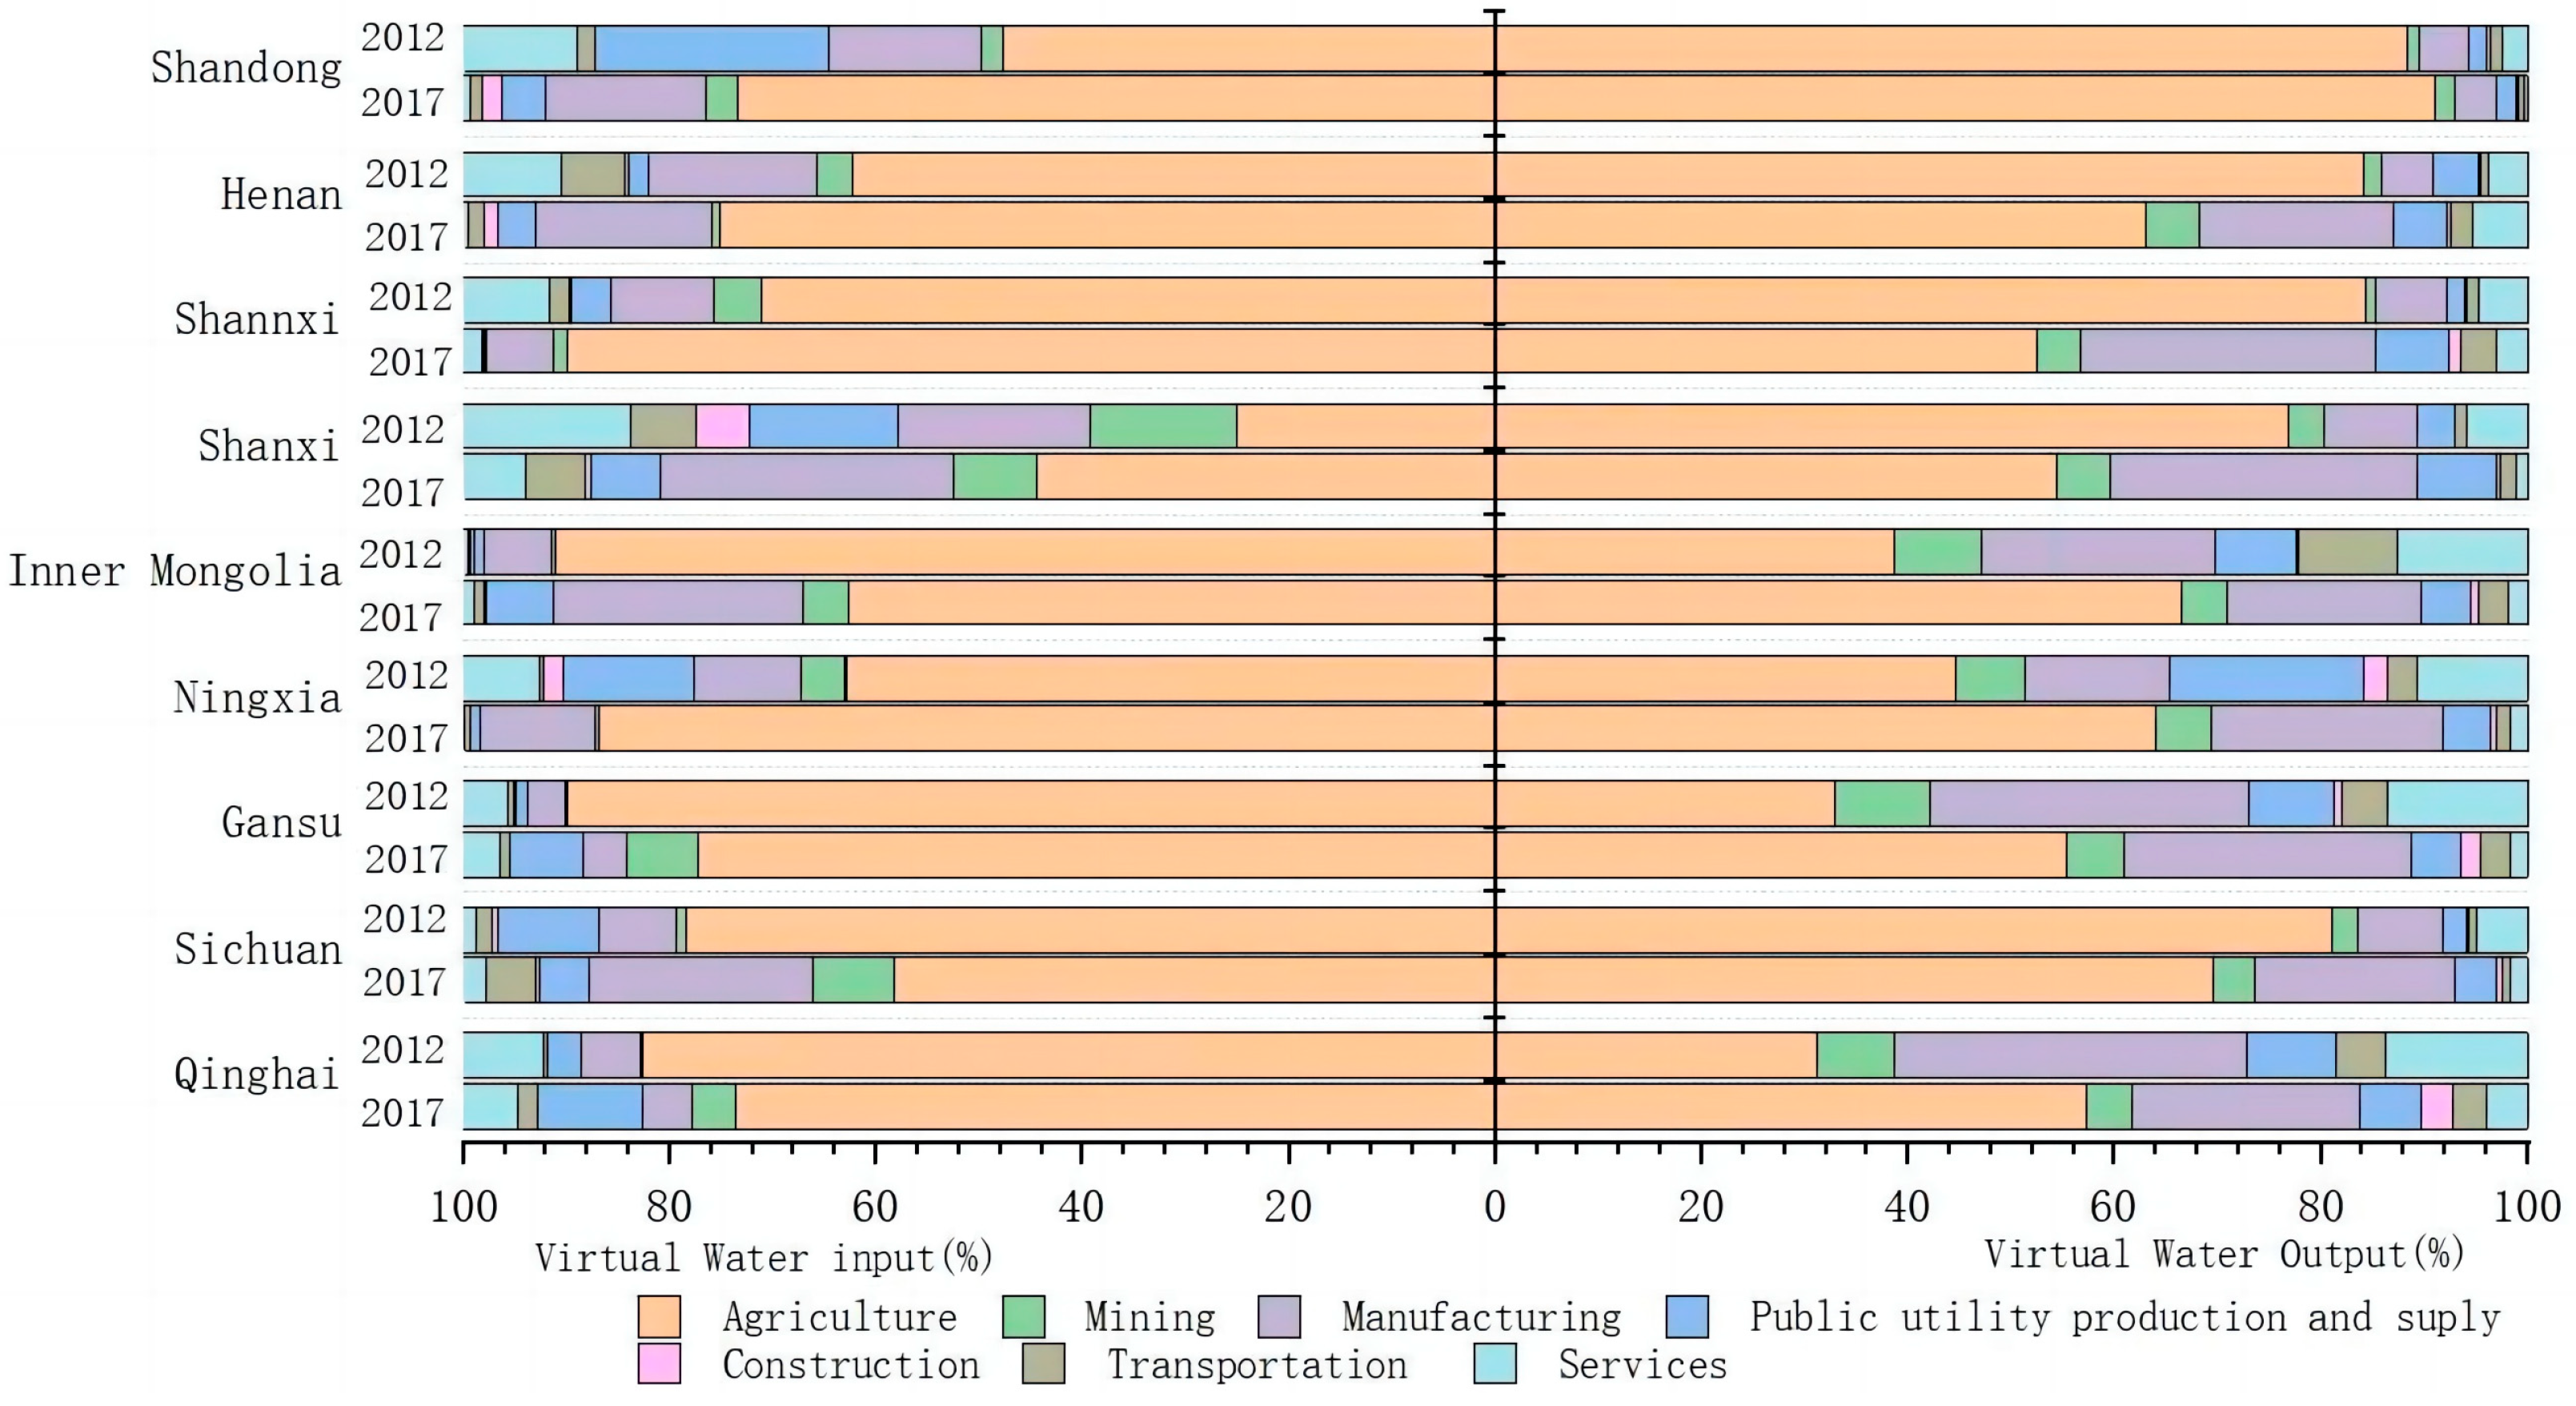
Decomposing the virtual water trade results into individual sectors, Henan and Shandong, which are water-poor regions, accounted for a large share of the trade output of agricultural products, which have the highest water use coefficients. In contrast, Qinghai and Inner Mongolia, which are relatively rich in water resources, import a large amount of agricultural products, while manufacturing industries, which have lower water consumption coefficients, have a strong output intensity. Such an industrial structure layout is not conducive to alleviating the water shortages caused by the uneven distribution of water resources in the Yellow River Basin. This will require comprehensive planning for the rational use of water resources, adjusting the industrial layout, and establishing a scientific industrial structure according to the natural endowment of water resources in each region.
The extended STIRPAT model provides theoretical support for the formulation of corresponding industrial and trade policies. Per capita GDP, consumer price level, tertiary industry contribution rate, and water scarcity level are the main positive drivers of virtual water inflow in the Yellow River Basin. GDP per capita and consumer price level respond to the regional economic development level, while high-quality economic development is the goal rather than the means to optimize water allocation; therefore, relevant policies are mainly considered from the perspective of increasing the contribution rate of the tertiary industry. At present, the overall industrial structure of the Yellow River Basin is heavy, and the economic development model is mainly based on resource and energy-consuming development, with high environmental pressure. Therefore, under the development premise of ecological protection, water-scarce regions should accelerate the transformation of their regional economic development mode and vigorously develop low water-consumption intensity industries, in order to reduce the pressure on water resources in water-poor areas. The contribution rate of primary industry, per capita water resources, and water use per arable area are the main positive drivers of virtual water flow out in the Yellow River Basin. Per capita water resources reflect regional water resources endowment, and it is generally difficult to make corresponding policy adjustments. Therefore, policies are mainly formulated from the perspective of primary industry contribution rate and water use per unit of cultivated land area to control virtual water outflow in water-scarce areas. As agriculture is a highly water-consuming industry, water-scarce regions can appropriately reduce the production of local water-consuming crops and encourage the import of water-intensive agricultural products, so as to control the virtual water outflow in the region within a reasonable range. Water consumption per unit arable area reflects the level of agricultural production technology. Water-scarce areas should vigorously develop water conservation technology, promote the cultivation of low-water-consuming crops according to local conditions, and reduce water consumption per unit area, so as to alleviate the local water stress.
The unreasonable structure of the virtual water trade is a common problem in Chinese regions. This requires an integrated planning of the virtual water trade from a national perspective, timely adjustment of the industrial layout based on the natural endowment of water resources and other production conditions in each province and region, and the establishment of a reasonable regional industrial structure to form a sustainable virtual water trade pattern.
6. Conclusions
This study calculates the virtual water flow patterns in the Yellow River Basin by constructing a multi-regional input-output (MRIO) model of water resources in the Yellow River Basin. The extended STIRPAT model is then applied to analyze their driving factors and provide directions for using virtual water trade to alleviate the current water shortage in the basin.
The results showed that the Yellow River Basin as a whole was in a state of net virtual water inflow in both 2012 and 2017, and the net inflow has increased, which has alleviated the current water shortage situation in the Yellow River Basin to some extent. However, the virtual water flow status in some provinces and regions within the Yellow River Basin is not coordinated with the regional water resource endowment, and the unreasonable industrial layout drives a large amount of virtual water flow from water-poor areas to water-rich areas, which exacerbates the water shortage status in water-scarce areas.
This leads to relevant policy recommendations: water-scarce regions should accelerate the transformation of regional economic development and vigorously develop tertiary industries, especially low-water consumption intensity industries. At the same time, water-scarce regions can encourage the import of water-intensive agricultural products, develop water-saving technologies, and promote the cultivation of low-water-consumption crops in accordance with local conditions. More importantly, the national virtual water trade should be planned in an integrated manner, with local conditions of each province and region taken into account, thus establishing a reasonable regional industrial structure to form a sustainable virtual water trade pattern.


