
Analysis of Virtual Water Flow Patterns and Their Drivers in the Yellow River Basin


Abstract
:1. Introduction
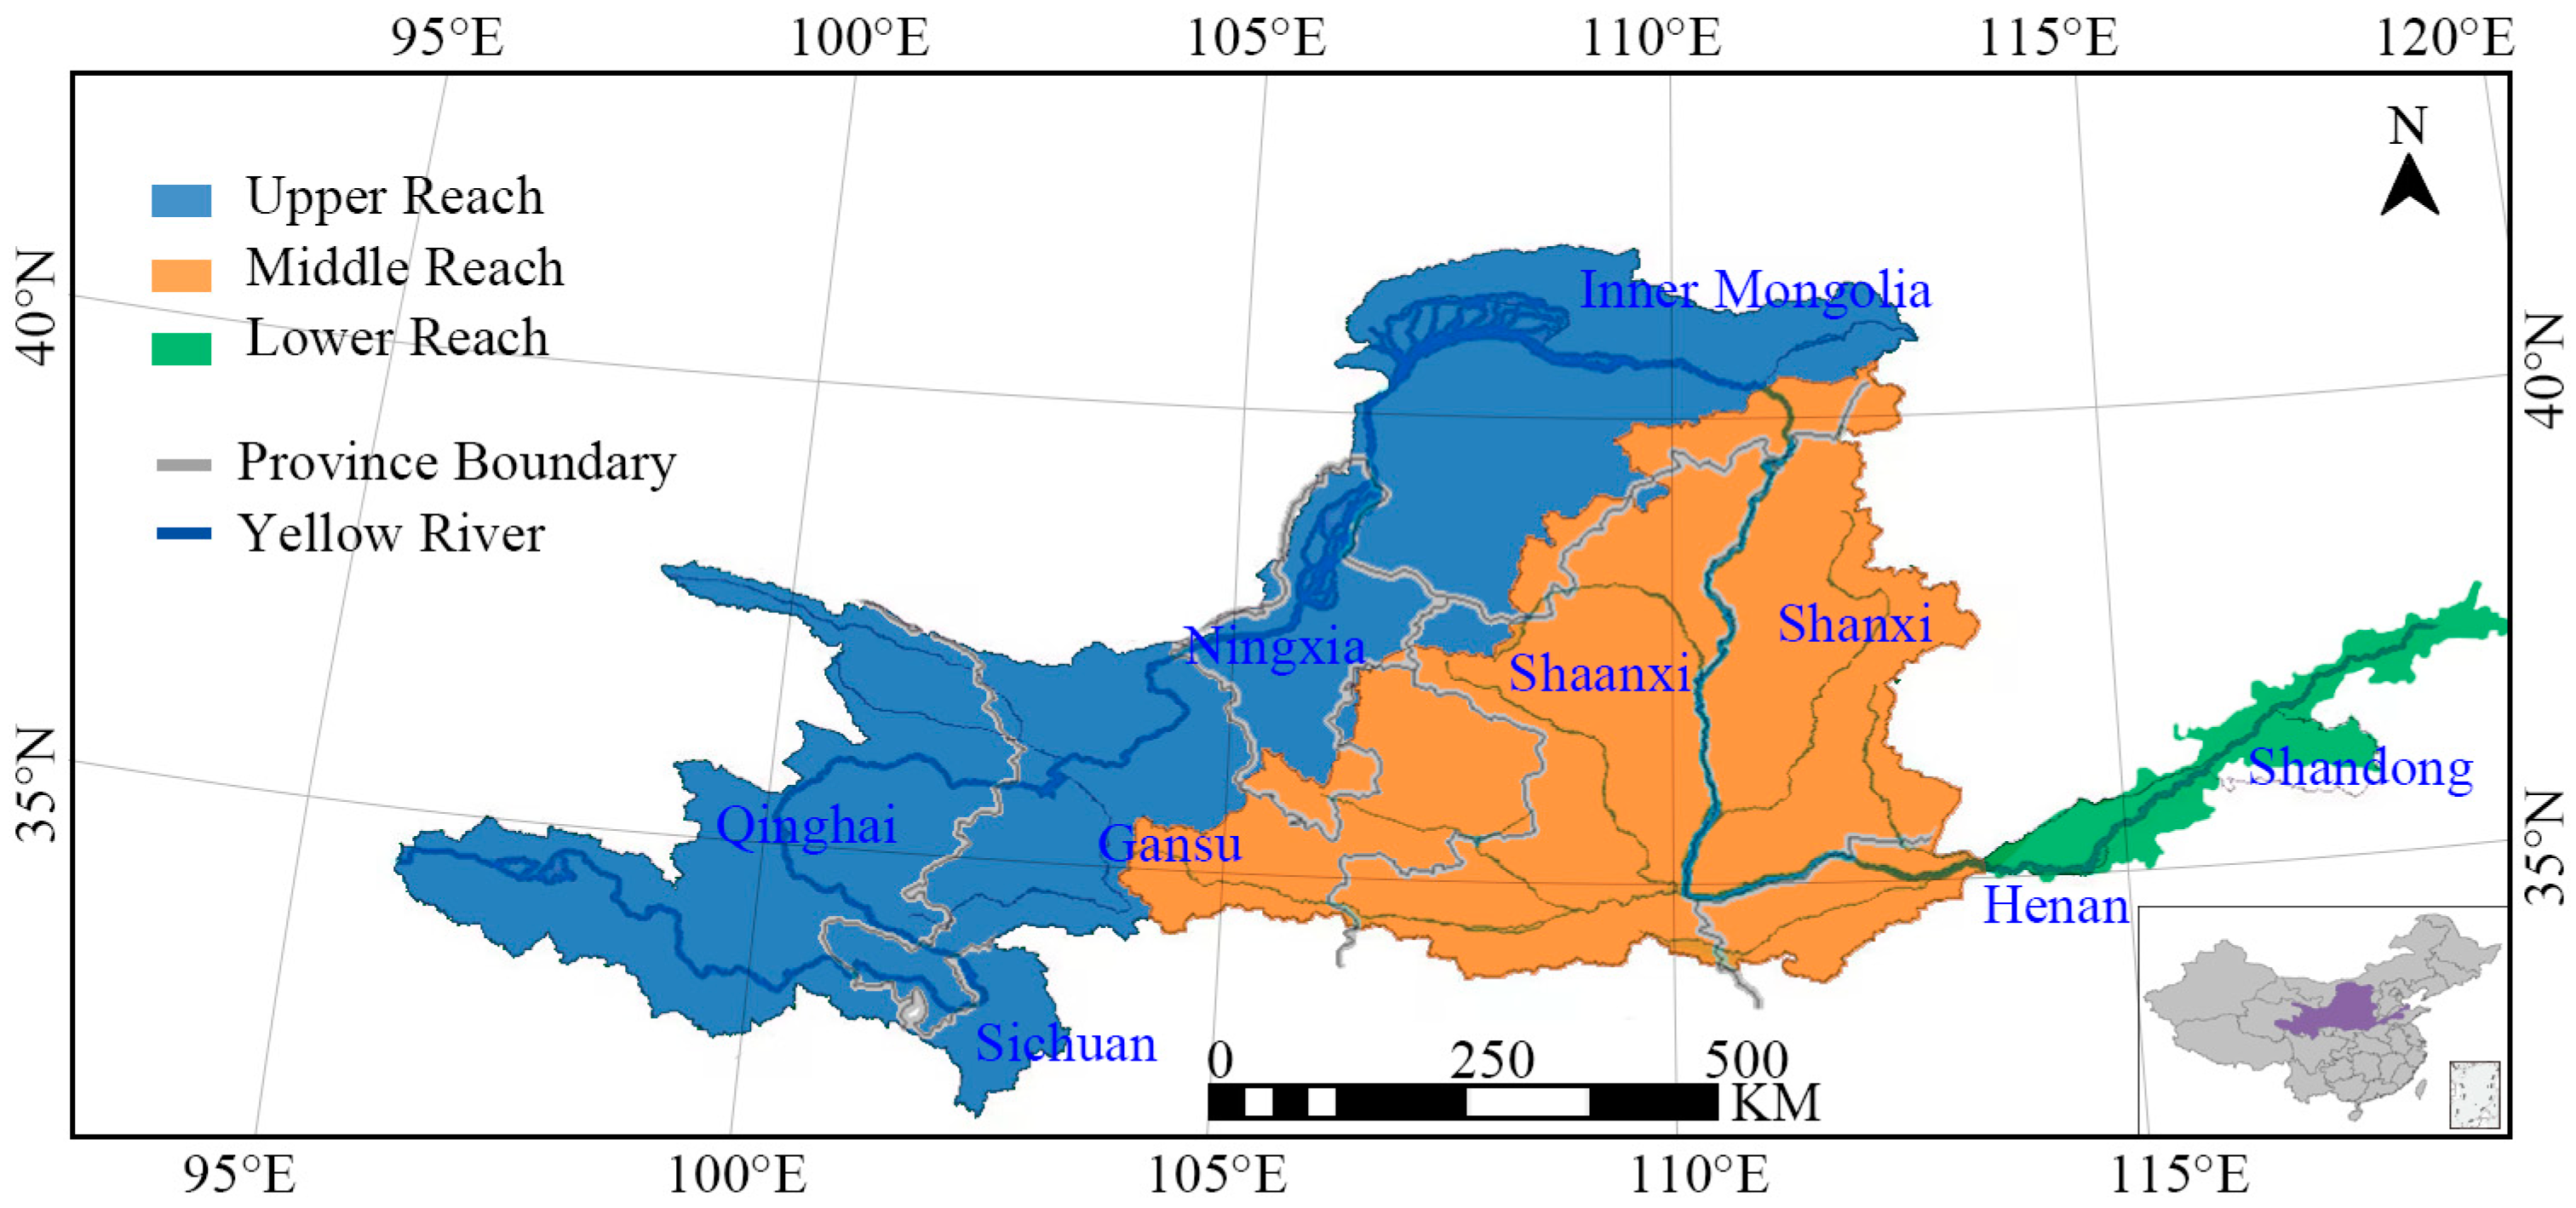
2. Study Area
3. Materials and Methods
3.1. Multi-Regional Input-Output Model
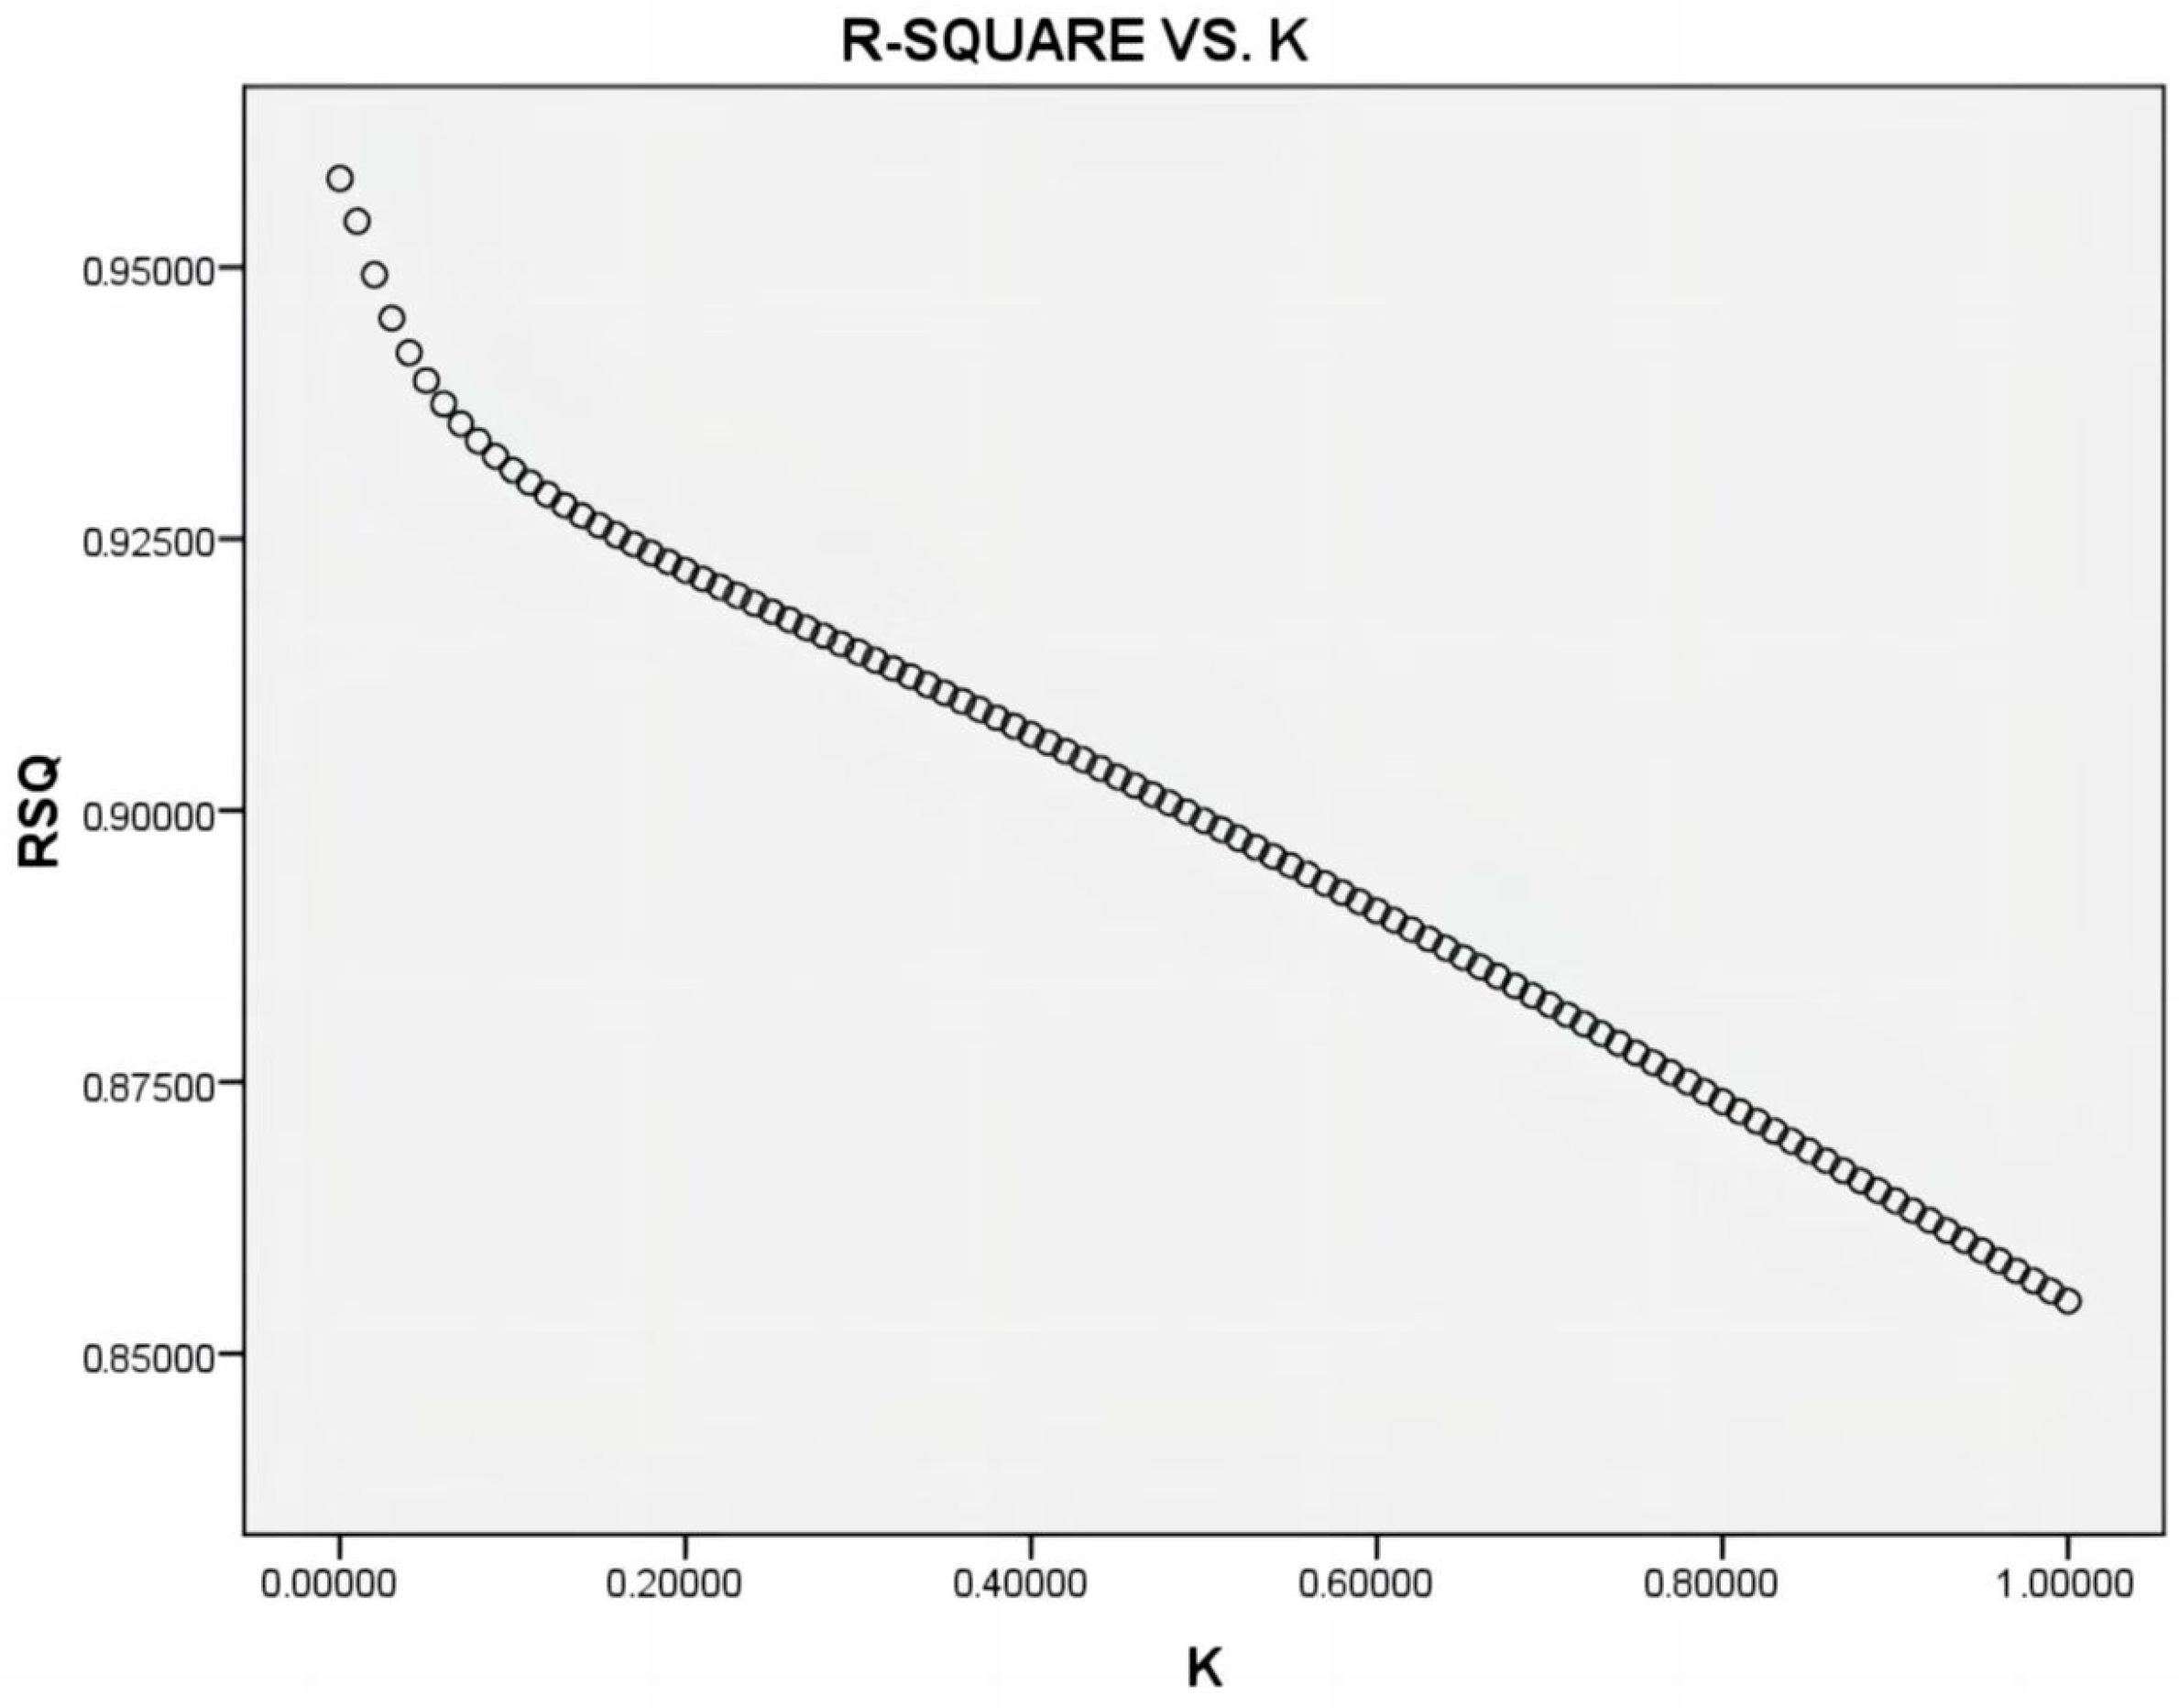
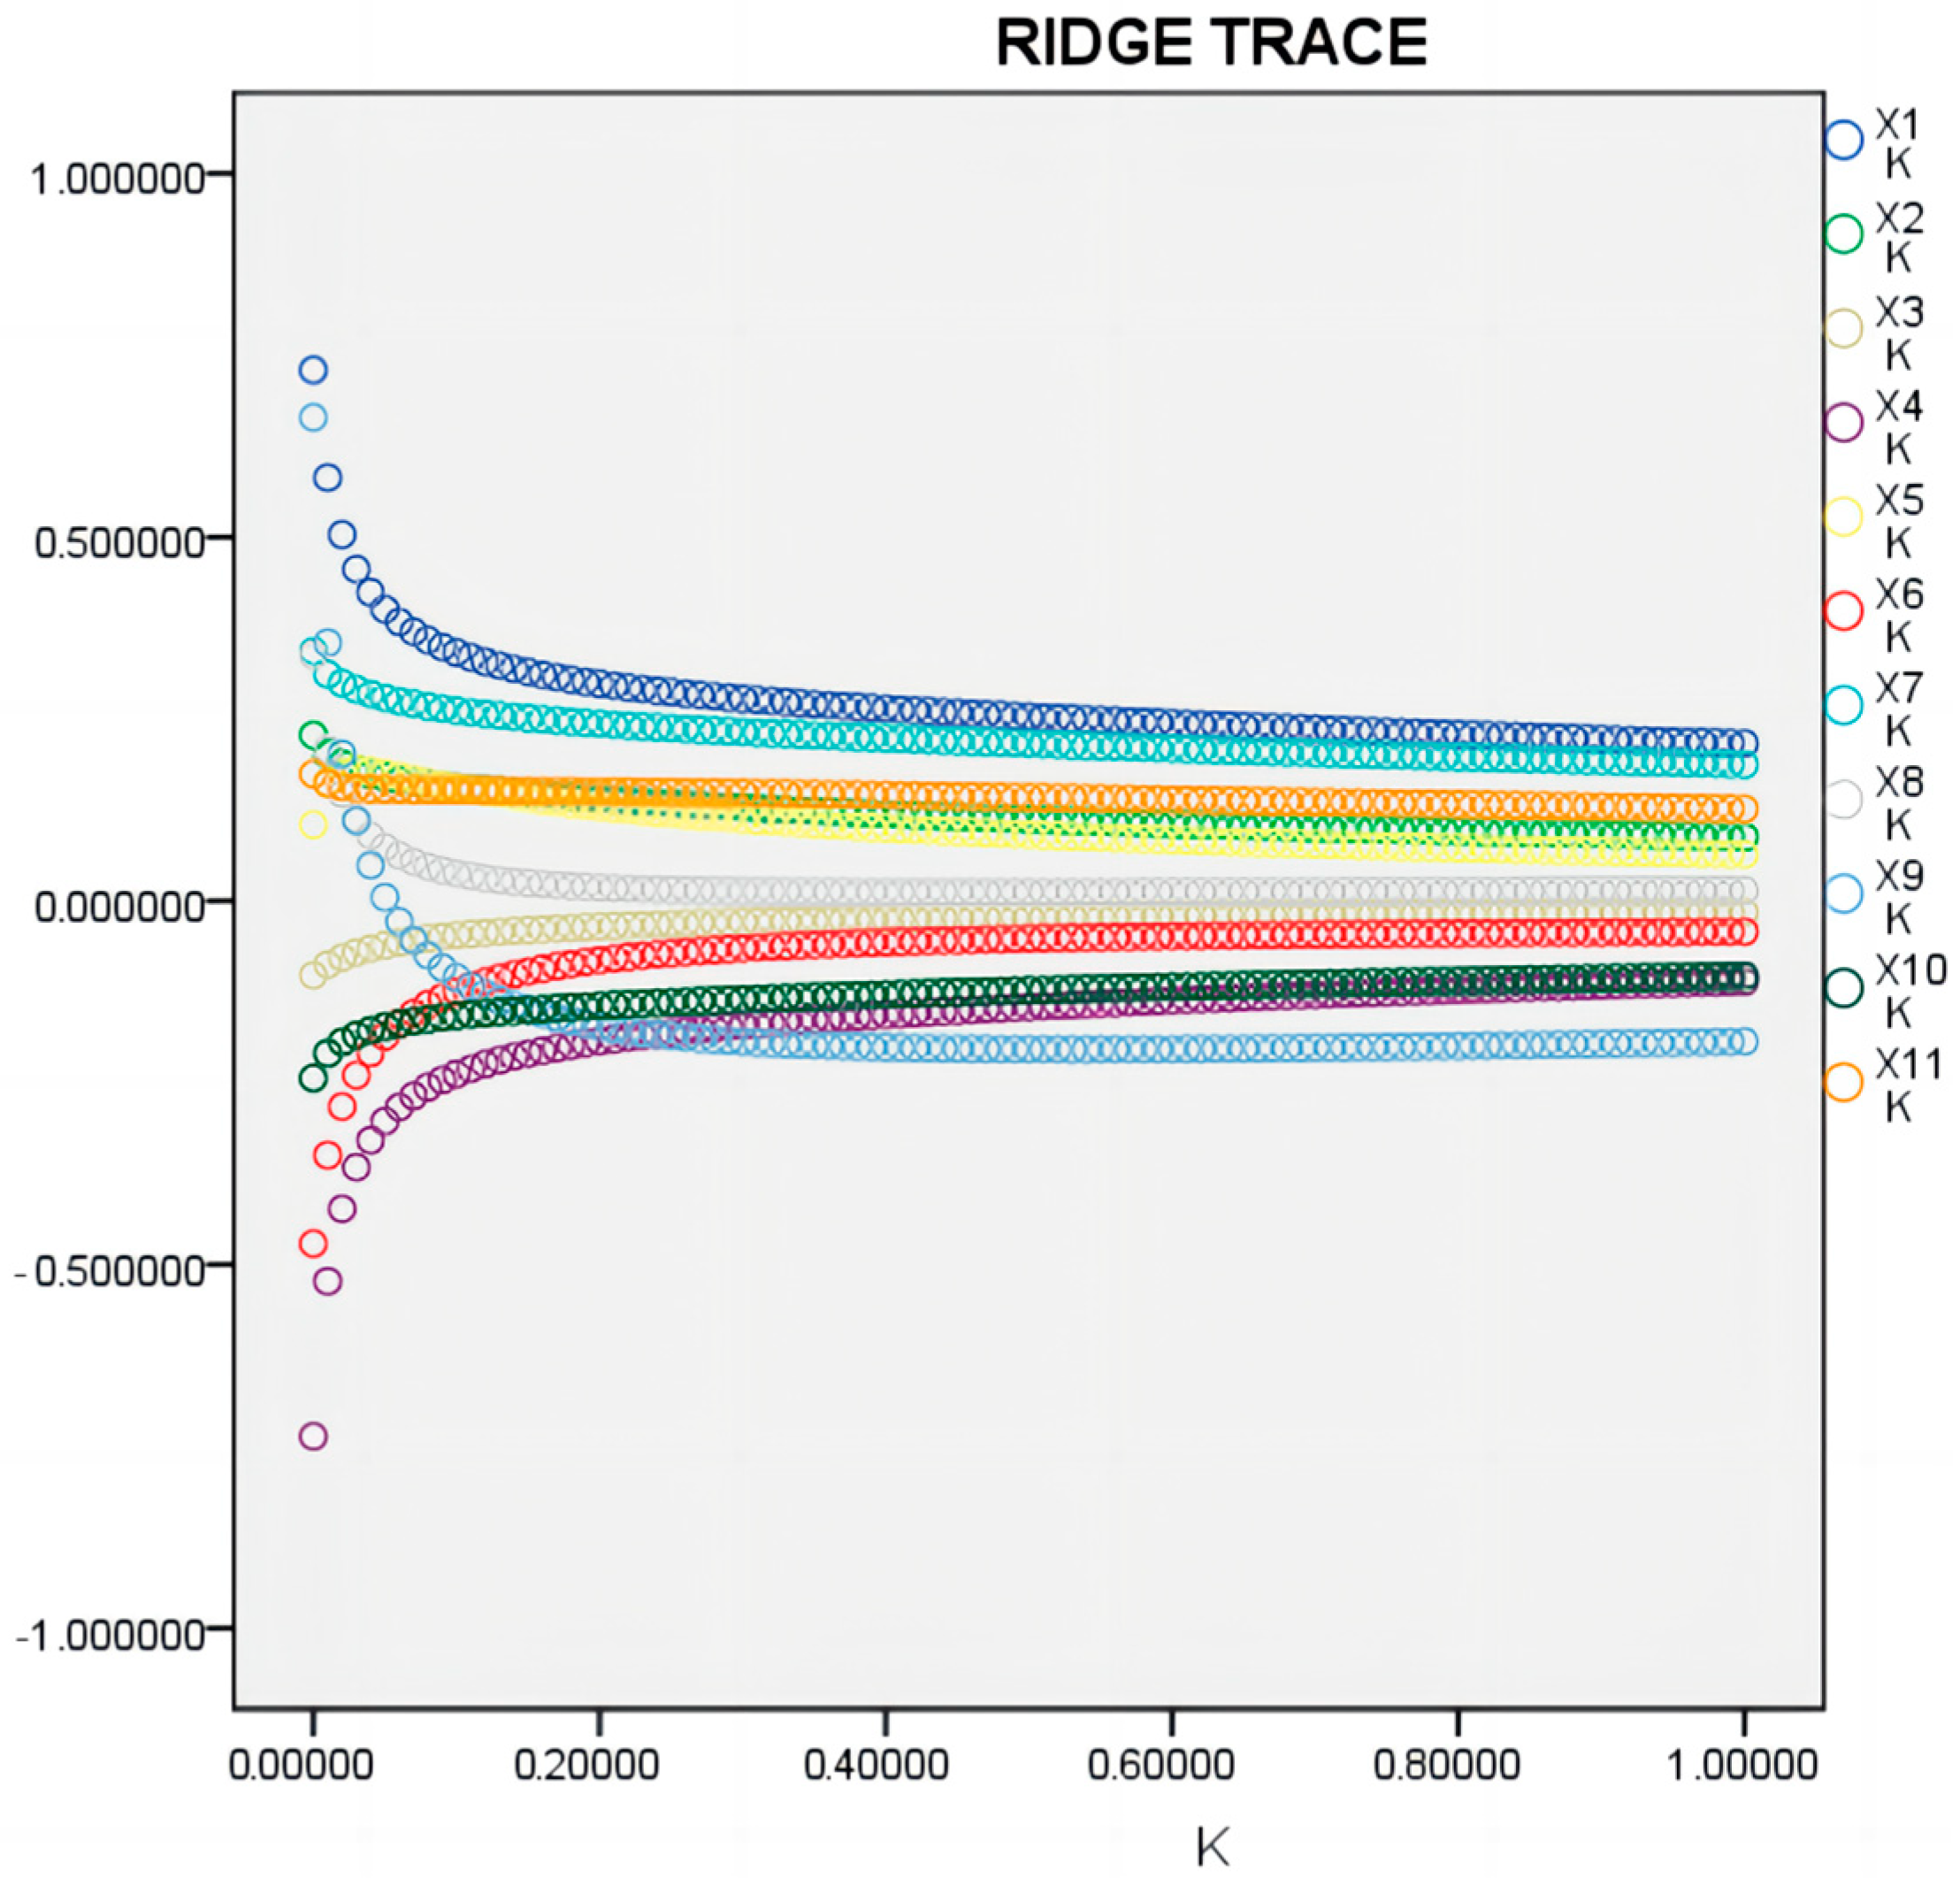
3.2. Extended STIRPAT Model
3.3. Data Sources
4. Results
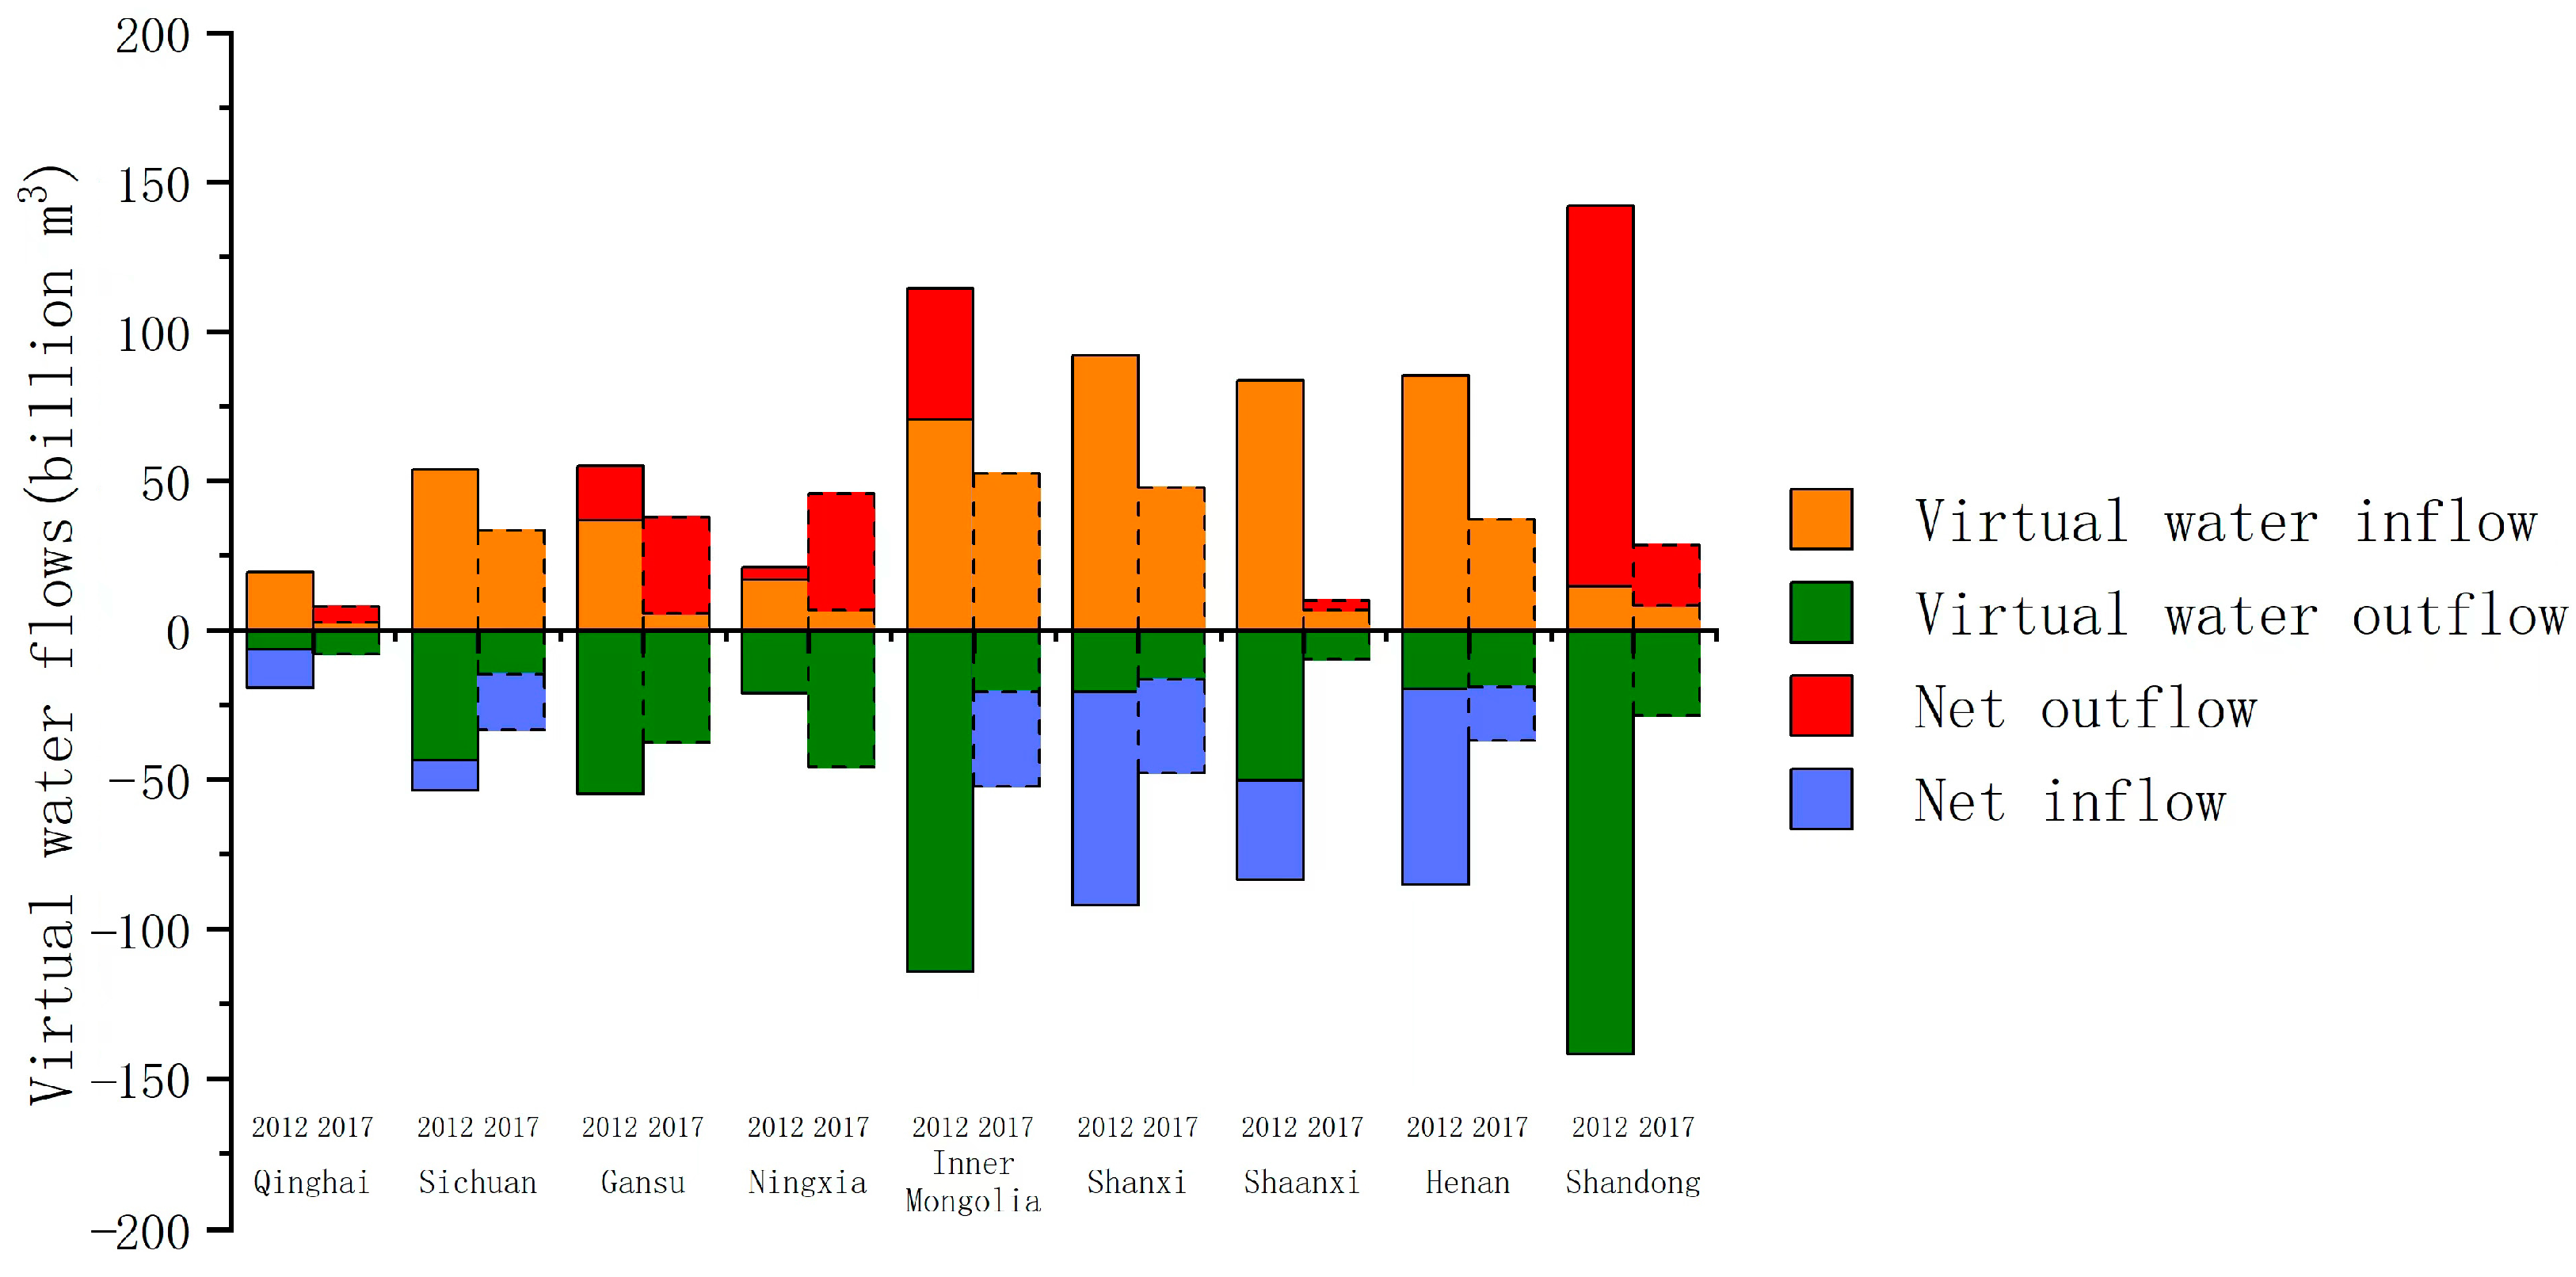
4.1. Virtual Water Flow Patterns within and Outside the Yellow River Basin
4.2. Virtual Water Flow Patterns between Provinces within the Yellow River Basin
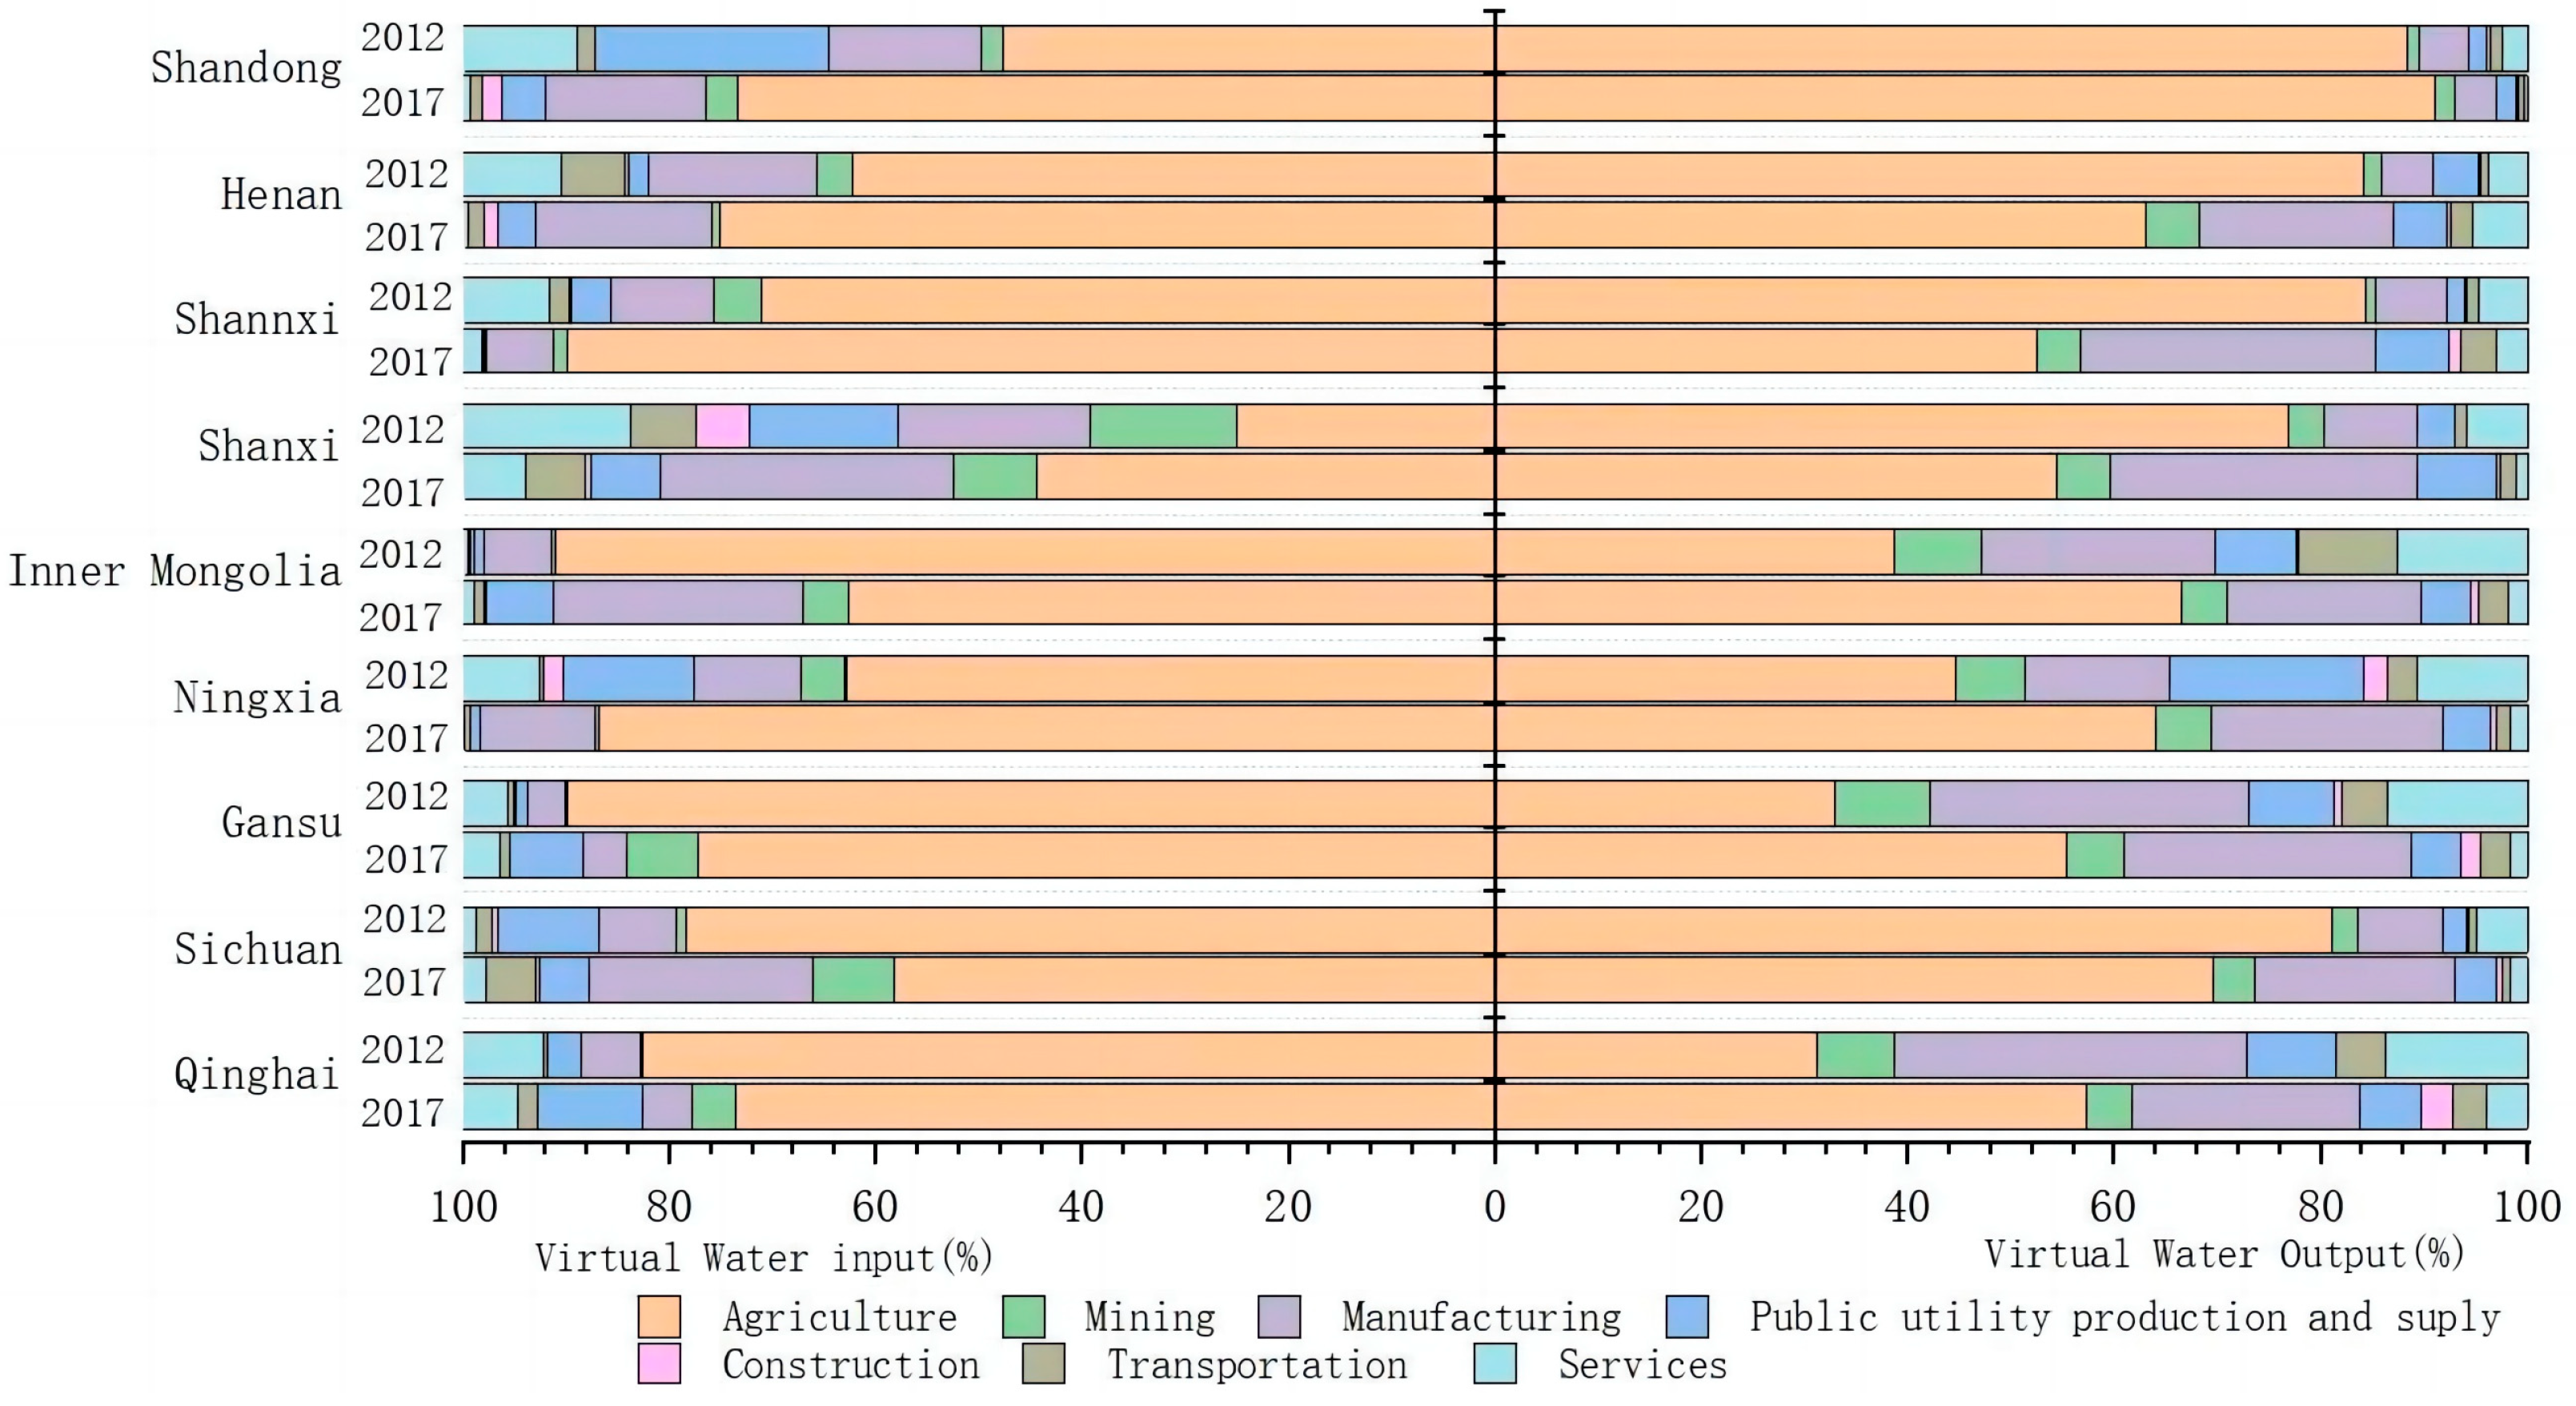
4.3. Virtual Water Flow Patterns in the Yellow River Basin by Sector
4.4. Analysis of Drivers of Virtual Water Flow Patterns in the Yellow River Basin
5. Discussion
6. Conclusions
Author Contributions
Funding
Institutional Review Board Statement
Informed Consent Statement
Data Availability Statement
Acknowledgments
Conflicts of Interest
Appendix A

| No. | Industry | Sector |
|---|---|---|
| 1 | Agriculture | Agriculture, Forestry, Animal Husbandry, and Fishery |
| 2 | Mining | Mining and washing of coal; extraction of petroleum and natural gas; mining and processing of metal ores; mining and processing of nonmetal and other ores |
| 3 | Manufacturing | Food and tobacco processing; textile industry; manufacture of leather, fur, feather, and related products; processing of timber and furniture; manufacture of paper, printing, and articles for culture, education, and sports activities; processing of petroleum, coking, processing of nuclear fuel; manufacture of chemical products; manufacture of non-metallic mineral products; smelting and processing of metals; manufacture of metal products; manufacture of special purpose machinery; manufacture of transport equipment; manufacture of communication equipment, computers, and other electronic equipment; manufacture of measuring instruments; other manufacturing and waste resources; repair of metal products, machinery, and equipment |
| 4 | Public utility | Production and distribution of electric power and heat power; production and distribution of gas; production and distribution of tap water |
| 5 | Construction | Construction |
| 6 | Transportation | Transport, storage, and postal services |
| 7 | Services | Wholesale and retail trades; accommodation and catering; information transfer, software, and information technology services; finance; real estate; leasing and commercial services; scientific research; polytechnic services; administration of water, environment, and public facilities; resident, repair, and other services; education; health care and social work; culture, sports, and entertainment; public administration, social insurance, and social organizations |
Appendix B
References
- Chen, X.; Zhao, B.; Shuai, C.; Qu, S.; Xu, M. Global spread of water scarcity risk through trade. Resour. Conserv. Recycl. 2022, 187, 106643. [Google Scholar] [CrossRef]
- Hoekstra, A.Y.; Mekonnen, M.M.; Chapagain, A.K.; Mathews, R.E.; Richter, B.D. Global monthly water scarcity: Blue water footprints versus blue water availability. PLoS ONE 2012, 7, e32688. [Google Scholar] [CrossRef] [PubMed]
- Greve, P.; Kahil, T.; Mochizuki, J.; Schinko, T.; Satoh, Y.; Burek, P.; Fischer, G.; Tramberend, S.; Burtscher, R.; Langan, S.; et al. Global assessment of water challenges under uncertainty in water scarcity projections. Nat. Sustain. 2018, 1, 486–494. [Google Scholar] [CrossRef] [Green Version]
- Chen, W.; Wu, S.; Lei, Y.; Li, S. China’s water footprint by province, and inter-provincial transfer of virtual water. Ecol. Indic. 2017, 4, 321–333. [Google Scholar] [CrossRef]
- Feng, K.; Siu, Y.L.; Guan, D.; Hubacek, K. Assessing regional virtual water flows and water footprints in the Yellow River Basin, China: A consumption based approach. Appl. Geogr. Dev. 2012, 32, 691–701. [Google Scholar] [CrossRef]
- Zhang, C.; Oki, T. Optimal Multi-Sectoral Water Resources Allocation Based on Economic Evaluation Considering the Environmental Flow Requirements: A Case Study of Yellow River Basin. Water 2021, 13, 2253. [Google Scholar] [CrossRef]
- Allan, J.A. Virtual water: A strategic resource global solutions to regional deficits. Ground Water 1998, 36, 545–546. [Google Scholar] [CrossRef]
- Hasily, M.A.; Golabi, M.; Nasab, S.B. Study and evaluation of irrigation and drainage networks using analytic hierarchy process in Khuzestan Province: A virtual water approach. Agric. Water Manag. 2020, 241, 106305. [Google Scholar] [CrossRef]
- Chenoweth, J.; Hadjikakou, M.; Zoumides, C. Quantifying the human impact on water resources: A critical review of the water footprint concept. Hydrol. Earth Syst. Sci. 2014, 18, 2325–2342. [Google Scholar] [CrossRef] [Green Version]
- Hoekstra, A.Y.; Chapagain, A.K.; Aldaya, M.M.; Mekonnen, M.M. The water footprint assessment manual: Setting the Global Standard. Soc. Environ. Account. J. 2011, 31, 181–182. [Google Scholar]
- Allan, J.A. Fortunately there are substitutes for water otherwise our hydro-political futures would be impossible. Priorities Water Resour. Alloc. Manag. Lond. Off. Dev. Assist. 1993, 13, 26. [Google Scholar]
- Tian, G.; Li, J.; Li, L. Study on the virtual water flow pattern of Yangtze River economic zone based on multi-regional input-output model. Chin. Popul. Resour. Environ. 2019, 29, 81–88. [Google Scholar]
- Yang, Z.; Zhi, Y.; Yin, X. Advances in virtual water research. Adv. Sci. Technol. Water. Resour. 2015, 35, 181–190. [Google Scholar]
- Leontief, W.W. Quantitative Input and Output Relations in the Economic Systems of the United States. Rev. Econ. Stat. 1936, 18, 105–125. [Google Scholar] [CrossRef] [Green Version]
- Guan, S.; Han, M.; Wu, X.; Guan, C.; Zhang, B. Exploring energy-water-land nexus in national supply chains: China 2012. Energy 2019, 185, 1225–1234. [Google Scholar] [CrossRef]
- Wu, X.; Guo, J.; Li, C.; Shao, L.; Han, M.; Chen, G. Global socio-hydrology: An overview of virtual water use by the world economy from source of exploitation to sink of final consumption. J. Hydrol. 2019, 573, 794–810. [Google Scholar] [CrossRef]
- Chen, W.; Kang, J.; Han, M. Global environmental inequality: Evidence from embodied land and virtual water trade. Sci. Total Environ. 2021, 783, 146992. [Google Scholar] [CrossRef]
- An, T.; Wang, L.; Gao, X.; Han, X.; Zhao, Y.; Lin, L.; Wu, P. Simulation of the virtual water flow pattern associated with interprovincial grain trade and its impact on water resources stress in China. J. Clean. Prod. 2021, 288, 125670. [Google Scholar] [CrossRef]
- Lin, L.; Chen, Y.D.; Hua, D.; Liu, Y.; Yan, M. Provincial virtual energy-water use and its flows within China: A multiregional input-output approach. Resour. Conserv. Recycl. Adv. 2019, 151, 104486. [Google Scholar] [CrossRef]
- Zhang, F.; Jin, G.; Liu, G. Evaluation of virtual water trade in the Yellow River Delta, China. Sci. Total Environ. 2021, 784, 147285. [Google Scholar] [CrossRef]
- Ehrlich, P.R.; Holdren, J.P. Impact of population growth. Sci. New Ser. 1971, 171, 1212–1217. [Google Scholar]
- York, R.; Rosa, E.A.; Dietz, T. Bridging environmental science with environmental policy: Plasticity of population, affluence, and technology. Soc. Sci. Q. 2002, 83, 18–34. [Google Scholar] [CrossRef]
- Hu, Y.; Duan, W.; Chen, Y.; Zou, S.; Kayumba, P.M.; Qin, J. Exploring the changes and driving forces of water footprint in Central Asia: A global trade assessment. J. Clean. Prod. 2022, 375, 134062. [Google Scholar] [CrossRef]
- Yan, Y.; Wang, R.; Chen, S.; Zhang, Y.; Sun, Q. Three-dimensional agricultural water scarcity assessment based on water footprint: A study from a humid agricultural area in China. Sci. Total Environ. 2023, 857, 159407. [Google Scholar] [CrossRef] [PubMed]
- Administrative Division of the Yellow River Basin. 2011. Available online: http://www.yrcc.gov.cn/hhyl/hhgk/hd/lyfw/201108/t20110814_103296.html (accessed on 11 November 2022).
- Yin, Y.; Tang, Q.; Liu, X.; Zhang, X. Water scarcity under various socio-economic pathways and its potential effects on food production in the Yellow River basin. Hydrol. Earth Syst. Sci. 2017, 21, 791–804. [Google Scholar] [CrossRef] [Green Version]
- Zhuo, L.; Hoekstra, A.Y.; Wu, P.; Zhao, X. Monthly blue water footprint caps in a river basin to achieve sustainable water consumption: The role of reservoirs. Sci. Total Environ. 2019, 650, 891–899. [Google Scholar] [CrossRef] [Green Version]
- Tian, G.; Han, X.; Zhang, C.; Li, J.; Liu, J. Virtual Water Flows Embodied in International and Interprovincial Trade of Yellow River Basin: A Multiregional Input-Output Analysis. Sustainability 2020, 12, 1251. [Google Scholar] [CrossRef] [Green Version]
- Wang, Y.; Liu, B.; Peng, S.; Cai, S.; Zhang, D. Review of the Implementation of the Yellow River Water Allocation Scheme for Thirty Years. Yellow River 2018, 246, 01023. [Google Scholar]
- Ni, Y.; Yu, Z.; Lv, X.; Qin, T.; Yan, D.; Zhang, Q.; Ma, L. Spatial difference analysis of the runoff evolution attribution in the Yellow River Basin. J. Hydrol. Reg. Stud. 2022, 612, 128149. [Google Scholar] [CrossRef]
- Lu, R.; Wei, D.; Ma, L.; Xu, M. A strategic study on water ecological protection of the Yellow River Basin for high-quality development. Environ. Prot. Sci. 2022, 49, 1–7. [Google Scholar]
- National Bureau of Statistics of the People’s Republic of China. China Statistical Yearbook 2018; China Statistics Press: Beijing, China, 2018.
- York, R.; Rosa, E.A.; Dietz, T. STIRPAT, IPAT and ImPACT: Analytic tools for unpacking the driving forces of environmental impacts. Ecol. Econ. 2003, 46, 351–365. [Google Scholar] [CrossRef]
- Khan, A.N.; En, X.; Raza, M.Y.; Khan, N.A.; Ali, A. Sectorial study of technological progress and CO2 emission: Insights from a developing economy. Technol. Forecast. Soc. Chang. 2020, 151, 119862. [Google Scholar] [CrossRef]
- Wang, P.; Wu, W.; Zhu, B.; Wei, Y. Examining the impact factors of energy-related CO2 emissions using the STIRPAT model in Guangdong Province, China. Appl. Energy 2013, 106, 65–71. [Google Scholar] [CrossRef]
- Liu, H.; Deng, G.; Wang, K. Analysis of factors influencing virtual water consumption of agricultural products in China—A dynamic spatial panel STIRPAT model based on provincial data. Chin. Rural. Econ. 2013, 08, 15–28. [Google Scholar]
- Zeng, X.; Duan, C.; Wang, R. Study on virtual water transfer in China’s agricultural trade and its influencing factors. Chin. Environ. Sci. 2021, 41, 983–992. [Google Scholar]
- Zhuo, L.; Li, M.; Wu, P.; Huang, H.; Liu, Y. Spatial and temporal evolution and driving forces of coupled physical and virtual water flows for crop production and consumption in the Yellow River basin. J. Water. Resour. 2020, 51, 1059–1069. [Google Scholar]
- Li, M.; Pan, Z.; Li, C. Import trade patterns and factors influencing virtual water imports of grain crops in China. Agric. Mod. Res. 2022, 43, 715–725. [Google Scholar]
- Tian, G.; Sheng, Y.; Lu, X. Study on the impact of water rights trading market operation on water resources utilization efficiency in pilot areas. Chin. Popul. Resour. Environ. 2020, 30, 146–155. [Google Scholar]
- Carbon Emission Accounts and Datasets. Available online: https://www.ceads.net.cn/ (accessed on 11 November 2022).
- National Bureau of Statistics. Available online: http://www.stats.gov.cn/ (accessed on 11 November 2022).
- Ministry of Water Resources of the People’s Republic of China. Available online: http://www.mwr.gov.cn/sj/tjgb/szygb/ (accessed on 11 November 2022).
- Ministry of Housing and Urban-Rural Development of the People’s Republic of China. Available online: https://www.mohurd.gov.cn/gongkai/fdzdgknr/sjfb/tjxx/jstjnj/index.html (accessed on 11 November 2022).
- Yellow River Conservancy Commission of the Ministry of Water Resources. Available online: http://www.yrcc.gov.cn/zwzc/gzgb/gb/szygb/ (accessed on 11 November 2022).
- Yu, S.; Zhang, Q.; Hao, J.L.; Ma, W.; Sun, Y.; Wang, X.; Song, Y. Development of an extended STIRPAT model to assess the driving factors of household carbon dioxide emissions in China. J. Environ. Manag. 2022, 325, 116502. [Google Scholar] [CrossRef]


| Intermediate Use | Final Use | Export | Total Output | |||||||||||||||
|---|---|---|---|---|---|---|---|---|---|---|---|---|---|---|---|---|---|---|
| Qinghai | … | Shandong | Other Provinces | Qinghai | … | Shandong | Other Provinces | |||||||||||
| Sector 1…Sector 42 | … | Sector 1…Sector 42 | Sector 1…Sector 42 | |||||||||||||||
| Intermediate Use | Qinghai | Sector 1 | … | … | … | … | … | |||||||||||
| … | … | … | … | … | … | … | … | …. | … | … | … | … | … | … | … | … | ||
| Sector 42 | … | … | … | … | … | |||||||||||||
| ... | … | … | … | … | … | … | … | … | … | … | … | … | … | … | … | … | … | |
| Shandong | Sector 1 | … | … | … | … | … | ||||||||||||
| … | … | … | … | … | … | … | … | … | … | … | … | … | … | … | … | … | ||
| Sector 42 | … | … | … | … | … | |||||||||||||
| Other Provinces | Sector 1 | … | … | … | … | … | ||||||||||||
| … | … | … | … | … | … | … | … | … | … | … | … | … | … | … | … | … | ||
| Sector 42 | … | … | … | … | … | |||||||||||||
| Import | … | … | … | … | ||||||||||||||
| Value added | … | … | … | … | ||||||||||||||
| Total input | … | … | … | … | ||||||||||||||
| Indicator Category | Driving Factors | Variable Symbols | Definition | Unit |
|---|---|---|---|---|
| Demographic indicators | Population size | x1 | Population size | 10,000 people |
| Economic indicators | GDP per capita | x2 | GDP/Population Size | Yuan/person |
| Primary industry contribution rate | x3 | Primary sector GDP/Total GDP | % | |
| Tertiary industry contribution rate | x4 | Tertiary sector GDP/Total GDP | % | |
| Consumer Price Index | x5 | Trends and extent of changes in consumer prices | / | |
| Agricultural production price index | x6 | Trends and extent of changes in the price level of agricultural products | / | |
| Government expenditure level | x7 | Government spending | Billion | |
| Technical specifications | Water use efficiency | x8 | Water consumption/water withdrawal | % |
| Water consumption per unit of arable land area | x9 | Water consumption per unit of arable land area | m3/ha | |
| Natural indicators | Water resources per capita | x10 | Total water resources/population size | m3/person |
| Water scarcity level | x11 | Current year’s water resource change from the previous year/previous year’s water resources | % |
| Model Used | Data Classification | Data Sources |
|---|---|---|
| Multi-regional input-output model | Input and output data by province and region | China Regional Input–Output Tables (2012 and 2017) [41] |
| Water use data by sector in each province and region | China Statistical Yearbook (2012 and 2017) [42], China Water Resources Bulletin (2012 and 2017) [43], China Urban and Rural Construction Statistical Yearbook (2012 and 2017) [44] | |
| Extended STIRPAT model | Population size, GDP per capita, Value added of primary industry, Consumer price index, Water resources per capita, Water consumption per unit arable land area | The official website of the National Bureau of Statistics [42] |
| Value added of tertiary industry, Government expenditures | China Statistical Yearbook (2012 and 2017) [42] | |
| Total water resources, Water supply and consumption data | Yellow River Water Resources Bulletin (2012 and 2017) [45] | |
| Agricultural production price index | China Agricultural Yearbook (2012 and 2017) [42] |
| Year | Virtual Water Flow Direction | Upper Reaches | Middle Reaches | Lower Reaches | ||||||||||
|---|---|---|---|---|---|---|---|---|---|---|---|---|---|---|
| Qinghai | Sichuan | Gansu | Ningxia | Inner Mongolia | Total | Shanxi | Shaanxi | Total | Henan | Shandong | Total | |||
| 2012 | Virtual water inflow | In-basin inflow | 19.33 | 53.78 | 36.72 | 16.81 | 70.52 | 197.16 | 92.13 | 83.62 | 175.75 | 85.21 | 14.70 | 99.91 |
| Out-of-basin inflow | 124.39 | 213.76 | 61.81 | 22.82 | 50.87 | 473.65 | 64.87 | 160.84 | 225.71 | 350.99 | 552.03 | 903.02 | ||
| Total inflow | 143.72 | 267.55 | 98.53 | 39.64 | 121.39 | 670.82 | 157.00 | 244.46 | 401.46 | 436.20 | 566.73 | 1002.93 | ||
| Virtual water outflow | In-basin outflow | 6.36 | 43.59 | 54.82 | 21.00 | 114.33 | 240.11 | 20.64 | 50.26 | 70.90 | 19.82 | 242.00 | 261.82 | |
| Out-of-basin outflow | 62.25 | 322.37 | 107.85 | 35.55 | 50.40 | 578.43 | 107.55 | 130.70 | 238.25 | 245.35 | 418.91 | 664.25 | ||
| Total outflow | 68.61 | 365.96 | 162.67 | 56.56 | 164.74 | 818.54 | 128.19 | 180.96 | 309.15 | 265.16 | 660.91 | 926.08 | ||
| Virtual water net outflow | −75.11 | 98.42 | 64.14 | 16.92 | 43.35 | 147.72 | −28.81 | −63.50 | −92.31 | −171.04 | 94.19 | −76.85 | ||
| 2017 | Virtual water inflow | In-basin inflow | 2.74 | 33.38 | 5.56 | 6.75 | 52.37 | 100.79 | 47.76 | 6.74 | 54.50 | 36.95 | 8.39 | 45.33 |
| Out-of-basin inflow | 26.29 | 199.90 | 54.53 | 64.21 | 14.92 | 359.84 | 26.99 | 55.98 | 82.97 | 182.64 | 323.15 | 505.79 | ||
| Total inflow | 29.03 | 233.28 | 60.09 | 70.96 | 67.28 | 460.63 | 74.76 | 62.71 | 137.47 | 219.59 | 331.53 | 551.13 | ||
| Virtual water outflow | In-basin outflow | 7.86 | 14.76 | 37.62 | 45.71 | 20.63 | 126.58 | 16.52 | 9.87 | 26.40 | 19.16 | 28.48 | 47.65 | |
| Out-of-basin outflow | 24.96 | 110.80 | 94.24 | 72.25 | 39.71 | 341.96 | 71.52 | 33.03 | 104.55 | 94.64 | 70.73 | 165.37 | ||
| Total outflow | 32.82 | 125.57 | 131.86 | 117.96 | 60.34 | 468.55 | 88.04 | 42.90 | 130.94 | 113.80 | 99.21 | 213.02 | ||
| Virtual water net outflow | 3.79 | −107.71 | 71.77 | 47.01 | −6.94 | 7.91 | 13.29 | −19.82 | −6.53 | −105.79 | −232.32 | −338.11 | ||
| Indicator Category | Driving Factors | Variable Symbols | Tolerances | Variance Inflation Factor |
|---|---|---|---|---|
| Demographic indicators | Population size | x1 | 0.005 | 203.34 |
| Economic Indicators | GDP per capita | x2 | 0.062 | 16.10 |
| Contribution rate of primary industry | x3 | 0.184 | 5.45 | |
| Tertiary industry contribution rate | x4 | 0.045 | 22.03 | |
| Consumer price index | x5 | 0.067 | 14.89 | |
| Agricultural production price index | x6 | 0.068 | 14.75 | |
| Government spending levels | x7 | 0.004 | 275.32 | |
| Technical Specifications | Water use efficiency | x8 | 0.184 | 5.45 |
| Water consumption per unit of arable land area | x9 | 0.039 | 25.58 | |
| Natural Indicators | Water resources per capita | x10 | 0.129 | 7.78 |
| Water scarcity level | x11 | 0.154 | 6.48 |
| Indicator Category | Driving Factors | Variable Symbols | Virtual Water Inflow | Virtual Water Outflow | Net Virtual Water Outflow | Net Virtual Water Outflow between Internal Provinces |
|---|---|---|---|---|---|---|
| Demographic indicators | Population size | x1 | 0.054 | 0.174 | −0.349 | −0.002 |
| Economic Indicators | GDP per capita | x2 | 1.179 | −0.278 | −1.236 | −0.053 |
| Primary industry contribution rate | x3 | −0.374 | 0.054 | 0.045 | 1.404 | |
| Tertiary industry contribution rate | x4 | 0.520 | −0.795 | −2.493 | 0.247 | |
| Consumer price index | x5 | 3.692 | 0.234 | −3.433 | −0.043 | |
| Agricultural production price index | x6 | −1.172 | −1.273 | −0.043 | −0.162 | |
| Government expenditure level | x7 | 0.023 | 0.034 | 0.034 | 0.002 | |
| Technical Specifications | Water use efficiency | x8 | −0.021 | 0.017 | −0.043 | −0.156 |
| Water consumption per unit of arable land area | x9 | 0.002 | −0.198 | 0.253 | 0.057 | |
| Natural Indicators | Water resources per capita | x10 | −0.138 | 0.280 | 0.035 | −0.026 |
| Water scarcity level | x11 | 2.303 | −1.765 | −3.490 | −2.267 |
Disclaimer/Publisher’s Note: The statements, opinions and data contained in all publications are solely those of the individual author(s) and contributor(s) and not of MDPI and/or the editor(s). MDPI and/or the editor(s) disclaim responsibility for any injury to people or property resulting from any ideas, methods, instructions or products referred to in the content. |
© 2023 by the authors. Licensee MDPI, Basel, Switzerland. This article is an open access article distributed under the terms and conditions of the Creative Commons Attribution (CC BY) license (https://creativecommons.org/licenses/by/4.0/).
Share and Cite
Xu, Y.; Tian, G.; Xu, S.; Xia, Q. Analysis of Virtual Water Flow Patterns and Their Drivers in the Yellow River Basin. Sustainability 2023, 15, 4393. https://doi.org/10.3390/su15054393
Xu Y, Tian G, Xu S, Xia Q. Analysis of Virtual Water Flow Patterns and Their Drivers in the Yellow River Basin. Sustainability. 2023; 15(5):4393. https://doi.org/10.3390/su15054393
Chicago/Turabian StyleXu, Yike, Guiliang Tian, Shuwen Xu, and Qing Xia. 2023. "Analysis of Virtual Water Flow Patterns and Their Drivers in the Yellow River Basin" Sustainability 15, no. 5: 4393. https://doi.org/10.3390/su15054393
APA StyleXu, Y., Tian, G., Xu, S., & Xia, Q. (2023). Analysis of Virtual Water Flow Patterns and Their Drivers in the Yellow River Basin. Sustainability, 15(5), 4393. https://doi.org/10.3390/su15054393