1. Introduction
Currently, the world faces multiple challenges such as a warming climate, the energy crisis, and environmental degradation [
1]. To address these challenges, the United Nations has set 17 Sustainable Development Goals (SDGs), including climate action and renewable energy. Many countries have begun to promote the development of a green economy to adapt to global climate change and increasing ecological dangers [
2]. China is the world’s second-largest economy and has been growing consistently and steadily for more than 40 years since its opening and reform. However, in maintaining economic growth, a large amount of ecological space has been compromised, and ecological and environmental problems have continued to deteriorate [
3]. According to the joint Global Environmental Performance Index (EPI) Report jointly released in 2020 by Yale University and other research institutions, China ranked 120th with 37.3 points, and its environmental problems were still serious [
4]. Achieving economic growth while considering environmental protection, resource conservation, and the promotion of green economic development has become a difficult problem facing the Chinese government [
5]. To prevent the deterioration of the ecological environment and correctly manage the relationship between economic growth and environmental protection, China has made a series of major strategic decisions. The 18th Party Congress included the construction of an ecological civilization in the overall layout of the country’s economic development for the first time. The 19th National Congress put forward a green, low-carbon, circularly developed economic system. The 20th Congress proposed continuously promoting the green and low-carbon development of the economy and society. China has continuously promoted the adjustment and optimization of industrial and energy structures to achieve the coordinated development of the economy and ecological environment. As green development continues to be integrated into national governance, ways to alleviate ecological problems and develop a green economy are gradually becoming a greater concern. Enhancing the efficiency of green development is one of the most important ways to realize the construction of an ecological civilization, and exploring power sources to effectively enhance the efficiency of green development has become an important academic debate.
The improvement of
GDE is a long-term, continuous process that requires not only guidance from government policies but also the support and participation of modern finance. Financial resources, as the bloodline of the national economy and the core resources of the social economy, can be invested more into the green environmental protection industry through optimal allocation, driving industrial restructuring and green economic development in various regions. However, there is a serious misallocation of resources in China’s financial sector due to the shortcomings of the financial system, government intervention, and ownership discrimination [
6]. The existence of
FM leads to a large number of financial resources flowing to backward industries with low efficiency and high energy consumption at the expense of green, emerging industries and other transformation fields, hindering industrial structure upgrading, slowing down economic growth, aggravating environmental pollution, and affecting the process of green development. Thus, does the misallocation of financial resources inhibit the improvement of
GDE, and, if so, how? To answer these questions, this paper focused on the
GDE as the research object, constructing an
FM index and a
GDE evaluation index system and adopting the fixed effects and quantile regression models to verify the mechanism of influence between
FM and
GDE. This study also explored the means of action and transmission of
FM on
GDE, which is in line with China’s supply-side structural finance reform, as well as the necessity of its support in the creation of a green economy, with “bluer sky, greener mountains, and clearer water” as the development concept.
2. Literature Review
The existing literature has confirmed several primary factors affecting the efficiency of green development, including the level of economic development, industrial structure, enterprise technological innovation, energy structure, human capital, environmental factors, government policies, etc. [
7,
8,
9]. Several studies have also explored the relationship between financial and green development [
10,
11,
12]. To deeply analyze the
FM and its impact on
GDE, we summarized and organized the existing studies into the following three categories.
The first category comprises studies related to the impact of financial resource allocation on green development. Research findings show that finance is one of the most essential tools for promoting green development [
13,
14,
15]. The “financial structure theory” proposed by Goldsmith in the middle of the 20th century systematically argues that financial institutions can promote economic growth through “credit creation capacity” and “resource allocation capacity” [
16]. From the perspective of the relationship between financial development and the green economy, the impact of the former on the latter is twofold. On the one hand, finance itself can expand the scale of the economy through the “scale effect”, “structure effect” and “technology effect” [
17]. The optimization of financial resource allocation guides the allocation, structure, and flow of capital, which promotes the development and deepening of financial scale and structure. Financial development can promote the improvement of
GDE through capital support, resource allocation, enterprise supervision, and green finance. Looking into the coupling and coordination between financial agglomeration and eco-efficiency, some studies have found that financial agglomeration increases the accumulation of various factors, such as talent, information technology, etc., thus promoting the transformation and upgrading of industrial structure and guiding rational resource allocation and the improvement of green development. Others have suggested that developing finance can improve the economic structure and reduce environmental pollution by upgrading equipment and manufacturing processes and adopting more friendly production methods [
18]. On the other hand, improving finance also widens the financing channels of high pollution, high energy consumption, and high emission enterprises [
19], which reduces the overall efficiency of green economic growth. Some scholars believe that a sound financial system can effectively alleviate the information asymmetry problem and broaden financing channels, enabling enterprises to obtain loans at a lower cost. This improvement is conducive to their production expansion (e.g., building new production lines, renting more equipment, and employing more workers) and significantly increases carbon emissions [
20]. Developing the financial sector can provide more and better consumer credit services to promote consumption and encourage consumers to buy more goods, such as properties, cars, and other electrical appliances, but this will result in significant carbon emissions and inhibit the improvement of
GDE [
21,
22].
The second study category is research on the relationship between resource misallocation and total factor productivity. Scholars generally agree that resource misallocation may lead to efficiency losses and intersectoral disparities, but their theoretical lines of analysis differ [
23]. One approach is the “direct method”, which selects a few theoretically and empirically important factors and tests the extent of resource misallocation and the resulting total factor productivity (TFP) loss [
24,
25]. Researchers who hold this view have examined these factors mainly from the perspectives of policy distortions [
26] and institutional distortions [
27]. Another approach, called the “indirect approach,” analyzes all potential factors that may lead to resource misallocation and quantifies their impact on TFP by developing a theoretical model [
28]. Hsieh and Klenow (2009) made a pioneering contribution to this approach [
29]. Starting with firm-level resource mismatch, they developed a micro-to-macro theoretical
framework based on the degree of TFP dispersion and quantified its impact on the total TFP. Since then, other scholars have followed their ideas and refined the theoretical
framework of the impact of resource misallocation on TFP [
24,
30]. Persistent resource misallocation leads not only to total factor productivity loss but also ecological degradation [
31,
32]. On the one hand, lower factor prices reduce producers’ willingness to improve resource use efficiency through technological innovation, leading to stagnation in resource-saving technological progress. On the other hand, a distorted price system does not reflect the scarcity of resource and costs-saving opportunities, and changes in production factors, in turn, hinder the role of factor markets in optimizing resource allocation. Scholars have found that resource misallocation or factor market distortion exacerbates pollution emissions and haze pollution and reduces environmental efficiency, green total factor productivity, green technological progress, and energy efficiency [
33,
34]. The impact of market segmentation on environmental pollution has also been studied from the perspective of resource misallocation, and it was found that market segmentation significantly exacerbates the misallocation of labor and capital resources, which leads to environmental pollution.
In the third category are studies related to the efficiency of green development. Current research on
GDE focuses on several elements. First is the concept of
GDE. Most scholars consider green development a people-centered sustainable development approach [
35,
36,
37,
38,
39]. Green development emphasizes the coordinated development of the economy, society, and ecology [
40]. Second is the measurement of
GDE. Researchers use efficiency measurement methods such as the stochastic frontier approach (SFA), data envelopment analysis (DEA), and the total factor productivity (TFP) approach to evaluate and measure the efficiency of green development at different geographical scales [
41,
42,
43]. Third are the factors affecting the efficiency of green development. Scholars have researched government regulations, technological innovation, regional economy, financial development, energy consumption, and industrial structures [
44,
45,
46,
47]. It is worth noting that while the existing literature has explored the factors influencing the efficiency of green development in some depth, less focus has been placed on examining how to effectively improve the efficiency of green development from the perspective of resource allocation, especially financial resource allocation.
In summary, more studies have been carried out on the impact of financial development on the green economy and the relationship between FM and environmental pollution. The impact on the green economy has also been richly discussed, and the significant impact of FM on the economy and environment has been initially confirmed, but the research on how FM affects GDE is relatively limited. Thus, in this paper, we constructed a theoretical model of FM and GDE, and empirically analyzes the impact mechanism of FM on GDE. The marginal contributions of this study may lie in the following: First, this paper uses unique financial marketization data and employs benchmarking analysis to accurately measure the degree of distortion in the financial markets of each province of China. Second, by including factor mismatch and the structural mismatch of financial resources into a unified research framework, this paper can determine which of the two has a greater impact on GDE, thus providing a more targeted reference basis for formulating relevant policies. Third, based on the theoretical analysis, this paper also uses the mediating effect model to test the mechanism of the role of FM in GDE and examines the impact of different degrees of financial marketization on GDE, further expanding the GDE research perspective.
3. Theoretical Mechanism and Research Hypotheses
The improvement of
GDE mainly comes from green technology innovation and resource allocation efficiency [
48]. Since green technological innovation is difficult to achieve in the short term, the existing literature focuses more on the impact of resource allocation efficiency optimization on
GDE. At present, the degree of development in China’s financial market is still far below that of the product market. Although competition in the financial industry has increased in recent years, several large state-controlled banks still hold a high market share, making the market too concentrated, and the allocation of credit funds is still, to some extent, influenced by nonmarket factors [
49]. This means that some new industries with better prospects face the problem of insufficient funds and, to a certain extent, this breeds financial leakage and rent-seeking behavior. This further intensifies the
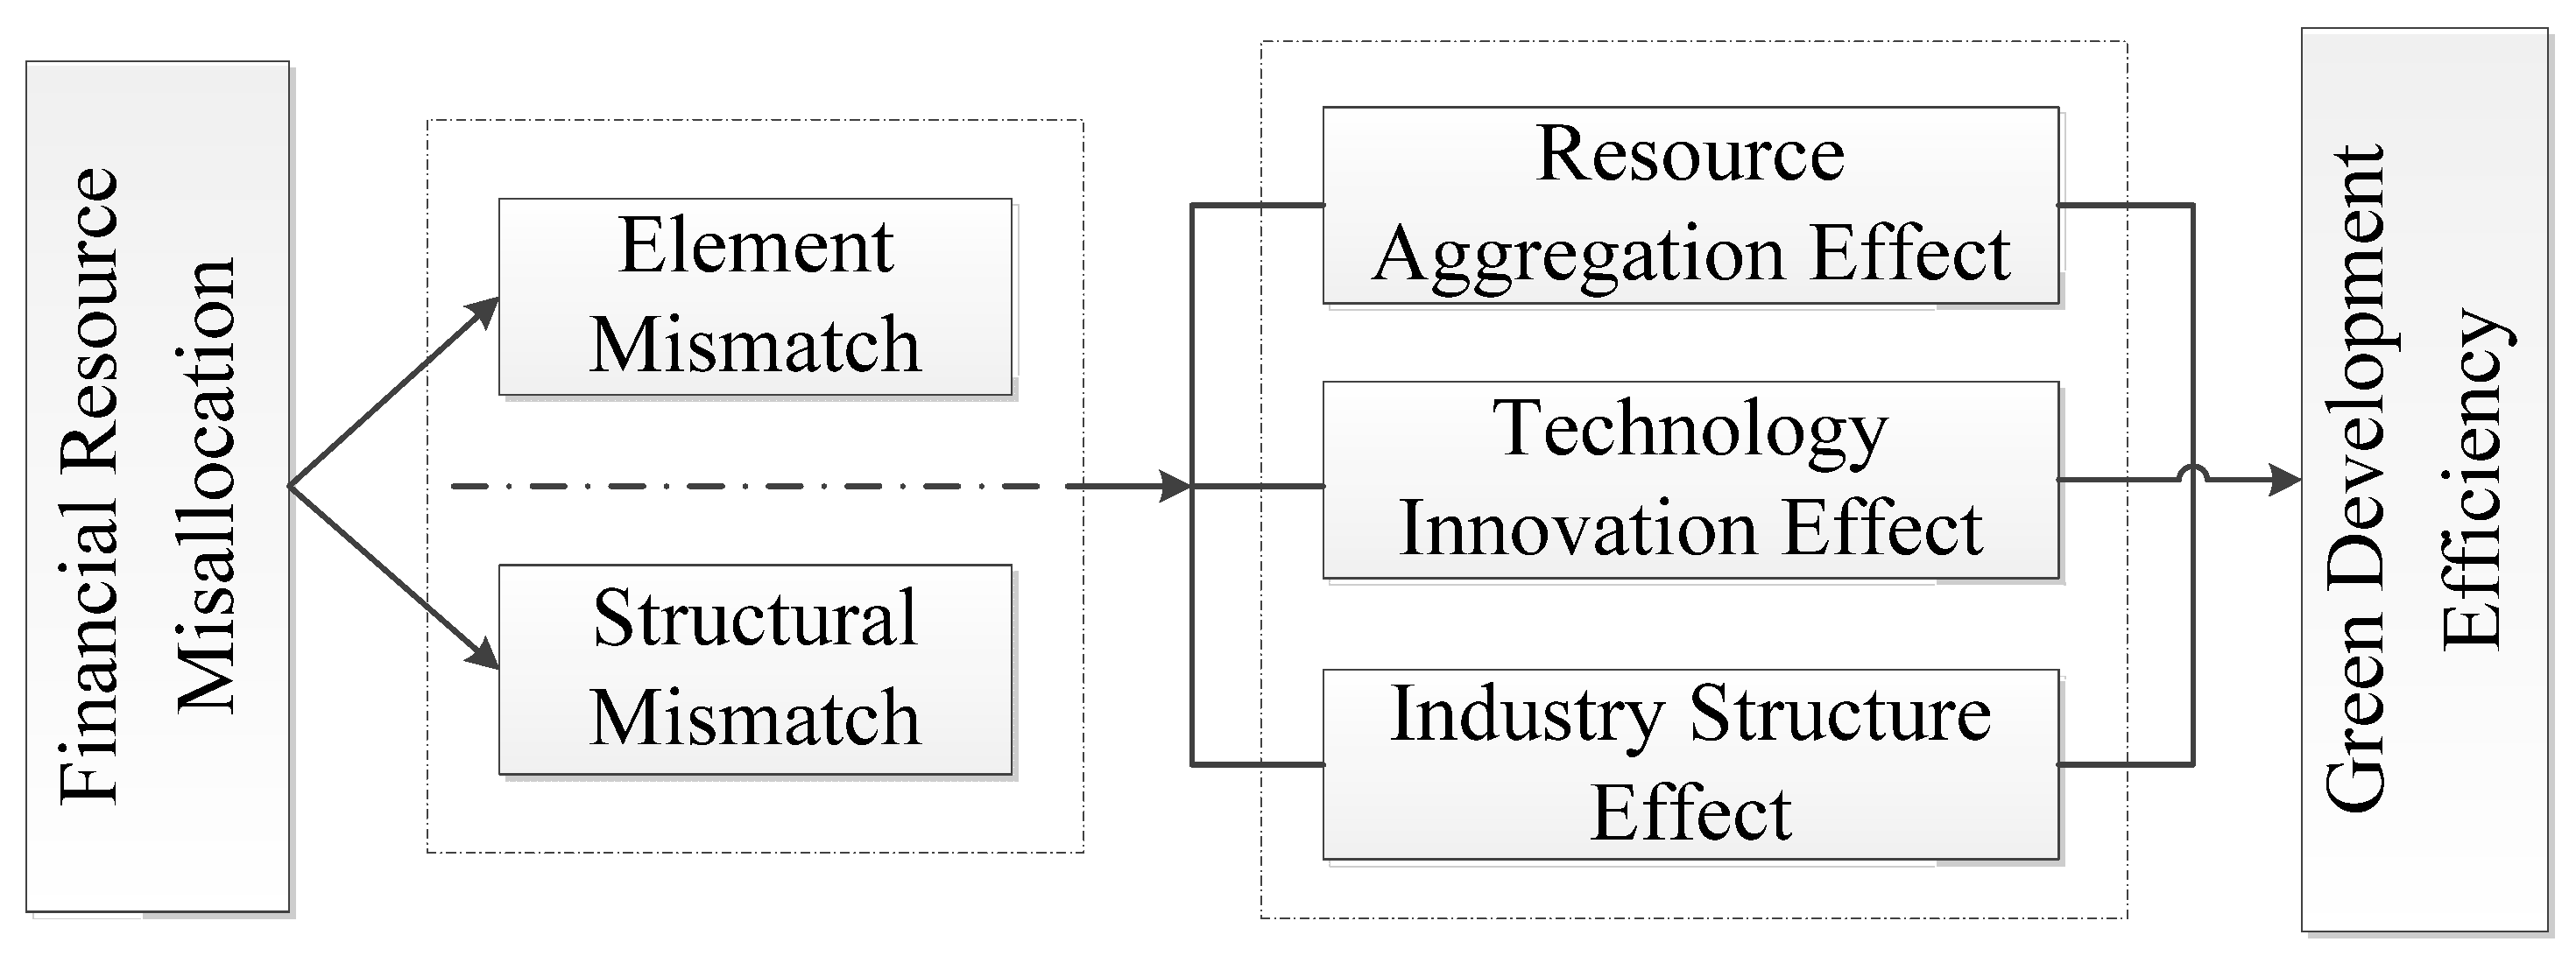
FM phenomenon, leading to a series of problems. For example, regions with richer financial resources may have problems such as overinvestment and overcapacity. In contrast, regions with insufficient financial resources face higher financing constraints on enterprise development, crowding out funds for green technology R&D and innovation, which affects the overall development of the green industry. By combing and summarizing the existing literature, this study can qualitatively analyze whether financial resource mismatches can affect the efficiency of green development through mechanisms such as financial resource agglomeration, enterprise technological innovation, and industrial structure. The impact path is shown in
Figure 1.
3.1. Financial Resources Agglomeration Effect
According to the theory of agglomeration economy, the rapid concentration and coordinated combination of financial resources can optimize resource allocation and accelerate the flow of regional factors, which have a positive effect on the improvement of
GDE through the sharing and resource-saving effects [
50]. First, the concentration of financial resources can promote their optimal allocation and information exchange; reduce the transaction costs of financial services; promote the optimization of regional savings and investment structures; improve the flow, frequency of use, and investment efficiency of capital factors; relieve the constraints of enterprise financing and credit; and better support enterprise technological innovation, and enhance the efficiency of green development [
51]. Second, the agglomeration of financial resources promotes the flow of funds from investment projects with low efficiency and high pollution to investment projects with high efficiency and low pollution, realizing the rational allocation of financial capital and improving energy-saving efficiency [
52], thus promoting the development of the green economy. Third, financial agglomeration can absorb more production factors, such as human capital, technology, and knowledge, into regional economic development; strengthen competition in regional financial markets; and help the real economy continuously innovate green technology and expand green markets and specialized divisions of labor to provide green services and green products for social development. Financial agglomeration can bring high-quality economic growth and improve green economic efficiency. However, mismatched financial resources inhibit their concentration to a certain extent, affecting the improvement of
GDE. On the one hand, the free flow of financial resources is restricted due to financial market distortions, resulting in an inability to allocate financial resources to the most efficient places [
53]. Many financial resources go to state-owned enterprises, including many heavy capital industries with high pollution and high energy consumption, while some new, green industries face difficulties in financing. Under such circumstances, the economy will fail to achieve Pareto optimal allocation and experience efficiency loss. Therefore, this paper proposes Hypothesis 1.
Hypothesis 1. Financial resource misallocation will inhibit the concentration of financial resources, which in turn will inhibit the improvement of green development efficiency.
3.2. Enterprise Technological Innovation Effect
Enterprise green technology innovation is the internal driving force for improving
GDE [
54]. The mismatching of financial resources has a significant inhibitory effect on enterprises’ green technology innovation activities, which may hinder the improvement of
GDE as a whole. Enterprise innovation is a long-term activity that requires a large number of resources and high risk. The inhibitory effect of
FM on corporate innovation manifests in two ways. First, it increases the enterprises’ innovation cost. Financing-constrained enterprises need to bear higher interest rates or “rent”, and rent-seeking and other higher-risk businesses need to pay more for human and material resources, which undoubtedly increases the cost of innovation and inhibits the ability of enterprises to innovate [
55]. Second is enterprise innovation resource crowding. Enterprises with more financial resources allocated have lower financing costs and fewer difficulties in financing than other enterprises, leading them to high-input and high-risk innovation projects and developing businesses that can obtain high returns faster, thus inhibiting the improvement of their innovation ability. In addition, state-owned enterprises (SOEs), as strategic pillars of national economic security, usually consider more social responsibilities in their business objectives, and coupled with the government appointment and promotion mechanism of SOE executives, they prefer the business strategy of investing financial resources in prudent projects to avoid excessive risks associated with high-innovation projects. Therefore, mismatched financial resources will raise the innovation cost of enterprises and crowd out their innovation resources, which, in turn, inhibits the enhancement of their innovation capability. Furthermore, reductions in enterprise innovation capacity often have a negative impact on the improvement of
GDE [
56,
57]. On the one hand, enterprise technology innovation can effectively improve existing production technology, improve resource utilization efficiency, integrate existing production factors, enhance enterprise production efficiency, and thus promote regional
GDE; on the other hand, technology innovation can promote the application of green and clean technology in enterprises, prompt enterprises to change their original high-emission and high-pollution production methods, and strengthen the means of ending pollutant emissions. The green production capacity of cities can also be improved to promote the green development of a region. Therefore, this paper proposes Hypothesis 2.
Hypothesis 2. Financial resource misallocation will inhibit the level of enterprise technological innovation and, thus, the improvement of green development efficiency.
3.3. Industrial Structure Effect
Industrial structure upgrading can promote GDE through various mechanisms such as factor replacement, industrial spillover, and division of labor specialization. The Mismatched financial resources can inhibit the upgrades to industrial structure and, thus, the improvement of GDE. First, the unbalanced allocation of financial resources has prevented the market from identifying industries with advantages, prompting financial resources to move toward high energy-consuming and high-polluting industries with huge amounts of capital, especially “zombie enterprises” with excess capacity. This has crowded out the financial resources needed to develop green industries, such as high-tech and knowledge-intensive industries. This not only slows down the pace of China’s industrial structure conversion to secondary and tertiary industries but also causes a mismatch between supply and demand in various production factors, which may hinder the productivity of society. To a certain extent, this has solidified the structure of resource utilization, which is not conducive to the development of green innovation technology and ultimately leads to lower economic output and no significant improvement in environmental pollution, thus inhibiting the enhancement of GDE. Secondly, financial resources, as the core resources of society, have a dominant function over other production factors. The unreasonable allocation of financial resources will cause the unreasonable allocation of other social resources among industries, leading to structural distortion in industries, which is not conducive to coordinated development among industries. At the same time, mismatched financial resources increase the consumption of resources and reduce economic output, which is not conducive to improving GDE. Again, under the promotion incentive of political decentralization and economic decentralization in China, local governments, in pursuit of short-term economic benefits, put financial resources into resource-intensive industries with low factor costs, quick results and low risks, leading to a mismatch between the final industrial layout and financial resource allocation, inhibiting sustainable economic development. Therefore, this paper proposes Hypothesis 3.
Hypothesis 3. Financial resource misallocation will inhibit the optimization and upgrading of industrial structure, which in turn inhibits the improvement of green development efficiency.
4. Methodology
4.1. Model Setting
First, to test the impact of
FM on
GDE, the following benchmark model is set in this paper:
In Equation (1), denotes green development efficiency, denotes regional financial resource misallocation index, and denote control variables. We have selected six control variables, including economic development level (ECO), degree of government intervention (GOV), environmental regulation intensity (ERI), urbanization rate (UR), infrastructure development (INC) and openness to the outside world (OPEN); denotes provincial cross-sectional unit, denotes year, denotes individual fixed effect, denotes time fixed effect, denotes random disturbance term, is a constant term, and , and are parameters to be estimated.
To examine the impact effect of financial resource mismatch more comprehensively, this paper examines it separately from both the factor and structural aspects, and we have set the following sub-regression equation.
In Equations (2) and (3)
and
are the constant term, and
,
,
, and
are parameters to be estimated.
and
represent the financial resource factor mismatch index and financial resource structure mismatch index, respectively. Please see
Section 4.2.2 for the specific calculation of the
FMR and
FMS.
Second, to further analyze the marginal effects of
FM on
GDE, this paper uses a quantile regression model for testing, and the model is set as follows:
In Equation (4), denotes the value of the FM index corresponding to the quantile (5%, 25%, 50%, 75%, 95%), and denotes the marginal impact of FM on GDE at each quantile. is a constant term, and is the parameters to be estimated.
Thirdly, to further test the impact mechanism of
FM on
GDE, based on the previous theoretical analysis and Model (1) and referring to the practice of [
58], the mediating effect model is set as follows:
In Equation (5), is the mechanism variables, including resource concentration (FC), enterprise technology innovation (ETI), and industrial structure height (AIS); indicates whether FM has a positive promoting effect on each mechanism variable; and in Equation (6) is the coefficient of whether the mechanism variables have a significant effect on GDE. According to the mediating effect test method, first, the significance of in the main Model (1) is judged, and if the regression coefficient is significant, it indicates that mismatched financial resources have a significant impact on GDE; second, the significance of in Model (3) is judged, and if is significant, it indicates that mismatched financial resources have an impact on the above mechanism variables; and finally, if are significant, and the absolute value of the regression coefficient is smaller than , it indicates that there is a partial mediating effect, and mismatched financial resources will have an impact on GDE through the mechanism variables.
4.2. Definition of Main Variables
4.2.1. Explanatory Variable: Green Development Efficiency (GDE)
There are two major methods available to measure the level of green development: one is the comprehensive index method [
59,
60,
61], and the other is the data envelopment analysis method, also called the improved data envelopment analysis method [
62,
63]. Currently, the slacks-based measure (SBM) model is more commonly used. The traditional SBM model takes into account the inefficiency of the efficiency measure though the decision-making unit (DMU) slack variable component, but the result will have multiple valid DMUs, taking the value of 1, which cannot be effectively distinguished and ranked. Therefore, Tone proposed the Super-SBM model on this basis, which can better solve the ranking problem of valid DUMs. Therefore, we adopt the Super-SBM model in order to more realistically reflect the efficiency of China’s green development.
Assume the existence of
regions; each region as a decision making unit (DMU) constructing a production frontier, with each using
inputs
to obtain
desired outputs
and
undesired outputs
. Define the matrices
as follows:
Assuming
, the set of production possibilities can be defined as follows:
is the weight vector, and the three inequalities in the production possibility function indicate that the actual input level is not lower than the frontier input level, the actual desired output level does not exceed the frontier desired output level, and the actual undesired output level is not lower than the frontier undesired output level. The expressions are as follows:
is the value of regional super-efficiency with variable payoffs to scale; is the th province, i.e., the green development efficiency value of the th province; and , , are slack variables for inputs, desired outputs and undesired outputs. When ≥ 1, the decision unit is relatively efficient; when < 1, the decision unit is relatively inefficient.
For the selection of input-output variables, this paper selects factors of production such as labor, capital and resources as input indicators and desired output and undesired output as output indicators based on neoclassical economic theory. The specific definitions of the input and output indicators are shown in
Table 1. The results of the
GDE measurements are shown in
Table A1 of
Appendix A.
4.2.2. Core Explanatory Variable: Financial Resource Misallocation
From the perspective of resource allocation efficiency,
FM refers to the phenomenon of deviation between the structure and efficiency of financial resource allocation. At present, there are three directions for measuring
FM in academic circles: First, the “capital efficiency method” mainly by [
64], which indirectly reflects the degree of financial mismatch by the difference in the enterprise capital return rate. The second is the “capital-labor output elasticity method”, proposed by [
65], which measures the level of financial mismatch by the ratio of capital to labor output elasticity. The drawback of this method is that it ignores the influence of technological inputs. The third is the “efficiency method “, using SFA, DEA and other efficiency measurement methods to measure the input-output efficiency of financial resources, the higher the efficiency value the lower the level of
FM. Since the development degree of China’s financial market is still far below that of the product market [
66], it is more reasonable to use the market-based index method to construct an
FM index, but none of the literature has yet adopted this method, therefore, this paper measures the degree of
FM on this basis, at the same time, drawing on the study of factor market distortion by P.K. Lin and K.R. Du (2013) [
67], the benchmarking method is also used to measure it. This method can reflect both the relative differences in
FM between regions and the
FM trend over time. The method is based on the relative difference between the highest value of national financial marketization and regional financial marketization to measure the degree of
FM in each province. The specific calculation formula is as follows:
In Equation (12), refers to the degree of regional financial marketization, which is measured in terms of market competition in the financial industry and the allocation structure of credit resources, drawing on the measurement method of Fan (2011). Competition in the financial industry market is measured by the ratio of deposits taken by non-state financial institutions to deposits taken by all financial institutions, and this indicator portrays the intensity of competition in the financial industry in each region. It also reflects the distribution of financial resource elements between state-owned and non-state-owned financial institutions. The allocation structure of financial resources is measured by the share of non-state-controlled enterprises liabilities in the total liabilities. At present, there is still a de facto inequality in the availability of capital between state-owned and non-state-owned enterprises, and the efficiency of capital allocation seriously deviates from Pareto efficiency. This indicator effectively reflects the structural allocation of financial resources. Based on this, this paper further decomposes FM into two aspects: financial resource factor mismatch (FMR) and financial resource structure mismatch (FMS). The financial resource factor mismatch index and the financial resource structure mismatch index are also calculated based on the above formula.
4.2.3. Mechanism Variables
Based on the previous theoretical analysis, three variables (namely, financial resource agglomeration, enterprise technological innovation, and industrial structure height) are selected as mechanism variables in this paper. The first variable is financial resource agglomeration (
FRA). It is expressed as the entropy of banking agglomeration locations, and the specific formula is as follows:
where
denotes the regional bank savings deposit balance,
denotes the national total bank savings deposit,
denotes the regional total population, and
denotes the national total population. The second variable is enterprise technology innovation (ETI). The level of enterprise technological innovation is measured using a logarithm of the number of effective invention patents of enterprise R&D. The third variable is advanced industrial structure (AIS). It is measured using the proportion of the total output value of the tertiary industry to the total output value of the secondary industry.
4.2.4. Control Variables
To mitigate estimation bias due to omitted variables, this paper combines macroeconomic theory and variables considered by relevant scholars in the research process [
68,
69] and selects six indicators as control variables: economic development level (ECO), government intervention (GOV), environmental regulation (ERI), urbanization rate (UR), in
frastructure development (INC), and openness to the outside world (OPEN). The specific variable description statistics are shown in
Table 2. To reduce the scale between the variables and improve the accuracy of the test results, the values of economic development levels are treated as logarithms in this paper.
4.3. Data Sources
Based on data availability, this paper uses the panel data of 30 Chinese provinces recorded over 17 years, from 2005 to 2021, and uses them as the basis for empirical testing and analysis. However, we kick out Tibet, Hong Kong, Macao, and Taiwan due to a serious lack of statistical data from these areas. The data were obtained from the CSMAR database, the China Marketization Index database, the EPS database, the China Statistical Yearbook, and provincial statistical yearbooks, and individual missing data are supplemented using the linear interpolation method. The definition and explanatory notes of each variable are shown in
Table 2.
5. Results and Discussion
5.1. Analysis of the Results of the Baseline Regression and Quantile Regression
Model (1) tests the effect of
FM on
GDE. From the results shown in columns (1) and (2) of
Table 3, it is clear that the estimated coefficients of
FM are significantly negative at the 1% level regardless of whether the OLS method or the FE fixed-effects model is used, indicating that the higher the degree of
FM, the lower the
GDE of the region.
The benchmark regression only reflects the average marginal effect of the efficiency impact of FM on green development. To examine the different marginal effects of FM on GDE under different quantile points, this study uses the quantile regression model to test and regresses with 5%, 25%, 50%, 75%, and 95% as the quantile points. Columns (3) to (7) show the quantile regression results. From these results, it can be seen that the estimated coefficients of FM are still significantly negative at different quantile points, but numerically, the inhibitory effect of FM on GDE shows an inverted V-shaped trend of weakening and then strengthening as the GDE increases. This indicates that when the level of green development is low, the inhibitory effect of FM on GDE will show a decreasing trend; when the GDE is raised to a certain level, the inhibitory effect of FM on GDE will gradually increase. The main reason may be that the improvement of the green development level relies on the input of financial resources when the green development level is low, but as the scale of input increases, the marginal contribution of financial resources to GDE will show a decreasing trend, and the inhibitory effect of financial resources on GDE will also gradually decrease. However, when the GDE is raised to a certain level, it is impossible to meet the growth requirements of GDE by relying solely on resource factor inputs; instead, it requires more reasonable resource allocation efficiency and green technology innovation, so the adverse effects of FM will gradually be highlighted and the inhibitory effect on GDE will be gradually strengthened.
5.2. Disaggregated Regression Results
To examine the impact effect of
FM more comprehensively, this paper further decomposes the
FM index into two aspects,
FMR and
FMS, and conducts regressions. The results are shown in
Table 4. Columns (1) and (2) show that both factor mismatch and the structural mismatch of financial resources have a significant inhibitory effect on the improvement of
GDE. In terms of specific values, the inhibitory effect of the structural mismatch of financial resources on
GDE is significantly larger than that of the factor mismatch of financial resources. In addition, to further investigate the heterogeneity of the effects of financial resource factor mismatch and structural mismatch on
GDE under different degrees of financial marketization, this paper divides the samples into two categories, with the mean value of financial marketization degree as the midpoint: samples smaller than the mean are classified as relatively low financial marketization samples, while samples larger than the mean are classified as relatively high financial marketization samples. Columns (3) to (6) report the sub-sample regression results. From the results, the financial resource factor mismatch and structural mismatch coefficients are both significantly negative at the 1% level in the sample with low financial marketization, while financial resource factor mismatch and structural mismatch coefficients are significantly negative at the 5% level in the sample with high financial marketization. However, both coefficients are lower than those in the sample with low financial marketization. The above results indicate that the inhibitory effect of
FM on
GDE is more pronounced in regions with a lower degree of financial marketization, and the low degree of marketization curbs the role of the market price supply and demand adjustment mechanism, leading to a reduction in the availability of financial resources for new green enterprises and a more significant inhibitory effect on
GDE.
5.3. Endogeneity Test
Considering the possible reverse causality between
FM and
GDE as well as the existence of omitted variables leading to biased model estimation, this paper addresses the endogeneity issue using both the instrumental variables approach and lagging all explanatory variables. First, the Hausman test was conducted using
FM with a one-period lag as the instrumental variable;
p < 0.05, indicating the existence of endogeneity explanatory variables.The test was conducted using the 2SLS method, and the results are shown in columns (1) and (2) of
Table 5, with Kleibergen-Paap rk LM values of 117.803 and Kleibergen-Paap rk Wald F values of 327.760, both greater than their respective critical values, thus rejecting the original hypothesis of unidentifiable instrumental variables and the absence of weak instrumental variables. The
p-value of the Hansen J-test statistic is 0.127, indicating that all instrumental variables are exogenous. The
FM coefficients are significantly positive for the first-stage lagged period and significantly negative for the second-stage
FM coefficients, indicating that the study findings remained reliable after controlling for endogeneity issues. Regressions were also conducted using the GMM method, and the results are shown in column (3). The results are consistent with 2SLS. Second, since it was not possible to determine whether all the unobserved influences were controlled for, all lagged explanatory variables were used to mitigate this endogeneity problem by adding them to the regression model as representatives of the unobserved characteristic variables.Tthe results in column (4) in
Table 4 show that the sign and significance of the regression coefficients of the core explanatory variables are generally consistent with the previous results.
5.4. Robustness Tests
(1) Replacing the
GDE measurement method. In this paper, the stochastic frontier approach (SFA) is used to remeasure the
GDE. First, the undesired output is normalized, the production function in the form of the transcendental logarithm is measured, and the model is re-regressed. The results are shown in column (1) of
Table 6. After replacing the
GDE indicator, the effect of
FM is still significantly negative, which is consistent with the previous findings.
(2) Replacing the measurement method of the explanatory variable FM index: First, the financial resource element mismatch index is re-measured. From the perspective of enterprise financial resource acquisition, FM is mainly due to mismatches in enterprise debt resources. Thus, this paper adopts the ratio deviation of the proportion of the debt financing of enterprises to the proportion of the industrial output value from one to make measurements. The calculation formula is FMR = 1-private enterprise debt financing proportion/private enterprise output value proportion, where the amount of enterprise debt financing = enterprise debt − enterprise net receivables, and private enterprise output value = private enterprise inventory + finished goods + present value of sales, according to which the financial resource factor mismatch index can be calculated. Second, the financial resource structural mismatch index is remeasured. The financial resource structural mismatch not only manifests as the unequal distribution of financial resources between state-owned and non-state-owned sectors but also as the uneven distribution of financial resources among different regions. Thus, this paper adopts the proportion of total deposits of regional financial institutions to regional output value divided by the proportion of the total deposits of national finances in institutions to the national output value to make measurements. That is, the financial resource structural mismatch index = (total deposits of regional financial institutions/share of regional output value)/(total deposits of national financial institutions/share of national total output value). Finally, the model is regressed with the replaced indicators. The results are shown in columns (2) and (3), which indicate that the factor mismatch and structural mismatch of financial resources still play a suppressive role in the efficiency of green development.
(3) Reselection of samples: Considering the economic and social impacts of the U.S. subprime financial crisis in 2008 and the COVID-19 pandemic in 2020, the green development inputs and outputs as well as the allocation of financial resources will also be affected to a certain extent. Therefore, this paper kicks out the samples in 2008 and 2020 and reregulates the model. The results are shown in column (4) in
Table 6. From the results, it can be seen that the
FM has a significant inhibitory effect on the efficiency of green development, indicating that the model regression results are more robust.
5.5. Mediating Effect Test
Our previous paper confirms the inhibitory effect of
FM on
GDE. To further test its influence mechanism, it is empirically tested according to models (3) and (4), and the results are shown in
Table 7. To discuss whether
FM can have an impact on
GDE through the three intermediary channels, two links are needed: first, whether
FM has a significant impact on the three mechanism variables, and second, how the three mechanism variables affect
GDE. According to the results in columns (2), (4), and (6),
FM has a significant negative impact on the three variables of financial resource concentration, enterprise technological innovation, and industrial structure height. According to columns (3), (5), and (7), the direction of the effect of
FM on
GDE remains unchanged, while the effect of all three mechanism variables on
GDE is significantly positive, indicating that
FM will inhibit
GDE by suppressing financial resource concentration, enterprise technology innovation, and industrial structure height.
(1) The mediating effect of financial resource agglomeration in the relationship between FM and GDE.
In
Table 7, columns (2) and (3) test the influence path of “financial resource misallocation → financial resource agglomeration effect →
GDE”. The regression coefficient of
FM in column (2) is −0.196, which is significant at the 1% level, indicating that
FM inhibits financial resource agglomeration. The regression coefficient of
FM in column (3) is −0.073, which is significant at the 1% level, and the absolute value of its regression coefficient decreases compared with that of the unmediated variables. The regression coefficient of
FRA is 0.186, which is significant at the 1% level, indicating that financial resource clustering is conducive to enhancing the efficiency of green development. In summary, financial resource misallocation has a negative impact on
GDE by inhibiting financial resource agglomeration. To test the robustness of this finding, the Sobel test is used, and the result shows that the value of the Z-statistic is −2.897, and significant at the 1% level, indicating that
FM plays a partial mediating role in the relationship between
FM and
GDE.
(2) The mediating effect of enterprise technology innovation in the relationship between FM and GDE.
Columns (4) and (5) test the influence path of “financial resource misallocation → enterprise technology innovation effect →green development efficiency”. The regression coefficient of FM in column (4) is −0.961, which is significant at the 1% level, indicating that mismatched financial resources suppress the level of enterprise technological innovation. The regression coefficient of FM in column (5) is −0.078, which is significant at the 1% level, and the absolute value of its regression coefficient also decreases compared to that of the unmediated variables. The regression coefficient of ETI is 0.033, which is significant at the 5% level, indicating that corporate technological innovation has a positive effect on enhancing the efficiency of green development. In summary, FM can suppress the level of GDE by inhibiting corporate technological innovation. To test the robustness of this finding, the Sobel test is used and the result shows that the value of the Z-statistic is −3.163, and significant at the 1% level, indicating that corporate technological innovation plays a partial mediating role in the relationship between FM and GDE.
(3) The mediating effect of industrial structure height in the relationship between FM and GDE.
Columns (6) and (7) test the influence path of “financial resource misallocation → industrial structure effect → green development efficiency”. The regression coefficient of FM in column (6) is −0.528, which is significant at the 1% level, indicating that mismatched financial resources inhibit industrial restructuring. The regression coefficient of FM in column (7) is −0.076, which is significant at the 5% level, and the absolute value of its regression coefficient is also reduced compared to that of the unmediated variables. The regression coefficient of AIS is 0.064, which is significant at the 1% level, indicating that industrial restructuring to an advanced level has a positive effect on the improvement of GDE. Therefore, FM will suppress the level of GDE by inhibiting the advanced industrial structure and thus the level of GDE. To test the robustness of this finding, the Sobel test is used, and the results show that the value of the Z-statistic is −3.322, significant at the 1% level, indicating that the height of industrial structure plays a partial mediating role in the relationship between FM and GDE.
6. Conclusions and Discussion
Continuously promoting the improvement of green development efficiency and optimizing resource allocation structures and market-oriented reform of factors are inevitable requirements in promoting the high-quality development of China’s economy. This paper empirically identifies and investigates the effect and mechanism of FM on GDE from the dual perspective of financial resource factor mismatch and structural mismatch by constructing an FM index based on panel data from 30 provinces of China recorded from 2005 to 2021 The main findings are as follows: (1) The results of the benchmark and quantile regressions show that FM has a suppressive effect on GDE, and the suppressive effect of FM shows a decreasing and then increasing inverted V-shaped trend with the increase in GDE. (2) The sub-regressions show that the suppressive effect of FM on GDE has a decreasing and then increasing trend. The regression shows that the inhibition effect of FM on GDE is greater than that of financial resource factor mismatch, and the inhibition effect of GDE is more significant in areas with low financial marketization after differentiating the degree of financial marketization. (3) The mechanism analysis finds that FM affects the improvement of GDE through three paths: the inhibition of financial resource concentration, enterprise technology innovation, and industrial structure height.
Based on the above research findings, this paper puts forward the following policy recommendations.
(1) Given the significant inhibiting effect of FM on GDE, the key to enhancing GDE for regional governments lies in eliminating FM. First, it is necessary to carry out deep structural reform on the supply side of finance, build a multilevel capital market system through financial market reform, and enrich the diversification of financing instruments to strengthen the utilization and flow of financial factors and improve the degree of financial resource mismatch in China. Second, we should broaden diversified green financing channels, and through the innovation of green financial products, such as green credit, carbon neutral bonds, green funds, green insurance, and green trusts, we should guide the flow of financial resources to clean and energy-efficient industries and promote the green and low-carbon transformation of industries. In the face of the current shortcomings in science, technology, and economic development, we should further deepen the reform in key areas through measures such as science and technology innovation, rural revitalization, and clean energy; provide long-term and stable financial support; minimize the integration of hot money and fast money in related fields; and continuously increase the proportion of “patient capital” in the financing process. To ensure the sustainable development of the economy and society, the proportion of “patient capital” in the financing process should be increased. Finally, communication between financial regulators and the Ministry of Ecology and Environment should be strengthened to clarify the direction of the investment and financing of green projects by formulating standards and systems, thus guiding financial institutions to invest more financial resources in industries that are conducive to sustainable development and improve the efficiency of financial resource allocation.
(2) Given the different degrees of financial marketization in different regions, each local government should tailor its policies for the high-quality development of green industries according to local conditions and time. First of all, for regions with a high degree of financial marketization, which have a stronger ability to obtain financial resources, the government should create a green industrial chain, strongly support the research and development of green innovative technologies, and promote the benign development of industry. At the same time, it should strengthen the function of financial services for the real economy; improve the efficiency and supply quality of financial services with the help of the Internet, big data, and other technologies; and optimize the competitive environment of the financial market. Through pricing, supply and demand, competition, and other market mechanisms, it can guide the flow of financial resources. Second, for regions with a low degree of financial marketization, the government should focus on improving the efficiency of financial resource accumulation and enhancing the role of financial support for technological innovation and green development. While undertaking industrial transfer and technology diffusion in strong provinces, it should not only improve the financial system and guide the flow of financial resources to high-tech industries but also give full play to the service and intermediary functions of financial resources to improve the efficiency of their support for technological innovation. In addition, the government should change the concept of development and the pursuit of development goals; at the same time, it needs to take into account economic and ecological benefits and set up special funds or actively attract investments to put more financial resources into the green industry, and it should advocate the green transformation of enterprises. It should improve the market level of the region, establish clear property rights and orderly competition in the social and economic order, improve the economic growth of the region, and promote the green and sustainable development of the economy.
(3) Mismatched financial resources inhibit the level of enterprise technological innovation and, thus, the efficiency of green development, so local governments should strengthen policy and financial support for green enterprise technological innovation. First, they should cultivate more green technology innovation market players, gather resource elements conducive to green technology innovation, strengthen the construction of green technology innovation infrastructure, and give full play to the role of enterprise technology innovation in promoting green development. Second, they should increase financial and tax support for the development of science and technology-based enterprises, especially for special and innovative green science and technology projects supported by the state, while also gathering talents, funds, markets, and other factors conducive to the development of green science and technology innovation enterprises. They should also optimize the external environment for enterprise research and development by devoting more resources to technological innovation and energy-saving production. They should actively encourage enterprises to closely follow the direction of green and low-carbon development, set up advanced green and low-carbon technology research and development teams, break down technical barriers, increase support for the research and development of key core technologies, promote the output and application of low-carbon technology achievements, and provide an endogenous drive for green development.
(4) Mismatched financial resources inhibit the optimization and adjustment of industrial structure and thus inhibit the improvement of GDE. Therefore, local governments, relevant regulatory agencies, and financial institutions need to integrate advantageous financial resources, guarantee that financial resources can be invested in new industries with high efficiency and low energy consumption, support the transformation of enterprises with high efficiency and high energy consumption to low carbon, and strictly restrict low efficiency and high energy consumption enterprises from obtaining financial loans. This will force such enterprises to transform and upgrade or withdraw and reasonably allocate financial resources to tertiary industries, thus promoting an advanced industrial structure. In addition, the government should pay attention to the cultivation of finance and environmentally friendly composite talents; optimize the allocation of financial resources among industries; promote the coordinated development of industries; and then correct structural distortions to rationalize the regional industrial structure, improve the efficiency of resource utilization, and reduce the environmental load of China.


