Article

Effects of Pre-Turbocharger Turbine Water Injection on the Sustainable Performance of Spark Ignition Engine

1
Department of Mechanical Engineering, Universiti Teknologi PETRONAS, Seri Iskandar 32610, Malaysia
2
Automotive Development Centre, Institute for Vehicle Systems and Engineering, Universiti Teknologi Malaysia, Johor Bahru 81310, Malaysia
3
School of Environmental Science, University of Indonesia, Jakarta 10430, Indonesia
4
Research & Innovation Center Division, Rabdan Academy, Abu Dhabi P.O. Box 114646, United Arab Emirates
5
Industrial Engineering Department, Faculty of Engineering, Bina Nusantara University, Jakarta 11480, Indonesia
*
Authors to whom correspondence should be addressed.
Sustainability 2023, 15(5), 4559; https://doi.org/10.3390/su15054559
Submission received: 8 January 2023 / Revised: 9 February 2023 / Accepted: 17 February 2023 / Published: 3 March 2023

Abstract

:
Water injection strategy is considered a promising technique to improve the performance of boosted engine and reduce the NOx emission via the latent heat of water vaporization. Numerous research on water injection has been conducted on in-cylinder and intake port water injection. However, the water injection focusing on the spark ignition (SI) engine exhaust system is still lacking. This study proposed a pre-turbocharger turbine water injection (PTWI) concept to reduce the turbine inlet temperature. This was done so that the stoichiometric engine operation could be achieved at a medium–high load and engine speed without resorting to a fuel enrichment strategy to reduce the exhaust gas temperature. This study aims to investigate the effect of injecting water into the exhaust gas at the pre-turbine of a turbocharged spark ignition engine. This study experimented on a 1.3-L 4-cylinder turbocharged engine to collect engine data for computational fluid dynamics (CFD) baseline model validation. A one-dimensional engine model was then developed based on the 1.6-L 4-cylinder turbocharged engine experiment using AVL BOOST software. The CFD model was used to investigate the effects of water injection pressure, pipe diameter, and water injector location. The CFD results showed that a 50 mm connecting pipe with 4 bar of injection pressure gives the largest reduction in exhaust temperature. The CFD results were then applied to the one-dimensional engine model. The engine model simulation results showed that the fuel consumption could be reduced up to 13% at 4000 rpm during wide-open throttle and 75% engine load. The PTWI is a new approach, but this study has proved the potential of using water injection at the pre-turbine turbocharger to reduce the fuel consumption of a turbocharged SI engine.

1. Introduction

1.1. Background

Vehicle emission regulation is crucial to tackle air pollution globally. The automotive markets have proposed an ambitious reduction in CO2 limit for both light and heavy-duty vehicles for the coming decade. The emission regulations will only becoming stricter year by year. Car manufacturers must find every possible way to gradually reduce the CO2 emissions of their fleet every year to comply with the regulations. Due to the stringent emission standard, engine downsizing has been the engine design trend for the past decade. This momentum is expected to continue for the coming years. Turbochargers are nowadays being used to compensate for the power loss from the downsized engines. The boosted engine can produce a flatter torque curve that improves the performance and efficiency at part load operation [1]. However, this downsized boosted engine has some drawbacks to overcome.
Firstly, the compressed intake air causes the boosted engine to operate at higher indicated mean effective pressure (IMEP). This promotes engine knocking in the combustion chamber, which will damage the engine if it occurs for a prolonged period. Compression ratio (CR) reduction and spark retard are required to prevent engine knocking, leading to the deficit in engine efficiency. Hence, engine knocking is the limiting factor of extracting potential performance from a high power density engine [2]. The CR of a naturally aspirated SI engine is typically at 10.5:1 and up to 13.5:1. However, for a boosted SI engine, the CR must be lowered to 8:5 to 9.5:1 typically, mainly to avoid engine knocking. This limits the potential of the engine performance and thermal efficiency.
Water injection (WI), such as port WI and direct WI, are proven to mitigate engine knocking effectively [3]. This is because the latent heat of vaporisation, which converts water from liquid to vapour, absorbs the heat. With that, permissible knock-free spark timing can be advanced to utilise the crank angle of power stroke as much as possible. Consequently, the thermal efficiency of the engine will be improved. Additionally, the colder intake air has a higher density. In the case of port WI, more air will be drawn into the combustion chamber.
The exhaust gas temperature may also exceed 900 °C, which will cause the exhaust manifold and turbocharger turbine side to reach an extreme temperature. The turbine inlet temperature (TIT) is the critical parameter that needs to be maintained below 930 °C so that it is below the permissible thermal limit of the turbine vane and catalytic converter. Fuel enrichment is the commonly used method to control the temperature of combustion and exhaust gas. Thus, the fuel consumption of a small displacement boosted engine is higher during high load engine operation. One of the limiting factors of the performance of a boosted engine is the turbocharger TIT. Therefore, fuel enrichment is required to control the exhaust temperature. However, this method impacts fuel economy. As mentioned before, WI can maintain the combustion temperature, which means it can reduce the fuel consumption of the engine. It also allows the engine to potentially run at stoichiometric conditions, which eliminates the harmful gas in the exhaust gas and reduces brake specific fuel consumption (BSFC) while maintaining the performance.

1.2. Strategies of Water Injection (WI)

WI was first applied on aircraft engines, acting as an anti-detonation agent or internal coolant to reduce engine knocking. The topic raised the interest of aeronautics researchers back in the 1940s. In 1943, Rothrock et al. introduced water to the intake air for knock suppression [4]. The water allowed the aircraft engine to operate above the permissible limit while increasing the IMEP. In 1946, Wright Aeronautical Corporation concluded that pure water addition offers the best engine cooling while water-methanol permits the most significant output.
WI once appeared in the automotive industry during the demanding era of high-performance vehicles in the 1980s. However, the implementation was in low numbers. Saab 99 Turbo and some Chrysler models with large displacement engines were the few examples that received the WI treatment [5]. With the introduction of an intercooler for a turbocharged engine, WI seemed to be redundant to cool down the charge air. Since then, WI is only available in aftermarket tuning kits, such as Nostrum Energy and AEM to boost engine performance [5]. Until 2015, Bosch co-developed a port water injection (PWI) system with a well-known luxury car manufacturer, BMW, and implemented it on their limited-edition sports car, the BMW M4 GTS [6]. The system provides an additional 50 horsepower out of the already powerful standard engine. Besides, Rolf Bulander from Bosch even claimed that their WI system allowed the engine to run at stoichiometric conditions, providing a 13% reduction in fuel [7].
In general, WI is a promising technology for knock suppression in the small-boosted engine. Followed by allowable spark advance, more power can be extracted from the engine. WI can also reduce the combustion temperature, which effectively reduces NOx emissions. Besides, WI can also replace or reduce the fuel enrichment application, which reduces the BSFC of the engine [5]. This also allows the engine to operate on stoichiometric combustion. From here, WI is a technique that can be expected to improve engine performance without compromising fuel consumption. Furthermore, the reduction of NOx encourages the implementation of WI to meet the future exhaust emission standard.
WI strategies can be categorised into pre-combustion WI, direct WI (DWI), and post-combustion WI. Every design has its respective advantages and disadvantages. Under pre-combustion WI, there are port WI and intake manifold WI. Port WI is the most proposed strategy due to its versatility and easy installation. With few modifications, the gasoline fuel injection system can be directly used for water injection. Direct WI has been increasingly proposed in recent years due to the more precise water spray and evaporation control, just like direct fuel injection.
On the other hand, post-combustion WI was only proposed in the compression ignition (CI) engine. As the name suggested, the injected water does not involve combustion compared to the other two WI strategies. After all, post-combustion WI is the least exploited WI strategy. When this paper was written, there were very few reports on the implementation of WI at the exhaust manifolds of CI engines to be found. However, there were even fewer applications of this for SI engines.

1.2.1. Pre-Combustion Water Injection

Pre-combustion WI injects liquid water or steam into the intake air stream before entering the combustion chamber. The injection point can be located at the intake manifold runners, right before the intake valves, as well as the upstream and downstream of the turbocharger compressor [5]. Most of the patent applications start with pre-combustion WI. This is the most proposed and published concept, probably due to its feasibility. Only pre-combustion WI reaches production in both the aviation and automotive industries.
Most research on pre-combustion WI has been conducted using experimental work. Iacobacci et al. [1] concluded that 20% water to fuel mass fraction increases the IMEP by up to 7.3% at 3500 rpm. In this context, the ignition timing can also be advanced to achieve the maximum brake torque (MBT). Worm et al. [8,9] stated that, with stoichiometric combustion and the advancement of combustion phasing, port WI allows up to a 35% increase in full load thermal efficiency.
Tornatore et al. [3] reported that with a 0.2 water-to-gasoline mass fraction, the indicated specific fuel consumption could be reduced by 12% with the engine running stoichiometrically (λ = 1) with optimised ignition timing. With 25% of water to gasoline mass flow rate, Karagöz et al. [10] found out that intake manifold WI increases the thermal efficiency and brake power of the hydrogen-enriched gasoline engine by 5.9% and 11.7%, respectively.
From the perspective of emissions, WI provides a significant amount of emissions reduction, as reported by Brusca et al. [11], Miganakallu et al. [12], and Luca et al. [1]. The hydrogen-fuelled SI engine is known to have high NO production due to rapid combustion. However, Subramanian et al. [13] found out that WI significantly reduces the NO level from 7670 to 2490 ppm at full load operation with an equivalence ratio of 0.82. Similarly, though the hydrogen addition can increase the NOx emissions by 141.1%, WI reduces the disadvantage to 82.7%, as found by Karagöz et al. [10]. This is mainly due to the heat absorption ability of water via the latent heat of vaporisation, which lowers the combustion temperature.
A detailed 3D computational fluid dynamic (CFD) simulation was carried out by Alessandro et al. [14] to determine whether WI can further enhance fuel efficiency. The study investigated different operating conditions (2000 rpm, 4000 rpm, and 7000 rpm) and reported that BSFC improved by 2%, 10%, and 22%, respectively. Berni et al. [15] used a similar approach and obtained an almost 20% BSFC reduction. Battistoni et al. [16] evaluated the knock suppression capability of port WI via multi-cycle CFD simulation. With a 30% water to fuel mass ratio, the study concluded that the nozzle design, injection pressure, location, and targeting of the injected water are critical parameters for a WI system. Bozza et al. [17] concluded that ported WI has significant potential for knock suppression and improved fuel consumption at high loads, but not during knock-free engine operation.
Besides injecting pure water, a mixture of water and methanol or pure methanol port injection was found to improve combustion in terms of knock reduction and reduction of BSFC, as demonstrated by Berni et al. in their other study [15]. However, the researchers concluded that pure WI is the best strategy, giving the lowest indicated specific fuel consumption.
To understand the application of WI in real-world applications, studies were conducted based on the Worldwide Harmonized Light Vehicle Test Cycle (WLTC) using A-segment vehicles [17,18,19,20]. The studies found out that the potential of WI is insignificant because the engine was mainly operating under part load without knock events. However, the results show fuel consumption reduction at high vehicle speed regions in fuel-saving at knock-limited operations, such as during high load conditions.

1.2.2. Direct Water Injection (DWI)

Comparable to the gasoline direct injection (GDI) system, DWI sprays the water directly into the combustion chamber. It is also known as internal cooled ICE in one of the earliest implementations of DWI on ICE by Kroll in 1976; similar inventions which came after in the year 1980s and 1990s are [21,22,23,24].
Experimental and simulation studies on direct WI have been substantially conducted in recent years [20,25,26,27,28,29] Water was injected separately at the compression stroke and expansion stroke, as demonstrated by Wei et al. [25,28] in their numerical analysis. They found out that WI at the end of the compression stroke reduces the in-cylinder pressure, which causes the required compression work to reduce. As liquid water was injected during the expansion stroke, the latent heat of vaporisation of the injected water can absorb the heat, thus, decreasing the in-cylinder pressure. However, when the liquid water is converted into steam, the in-cylinder pressure increases due to the steam volume, increasing the power output. Further studies have also found that direct WI reduces the heat loss to the cylinder wall and piston head, reducing NOx and soot emissions.
DWI reduces the heat losses compared to port WI because it introduces the water right before combustion [5]. The convection heat transfer to the cylinder wall, valves, cylinder liner, and piston head is also an energy wastage, and the heat flux transferred can be as high as 10 MW/m2 [28,30]. Thus, the cooling effect of the water can reduce energy losses and improve engine efficiency. The lower in-cylinder temperature also reduces the tendency to knock.
From an environmental standpoint, DWI reduces the NOx emission by 34.6% on average, as concluded by Ming et al. [25]. It shows the production comparison between the mean soot emissions and carbon dioxide production with various amounts of water being injected ranging from 5% to 25%. It was concluded that 15% water to fuel mass was the optimum injection amount that finds a balance between engine performance and emissions, including NOx, CO2, HC, and soot.
As a whole, DWI enhances the benefits obtained from pre-combustion WI in terms of performance, fuel consumption and emissions. This is mainly because the amount of injected water is more instantaneous and accurate, allowing better optimisation of combustion pressure and temperature. The heat transfer reduction enhances the cooling effect. One of the downsides to DWI is the complexity of the engine and system design compared to the pre-combustion WI.

1.2.3. Post-Combustion Water Injection

There are few studies on post-combustion WI in a gasoline engine. There are a few concepts for the CI engine, but the working principles are different. Post-combustion WI injects water in the flow of exhaust gases for exhaust gas heat recovery. The WI technique has been established in a CI engine primarily to control the NOx emission [31,32]. Therefore, this section extends the discussion to post-combustion WI in a CI engine because there is a research gap for SI engines. Future research can generate some ideas from the application in the CI engine.
Taylor et al. [33] proposed a solution in which the coolant passage passes through the exhaust manifold to reduce the exhaust gas temperature. Instead of using fuel enrichment to reduce and control the temperature, the proposed method can reduce the need for additional fuel consumption during high engine speeds. The exhaust gas temperature is expected to be reduced up to 160 °C when it reaches the turbocharger turbine inlet [34]. The Volkswagen EA888 engine was designed with this solution. Even if this is not a WI system, it is worth mentioning as it uses water’s high specific heat capacity to cool down the exhaust gases.
Prior studies on pre-combustion and DWI date only from 2016. The effects of exhaust manifold WI on the combustion and emissions characteristics were demonstrated by Farag et al. and Nour et al. [32,35]. The studies utilised the latent heat of the exhaust gas to vaporise the injected water. By overlapping the exhaust valves during the intake stroke, the vaporised water was pushed back into the cylinder to mix with the intake air for the upcoming combustion event. This prevents the cooling effect in the cylinder, reducing the apparent heat release rate (AHRR) and power output.
Farag et al. [32] compared engine performance and emissions between the intake manifold WI and exhaust manifold WI. In contrast, Nour et al. [35] focused on enhancing emission reduction without sacrificing the engine performance. The water consumption of the intake manifold WI needed to be twice as high as the direct WI to yield the same result. Both claimed that the exhaust manifold WI is a better injection strategy.
Farag et al. [32] and Nour et al. [35] applied the WI with 10% and 25% exhaust gas circulation (EGR). The drawback of an EGR is compensated by the WI. It is difficult to reduce NOx emissions and soot together; exhaust manifold WI reduces the NOx emissions significantly by 85% but produces higher soot than a conventional CI engine.
WI allows the IMEP to increase by 2.6% with a 10% EGR ratio in terms of engine performances. With the EGR ratio increased to 25%, the IMEP increased to 11%. The BSFC is increased between 5% to 19% compared to the EGR without WI.
Exhaust manifold WI is found to have significant benefits when applied to a CI engine. Based on the results, exhaust manifold WI is more recommendable due to its advantage in recovering the waste exhaust heat and balancing out the fuel consumption and emissions while retaining performance. Based on the available studies related to WI, post-combustion WI for SI engine is recommended for further studies.

1.3. Objective of Research

In this research, an investigation toward a newly proposed post-combustion WI strategy was carried out, known as pre-turbocharger turbine water injection (PTWI). The PTWI is used to cool down the TIT instead of the combustion chamber, enabling the engine to run at stoichiometric (λ = 1) conditions. This research will focus on the effects of the PTWI on the performance and fuel consumption of a spark ignition (SI) engine across the operating state. The objectives of the research are to characterise the behaviour of liquid water and exhaust gas in PTWI using three-dimensional (3D) computational fluid dynamics (CFD), and to investigate the effects of pre-turbine water injection on fuel consumption and engine performances using a one-dimensional (1D) simulation.

2. Materials and Methods

2.1. General Concept of PTWI

The water is injected into the exhaust pipe to mix with the exhaust gas before entering the turbocharger turbine. The add-on components to the standard turbocharged gasoline engine are a water injector, water pump, and a water reservoir. The water tank is fitted with the heating element to heat the water reservoir when it is necessary. The electrical water pump supplies the water to the injector. A regulator is fitted along the delivery line to control the water pressure. Fine water spray is recommended to promote vaporisation and mixing with the exhaust gas. The latent heat of vaporisation will absorb the heat and potentially reduce fuel enrichment application during high load and high-speed engine operation. Stoichiometric combustion may even be possible, reducing fuel consumption and emission without substantial performance penalty.

2.2. Methods of Research

This study covers simulation and experiments to propose a new water injection strategy for a gasoline engine. The purpose of the experiment in this study was to validate the simulation model. The experiment was conducted on an engine test bench, and the modification was done at the turbocharger turbine upstream. All the sensitivity cases were investigated through the validated simulation models. 3D CFD simulation focuses on the water spray behaviour in the hot exhaust gas stream. The parametric study was conducted on the injector pressure (4 bar, 7 bar, 9 bar), the diameter of the turbine inlet connecting pipe (30 mm, 40 mm, 50 mm), and the distance of the injector from the turbine inlet (150 mm, 250 mm, 450 mm). For the 1D engine simulation, the engine model was developed based on an existing engine setup specifications on the test bench. The baseline model was then validated with engine testing results. The baseline engine model will then use the results from CFD to investigate the effect of PTWI on the engine performances and fuel consumption during 3000 rpm, 4000 rpm, and 5000 rpm, and at 100%, 75% and 50% of engine load.

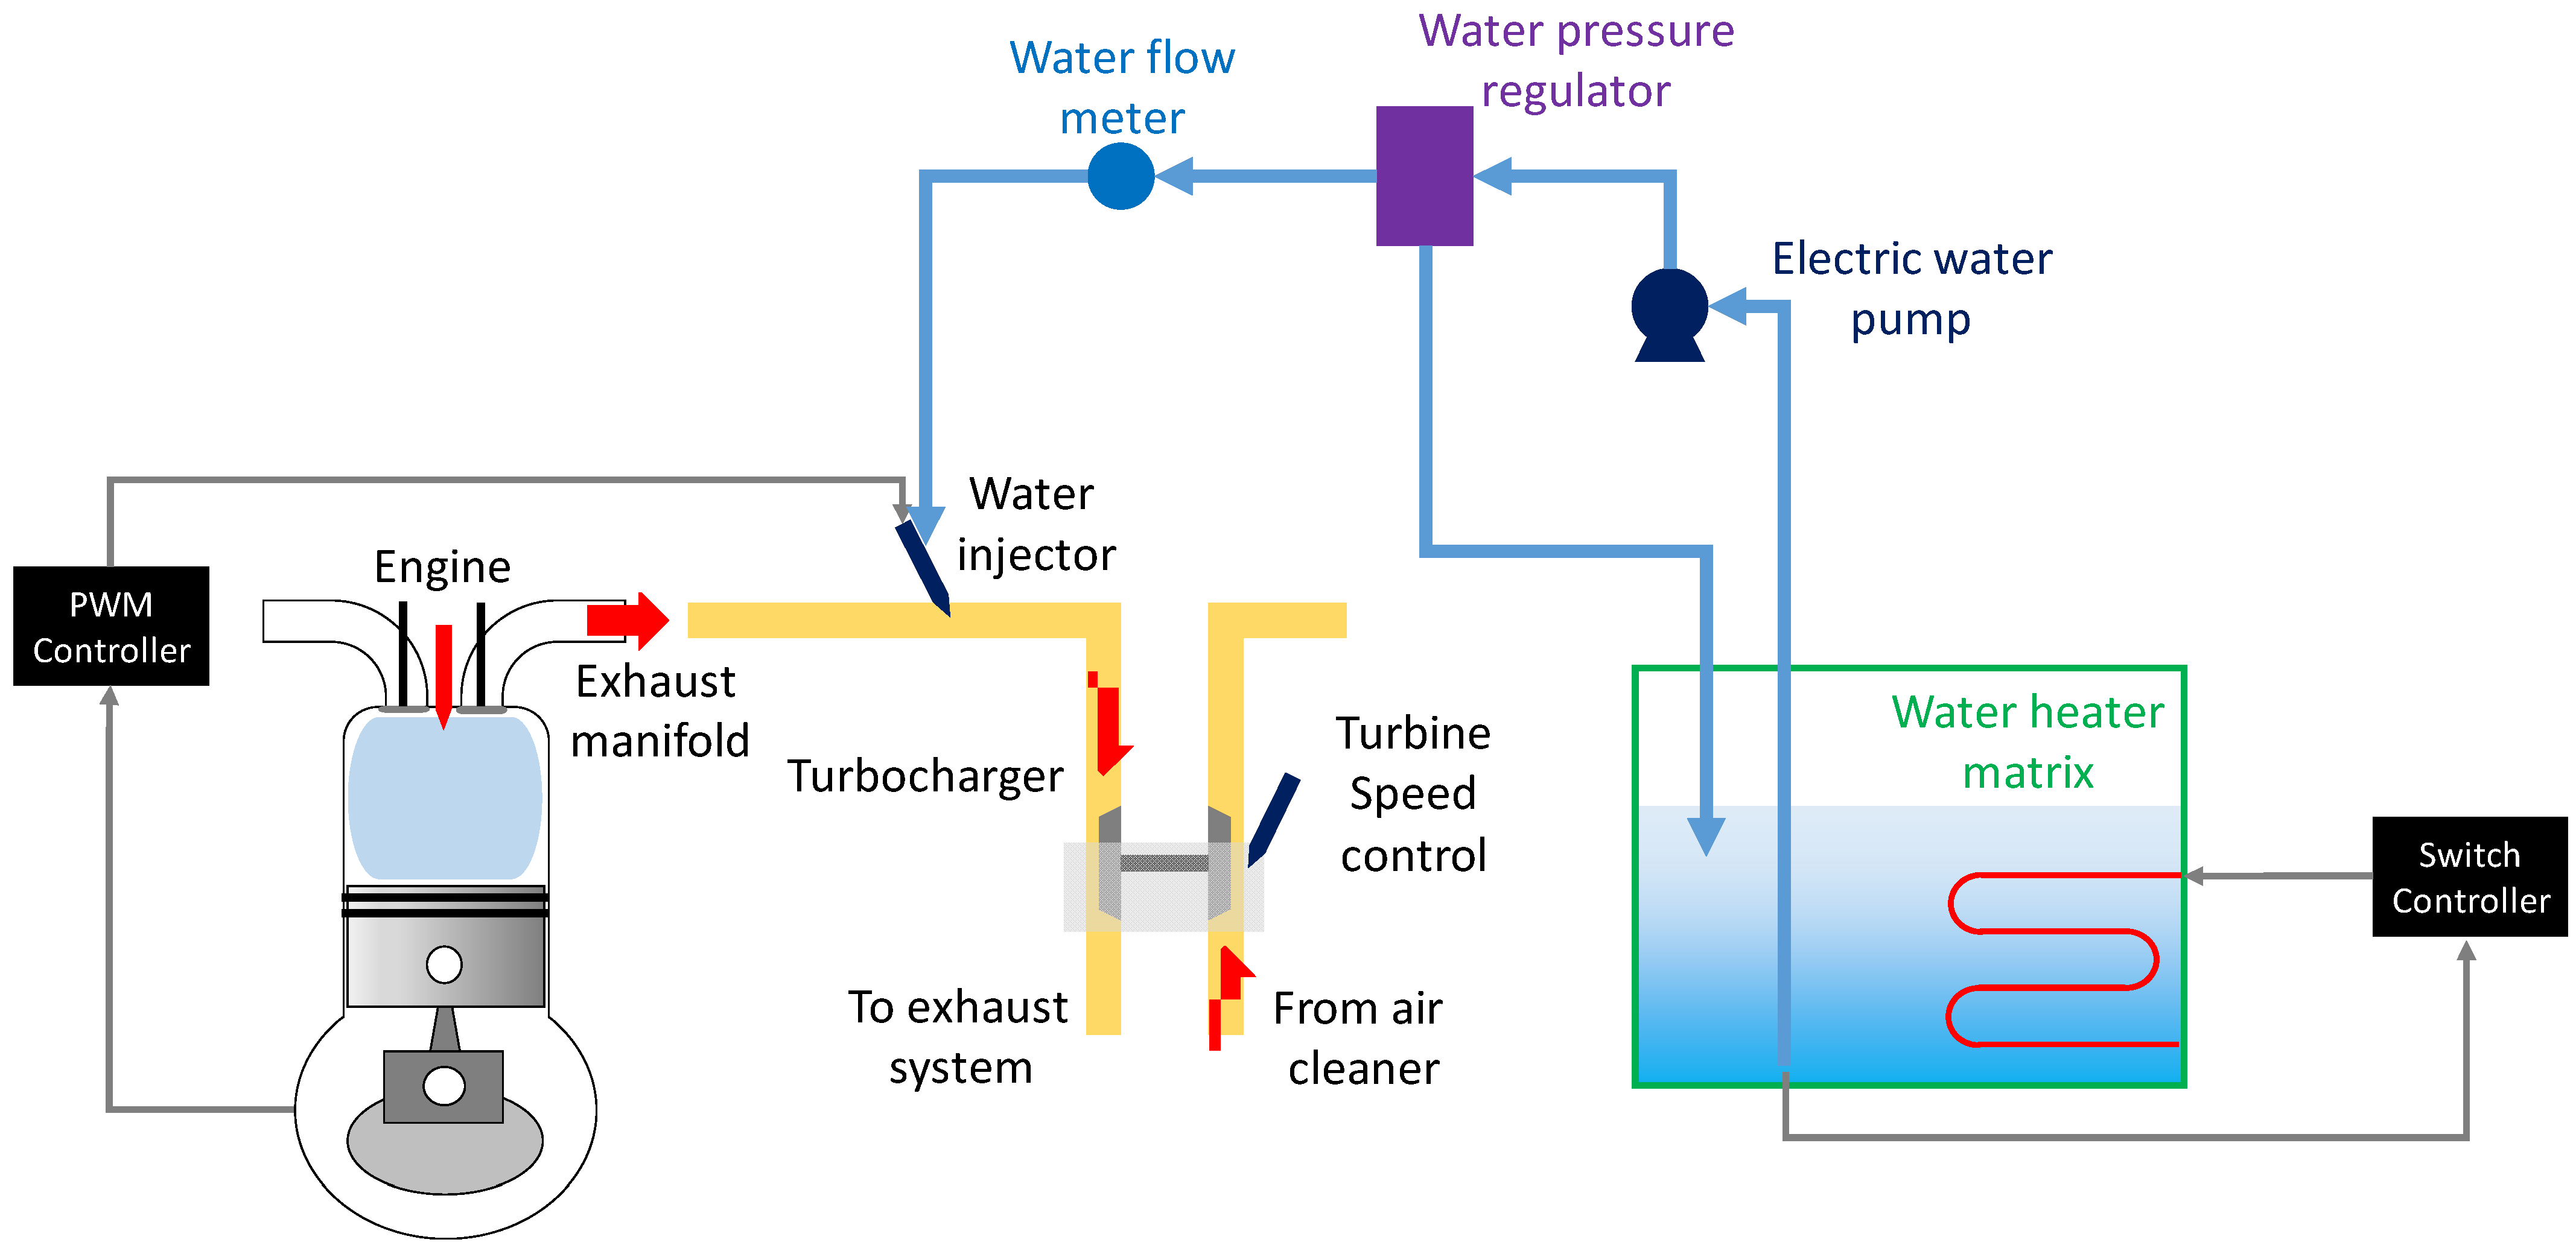
2.3. Experimental Setup

Engine testing in this study was merely to validate the 3D CFD simulation model before any sensitivity studies could be applied to the model. The TIT predicted by the CFD model was then validated with the experimental data logged from the thermocouple. The experimental work consisted of a test-rig setup, instrumentation and calibration of sensors, data acquisition, and post-processing.
The engine test bench consisted of a 1.3 L IAFM engine with a turbocharger mounted to the exhaust manifold system. The stock engine was equipped with all the essential sensors connected to the data acquisition system. The engine was controlled by the stock engine control unit (ECU). Figure 1 shows a detailed overview of the PTWI experiment setup. The WI system consisted of a water tank with a heater matrix, electric water pump, water pressure regulator, water flow meter, and was completed by a water injector.
Two experiment setups were carried out to strengthen the validation of the CFD model. The water injector was mounted 0.3 m from the turbine inlet in the first setup. The engine speeds tested in the first setup were 2500 rpm and 3000 rpm at wide open throttle (WOT). In the second setup, the water injector was placed closer to the exhaust manifold (1.8 m away from the turbine inlet), operating at 4500 rpm at WOT. In both setups, the exhaust downstream passed through a set of thermocouples and pressure transducers. The water and exhaust gas mixture flowed through another set of thermocouples and pressure transducers right before the turbine inlet.
A dual spray fuel injector was used to inject water regulated at 4 bar. Water at an ambient temperature of 27 °C was supplied using an industrial electrical water pump capable of 10 bar. The injector was connected to a power supply and operated via a switch. The injector was set to be continuous at 100% duty cycle. In both setups, the injector was angled at 45°, pointing toward the downstream of the exhaust gas flow. Table 1 shows the important specification of the main equipment used in the experiment.

2.4. 3D CFD Simulation Setup

The steady-state CFD simulation was used to understand the flow behaviour of mixing injected water with exhaust gas before entering the turbine. Besides, the study can also see the length required for both mediums to mix well. The numerical model was solved by using ANSYS CFX 15.0 commercial software. This is a multiphase flow because there is more than one fluid present. There are two main multiphase flow approaches in ANSYS CFX: Eulerian-Eulerian (EE) and Lagrangian-Eulerian (LE) particle tracking.
The study implemented the LE approach to solve the multiphase flow for this research. This is because Lagrangian tracking can capture each representative particle’s trajectory, mean diameter, and averaged temperature as a dispersed phase. Meanwhile, the continuous phase gas mixture must be computed by the Eulerian model. The tracking was carried out by forming a set of ordinary differential equations in time for each particle, consisting of equations for the position, velocity, temperature, and masses of species. Each particle is tracked from their injection point until escaping from the domain. The method integrates the three-dimensional trajectories of the particles based on the forces acting on them from the surrounding fluid and other sources [36,37].
The particles mentioned here was the representative particles, whereby the actual number of particles represented by these representative particles is called particle number rate. The particle number rate was determined from the mass flow rate assigned to the representative particle divided by the mass of an actual particle. LE was used instead of EE because it offers complete information on the behaviour of each particle. Even though LE requires very high computer resources when tracking a large number of particles, this was not the case here. Besides, LE also provides better details of mass and heat transfer.
The particle displacement is calculated using forward Euler integration of the particle velocity over timestep, δ t . From the ( d x p d t ) = U p , the particle displacement is given as:
x p n = x p o + U p o δ t
where the subscripts o and n refer to old and new values, respectively. U p is initial particle velocity. In forward integration, the particle velocity calculated at the start of the timestep is assumed to prevail over the entire step. At the end of the timestep, the new particle velocity is calculated using the analytical solution to the particle momentum equation:
m p d U p d t = F D + F B + F R + F V M + F P
The right-hand side of Equation (2) are all the forces acting on the particle, including drag force ( F D ), buoyancy force ( F B ), rotation force ( F R ), virtual or added mass force ( F V M ), and pressure gradient force ( F P ). Refer to ANSYS CFX Theory Guide [36] for the detailed equation of each force.
In general, the transport equation is written as:
d ϕ p d t = ( ϕ f + ϕ p ) τ + R
where ϕ is a generic transported variable, subscript f indicates the value of the variable in the surrounding fluid, τ is a linearisation coefficient, and R is a general non-linear source. In the calculation of forces and values for τ and R, many fluid variables, such as density, viscosity, and velocity, are needed at the position of the particles. These variables are always obtained accurately by calculating the element in which the particle is travelling, calculating the computational position within the component, and using the underlying shape functions of the discretisation algorithm to interpolate from the vertices to the particle position.
The interphase transfer in this research is two-way coupling instead of one-way coupling. One-way coupling is typically used in the flow whereby the dispersed phase has low particle loading, where the effect of the particle on the continuous fluid flow is negligible. Two-way coupling enables the dispersed particle and the continuous flow to influence and exchange momentum with each other. Therefore, the two-way coupling is more suitable in the CFD model.
The liquid evaporation model in ANSYS CFX was used to compute the particles with heat and mass transfer. The model used two mass transfer correlations depending on whether the droplet is above or below the boiling point. The boiling point is determined through an Antoine equation, a vapour pressure equation that describes the relation between vapour pressure, P v a p and temperature for pure components. The particle is boiling if P v a p is greater than ambient pressure. When the particle is above the boiling point, the mass transfer is determined by:
d m p d t = Q C + Q R H
where H is the latent heat of evaporation of the particle, while Q C and Q R are the convective and radiative heat transfer, respectively.
When the particle is below the boiling point, the mass transfer is given by:
d m p d t = π   d p   ρ   D   S h W c W G   ln ( 1 X S V 1 X v a p V )
where   d p is the droplet diameter, ρ D is the dynamic diffusivity of the component in the continuum, S h is the Sherwood number, W c and W G are the molecular weights of the vapour and the mixture in the continuous phase, respectively, X S V is the equilibrium vapour mole fraction of the evaporating component at the droplet surface, and X v a p V is the mole fraction of the evaporating component in the gas phase.
The mass source to the continuous fluid is obtained from:
d S d t = d m p d t
The spray droplet breakup and collision were not considered for this research because the particle mass loading is relatively low. Mass loading is the ratio of the mass flow rate of the particle to the mass flow rate of the fluid. A standard particle wall interaction was used to describe the action of a particle when they hit the wall, instead of the advanced interaction model available in CFX, such as the Elsaesser and Stick-to-wall models. This is because Elsaesser is only valid for gasoline and aluminium in ICE applications. Moreover, these two advanced interaction models compute the wall film, valid only in a transient simulation.
For standard particle-wall interaction, the momentum changes of the droplet when hitting the wall is determined by the perpendicular and parallel coefficient of restitution. The coefficient value of 1 represents the elastic collision. The parallel coefficient should always be 1, while the perpendicular coefficient depends on the particle material. In this case, the water droplet will cause a wall wetting phenomenon, so this study defined the perpendicular coefficient of restitution as 0 to eliminate any particle reflection. To better understand the model, please refer to the illustration in Figure 2.
In the LE simulation, the turbulence model was applied to the continuous phase. The turbulence can affect the particles through particle dispersion force, but the influence of particles to the continuous phase is not more than the velocity field of the continuous phase. The exhaust gas was computed as a turbulence flow. In this research, the study selected the two-equation k-epsilon ( k ϵ ) turbulent model to solve the Reynold stress term of the Reynold-averaged Navier–Stokes (RANS) equation. This is because it is applied widely and can predict turbulence flow in a pipe with sufficient accuracy.
In CFX 15.0, scalable wall functions are used instead of the wall function, which is very sensitive to the near-wall mesh refinement. The boundary layer can be broken down into a viscous sublayer, log-layer, and outer layer. The first cell height must be in the log law layer. Thus, refining mesh does not produce an accurate result. Using the scalable wall function, on the other hand, the program will ignore the cell before y+ = 11.06, if the first layer of the prism height is in the viscous sublayer. The scalable wall function allows the study to refine the prism size without worrying about it falling under the viscous sublayer and allows consistent meshing for all the boundary conditions involved in this research.
The 3D cylindrical domain with different domain diameters was modelled using computational aid design software. The geometry was then imported into CFD commercial software for the meshing process. The geometry was simplified without some sort of protrusion for the injector, as shown in Figure 3. After the mesh refinement, the model was transferred to ANSYS CFX Pre to set up the boundary conditions and subsequently solve the model. Finally, the post-processing was accomplished by ANSYS CFD-Post.
Figure 4 showcases the average cross-sectional temperature of a 50 mm cylindrical domain obtained from the solved model for different mesh sizes. The mesh size chosen is enough to predict the temperature that is 1% different from the temperature predicted by the finer mesh.
The refined mesh was then transferred to ANSYS CFX Pre for boundary condition definition. At the inlet boundary, the mass flow rate and temperature were specified based on the experimental data. The flow of air is normal to the inlet boundary. The exhaust gas was set to be a continuous flowing gas mixture. The pressure of the turbine inlet from the experiment is applied to be the average static pressure across the outlet boundary plane. For the wall, the no-slip boundary condition was specified. The heat transfer at the wall was computed as adiabatic. The pressure, velocity, and flow rate at the boundaries was calculated by the Bernoulli equation. It is always important to set the buoyancy force in multiphase flow, including particle tracking. This is due to the density difference of the two phases involved. This study calculated the density of exhaust gas from the ideal gas equation before inputting it for numerical calculation.
The injection particles were specified to be fully coupled with the gas mixture. The drag force of the representative particle was computed by Schiller-Naumann equation. The heat transfer, on the other hand, was calculated by the Ranz-Marshall model. The particle injection region was set as a cone shape. The radius of the plane and dispersion angle were based on the injector specification used in the experiment. The temperature and pressure of injected water were obtained from the experimental data. The injection point was located 50 mm after the domain inlet to match the distance between the injector and pressure transducer before it.
After the baseline CFD model was validated, the study conducted a few sets of sensitivity studies to investigate the effect of the PTWI on the TIT. They are the water injection pressure, the diameter of the turbine inlet connection pipe, and the distance of the injection point from the turbine inlet. All the sensitivity studies focused on the effect of PTWI at 3000 rpm, 4000 rpm and 5000 rpm at 100%, 75% and 50% engine load. This is because fuel enrichment is inevitable at the medium–high engine speed and load operation. Table 2 explains the combination of numerical simulation cases done in the research. Before that, the study set the three diameter sizes of the turbine inlet connecting pipe in the 1D engine model to obtain the temperature and pressure from the cases. The data obtained were plugged into the boundary condition of the air inlet in the CFD model for further action.
After analyzing the results from the sensitivity studies, the study determined the most effective PTWI setup, at least based on the viability of the concept onto the automotive engine. The temperature drop (ΔT) was transferred to the 1D engine model to investigate its effect on the engine as a system.

2.5. 1D Engine Modelling of SI Turbocharged Engine

To investigate the effect of pre-turbocharger turbine water injection on the engine system, the temperature reduction obtained from the CFD simulation was plugged into the engine model. The study utilised AVL BOOST (AVL List GmbH), commercial 1D engine simulation software. The engine model is comprised of all the main components, such as throttle, cylinder, engine, plenum, injectors, turbocharger, intercooler, and air filter. Measuring points (MP) were placed at the exact location where the transducers were installed in the test bench engine. All the engine components in the engine model were arranged as close as possible to the engine test bench setup.
Due to the nature of the 1D simulation, the input data is crucial to ensure the result accuracy. Therefore, the precise dimensions of the intake and exhaust connection pipe were first measured. The specifications of main components are all based on the manufacturer specification. The main specification is shown in Table 3.

2.5.1. 1D Numerical Modelling of the SI Engine

Connecting Pipes

The connecting pipes are the most used components in the engine model, so it is crucial to make sure that the numerical model can capture the flow, covering the whole engine operating map. Instead of three-dimensional flow like the CFD model, all the fluid flows were solved as one-dimensional or one-directional in the engine model. The Euler equation was used to capture the one-directional flow. Besides, the fluid in the pipes was solved as the gas state. The equation is shown below:
U t + F ( U ) x = S ( U )
where U and F represent the state vector and flux vector, respectively, which are shown as:
U = ( ρ ρ · u ρ · c v ¯ · T + 1 2 · ρ · u 2 ρ · w j )
F = ( ρ · u ρ · u 2 u · ( E + p ) ρ · u · w j )
The energy, E in the flux vector is represented by:
E = ρ · c v ¯ · T + 1 2 · ρ · u 2
The source term, S ( U ) in Equation (7) contains two different source terms which are best to be described as:
S ( U ) = S A ( F ( U ) ) + S R ( U )
S A is the source caused by axial changes in the cross-section of the pipe, while S R ( U ) takes into account the homogeneous chemical reaction, heat and mass transfer term between the gas and solid phase as well as friction. Both source terms are given by:
S A ( F ( U ) ) = 1 A · d A d x · ( F + ( 0 p 0 0 ) )
S R ( U ) = ( 0 F R V q w V M W j · ( i R h o m v i · j · r i ˙ ) )

Heat Transfer

The convective heat transfer between the gas and the pipe wall is modelled via the Nusselt approach:
N u = α g w · d h y d λ g
where α g w represents the heat transfer coefficient between gas and wall, d h y d stands for hydraulic diameter (which depends on the inner diameter of the pipe), and λ g is the thermal conductivity of the gas.
The Nusselt number can be viewed as a dimensionless convection heat transfer coefficient, which represents the ratio of convection to conduction across the same fluid layer [38]. A large Nusselt number indicates that the convection is more effective, while a N u of 1 shows that the heat transfer is purely by conduction within the same fluid layer. In this research, the study used the Reynold analogy, which is shown as follows, assuming the flowing gas is an ideal gas:
N u = d h y d λ g · 0.019 8 · ρ · u · c p
All the parameters in Equation (15) that lead to a Nusselt number can be obtained easily. It was then brought to Equation (14) where the heat transfer coefficient can be obtained. Consequently, the convective heat transfer was quantified.

Turbocharger

The most important turbocharger elements are the compressor and turbine maps. They are also known as the performance map, whereby different turbocharger models have different performance maps, provided by the manufacturer. AVL BOOST version 2016 and above have BOOST Turbocharger Tool, a dedicated tool for performance map generation. The study utilized the validated performance map from the engine testing bench on the engine model in the research.
The power provided by the turbine ( P T ) is determined by the turbine mass flow rate and the enthalpy difference over the turbine, from Equation (17). In the following equations, subscripts 1 and 2 represent the inlet and outlet of the compressor, respectively, while subscripts 3 and 4 indicate the inlet and outlet of the turbine.
P T = m T ˙ · η m · ( h 3 h 4 ) ˙ ¯
h 3 h 4 = η s ,   T · c p · T 3 · [ 1 ( p 4 p 3 ) k 1 k ]
On the other hand, the power consumption of the compressor ( P c ) relies on the mass flow rate in the compressor and the enthalpy difference over the compressor from Equation (19). The latter is influenced by the pressure ratio, the inlet air temperature, and the isentropic efficiency of the compressor.
P C = m c ˙ · ( h 2 h 1 ) ˙ ¯
h 2 h 1 = 1 η s ,   c · c p · T 1 · [ ( p 2 p 1 ) k 1 k 1 ]
For this research, the full model compressor was chosen for its integration of mechanical network and rotor speed dynamically. The overall efficiency of the turbocharger ( η T C ) is defined as follows:
η T C = η m , T C · η s , T · η s , c
where η m , T C is the mechanical efficiency of the turbocharger.
The study also used the internal boost pressure controller to specify the target compressor pressure ratio based on the pressure ratio obtained from the engine testing bench.

Cylinders

The thermodynamic calculation in the cylinder is based on the first law of thermodynamics, which states that the total energy of the system during a process is equal to the difference between the total energy entering and the total energy leaving the system during that process. In this case, the change of internal energy in the cylinder is equal to the sum of piston work, fuel heat input, wall heat losses, and the enthalpy flow due to blow-by.

2.5.2. Heat Transfer in the Combustion Chamber

The heat transfers to the wall of the combustion chamber, such as cylinder head, piston and cylinder liner, is calculated from:
Q w i = A i · α w · ( T c T w i )
where Q w i is the wall heat flow, A i is wall surface area, T c is the gas temperature in the cylinder, and T w i is wall temperature. The wall mentioned here is the wall of the combustion chamber. In this research, the heat transfer coefficient ( α w ) in the cylinder was obtained from the heat transfer model (Woschni model). It is one of the most widely used models, which performs well for traditional fossil fuels, as was used in [39]. For the high-pressure cycle, the model is summarized as follows:
α w = 130 · D c y l 0.2 · p c 0.8 · T c 0.53 · [ C 1 · c m + C 2 V D · T c , 1 p c , 1 · V c , 1 · ( p c p c , 0 ) ] 0.8
where C 1 = 2.28 + 0.308 · c u c m and C 2 = 0.00324 .
For the gas exchange process, the heat transfer coefficient ( α w ) is obtained from the equation below:
α w = 130 · D c y l 0.2 · p c 0.8 · T c 0.53 · [ C 3 · c m ] 0.8
where C 3 = 6.18 + 0.417 · c u c m

Port Heat Transfer

On the other hand, the modified Zapf heat transfer model, Equation (24) is used in the BOOST code to predict the heat transfer at intake and exhaust ports. During the gas exchange process, it is crucial to take the heat transfer of the ports into account. This is because the heat transfer could be a lot higher than that in a simple pipe flow, due to the high heat transfer coefficients and temperatures in the region of the valves and valve seat.
T d = ( T u T w ) · e A w · α p m ˙ · c p + T w
In this context, the heat transfer coefficient, α p , depends on the direction of the flow. For the flow out from the cylinder (exhaust port), the formula is:
α p = [ C 4 + C 5 · T u C 6 · T u 2 ] · T u 0.44 · m 0.5 ˙ · d v i 1.5 · [ 1 0.797 · h v h v i ]
where C 4 = 1.2809 , C 5 = 7.0451 · 10 4 , and C 6 = 4.8035 · 10 7
For the flow into the cylinder (intake port), the formula is:
α p = [ C 7 + C 8 · T u C 9 · T u 2 ] · T 0.33 · m 0.68 ˙ · d v i 1.68 · [ 1 0.765 · h v h v i ]
where C 7 = 1.5132 , C 8 = 7.1625 · 10 4 , and C 9 = 5.3719 · 10 7

Combustion

The simplest method for BOOST code to predict the combustion characteristic is to directly specify the rate of heat release (ROHR). The option to input ROHR is via a curve table, single Vibe Function, Double Vibe function, and Vibe Two Zone. For accurate engine simulation, the actual heat release characteristic of the engine obtained from the measured cylinder pressure history was matched as accurately as possible.
The Vibe function is often used to approximate the actual heat release characteristics of an engine. The study was required to define the start and duration of combustion, and the parameters “m” and “a”, which are the Vibe function shape parameter and Vibe function parameter, respectively.
However, the cylinder pressure data was unavailable, so the study used the standard shape parameter “m” of 2 suggested by the BOOST User Manual, based on the type of engine and its operating range. Figure 5 provides a better illustration of how the shape parameter “m” affect the rate of heat release before and after the top dead centre (TDC). The parameter “a” is a constant of 6.9, which characterizes the completeness of the combustion.

2.5.3. Engines

The Patton, Nitschke, and Heywood (PNH) model was chosen to calculate the friction losses associated with the main bearing, the valve train, piston group, and auxiliary components. The total friction mean effective pressure (FMEP) is calculated as follows:
F M E P T O T = ( F M E P C S + F M E P P + F M E P V T + F M E P A U X + F M E P I P ) · ( ν T o i l ν T o i l = 90 ) 0.24
The last term takes the effect of a changing oil viscosity as a function of oil temperature. For the specific friction contribution of each FMEP (crankshaft, reciprocating piston group, valve train, and the auxiliary and injector pump), refer to BOOSTTM Theory.

Engine Model Setup

Figure 6 presents the 1D engine model developed. System boundaries (SB1 and SB2) were set based on the surrounding condition of the experiment. The PNH model was used to calculate the friction loss in the engine associated with the main bearings, valve train, pistons, etc. The convective heat transfer between the gas and pipe wall was modelled by the Reynold analogy approach. The heat transfer factor and wall temperature at the connector pipe were tuned to yield the predicted temperature that matches the experimental temperature data.
The flow coefficient on the other hand was used to tune the pressure and mass flow of the throttle position across the operating range. The fuel injectors (I1, I2, I3, and I4) injected the fuel based on the mass flow rate of the intake air. The ECU controlled that air-fuel ratio (AFR), variable intake valve timing (VVT), and ignition timing. The engine speed and throttle position were set as the function at ECU to control the AFR, VVT, and ignition timing. All the parameters at ECU were obtained from the experiment. The AFR mapping and flow coefficient are shown in Figure 7 and Figure 8.
The single Vibe function was used to describe the combustion process in the cylinder via the rate of heat release. The combustion duration was set between 50 to 59 CAD depending on the engine speed, based on the AVL BOOST user manual. The heat transfer to the wall of the combustion chamber, such as cylinder head, piston, and cylinder liner was calculated using the Woschni model. The wall temperature was unavailable in experimental data. Therefore, it is taken from the similar tutorial model available in AVL resources. The same goes for the flow coefficient of intake and exhaust valves, which are illustrated in Figure 9. The inner valve seat diameter was used to define the normalized valve lift. The valve lift profile of intake and exhaust valves were based on the experiment setting, shown in Figure 10.
After inputting all the data for engine components, the simulation control was defined. The target average cell size of spatial pipe discretization is 30 mm. The governing equation of every parameter in the model was numerically solved at each cell. The engine model operating conditions were WOT, 75%, 50%, and 25% of the load from 1000 rpm to 5000 rpm with 500 rpm steps. This was to make sure the repeatability of the tuned model.

Engine Model Validation

To validate the model, all the crucial engine parameters at different loads and engine speeds from the simulation were compared with experimental data. Those crucial parameters were engine torque, pressure and temperature of turbocharger inlet and outlet, intake airflow, and exhaust pressure and temperature. The comparison graphs are plotted for each parameter so that the variation of simulation and experimental data can be observed. The study tuned the model until the variation of all the crucial parameters were below 5%.

Lambda 1 Engine Operation

The stoichiometric AFR of gasoline is 14.7. However, it was impossible to maintain it at 14.7 when the engine operated at high load and high rpm conditions. This is because the material of the turbine vane has a lower permissible thermal limit. Hence, the fuel enrichment was applied to control the turbine inlet temperature, maintaining it below 930 °C in this case.
The CFD analysis shows that the pre-turbine water injection was proven to reduce the turbine inlet temperature by some margin, ranging from 40 °C to 70 °C depending on the operating point. Therefore, Lambda 1 stoichiometric condition is possible by reducing the fuel enrichment. Determining the best possible setting from the CFD result, the temperature reduction by those settings were transferred into the engine model. To accomplish this, the heat transfer coefficient of the turbine inlet connecting pipe was tuned to match the flow temperature at the turbine inlet connecting pipe predicted by the engine model to the CFD model.
The AFR map of the ECU in the engine model was set to stoichiometric combustion. The fuel consumption and engine performance across the selected operating points were tabulated and plotted into a series of graphs for comparison.

3. Result and Discussion

3.1. 3D CFD Model Validation

The CFD baseline model was validated over two experimental setups. Figure 11 indicates the exhaust temperature reduction of 80 to 100 °C after PTWI. The location of the injector, water temperature, and some other parameters were different in the setup that operated at 4500 rpm, which caused a lower exhaust temperature compared to 3000 rpm. Nevertheless, the simulation result represented by the red line achieved good agreement with less than 5% of relative error, despite the differences in both setups.

3.2. 1D Engine Model Validation

The engine model validation was carried out over the wide operating ranges, from 1000 rpm to 5000 rpm, over 100%, 75% and 50% of load. The important parameters were plotted on the graph against engine speed to compare the simulation and experimental data. To emphasis, the experimental data used was provided by engine testing carried out in LoCARtic. This procedure was repeated for 50% and 75% engine load. Figure 12, Figure 13 and Figure 14 show the comparison of the results between experiment and simulation running at different loads, 100%, 75% and 50% The black plot indicates experiment data while the red plot indicates simulation data. Almost all the simulation results had been tuned and exhibited good agreement with experimental data, with the deviation within 5%. Hence, the baseline engine model was validated for further action.

3.3. CFD Parametric Studies

Figure 15 shows the trajectory of computed particles in the exhaust gas. It can be observed that the particles are capable of penetrating the exhaust gas. However, the spray penetration tip collides with the wall after a certain length due to the buoyancy force defined in the CFD numerical model. Water droplets will not bounce back when they collide with the domain wall, because this is the nature of water, and it is known as wall wetting. The wall wetting can be seen in Figure 16 where the water mass fraction at the bottom of the domain increased after it reached a steady-state condition.
The initial temperature of injected water was 27 °C. Based on Figure 15, however, the average temperature of water droplets increased from the injection point to the spray penetration tip. This is because the liquid water droplet absorbed the thermal energy of exhaust gas via forced convection. The enthalpy of the exhaust was transferred to the water droplets to heat the droplet surface and then vaporize them into vapour. Thus, it can be concluded that the water spray had a cooling effect on the exhaust gas by comparing the particle tracking in Figure 15 and the temperature contour in Figure 17.
The average particle size was estimated at 268 microns when the injection pressure is 4 bar, based on Equation (9). Figure 18 presents the averaged droplets diameter as a body instead of particle track. It can be observed that the average particle diameter near the exhaust gas flow decreased, showing that the evaporation of liquid water droplet occurs. The droplets will exhibit gas like properties when the diameter is less than 100 microns [42]. Since the initial water droplet size is substantially larger than 100 microns, it might require a longer penetration length to let the liquid water droplet change its state. In this context, a higher injection pressure should increase the water droplet fineness to allow better mixing and evaporation [43]. However, penetration tip length and wall wetting are the critical parameters to be optimized together with the injection pressure to decrease the evaporation time.
To better understand the spray cooling behaviour, the study compared the temperature contour between different engine speeds while keeping other variables controlled (as shown in Figure 19). As the exhaust flow increases, the drag force increases as well, which increases the spray penetration tip length. This also reduces the wall wetting phenomena, which improves the cooling efficiency, even though it might require a longer turbine connecting pipe, which affects the feasibility with limited space in the engine bay of an automobile. In Figure 19, the exhaust temperature at 4000 rpm is slightly lower than 3000 rpm due to excessive fuelling to maintain turbine inlet temperature during the engine testing.

3.3.1. Injection Pressure

The injection pressure has a direct relationship with droplet size. The higher the pressure, the finer the droplet produced. Besides, injection pressure also influences the initial velocity of the droplet leaving the nozzle. Therefore, a higher-pressure spray has stronger penetration energy. The temperature contour is satisfied to represent the trajectory of the water droplet. All the operating points in Figure 20 are running in the 30 mm diameter domain. In this case, the study chose the highest and lowest exhaust gas flow as a comparison. They are WOT running at 5000 rpm and 50% throttle running at 3000 rpm. The figure shows that higher injection pressure is not the most effective to cool down the exhaust gas.
High injection pressure increased the momentum of the particles, which increases the penetration energy. As the initial velocity of the particles increases, its relative velocity with the exhaust flow decreases. This leads the droplets to reach the bottom of the pipe quicker with shorter penetration tip length. Hence, a larger percentage of particles collide at the pipe wall, deteriorate the cooling efficiency. This reduces the droplet evaporation time and, therefore, the temperature drop at 10 bar of injection is generally lower than that of 4 bar.
However, the study suggested that the optimization of the injection pressure and spray angle based on the exhaust gas flow is crucial to improve the cooling efficiency while maintaining the turbine inlet pipe length within the practical limit. With a higher injection pressure that produces particles of 150 microns, the water consumption for PTWI can also be reduced. This is because the total surface area and time available for droplet evaporation increased, which converted to a larger TIT reduction. Besides, the finer particles have smaller momentum and are highly influenced by the drag force of the exhaust gas, consequently, reducing the wall wetting phenomena due to the longer spray penetration tip. Though, the length required for the mixing might increase.

3.3.2. Diameter of Turbine Inlet Connecting Pipe

From Figure 21, it can be observed that the cooling effect is effective in the pipe of 50 mm diameter. In the larger pipe, the length of the spray penetration tip was longer due to the long vertical space. Therefore, less percentage of water was wasted wetting the wall, improving the cooling efficiency. Besides, the air velocity reduces when the pipe diameter increases based on Bernoulli’s principle. In steady-state evaporation, the relative velocity does not affect the forced convection temperature of the droplet [43]. Referring to Table 4, Table 5 and Table 6, the TIT drop in the 50 mm diameter pipe is higher, probably due to the reduced wall wetting phenomena.

3.3.3. Injection Distance from Turbine Inlet

As seen in Figure 22, the maximum cooling area across the cross-sectional area dropped to the bottom of the pipe as the distance is farther away from the injection point. This is because the density of the water is higher than the exhaust gas. This also explained why the average temperature drop is reduced after 150 mm from the injection point in the 50 mm pipe (as shown in Table 6).
From the results above, we can highlight that spray penetration tip control is crucial where a control system should be required to adjust the injection quantity of the injector based on the exhaust flow. Depending on the injector specification, the injection pressure needs to be optimized to improve the cooling efficiency and reduce the length required to vaporize the liquid water droplet. This is important because the excess water may cause turbine malfunction due to corrosion.

3.4. PTWI as an Enabler of Stoichiometric Operation

There were 81 operating points studied in the CFD analysis. The study chose the cases in which the temperature drop of the exhaust are the highest. Referring to Table 4, Table 5 and Table 6, their highest temperature drop for the selected operating point is when the water was injected into the exhaust gas flowing through a 50 mm diameter pipe.
Before the implementation of PTWI, the engine needs to run with a rich mixture at medium to high loads and engine speeds to control the exhaust temperature, so that it does not exceed the permissible thermal limit of the catalytic converter and turbine vane. However, PTWI reduces the TIT and thus enables the engine to run at stoichiometric combustion (λ = 1).

3.4.1. Effect of PTWI on the Fuel Consumption

Figure 23 indicates that the fuel consumption reduction is substantial when the engine is operating with 4500 rpm and 5000 rpm at WOT and 75%. At 4000 rpm with 75% load, the fuel consumption reduction is the highest (13.67%). For both full load and 75% load, the fuel consumption is minimal at 3000 rpm. This is because a significant fuel enrichment was not required at medium speed. This can be seen for 50% load where the fuel consumption remains almost the same as it before PTWI implementation.

3.4.2. Effect of PTWI on the Engine Performance

In theory, the engine performance will remain the same, switching from rich combustion to stoichiometric combustion. However, as seen in Figure 24, there was a slight drop in performance, up to 4.5% when the engine is running at 5000 rpm with 75% and 50% load. This slight performance drop was due to the excessive cooling effect from the PTWI in this research, which reduces the efficiency of the turbine. The lambda (λ) was tuned during the engine testing to cap the exhaust temperature at 930 °C via fuel enrichment. Therefore, at the engine operating point where fuel enrichment was applied, the turbine work is already at the maximum the system can produce. Hence, with proper tuning and optimization of the injection quantity to control the temperature drop based on the exhaust flow, the performance could be maintained.

4. Conclusions

The proposed PTWI concept as an enabler of stoichiometric combustion was investigated. The experiment was conducted with a 1.3 L turbocharged 4-cylinder engine with the exhaust pipe modification to adopt PTWI. CFD commercial software, ANSYS CFX, was utilized to set up a numerical model that is capable of predicting the exhaust temperature after WI. Using the 1D engine simulation software, AVL BOOST, the engine model was developed, tuned, and verified by the available experimental results from another 1.6 L engine on the engine test bench. The sensitivity study was carried out for the CFD model by using these parameters. They are water injection pressure, injection location, and the diameter of the turbine inlet connecting pipe. The fuel enrichment was applied during the engine testing. Therefore, the cooling effect of the PTWI replaces the fuel as the medium to control the exhaust gas temperature. Since the PTWI had controlled the TIT, the TIT is no longer constraining the engine from running at stoichiometric combustion.
Gauge water injection pressures of 4 bar, 7 bar, or 10 bar, are all capable of penetrating the exhaust flow across the medium–high load and engine speed. Notably, 4 bar of injection pressure seems to cool down the TIT the most because of the lesser percentage of wall wetting. The spray angle and injection quantity are the critical parameters that are required to be optimized with the exhaust flow. Exhaust gas that flows through a 50 mm diameter pipe received the most temperature reduction. The lower relative velocity between exhaust gas and water droplets in the 50 mm pipe allows the forced convection to take place more effectively.
The fuel consumption is reduced because PTWI had enabled the engine to run at stoichiometric conditions. This is realized by the reduction of fuel enrichment, as the water replaced the fuel as the cooling agent of the exhaust gas. During WOT, the fuel consumption was reduced by up to 13% and 5% at 4000 rpm and 5000 rpm, respectively. For both 100% and 75% engine load, the fuel consumption reduction at 3000 rpm was minimal, because a smaller degree of fuel enrichment was applied during engine testing. At 50% engine load, the fuel consumption reduction was only noticeable at 5000 rpm, when it was reduced by 9.5%.
PTWI requires additional length for the connecting pipe to the turbine, which will influence the response of the turbine if the length is not optimized. Therefore, higher injection pressures that will produce finer particles could potentially cool down the turbine inlet temperature even more with a shorter mixing length.

Author Contributions

Conceptualization, L.C.H. and M.A.A.; methodology, I.V., L.C.H. and M.A.A.; software, I.V. and L.C.H.; validation, I.V. and M.I.; formal analysis, I.V., L.C.H. and M.I.; investigation, L.C.H. and M.I.; resources, M.A.A. and S.G.H.; data curation, I.V. and M.I.; writing—original draft preparation, L.C.H. and M.A.A.; writing—review and editing, I.V., M.I. and M.S.; visualization, L.C.H. and M.I.; supervision, M.A.A.; project administration, S.G.H.; funding acquisition, M.A.A. and M.S. All authors have read and agreed to the published version of the manuscript.

Funding

The authors would like to acknowledge the financial support from the Universiti Teknologi Malaysia under Flagship CoE/RG (Ref: PY/2022/04698, Cost Center No.: Q.J130000.5009.10G14). The APC was funded by Rabdan Academy.

Data Availability Statement

Not applicable.

Conflicts of Interest

The authors declare no conflict of interest.

Abbreviations

1DOne-dimensional
3DThree-dimensional
AFRAir Fuel Ratio
BSFCBrake Specific Fuel Consumption
CICompression Ignition
CFDComputational Fluid Dynamics
CO2Carbon Dioxide
CRCompression Ratio
DWIDirect Water Injection
ECUEngine Control Unit
EEEulerian-Eulerian
EGRExhaust Gas Circulation
EXPExperimental
FMEPFriction Mean Effective Pressure
GDIGasoline Direct Injection
HCHydrocarbon
ICEInternal Combustion Engine
IiInjector-i
IMEPIndicated Mean Effective Pressure
LELagrangian-Eulerian
MBTMaximum Brake Torque
NONitrogen Monoxide
NOxNitrogen Oxide
PNHPatton, Nitschke and Heywood
PTWIPre-turbocharger Turbine Water Injection
PWIPort Water Injection
ROHRRate of Heat Release
SBiSystem Boundary-i
SISpark Ignition
SIMSimulation
TDCTop Dead Centre
TITTurbine Inlet Temperature
VVTVariable Intake Valve Timing
WIWater Injection
WLTCLight Vehicle Test Cycle
Greek and Roman Symbols
α g w Heat transfer coefficient between gas and wall
α p Heat transfer coefficient
α w Heat transfer coefficient
η T C Total efficiency of turbocharger
η m ,   T C Mechanical efficiency of turbocharger
η s , T   Isentropic efficiency of turbine
η s , c   Isentropic efficiency of compressor
λLambda
λ g Thermal conductivity of the gas
ϕfTransported variable, fluid
ϕpTransported variable, particle
δtTimestep
ρ Density
ρ D Dynamic diffusivity
τ Linearisation coefficient
ν T o i l Oil viscosity as a function of oil temperature
εTurbulence dissipation rate
A i Wall surface area
aVibe function parameter
CiConstant-i
cmMean piston speed
cpSpecific heat capacity of the wall layer
d p Droplet diameter
D h y d Hydraulic diameter
dviInner valve seat diameter
EEnergy in the flux vector
F Flux vector
FMEPAUXAuxiliary loss friction mean effective pressure
FMEPCSCrank shaft friction mean effective pressure
FMEPIPInjection pump friction mean effective pressure
FMEPPPiston friction mean effective pressure
FMEPTOTTotal friction mean effective pressure
FMEPVTValve train friction mean effective pressure
FDDrag force
FBBuoyancy force
FRRotation force
FVMVirtual or added mass force
FPPressure gradient force
hSpecific enthalpy
HLatent heat of evaporation of the particle
mVibe function shape parameter
mpParticle mass
nNew values
N u Nusselt number
oOld values
pPressure
P c Power consumption of compressor
PvapVapour pressure
QcConvective heat transfer
QRRadiative heat transfer
Q w i Wall heat flow
RGeneral non-linear source
S A Source caused by axial changes in the cross-section of the pipe
S h Sherwood number
TTemperature
T c Gas temperature in the cylinder
T w i Wall temperature
U State vector
UpParticle velocity
VVelocity
W c Molecular weights of the vapour in the continuous phase
W G Molecular weights of the mixture in the continuous phase
xParticle displacement
X S V Equilibrium vapour mole fraction of the evaporating component at the droplet surface
X v a p V Mole fraction of the evaporating component in the gas phase

References

  1. Iacobacci, A.; Valentino, G.; Marchitto, L. Water Injection to Enhance Performance and Emissions of a Turbocharged Gasoline Engine under High Load Condition. SAE Int. J. Engines V126 3EJ 2017, 10, 928–937. [Google Scholar]
  2. Chen, B.; Zhang, L.; Zi, D.; Chen, X.; Zhang, Q. Investigating Effects of Water Injection on Availabilities of a Turbocharged Gasoline Direct Injection Engine. J. Energy Eng. 2019, 145, 04019021. [Google Scholar] [CrossRef]
  3. Tornatore, C.; Siano, D.; Marchitto, L.; Iacobacci, A.; Valentino, G.; Bozza, F. Water Injection: A Technology to Improve Performance and Emissions of Downsized Turbocharged Spark Ignited Engines. SAE Int. J. Engines 2017, 10, 2319–2329. [Google Scholar] [CrossRef]
  4. Rothrock, A.M.; Krsek Jr, A.; Jones, A.W. The Induction of Water to the Inlet Air as a Means of Internal Cooling in Aircraft Engine Cylinder; National Advisory Committee for Aeronautics; Langley Aeronautical Lab.: Langley Field, VA, USA, 1943.
  5. Boretti, A. Water injection in directly injected turbocharged spark ignition engines. Appl. Therm. Eng. 2013, 52, 62–68. [Google Scholar] [CrossRef]
  6. Brooke, L. Bosch developing new water-injection system for production engines. Automot. Eng. SAE Int. 2015, 2018. [Google Scholar]
  7. Bulander, D.R. Powertrain Optimization using a Comprehensive Systems Approach. In Proceedings of the 36th Interational Vienna Motor Symposium 2015; Bosch: Vienna, Austria, 2015. [Google Scholar]
  8. Worm, J.; Naber, J.; Duncan, J.; Barros, S.; Atkinson, W. Water Injection as an Enabler for Increased Efficiency at High-Load in a Direct Injected, Boosted, SI Engine. SAE Int. J. Engines V126 3EJ 2017, 8, 951–958. [Google Scholar] [CrossRef]
  9. Worm, J. The Impact of Water Injection on Spark Ignition Engine Performance under High Load Operation; Michigan Technological University: Michigan, IN, USA, 2017. [Google Scholar]
  10. Karagöz, Y.; Yüksek, L.; Sandalcı, T.; Dalkılıç, A.S. An experimental investigation on the performance characteristics of a hydroxygen enriched gasoline engine with water injection. Int. J. Hydrogen Energy 2015, 40, 692–702. [Google Scholar] [CrossRef]
  11. Brusca, S.; Lanzafame, R. Water Injection in IC–SI Engines to Control Detonation and to Reduce Pollutant Emissions; SAE International: Warrendale, PA, USA, 2003. [Google Scholar]
  12. Miganakallu, N.; Naber, J.D.; Rao, S.; Atkinson, W.; Barros, S. Experimental Investigation of Water Injection Technique in Gasoline Direct Injection Engine; ASME: New York, NY, USA, 2017. [Google Scholar] [CrossRef]
  13. Subramanian, V.; Mallikarjuna, J.M.; Ramesh, A. Effect of water injection and spark timing on the nitric oxide emission and combustion parameters of a hydrogen fuelled spark ignition engine. Int. J. Hydrogen Energy 2007, 32, 1159–1173. [Google Scholar] [CrossRef]
  14. d’Adamo, A.; Berni, F.; Breda, S.; Lugli, M.; Fontanesi, S.; Cantore, G. A Numerical Investigation on the Potentials of Water Injection as a Fuel Efficiency Enhancer in Highly Downsized GDI Engines; SAE International: Warrendale, PA, USA, 2015; Volume 2015. [Google Scholar]
  15. Berni, F.; Breda, S.; Lugli, M.; Cantore, G. A Numerical Investigation on the Potentials of Water Injection to Increase Knock Resistance and Reduce Fuel Consumption in Highly Downsized GDI Engines. Energy Procedia 2015, 81, 826–835. [Google Scholar] [CrossRef] [Green Version]
  16. Battistoni, M.; Grimaldi, C.N.; Cruccolini, V.; Discepoli, G.; De Cesare, M. Assessment of Port Water Injection Strategies to Control Knock in a GDI Engine through Multi-Cycle CFD Simulations; SAE Technical Paper; SAE International: Warrendale, PA, USA, 2017; Volume 14. [Google Scholar] [CrossRef]
  17. Bozza, F.; De Bellis, V.; Teodosio, L.; Tufano, D.; Malfi, E. Techniques for CO2 Emission Reduction over a WLTC. A Numerical Comparison of Increased Compression Ratio, Cooled EGR and Water Injection 2018; SAE Technical Paper; SAE International: Warrendale, PA, USA, 2018. [Google Scholar] [CrossRef]
  18. Bozza, F.; De Bellis, V.; Giannattasio, P.; Teodosio, L.; Marchitto, L. Extension and Validation of a 1D Model Applied to the Analysis of a Water Injected Turbocharged Spark Ignited Engine at High Loads and over a WLTP Driving Cycle. SAE Int. J. Engines 2017, 10, 2141–2153. [Google Scholar] [CrossRef] [Green Version]
  19. Bozza, F.; De Bellis, V.; Teodosio, L. Potentials of cooled EGR and water injection for knock resistance and fuel consumption improvements of gasoline engines. Appl. Energy 2016, 169, 112–125. [Google Scholar] [CrossRef]
  20. Hoppe, F.; Thewes, M.; Baumgarten, H.; Dohmen, J. Water injection for gasoline engines: Potentials, challenges, and solutions. Int. J. Engine Res. 2016, 17, 86–96. [Google Scholar] [CrossRef] [Green Version]
  21. Schlueter, W.B.; Debuque, I.D. System and Method for Superheated-Water Injection System (SWIS). U.S. Patent 4,408,573, 11 October 1983. [Google Scholar]
  22. Binion, W.S. Cylinder Water Injection Engine. U.S. Patent 5,937,799, 17 August 1999. [Google Scholar]
  23. Binion, W.S. In-Cylinder Water Injection Engine. U.S. Patent 5,718,194, 17 February 1998. [Google Scholar]
  24. Mulye, N. Internally Cooled Internal Combustion Engine and Method Thereof. U.S. Patent Application 14/761,369, 12 October 2014. [Google Scholar]
  25. Mingrui, W.; Sa, N.T.; Turkson, R.F.; Jinping, L.; Guanlun, G. Water injection for higher engine performance and lower emissions. J. Energy Inst. 2017, 90, 285–299. [Google Scholar] [CrossRef]
  26. Hoppe, F.; Thewes, M.; Seibel, J.; Balazs, A.; Scharf, J. Evaluation of the Potential of Water Injection for Gasoline Engines. SAE Int. J. Engines 2017, 10, 2500–2512. [Google Scholar] [CrossRef]
  27. Arabaci, E.; İçingür, Y. Thermodynamic investigation of experimental performance parameters of a water injection with exhaust heat recovery six-stroke engine. J. Energy Inst. 2016, 89, 569–577. [Google Scholar] [CrossRef]
  28. Wei, M.; Nguyen, T.; Turkson, R.; Guo, G.; Liu, J. The Effect of Water Injection on the Control of In-Cylinder Pressure and Enhanced Power Output in a Four-Stroke Spark-Ignition Engine. Sustainability 2016, 8, 993. [Google Scholar] [CrossRef] [Green Version]
  29. Kim, J.; Park, H.; Bae, C.; Choi, M.; Kwak, Y. Effects of water direct injection on the torque enhancement and fuel consumption reduction of a gasoline engine under high-load conditions. Int. J. Engine Res. 2016, 17, 795–808. [Google Scholar] [CrossRef]
  30. Heywood, J.B. Internal Combustion Engine Fundamental; Mcgraw-Hill: New York, NY, USA, 1988; Volume 930. [Google Scholar]
  31. Bedford, F.; Rutland, C.; Dittrich, P.; Raab, A.; Wirbeleit, F. Effects of Direct Water Injection on DI Diesel Engine Combustion; SAE International: Warrendale, PA, USA, 2000. [Google Scholar] [CrossRef] [Green Version]
  32. Farag, M.; Kosaka, H.; Bady, M.; Abdel-Rahman, A.K. Effects of intake and exhaust manifold water injection on combustion and emission characteristics of a DI diesel engine. J. Therm. Sci. Technol. 2017, 12, JTST0014. [Google Scholar] [CrossRef] [Green Version]
  33. Taylor, J.; Fraser, N.; Wieske, P. Water Cooled Exhaust Manifold and Full Load EGR Technology Applied to a Downsized Direct Injection Spark Ignition Engine. SAE Int. J. Engines 2010, 3, 225–240. [Google Scholar] [CrossRef]
  34. Fenske, J. (Ed.) Why Does Volkswagen Have a Water-Cooled Exhaust? High Gear Media: Menlo Park, CA, USA, 2017; pp. 6–28. [Google Scholar]
  35. Nour, M.; Kosaka, H.; Abdel-Rahman, A.K.; Bady, M. Effect of Water Injection into Exhaust Manifold on Diesel Engine Combustion and Emissions. Energy Procedia 2016, 100, 178–187. [Google Scholar] [CrossRef] [Green Version]
  36. Ansys Inc. Ansys CFX Theory Guide; Ansys Inc.: Canonsburg, PA, USA, 2013. [Google Scholar]
  37. Shankar Subramaniam Lagrangian–Eulerian methods for multiphase flows.pdf. Elsevier Sci. 2012, 1, 75.
  38. Cengel, Y.A.; Ghajar, A.J. Nusselt Number. In Heat and Mass Transfer; Mcgraw-Hill: New York, NY, USA, 2013; p. 376. [Google Scholar]
  39. Broekaert, S.; Demuynck, J.; De Cuyper, T.; De Paepe, M.; Verhelst, S. Heat transfer in premixed spark ignition engines part I: Identification of the factors influencing heat transfer. Energy 2016, 116, 380–391. [Google Scholar] [CrossRef] [Green Version]
  40. AVL. BOOST Theory; AVL List GmbH: Graz, Austria, 2020. [Google Scholar]
  41. AVL. Advanced Simulation Technologies-Simulation Tools and Methods for Powertrain Development; AVL: Asheville, NC, USA, 2016. [Google Scholar]
  42. Burch, I. Water Mist for Ship Machinery Spaces; Defence Science and Technology: Fairbairn, Australia, 2006.
  43. Lefebvre, A.H.; Mcdonell, V.G. Atomization and Sprays, 2nd ed.; CRC Press: Boca Raton, FL, USA, 2017; ISBN 9781498736268. [Google Scholar]
Figure 1. Schematic diagram of the experiment setup.
Sustainability 15 04559 g001
Figure 2. Water particle reaction when hitting the wall. Reproduced from [36].
Sustainability 15 04559 g002
Figure 3. (a) Cylindrical domain for fluid flow computation; (b) Meshing at the cross sectional of cylindrical domain.
Sustainability 15 04559 g003
Figure 4. Mesh independence analysis.
Sustainability 15 04559 g004
Figure 5. Influence of shape parameter “m”, starting with m = 0.4 on the left. Reproduced from [40].
Sustainability 15 04559 g005
Figure 6. 1D engine model.
Sustainability 15 04559 g006
Figure 7. Flow coefficient across all throttle positions.
Sustainability 15 04559 g007
Figure 8. AFR map (legend indicates engine speed in rpm).
Sustainability 15 04559 g008
Figure 9. Flow coefficient of intake and exhaust valves [41].
Sustainability 15 04559 g009
Figure 10. Valves lift profile based on the engine test bench.
Sustainability 15 04559 g010
Figure 11. Comparison of exhaust temperature after PTWI for both experiment setup.
Sustainability 15 04559 g011
Figure 12. Comparison of experimental and simulation result running at 100% load.
Sustainability 15 04559 g012aSustainability 15 04559 g012b
Figure 13. Comparison of experimental and simulation result running at 75% load.
Sustainability 15 04559 g013aSustainability 15 04559 g013b
Figure 14. Comparison of experimental and simulation result running at 50% load.
Sustainability 15 04559 g014aSustainability 15 04559 g014b
Figure 15. Particle tracking, showing the trajectory of the water droplets and the averaged change in temperature of the droplet.
Sustainability 15 04559 g015
Figure 16. Mass fraction of water after reaching a steady state.
Sustainability 15 04559 g016
Figure 17. Temperature contour of the exhaust gas flow at 100% load, 3000 rpm, and 4 bar injection pressure.
Sustainability 15 04559 g017
Figure 18. Contour of the averaged mean particle diameter when mixing with exhaust gas.
Sustainability 15 04559 g018
Figure 19. Temperature contour comparison for different engine speeds.
Sustainability 15 04559 g019
Figure 20. Temperature contour comparing the droplet penetration at the highest and lowest exhaust flow.
Sustainability 15 04559 g020aSustainability 15 04559 g020b
Figure 21. Temperature contour comparing between different pipe diameters (30 mm, 40 mm and 50 mm).
Sustainability 15 04559 g021aSustainability 15 04559 g021b
Figure 22. Temperature contour at different distances of cross-sections after the injection point. (ac) for 50 mm pipe and 3000 rpm at 150, 250 and 450 mm, respectively and (df) for 30 mm pipe and 5000 rpm at 150, 250 and 450 mm, respectively.
Sustainability 15 04559 g022
Figure 23. Comparison of fuel consumption before and after PTWI across the medium to high engine speed of 3000 rpm to 5000 rpm at: (a) 100%, (b) 75%, and (c) 50% load.
Sustainability 15 04559 g023aSustainability 15 04559 g023b
Figure 24. Comparison of torque before and after PTWI with medium to high engine speeds of 3000–5000 rpm at: (a) 100%, (b) 75%, and (c) 50% load.
Sustainability 15 04559 g024aSustainability 15 04559 g024b
Table 1. Equipment specification.
EquipmentSpecification
InjectorBOSCH
#A280436277-359
Dual spray angle 24°
Maximum flow 155 g/min
Maximum injection time 2.5 m/s
Maximum pressure 4 bar
4-hole with 200 µm
Electrical water pumpKO JINE
#TYP-2000 KJ
Flow 2.2 LPM
Pressure 10 bar
TurbochargerBORG WARNER
#KP39
EnginePROTON 1.3 L Campro IAFM
Naturally aspirated 4-cylinder
Max torque 120 Nm at 4000 rpm
Max power 70 kW at 6000 rpm
Table 2. Operating condition cases for sensitivity study.
Manipulated VariablesUnit
Injecting pressure4 bar, 7 bar, 10 bar
Distance from turbine150 mm, 250 mm, 450 mm
Diameter of turbine connecting pipe30 mm, 40 mm, 50 mm
Table 3. Engine model specification.
Engine ParametersSpecification
Number of cylinders4
Displacement1561 cc
Firing order1-3-4-2
Bore76 mm
Stroke86 mm
Compression ratio9.5:1
Intake valve diameter30 mm
Intake cam lift7.51 mm
Exhaust valve diameter25 mm
Exhaust cam lift7.92 m
Table 4. Temperature drop taken at various locations at the domain cross-section (30 mm diameter).
Engine Load100%
Injection Pressure (bar)4710
Distance after the Injection Point (mm)
Engine Speed (rpm)150250450150250450150250450
300055.3959.0857.3752.2355.6454.3450.9954.2253.41
400048.7751.9750.1845.8848.8647.4644.3247.246.02
500047.0150.8849.1844.1747.0845.6642.4745.2844.05
Table 5. Temperature drop taken at various locations at the domain cross-section (40 mm diameter).
Engine Load100%
Injection Pressure (bar)4710
Distance after the Injection Point (mm)
Engine Speed (rpm)150250450150250450150250450
300069.6569.8175.4966.5766.7770.1464.9665.0666.72
400072.6672.5280.2156.8356.8661.5755.0655.1858.77
500058.6758.6765.9254.755.0260.4653.3453.5757.87
Table 6. Temperature drop taken at various locations at the domain cross-section (50 mm diameter).
Engine Load100%
Injection Pressure (bar)4710
Distance after the Injection Point (mm)
Engine Speed (rpm)150250450150250450150250450
3000101.5100.491.1797.4196.0482.795.4893.3774.65
400087.3286.3680.0682.7982.1174.8480.5179.769.95
500085.3482.887879.2578.3372.9776.9876.1469.05
Disclaimer/Publisher’s Note: The statements, opinions and data contained in all publications are solely those of the individual author(s) and contributor(s) and not of MDPI and/or the editor(s). MDPI and/or the editor(s) disclaim responsibility for any injury to people or property resulting from any ideas, methods, instructions or products referred to in the content.

