Abstract
Manufacturers with limited funds often seek financial help from outside, usually banks or platforms. However, introducing store brand products (platform encroachment) makes platforms form a competitive and cooperative relationship with manufacturers. To investigate how platform encroachment affects the optimal production decisions and the manufacturer’s financing strategy, this paper establishes a stylized model to capture the strategic interaction between a manufacturer, a platform and a bank. The manufacturer sells a national brand product directly through the platform, which owns a competitive store brand product. By analyzing the equilibrium results, we show that although platform encroachment may reduce the manufacturer’s financing cost, product competition always makes the manufacturer bear more losses. In addition, our results also show that the manufacturer is always willing to adopt the platform financing strategy if the platform does not encroach. However, under platform encroachment, the bank financing strategy may be a better choice for the manufacturer, as long as the commission rate is low enough. Moreover, the platform financing strategy is the Pareto-dominant strategy when the commission rate is high. Finally, we verify the accuracy and robustness of the conclusions of the basic model through numerical analysis and extension. Using the results we derive, we explain the market practices and provide valuable guidelines for manufacturers to choose financing strategies under platform encroachment.
1. Introduction
A large number of small and medium-sized manufacturing enterprises have become an essential engine of world economic growth. The shortage of funds has always been a critical problem affecting the production and operation of manufacturers [1,2,3]. Manufacturers often have to seek financial help from the outside world, which is the problem. The traditional financing choice for manufacturers is mainly bank financing. However, there are still problems in adopting bank financing, such as the need for an effective pledge, a slow loan approval process, and delayed payment time. Therefore, with the emergence of the platform-based supply chain, platform financing is gradually favored by manufacturers [4]. Many platforms provide financing service to manufacturers for more competitive advantages, including a lower default risk and the faster granting of loans. For example, Alibaba and JD, the famous retail platforms in China, have cooperated with various financial institutions to provide financing services and principal enterprise loans for their business partners.
However, with the expansion of market power, many platforms are no longer satisfied with just being a channel provider, and they have begun to create store brand (SB) products to compete with manufacturers’ national brand (MB) products in the end market, which we call platform encroachment [5]. For instance, Amazon has more than 100 SBs in dozens of fields on its website, including food and beverage, automobile, clothing, electronic products, etc. In recent years, it has accomplished significant growth. According to Marketplace Pulse, although these brands account for less than 1% of the clothing category, they account for 9% of sales (https://www.marketplacepulse.com/articles/9-of-amazons-sales-in-clothing-are-from-its-private-label-brands, accessed on 22 September 2020). Therefore, the platform’s SB introduction has become a widespread phenomenon. SB introduction enables the platform to master all links better, from production to sales, and challenges manufacturers. Studies [6,7] find that when the original partners become market competitors, they will pose a more serious threat to each other. Therefore, SB introduction may bring severe product competition to manufacturers. In the face of platform encroachment and financial constraints, it is worth studying what measures manufacturers should take.
Moreover, if there is only MB product on the market, the platform’s primary profit source is the shared revenue from selling the MB product. When platform encroachment occurs, the situation may change. It may not be an excellent choice to provide financing to manufacturers because of product competition. However, many platforms are still willing to provide financing services to the manufacturer. For example, JD not only makes great efforts to develop private brands such as JingDong JingZao, but also continues to extend credit to almost all qualified enterprises on the platform through its own financing channels such as JingBaoBei and JingXiaoDai (https://baijiahao.baidu.com/s?id=1747656493325089553&wfr=spider&for=pc, accessed on 25 October 2022). Based on the above realistic background, we put forward the following questions to investigate the platform’s SB introduction decision and its impact on the manufacturer’s financing strategy selection.
- (1)
- What is the impact of platform encroachment on the production quantity decisions?
- (2)
- Is the platform with the SB product willing to provide financing services for the capital-constrained manufacturer?
- (3)
- Under platform encroachment, what changes have taken place in the manufacturer’s financing strategy choice? Is there a win–win situation that makes both the manufacturer and the platform benefit more?
To solve the above research problems, we consider a supply chain composed of a capital-constrained manufacturer, a platform and a bank, and study how the manufacturer’s production decisions and financing strategy choice will be affected if the platform introduces the SB product. In this paper, the scenario without platform encroachment is regarded as the basic model. Then, in the main model, the manufacturer’s financing decision is analyzed under platform encroachment. We can obtain the following conclusions by comparing the basic model with the main model.
First, we find that although platform encroachment may reduce the financing interest rate, which reduces the manufacturer’s cost, the negative impact of product competition is dominant, making the MB product quantity always decline. Second, when the platform does not introduce the SB product, the bank financing strategy is always inferior to the platform financing strategy for the manufacturer, which is consistent with the previous study [8]. However, under platform encroachment, we prove that the manufacturer will choose bank financing if the commission rate is high; otherwise, the manufacturer still prefers platform financing. Finally, our conclusion shows that although the platform with an SB product competes with the manufacturer in the terminal market, it is still willing to provide financing services. Moreover, when the commission rate is high, the platform financing strategy is always Pareto dominant compared with the bank financing strategy, benefiting both the platform and the manufacturer.
This paper makes the following three contributions. First, although SB introduction has attracted extensive attention from scholars [9,10], there is still very little research on platform encroachment, which has been very popular in practice recently. Therefore, this paper enriches the literature stream of this part. Second, different from the previous literature stream on supply chain finance in which there is only the MB product in the market (single channel or dual channel), in this paper, we study the impact of SB production on the manufacturer’s production quantity decisions and financing strategy choices, which is a new attempt. Moreover, we not only characterize the manufacturer’s strategic response before and after platform encroachment, but also consider the platform’s encroachment choice and willingness to provide loans, which enriches the application scenarios of supply chain financing mode. Interestingly, the introduction of the SB product not only brings competition, but also may reduce the manufacturer’s financing cost, benefiting the manufacturer. This will help the manufacturer find a win–win situation for both sides under the background of platform encroachment. Therefore, our conclusion finally provides financing strategy recommendations for manufacturers with limited funds in a more competitive environment.
The remainder of this paper is organized as follows. We review the related literature on supply chain finance and store brand introduction in the following section. In Section 3, we describe our theoretical model and assumptions first. Subsequently, the optimal decisions under different cases are derived. In Section 4, we introduce the analysis and insights of equilibrium results which are validated through numerical analysis in Section 5. Then, we verify the robustness of the conclusion through an extension in Section 6. Finally, the main conclusions and future directions are summarized in Section 7. All proof is presented in the Appendix A.
2. Literature Review
Our research lies at the interface of SB introduction and supply chain financing. Therefore, we provide an overview of both research streams in this section.
2.1. SB Introduction
Many scholars have conducted relevant research on SB introduction, and earlier works show that SB introduction may induce the wholesale price discount [11,12,13]. For example, Narasimhan and Wilcox (1998) [13] find that retailers may use SB introduction as a strategic weapon to elicit concessions from the national brand manufacturers, which means the retailer can gain a wholesale price discount through SB introduction. Later, a number of works focused on the impact of SB introduction on manufacturers and how retailers maximize their revenue through SB introduction [7,14,15,16,17,18]. Chintagunta et al. (2002) [14] investigate whether introducing SBs by the retailer may increase the income from national brands and increase their bargaining power with the manufacturer. Cui et al. (2016) [16] examine the optimal risk management decision of the risk-averse retailer and find that the retailer with insufficient capital may prefer to take the risk of introducing the SB product. Heese et al. (2010) [7] show that when it is difficult for the retailer to produce high-quality products, it will be provided a preferential wholesale price. Wang et al. (2021) [19] find that the manufacturer introducing the online channel may benefit both itself and the retailer. The retailer should reduce the SB product’s quality to reduce competition with the manufacturer.
Recently, with the development of the platform-based supply chain, some scholars have also begun to focus on the issues related to the platform’s SB introduction [5,20,21]. Li et al. (2021) [20] investigate how platform encroachment affects the manufacturer’s optimal sales mode choice. They find that the manufacturer prefers the agency mode with SB introduction. Song et al. (2020) [21] discuss the platform’s open strategy with an SB product. They confirm that the platform can only be open to third-party sellers when the demand spillover effect is not so large. Bi et al. (2022) [5] show that consumer preference cannot determine the platform’s recommendation strategy, and the manufacturer always prefers to recommend the MB product. However, our work differs from the above research about platform encroachment, which always assumes that the manufacturer’s capital is sufficient. In this paper, we pay more attention to the small and medium-sized manufacturing enterprises with limited funds and study the impact of platform encroachment on the manufacturer’s pricing strategy and financing strategy choice.
2.2. Supply Chain Finance
Supply chain finance has been a popular topic of academic research in recent years, and many scholars have made significant contributions to this field [18,22,23,24]. Most studies on supply chain finance can be divided by different financing objects, that is, the shortage of funds upstream or downstream. The capital-constrained problems of downstream retailers are mainly solved through trade credit [25,26]. Yang and Birge (2018) [27] show that when the retailer suffers from capital constraints, trade credit, as a means of risk-sharing, can improve the efficiency of the supply chain by allowing the retailer and the supplier to share the demand risk. Chod et al. (2017) [28] investigate how competition among suppliers affects their willingness to provide trade credit financing. The results show that retailers with more concentrated suppliers can obtain more trade credit. In contrast, some scholars have studied the lack of funds of upstream manufacturers/suppliers [8,29,30,31,32]. Tang (2018) [31] examines how the manufacturer makes the best choice between purchase order financing (POF) and buyer direct financing (BDF) under different circumstances. Tunca et al. (2018) [32] analyze the role and efficiency of buyer intermediation in supplier financing. The results show that buyer intermediation financing can significantly improve channel performance and benefits supply chain participants simultaneously. Huang (2022) [30] investigates a binary supply chain model with linear demand and analyzes the impact of prepayment and financing interest rates on the supplier’s production and financing. They confirm that advance payment (AP) is suitable for a more reliable supplier and can expand financing service coverage by extending the payment timeline (PE) and tailoring the advance discount rate (TR). Zhen et al. (2020) [8] find that the third-party platform financing strategy was always better than the bank financing strategy for the manufacturer. However, the above studies consider that only one MB product exists in the market (single channel or dual channel). In this paper, the platform with the SB product is not only a finance provider but also a competitor. We investigate how the platform’s multiple roles affect a capital-constrained manufacturer’s operational management and financing strategy choices.
In summary, although there has been much literature on supply chain financing and the platform’s store brand introduction, no one has considered the joint impact of platform encroachment and the manufacturer’s financing problem. Our work complements the above studies by revealing the equilibrium financing strategy choice of the capital-constrained manufacturer under the pressure of different market competition. We find a case where the platform and the manufacturer can reach a win–win situation, which coordinates the supply chain. Moreover, our research fills the gap in relevant fields and provides a financing reference for some manufacturers. The platforms can also re-evaluate the value of SB introduction. After studying the related work mentioned above, we summarize the differences between our work and some literature in similar fields in Table 1.

Table 1.
Summary of relevant literature.
3. Model
3.1. Model Description
This paper constructs a supply chain model including a platform, a manufacturer, and a bank, as shown in Figure 1. The manufacturer directly sells the MB product to end consumers through the platform. The platform draws a certain proportion of revenue from the MB product’s sales, and the commission rate is . Similar to Bi et al. (2022) [5], Shen et al. (2019) [35], and Yan et al. (2019) [36], we assume that the commission rate is exogenous, which is very common in real life. For example, JD, a famous retail platform in China, often cooperates with hundreds of manufacturers and, in most cases, will charge a fixed commission rate to all manufacturers of similar products.
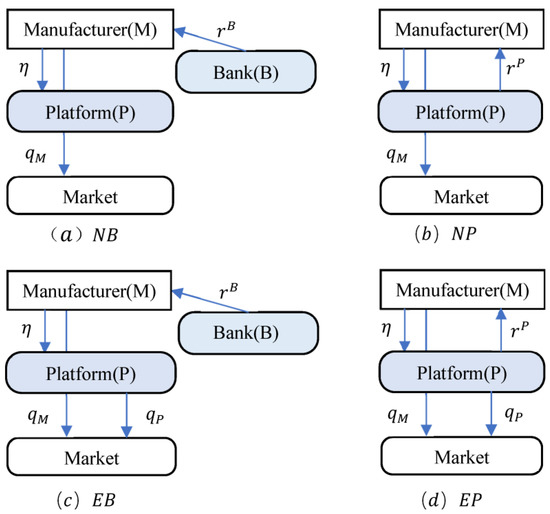
Figure 1.
Structure of the supply chain.
Moreover, as we said in the introduction, the platform can also produce and sell a competitive SB product through its channel, in addition to being a channel provider, corresponding to the two strategies of EB and EP. Following the literature [37,38,39], we have the following linear inverse demand functions for the NB and the SB products:
where represents the quantity (price) of the MB product and represents the quantity (price) of the SB product. Parameter represents the base market price of the product and represents the competition intensity (substitution rate) of the two products. The higher is, the higher the competition intensity is. When , the two products are irrelevant; when , the two products are perfect substitutes.
In addition, compared with the vital strength and sufficient cash flow of the platform (Alibaba, JD, etc.), manufacturers often have limited funds. To better carry out production and business activities, manufacturers need to seek external financing. In this paper, we consider that the manufacturer has two financing strategies: bank financing (NB, EB) and platform financing (NP, EP). The former is very common in real life, but there are some problems, such as the need for an effective pledge, slow loan approval process, delay in account arrival, etc. The latter has become popular with the platform’s expansion. For instance, Amazon began providing loans to its online sellers in 2012. Coincidentally, Taobao began to provide financing service to companies operating on its website in 2011. Without loss of generation, since this paper focuses on the manufacturer’s financing strategy choices, we assume that the principal of the manufacturer is 0, which is common in the literature flow related to supply chain finance [8,24]. We use to represent the interest rate, where represent the bank financing and platform financing strategies, respectively.
Therefore, we discussed four different situations NB, NP, EB, and EP according to the platform and the manufacturer’s different choices, as shown in Figure 1. The letter “E” indicates the platform that introduces the SB product, and the letter “N” is opposite; the letters “B” and “P” indicate the manufacturer’s financing choice (bank or platform).
In summary, Table 2 gives all the parameter definitions. In this paper, we assume that a is large enough, ensuring that demands and financing interest rates are always positive. Moreover, to focus on the impact of platform encroachment on the manufacturer’s financing strategy, we assume that the MB product and the SB product have the same production cost [5,33].
Table 2.
Notations.
The sequence of events in this paper is as follows: In the first stage, the platform decides whether to introduce the SB product and whether to provide financing services to the manufacturer. In the second stage, the manufacturer chooses the financing strategy. If the manufacturer chooses platform financing (bank financing), the platform (bank) determines the financing interest rate . In the third stage, the manufacturer and the platform determine their respective production quantities and and compete in the end market.
3.2. Basic Model: No Platform Encroachment
3.2.1. NB Strategy: Bank Financing
In this section, we first discuss the manufacturer’s production decision and financing strategy choice when there is no platform encroachment, and then study the change in the equilibrium decisions between the manufacturer and the platform under platform encroachment.
We first study the situation when the manufacturer adopts the bank financing strategy (NB strategy) if there is no platform encroachment. First, as a rational decision-maker, the bank sets the optimal financing interest rate according to the forecast of the manufacturer’s production quantity. Second, the manufacturer produces and determines the MB product quantity . Since there is no initial capital, the manufacturer needs to pay a total of for production and financing costs at the end of the period. The platform draws a commission in the proportion of from the manufacturer’s sales. Therefore, the profit functions of the manufacturer, the platform, and the bank are as follows:
According to backward induction, we obtain the manufacturer’s equilibrium output and the bank’s optimal interest rate as follows:
Then, we obtain the manufacturer’s and the platform’s profits under the NB strategy:
The proofs of the optimal solutions are detailed in Appendix A.
Our results imply that the optimal production quantity and interest rate are affected by the base market price, the commission rate, and the production cost under the NB strategy. Moreover, the manufacturer’s production quantity decision is positively correlated with the base market price and negatively correlated with the production cost. When the production cost is high or the base market price is low, the bank will also reduce the interest rate to stimulate the manufacturer to produce more products.
3.2.2. NP Strategy: Platform Financing
Similarly, we also discuss the situation when there is no platform encroachment and the manufacturer adopts the platform financing strategy (NP strategy). First, the platform determines the financing interest rate . Then, the manufacturer produces the MB product with a quantity of and sells it through the platform. Since there is no initial capital, the manufacturer needs to pay a total of for production and financing costs at the end of the period. Different from the NB strategy, the platform can benefit from the financing service under the NP strategy. The profit functions of the manufacturer and the platform are as follows:
According to backward induction, we obtain the manufacturer’s equilibrium production quantity and the platform’s optimal interest rate as follows:
Then, we obtain the manufacturer and the platform’s profits under the NP strategy:
In summary, we have obtained the equilibrium decisions and profits under the two financing strategies without platform encroachment. Comparing the NB and NP strategies, we have Proposition 1.
Proposition 1.
If there is no platform encroachment, then
- (1)
- .
- (2)
- .
- (3)
- , .
Propositions 1(1) and 1(2) show that if the platform chooses not to introduce its SB product, it will provide a more favorable interest rate than the bank, and the manufacturer will produce more products under the NP strategy. Thus, Proposition 1(3) shows that the NP strategy is always Pareto dominant when there is no platform encroachment. The reason is that under the NP strategy, the platform benefits from the financing service and obtains the sharing revenue from selling the MB product. Therefore, the platform with multiple profit sources is motivated to set a lower interest rate to stimulate the manufacturer to produce more products, benefiting from both sides.
4. Main Model: Platform Encroachment
4.1. EB Strategy: Bank Financing
This section analyzes the EB strategy adopted by the manufacturer in the case of platform encroachment. At the beginning of the period, the bank sets the interest rate . Then the manufacturer and the platform produce MB products with the quantity of and SB products with the quantity of , respectively, and sell them through the platform. The manufacturer’s revenue only comes from selling the MB product. The platform’s revenue consists of two parts: one is to share the manufacturer’s product sales revenue (sharing revenue), and the other is to sell SB products directly (direct selling revenue). The manufacturer repays to the bank at the end of the period. Therefore, the profit functions of the manufacturer and the platform are as follows:
According to backward induction, we substitute (1) and (2) into (16) and (17). Similar to the NB strategy, the profit functions of the manufacturer and the platform are concave with respect to and , respectively. According to the first-order condition, we can obtain the equilibrium production quantity decision:
Given the manufacturer’s and the platform’s production quantities, the bank determines the financing interest rate. The bank’s profit function is:
It is easy to find that the second derivative of concerning is , which means the profit function of the bank is a concave function of . According to the first-order condition, the optimal interest rate under the EB strategy is:
By substituting (21) back into (18) and (19), we can obtain the following lemma:
Lemma 1.
The optimal decisions of all parties in the supply chain under the EB strategy can be obtained as follows:
Next, we compare the equilibrium production quantities, prices, and financing interest rates under the NB and EB strategies, as shown in Proposition 2.
Proposition 2.
.
Proposition 2 shows that under the EB strategy, the quantity of the MB product is less than that of the SB product, while the price is higher. This is because the higher financing cost has forced the manufacturer to transfer the cost pressure to consumers by reducing production and raising prices. The platform can take advantage of relatively low costs to obtain a larger market.
4.2. EP Strategy: Platform Financing
Next, we analyze the EP strategy adopted by the manufacturer under platform encroachment. At the beginning of the period, the platform sets the financing interest rate. Then, the manufacturer and the platform determine the production quantities of the MB and SB products, respectively, and sell them through the platform. Compared with other strategies, the platform’s revenue composition is more complex under the EP strategy, including three parts: the sharing revenue, the direct selling revenue, and the platform loan repaid by the manufacturer at the end of the period. Therefore, the profit functions of the manufacturer and the platform are as follows:
Similar to the EB strategy, we substitute (1) and (2) into the above functions via backward induction. We find that the profit functions of the manufacturer and the platform are concave functions of and According to the first-order condition, we can obtain the production quantity decisions:
Given the production quantities of the SB and the MB products, the platform sets the optimal financing interest rate. Substituting (24) and (25) into (23) and solving it, the second derivative of with respect to is , that is, is a concave function with respect to . Therefore, the optimal interest rate decision is as follows:
where .
Next, we summarize the equilibrium production quantities and financing interest rate under the EP strategy as follows:
Lemma 2.
The optimal decisions in the supply chain under the EB strategy can be obtained as follows:
Through static analysis, we compare the optimal decisions under the NP and EP strategies, which is shown in Proposition 3.
Proposition 3.
.
Similar to Proposition 2, Proposition 3 shows that under platform encroachment, the manufacturer significantly reduces production quantity because of product competition and a higher cost. In the next subsection, we will analyze the equilibrium strategy choices of the manufacturer after SB introduction.
4.3. Equilibrium Analysis
In this subsection, we first compare the manufacturer’s and the platform’s optimal decisions under platform encroachment and then analyze their financing strategy preferences. Finally, by comparing with the non-encroachment situation, we can obtain the platform’s encroachment decision and the equilibrium market structure.
Under platform encroachment, when the manufacturer adopts the EB and EP strategies, the comparison of the optimal decisions is as shown in Proposition 4.
Proposition 4.
; otherwise.
Proposition 4 shows that when the commission rate is low, the platform’s interest rate is higher than the bank’s interest rate Under the EB strategy, the manufacturer has a higher output and a lower price , while the platform has a lower output and price The main reason is that the commission rate’s change has led to the two interest rates’ change. When the commission rate is low, the bank’s interest rate is lower, and the MB product’s marginal revenue is high. Therefore, the manufacturer will decrease the price and produce more, which leads to the shrinking of the SB product’s market share and forces the platform to lower the price.
On the other hand, when the commission rate is high, the platform has to set a relatively lower interest rate to attract the manufacturer and stimulate its production. In this case, the sharing revenue accounts for a relatively high proportion of the platform’s total revenue. Therefore, the platform will also appropriately reduce the SB production quantity . In other words, the increase in commission rate makes the platform gradually shift its focus from direct selling revenue to sharing revenue, reflecting the platform’s resource allocation ability as an actual leader in the supply chain.
Through the above analysis, we have compared the equilibrium decisions under different financing strategies under platform encroachment. Next, we will analyze the manufacturer’s and platform’s financing preferences.
Proposition 5.
Under platform encroachment, if, then; otherwise,.
In the base model, we find that the manufacturer always prefers platform financing, which is consistent with Zhen et al. (2019). Interestingly, this conclusion is not always correct when platform encroachment occurs. Proposition 5 states that the manufacturer prefers the EP strategy only when the commission rate is high enough; otherwise, they will adopt the EB strategy. From Proposition 4, there is a lower financing interest rate under the EB strategy when the commission rate is low, and the manufacturer’s profit source is single: the revenue from selling the MB product. Therefore, it always prefers the EB strategy, which has a lower financing interest rate. When the commission rate becomes higher, the platform gradually prefers the sharing revenue; thus, it has the motivation and ability to reduce the interest rate to attract the manufacturer. Therefore, when , the platform’s more favorable interest rate makes the manufacturer prefer the EP strategy.
Proposition 6.
After introducing the SB product, the platform is still willing to provide financing.
The manufacturer may not always prefer the EP strategy, but Proposition 6 shows that the platform is always willing to provide financing service for the manufacturer, even if it has a competitive SB product. When the commission rate is low, the manufacturer adopts the EB strategy and produces more MB products to join the product competition, which is unfavorable to the platform. Therefore, although the platform mainly benefits from direct revenue, it prefers to provide financing service for the manufacturer. When the commission rate is high, the platform prefers the sharing revenue and benefits from providing financing for the manufacturer. Combining Proposition 5 and Proposition 6, we find that under platform encroachment, the EP strategy is beneficial to both the manufacturer and the platform when exceeds the threshold value of .
4.4. Effects of Platform Encroachment
First, we compare the manufacturer’s and platform’s optimal decisions with and without SB introduction. The findings are formalized in the following proposition.
Proposition 7.
(1);.
(2); if, then, otherwise.
Proposition 7(1) shows that, whether under the platform financing strategy or the bank financing strategy, platform encroachment will always force the manufacturer to reduce production quantity. This is mainly because platform encroachment brings product competition, which erodes the market share of the SB product and forces the manufacturer to reduce prices to avoid a sharp decline in demand. Therefore, the bank will set a lower interest rate under the EB strategy to alleviate the manufacturer’s production difficulty and maximize the financing revenue. According to conventional wisdom, the platform is believed to set a higher interest rate under the EP strategy due to the competitive SB product. However, interestingly, Proposition 7(2) shows that the platform’s financing interest rate is lower when the commission rate is low. The reason is as follows. When the commission rate is low, the manufacturer tends to produce more MB product, which expands the financing needs. Therefore, the platform makes the same decision as the bank does of setting a low interest rate to maximize the benefit from the manufacturer’s production financing. However, with the increase in commission rate and the reduction in the MB product’s quantity, the marginal effect that the platform stimulates the manufacturer’s production is weakened. Therefore, the platform will appropriately increase the interest rate, further squeezing the manufacturer’s profit and leaving a bigger market share for the SB product.
Proposition 8.
The platform always benefits more from SB introduction, which causes losses to the manufacturer.
Whether the manufacturer chooses the EB or EP strategy, we find that introducing the SB product is always beneficial to the platform, but causes losses to the manufacturer. Although the encroachment intensifies the product competition and reduces the sharing revenue of the platform, the increase in the direct revenue covers the loss. Therefore, the platform always prefers encroachment. However, although the encroachment may lead to a decline in the financing interest rate for the manufacturer, the intense competition permanently damages the manufacturer’s profit. Next, we use numerical analysis to prove the accuracy of our conclusions in the base model.
5. Numerical Analyses
Thus far, we have analyzed the equilibrium quantities and financing interest rates in the supply chain under different strategies. In this section, we resort to a numerical study to verify the conclusions’ accuracy in our model and obtain more insights. We mainly consider the impact of the commission rate . Referring to some relevant studies [8,38,40], we set the parameters in this section as follows: .
We first check the change in financing interest rates before and after platform encroachment. Figure 2 shows that all interest rates will decrease with the increase in . The reason is that the increase in reduces the MB product’s sales, which leads the bank or the platform to cut their interest rates to stimulate production.
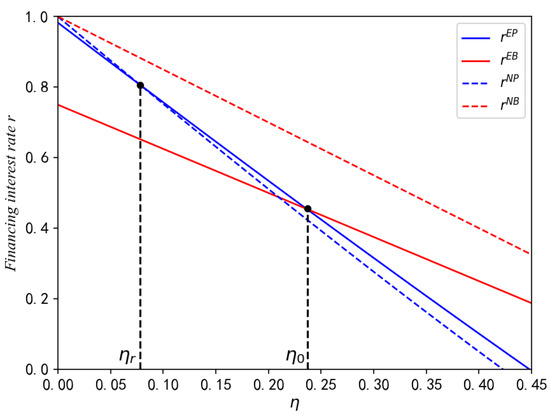
Figure 2.
The impact of on and .
In addition, we also find that platform encroachment always makes the bank lower the interest rate , but not necessarily for the platform itself. When , the platform prefers the sharing revenue and financing revenue so that it decreases the financing interest rate . When , the MB product quantity declines because of the decrease in marginal profit. This will result in a sharp decline in the platform’s sharing revenue and financing revenue. Therefore, the platform will set a higher interest rate . When , the platform has the ability to set the interest rate lower or even lower than the bank interest rate to attract the manufacturer to produce more.
Figure 3 shows the impact of the commission rate on quantities of the MB and the SB products. Interestingly, we find that the increase and decrease trend of the MB product sales under different strategies is the opposite. That is, under the EB strategy, the MB product quantity decreases with an increase, but the opposite is valid under the EP strategy. Combined with Figure 2, we confirm that although the bank reduces the interest rate to stimulate the manufacturer to produce more products under the EB strategy, the negative impact of the decrease in marginal profit still dominates, resulting in a decline in the MB production quantity. Under the EP strategy, the platform’s interest rate has dropped more to benefit more from the sharing and financing revenue, which makes the manufacturer increase production quantity instead. Comparing and , we also find that when the commission rate exceeds a threshold , the manufacturer still sells more products under the EP strategy, even if the introduction of the SB product brings severe product competition.
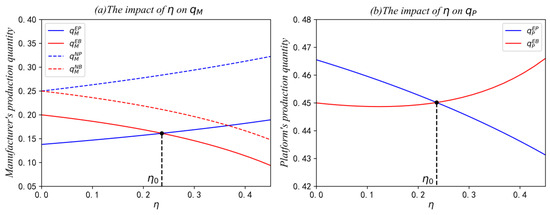
Figure 3.
The impact of on and .
Figure 4 depicts the commission rate’s impact on the manufacturer’s and the platform’s profits. We find that under the EB strategy, the manufacturer’s profit decreases as increases but does not change much under the EP strategy. The reason for the former is apparent, while for the latter it is that although the marginal profit is declining, the financing interest rate is also declining obviously, which neutralizes the downward trend of the manufacturer’s profit. As stated in Proposition 7, Figure 4b shows that the encroachment is always beneficial to the platform. Comparing and , we find that even if there is competition between the MB product and the SB product, it is wiser for the platform to provide financing service for the manufacturer.
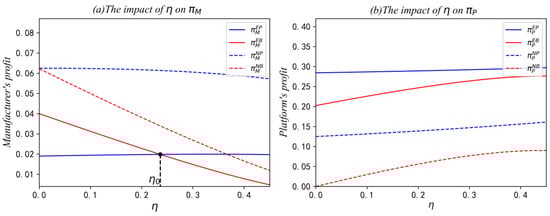
Figure 4.
The impact of on and .
6. Extension
In the base model, we assume that the MB and SB products have the same market size. However, some scholars have considered the impact of the differentiated market, that is, the market scale of the MB product is larger than that of the SB product [33]. Therefore, to verify the robustness of our model, we explore the impact of platform encroachment on the manufacturer’s financing strategy choice with asymmetric market size. Without loss of generality, we normalize the market size of the MB product to 1 and define as the market size of the SB product. The inverse demand functions of the MB product and the SB product are as follows:
Similar to the base model, we derive the subgame perfect equilibrium using backward induction. Due to the complexity of the calculation, we use a numerical method to verify whether the results in the base model are still valid. By taking different values of to conduct a series of numerical tests, we study how the manufacturer’s and platform’s strategy preferences are affected by and . Figure 5 and Figure 6 illustrate the results for the values and .
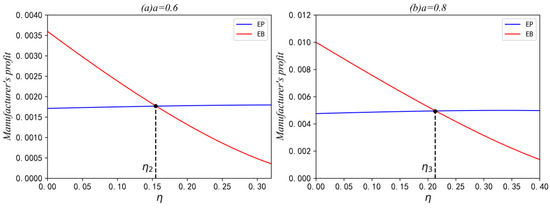
Figure 5.
Strategic preference of the manufacturer in the asymmetric market.
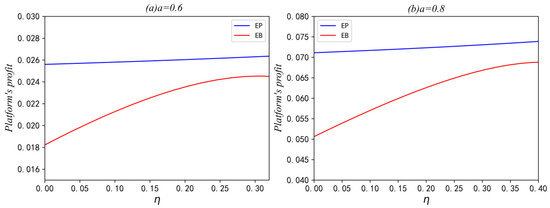
Figure 6.
Strategic preference of the platform in the asymmetric market.
As depicted in Figure 5 and Figure 6, the manufacturer prefers the EB strategy when the commission rate is low but prefers the EP strategy otherwise. For the platform, the EP strategy is always the dominant strategy. The above shows the robustness of the base model conclusion. In addition, we also find that with the increasing market size of the SB product, the area where the manufacturer prefers the EB strategy becomes larger (). This is because the platform benefits more from selling the SB product with the increase in a. Therefore, the platform increases the financing interest rate to alleviate product competition, which reduces the manufacturer’s preference for the EP strategy.
7. Conclusions
7.1. Main Findings
Manufacturers often have limited funds compared to platforms that have a sufficient cash flow. Therefore, manufacturers usually tend to borrow from banks or platforms. However, with the rapid development of online retail, many platforms have begun to launch their SB products, directly competing with independent manufacturers on the platform. Moreover, when the platform is not encroaching, scholars believe that manufacturers should borrow from the platform because of a lower interest rate. However, after the introduction of SB products, whether the platform is willing to provide financing is also a question worth considering. Therefore, in this paper, we investigate the impact of platform encroachment on the manufacturer’s production quantity decision and financing strategy choice.
Taking the case without platform encroachment as the base model, we also obtain the manufacturer’s equilibrium production quantity and financing strategy choices under platform encroachment and compare them to derive the following conclusions. First, platform encroachment is always unfavorable to the manufacturer. Although the financing interest rate may decrease under platform encroachment, product competition will lead to a decline in the MB product’s sales volume and thus the manufacturer’s overall profit [8,41]. For example, Amazon Basics squeezes the living space of some third-party sellers through low-priced imitation electronic products. Nevertheless, for the platform, it is more advantageous to adopt the encroachment strategy, which enriches its revenue source. This result is also relatively common in real life. We can easily observe that there are both SB and MB products on JD.com (Beijing, China) and Amazon (Bellevue, WA, USA). Moreover, our results prove that when encroachment occurs, the manufacturer will choose bank financing if the commission rate is low. When the commission rate is relatively high, the manufacturer chooses platform financing to achieve Pareto improvement. We can find that in real life, platforms with relatively high commission fees are often companies with strong market power, such as JD.com and Amazon. They have sufficient funds, so they can control the market by adjusting commissions and interest rates. Therefore, they will set lower financing rates to attract more manufacturers to borrow money, thereby enriching their sources of profit. Additionally, when the platform encroachment is not so fierce, the platform still maintains a friendly cooperation relationship with manufacturers (especially in high-tech fields, such as smartphones, laptops, etc.). However, in some areas with low technical barriers, the invasion of platforms will become more and more fierce (pillows, clothes, etc.).
7.2. Management Insights
The results in this paper shed managerial insights for practitioners. First, manufacturers with limited funds do not have to overreact to the platforms’ private brands. The low-interest rate financing provided by the platform can provide more development opportunities for many small and medium-sized enterprises. This result is consistent with the current industry observation that some manufacturers and platforms can actually achieve symbiosis. Of course, in order to better develop and respond to product competition, manufacturers should continue to innovate to maintain the uniqueness of their products, or develop the ability to create new products. In this way, they can avoid direct competition with the platform, reducing the adverse impact of platform encroachment on themselves.
Second, from the perspective of the platform, although it owns a competitive SB product, this does not mean that the platform has to sever cooperation with the manufacturer. Our results suggest that it is better to maintain cooperation and provide financing to manufacturers. Although this has caused product competition, it also allows the platform to obtain multiple sources of profit, and the income structure is more reasonable and stable.
Finally, from the perspective of the government, as the market power of the platform continues to expand, the platform has invaded almost every aspect of people’s lives. Excessively strong market power may lead to monopoly; therefore, policy executors must monitor the business behavior of the platform to ensure the healthy development of the economy.
7.3. Future Research
Our study has the following limitations. For example, in this paper, we assume that there is only one manufacturer in the market, and it may be an excellent direction to study the impact of platform encroachment on the financing choices of multiple manufacturers. In addition, this paper does not consider the credit problem of manufacturers and ignores the fact that many small and medium-sized enterprises cannot access bank financing due to a lack of credit in real life. They often can only obtain commercial loans or trade credit service from retailers or platforms, which also need more complex models to implement. Finally, as regards this paper, it is worth using empirical data to verify the results.
Author Contributions
Conceptualization, G.B.; Methodology, G.B. and H.P.; Software, H.P. All authors have read and agreed to the published version of the manuscript.
Funding
This research was funded by [The National Natural Science Foundation of China] grant number [72171214], [Key projects of The National Natural Science Foundation of China] grant number [71731010], [The National Natural Science Foundation of China] grant number [71571174].
Institutional Review Board Statement
Not applicable.
Informed Consent Statement
Not applicable.
Data Availability Statement
Not applicable.
Conflicts of Interest
The authors declare no conflict of interest.
Appendix A
Non-encroachment:
(1) Under the NB strategy, we substitute (1), (2) into (3), (4) and then obtain the second derivative of with respect to , , meaning the manufacturer’s profit function is a concave function of ; therefore, the manufacturer’s optimal production quantity decision . (.
We substitute into to obtain the function of , whose second derivative is , meaning that the function is a concave function of ; therefore, the bank’s optimal interest rate .
(2) Under the NP strategy, similar to the NB case, we substitute into , and the manufacturer’s profit function is a concave function of , the manufacturer’s optimal production quantity decision is .
We substitute into to obtain the function of . Because , the function is a concave function of ; therefore, the bank’s optimal interest rate .
The proof of Proposition 1
- (1)
- .
- (2)
- .
- (3)
- We substitute into to obtain and , making a difference, , meaning is a concave function of . From the first-order condition of we have , and the maximum value ; therefore, .
Similarly, it can be obtained that , meaning is a concave function of . Note that , we substitute the critical values and , , so . □
The proof of Proposition 2.
Referring to Lemma 1 and Lemma 2, we have
It is obvious that ; therefore, we let
Because the minimum . Therefore, □
The proof of Proposition 3.
The proof of is similar to the proof of Proposition 2. □
The proof of Proposition 4.
(1) First, we will discuss some constraints on our model. Because we mainly analyze the effect of on the equilibrium decisions of the manufacturer and the platform, we use the exogenous variable to describe the constraints on production quantity and interest rate , as we said in Section 3:
always holds;
To satisfy we must have
To satisfy , we must have . Therefore, we have .
Next, we equate to a constraint on , which is . It is easy to see that ; therefore, we let
and simplify to .
Hence,
Obviously, is convex and there is only one feasible solution . When ,, which is equivalent to . Therefore, we will complete our study within the scope, , in the following proof, ensuring that demands and financing interest rates are always positive.
Where ,
.
(2) , where the denominators of both formulas are positive; therefore, we let
and simplify to .
Thence,
As evidenced above, ; therefore,
Obviously, is concave and there is only one feasible solution . If ; then,, which means ; if ; then, , which means .
Where . □
The proof of Proposition 5.
Substitute , and make a difference, we have
To simplify the function, we let . It is easy to see that both the denominators are positive; therefore, we further simplify the function as
which is equivalent to in the proof of Proposition 4; therefore, we can simplify to .
As shown in the proof of Proposition 4, is concave and there is only one feasible solution The size relationship between and is just opposite to that between financing interest rates in proposition 4. If ,, which means ; if , then , which means . □
The proof of Proposition 6.
The proof is similar to that of Proposition 5, and we obtain . Solving the first-order optimality equation, we obtain the minimum point where . Then, we have
It is easy to see that the numerator is positive and we just need to discuss whether is positive. Because and , is positive, which means . The platform benefits more under the platform financing strategy than under the bank financing strategy.
Where . □
The proof of Proposition 7
- (1)
- Referring to Lemma 1 and Lemma 2, we have
Because the first-order function with regard to is , note that , and the maximum value is taken at ; therefore, .
Substituting into , we have
The first-order function with regard to is ; therefore, the maximum value is taken at , which means .
The proof of , is similar to Proposition 1.
- (2)
- Making a difference of ,
Then we make a difference of ,
Note that 0; therefore, we just need to discuss whether the numerator is positive. Let
We have ; therefore, is concave and there is only one feasible solution (, where . Therefore, ; . □
The proof of Proposition 8
When , the manufacturer will choose the EB strategy in the case of platform encroachment and the NP strategy otherwise. Therefore, we must compare the EB strategy and the NP strategy. The platform first, we let . Solving the first-order optimality equation, we obtain the minimum point where . Note that we must have mentioned in the proof of Proposition 3. Because , which means when , we have . Therefore, , which means that the platform will benefit more from the encroachment. For the manufacturer, the proof is similar. The manufacturer will suffer losses due to encroachment, .
When , the platform financing strategy is the only choice of the manufacturer regardless of the encroachment; therefore, it is a better choice for the platform to introduce the SB product. Comparing the profits under the NP and the EP strategies, it is easy to prove that and . The platform will benefit more from the encroachment, while the manufacturer will benefit the opposite. □
References
- Gupta, D.; Chen, Y. Retailer-direct financing contracts under consignment. Manuf. Serv. Oper. Manag. 2020, 22, 528–544. [Google Scholar] [CrossRef]
- Kouvelis, P.; Zhao, W. Who should finance the supply chain? Impact of credit ratings on supply chain decisions. Manuf. Serv. Oper. Manag. 2018, 20, 19–35. [Google Scholar] [CrossRef]
- Luo, S.; Zhang, Y.; Zhou, G. Financial structure and financing constraints: Evidence on small- and medium-sized enterprises in China. Sustainability 2018, 10, 1774. [Google Scholar] [CrossRef]
- Wang, C.; Fan, X.; Yin, Z. Financing online retailers: Bank vs. electronic business platform, equilibrium, and coordinating strategy. Eur. J. Oper. Res. 2019, 276, 343–356. [Google Scholar] [CrossRef]
- Bi, G.; Wang, X.; Xu, Y. Platform’s Recommendation Strategy Considering Limited Consumer Awareness and Market Encroachment. IEEE Trans. Eng. Manag. 2022, 1–15. [Google Scholar] [CrossRef]
- Hara, R.; Matsubayashi, N. Premium store brand: Product development collaboration between retailers and national brand manufacturers. Int. J. Prod. Econ. 2017, 185, 128–138. [Google Scholar] [CrossRef]
- Heese, H.S. Competing with channel partners: Supply chain conflict when retailers introduce store brands. Nav. Res. Logist. NRL 2010, 57, 441–459. [Google Scholar] [CrossRef]
- Zhen, X.; Shi, D.; Li, Y.; Zhang, C. Manufacturer’s financing strategy in a dual-channel supply chain: Third-party platform, bank, and retailer credit financing. Transp. Res. Part E Logist. Transp. Rev. 2020, 133, 101820. [Google Scholar] [CrossRef]
- Cheng, R.; Duan, Y.; Zhang, J.; Ke, H. Impacts of store-brand introduction on a multiple-echelon supply chain. Eur. J. Oper. Res. 2021, 292, 652–662. [Google Scholar] [CrossRef]
- Li, H.; Leng, K.; Qing, Q.; Zhu, S.X. Strategic interplay between store brand introduction and online direct channel introduction. Transp. Res. Part E Logist. Transp. Rev. 2018, 118, 272–290. [Google Scholar] [CrossRef]
- Mills, D.E. Why Retailers Sell Private Labels. J. Econ. Manag. Strategy 1995, 4, 509–528. [Google Scholar] [CrossRef]
- Raju, J.S.; Sethuraman, R.; Dhar, S.K. The introduction and performance of store brands. Manag. Sci. 1995, 41, 957–978. [Google Scholar] [CrossRef]
- Narasimhan, C.; Wilcox, R.T. Private labels and the channel relationship: A cross-category analysis. J. Bus. 1998, 71, 573–600. [Google Scholar] [CrossRef]
- Chintagunta, P.K.; Andre, B.; Song, I. Investigating the effects of store-brand introduction on retailer demand and pricing behavior. Manag. Sci. 2002, 48, 1242–1267. [Google Scholar] [CrossRef]
- Choi, S.; Karima, F. Price competition and store competition: Store brands vs. national brand. Eur. J. Oper. Res. 2013, 225, 166–178. [Google Scholar] [CrossRef]
- Cui, Q.; Chiu, C.-H.; Dai, X.; Li, Z. Store brand introduction in a two-echelon logistics system with a risk-averse retailer. Transp. Res. Part E Logist. Transp. Rev. 2016, 90, 69–89. [Google Scholar] [CrossRef]
- Jin, Y.; Wu, X.; Hu, Q. Interaction between channel strategy and store brand decisions. Eur. J. Oper. Res. 2017, 256, 911–923. [Google Scholar] [CrossRef]
- Liao, B.; Yano, C.A.; Trivedi, M. Optimizing store-brand quality: Impact of choice of producer and channel price leadership. Prod. Oper. Manag. 2020, 29, 118–137. [Google Scholar] [CrossRef]
- Wang, L.; Chen, J.; Song, H. Manufacturer’s channel strategy with retailer’s store brand. Int. J. Prod. Res. 2021, 59, 3042–3061. [Google Scholar] [CrossRef]
- Li, D.; Liu, Y.; Hu, J.; Chen, X. Private-brand introduction and investment effect on online platform-based supply chains. Transp. Res. Part E Logist. Transp. Rev. 2021, 155, 102494. [Google Scholar] [CrossRef]
- Song, W.; Chen, J.; Li, W. Spillover effect of consumer awareness on third parties’ selling strategies and retailers’ platform openness. Inf. Syst. Res. 2020, 32, 172–193. [Google Scholar] [CrossRef]
- Yan, N.; Zhang, Y.; Xu, X.; Gao, Y. Online finance with dual channels and bidirectional free-riding effect. Int. J. Prod. Econ. 2021, 231, 107834. [Google Scholar] [CrossRef]
- Xu, X.; John, R.B. Joint production and financing decisions: Modeling and analysis. SSRN Electron. J. 2004. [Google Scholar] [CrossRef]
- Yi, Z.; Wang, Y.; Chen, Y.-J. Financing an agricultural supply chain with a capital-constrained smallholder farmer in developing economies. Prod. Oper. Manag. 2021, 30, 2102–2121. [Google Scholar] [CrossRef]
- Chen, X.; Cai, G.; Song, J.-S. The cash flow advantages of 3PLs as supply chain orchestrators. Manuf. Serv. Oper. Manag. 2019, 21, 435–451. [Google Scholar] [CrossRef]
- Kouvelis, P.; Zhao, W. Financing the newsvendor: Supplier vs. bank, and the structure of optimal trade credit contracts. Oper. Res. 2012, 60, 566–580. [Google Scholar] [CrossRef]
- Yang, S.A.; Birge, J.R. Trade credit, risk sharing, and inventory financing portfolios. Manag. Sci. 2018, 64, 3667–3689. [Google Scholar] [CrossRef]
- Chod, J. Inventory, risk shifting, and trade credit. Manag. Sci. 2017, 63, 3207–3225. [Google Scholar] [CrossRef]
- Du, M.; Chen, Q.; Xiao, J.; Yang, H.; Ma, X. Supply chain finance innovation using blockchain. IEEE Trans. Eng. Manag. 2020, 67, 1045–1058. [Google Scholar] [CrossRef]
- Huang, X. Financing Disruptive Suppliers: Payment Advance, Timeline, and Discount Rate. Prod. Oper. Manag. 2022, 31, 1115–1134. [Google Scholar] [CrossRef]
- Tang, C.S.; Yang, S.A.; Wu, J. Sourcing from suppliers with financial constraints and performance risk. Manuf. Serv. Oper. Manag. 2018, 20, 70–84. [Google Scholar] [CrossRef]
- Tunca, T.I.; Zhu, W. Buyer intermediation in supplier finance. Manag. Sci. 2018, 64, 5631–5650. [Google Scholar] [CrossRef]
- Zheng, Q.; Jang, H.; Pan, X.A. Store-brand introduction and multilateral contracting. Manuf. Serv. Oper. Manag. 2022, 24, 467–468. [Google Scholar] [CrossRef]
- Chod, J.; Lyandres, E.; Yang, S.A. Trade credit and supplier competition. J. Financ. Econ. 2019, 131, 484–505. [Google Scholar] [CrossRef]
- Shen, Y.; Sean, P.W.; Yue, D. Channel selection and contracting in the presence of a retail platform. Prod. Oper. Manag. 2019, 28, 1173–1185. [Google Scholar] [CrossRef]
- Yan, Y.; Zhao, R.; Xing, T. Strategic introduction of the marketplace channel under dual upstream disadvantages in sales efficiency and demand information. Eur. J. Oper. Res. 2019, 273, 968–982. [Google Scholar] [CrossRef]
- Arya, A.; Mittendorf, B.; Yoon, D.-H. The impact of uniform pricing regulations on incentives to generate and disclose accounting information. Manag. Sci. 2021, 67, 1975–1992. [Google Scholar] [CrossRef]
- Bhaskaran, S.R.; Ramachandran, K. Competitive product introductions in technologically dynamic environments. SSRN Electron. J. 2007. [Google Scholar] [CrossRef]
- Grahovac, J.; Parker, G.; Shittu, E. The impact of costliness, competitive importance, and modularity of investments on outsourcing. Prod. Oper. Manag. 2015, 24, 421–437. [Google Scholar] [CrossRef]
- Wu, X.; Zhang, F.; Zhou, Y. Brand spillover as a marketing strategy. Manag. Sci. 2021, 68, 5348–5363. [Google Scholar] [CrossRef]
- Cai, S.; Qiang, Y. Online sellers’ financing strategies in an e-commerce supply chain: Bank credit vs. e-commerce platform financing. Electron. Commer. Res. 2022, 1–32. [Google Scholar] [CrossRef]


Disclaimer/Publisher’s Note: The statements, opinions and data contained in all publications are solely those of the individual author(s) and contributor(s) and not of MDPI and/or the editor(s). MDPI and/or the editor(s) disclaim responsibility for any injury to people or property resulting from any ideas, methods, instructions or products referred to in the content. |
© 2023 by the authors. Licensee MDPI, Basel, Switzerland. This article is an open access article distributed under the terms and conditions of the Creative Commons Attribution (CC BY) license (https://creativecommons.org/licenses/by/4.0/).