Abstract
Due to the high consumption of energy in recent years and global efforts to replace fossil fuels with clean energy, the need for high-efficiency renewable energy systems has become necessary. Small VAWTs are suitable candidates for clean energy production, due to their advantages over other power systems; nevertheless, their aerodynamic performance is modest. This paper attempts to improve the Darrieus VAWT performance by examining the turbine design parameters through the CFD method by adopting the SST k-ω turbulence model and finding the optimum turbine by utilizing the Kriging optimization model. Finally, by using the suggested optimized turbine, the economic analysis conducted to assess the total net present cost indicated the ideal hybrid power. The CFD results from different parameters show that the three-bladed turbine achieved maximum Cp and turbine with σ = 1.2 and optimal Cp by 34.4% compared to the medium solidity. The symmetrical airfoil t/c of 21% registered 19% and 48% performance enhancement at = 2.5 in comparison to t/c = 15% and 12%, respectively. Increasing the H/D ratio results in a better performance at the initial TSR, while a low H/D attained the highest Cp value. The stall condition can be delayed in low TSRs with toe-out blades upstream and obtained an increase of 22.4% in power obtained by β= −6° compared to the zero pitch angle. The assistance of auxiliary blades working in a wider range of TSR is shown and the turbine starting power augmented by 75.8%. The Kriging optimization model predicted the optimal Cp = 0.457, which can be attained with an optimal turbine with N = 3, σ = 1.2, NACA 0021 airfoil, AR = 0.8, and β= −6° operating at = 2.8. Finally, the results of the economic analysis indicate that the hybrid energy system consisting of a VAWT, a battery, and a converter can be applied for satisfying the site load demand with a lower net present cost and cost of energy compared to other feasible hybrid energy systems.
1. Introduction
The growing trend of greenhouse gases and global warming has led scientists to research the use of renewable energy as a suitable alternative to fossil fuels. In recent years, wind energy has been recognized as one of the most prominent types of renewable energy, and the process of using this energy source has grown significantly in different countries [1]. Wind turbines are used as incompressible turbomachines to extract power from wind energy. Wind turbines are divided according to different parameters, among which the classification based on the rotating axis of the rotor is very common [2]. Horizontal-axis wind turbines (HAWTs), which move based on lift forces, are widely used; however, their disadvantages, including the high cost of installation and maintenance, have increased the interest in vertical-axis wind turbines (VAWTs) [3]. There are different types of VAWTs. The first group that rotates with drag force is called the Savonius turbine. Although these turbines have a self-starting capability, the optimal generated power is insufficient for electricity-generating applications [4]. Another type of VAWT is Darrieus wind turbines, which operate based on lift force and are produced in different shapes by various companies [5]. For instance, the 17 m Sandia’s giant turbine, which includes two or three egg-shaped blades, was presented by the US Department of Energy, and by applying changes in its geometry, the power coefficient was increased to 0.43 [6]. Although the output power of these turbines is acceptable, disadvantages such as initial torque for starting have created limitations for this turbine; therefore, various methods have been adopted to solve this problem and increase the efficiency of this turbine. An efficient method is to combine a Savonius rotor with a Darrieus one to increase the initial torque [7]. Additionally, the use of helical blades instead of straight blades improved the performance of the Darrieus VAWT in large TSRs. Moreover, the results showed that the helical angle of 60 degrees was the best condition for the tested turbine [8]. Another geometric parameter that has a significant impact on the performance of the turbine is the number of rotor blades. In a numerical study on an H-type Darrieus VAWT, the results showed that the turbine with more blades performs better in low TSRs; however, when TSR values increased, the turbine with a lower number of blades attained a higher power coefficient [9]. In another study, the results proved that a three-blade turbine has the highest torque, while a four-blade turbine creates the least destructive vibration in the gearbox [10]. Another design parameter that has a remarkable effect on the solidity of VAWTs is blade chord length. The results of an experimental study illustrated that a turbine with a smaller chord length has a better performance in larger TSRs, while in the initial TSRs, a larger chord length had a higher output power [11]. Additionally, the results of a numerical simulation on a Darrieus VAWT showed that, with the increase in blade chord length, the wind speed in the downstream area of the rotor declined and, subsequently, the power coefficient raised [12]. The blade airfoil profile also has a significant effect on the VAWT performance. The results of a numerical simulation on a three-blade Darrieus showed that NACA0012 and NACA0030 had the lowest and highest power coefficient values due to maximum thickness, respectively [13]. Additionally, the numerical results proved that the Darrieus VAWT consisting of the common NACA0015 airfoil profile had a lower power coefficient and torque compared to the turbine with a blade made of J-shape NACA0015 [14]. Moreover, an innovative design for a Darrieus VAWT, including an EN0005 airfoil profile, showed that this configuration has a better performance by increasing the lift force and, thus, the self-starting ability significantly increased [15]. The aspect ratio, which is the relation between the radius and the height of the rotor, has a significant effect on the efficiency of the turbine. The results illustrated that, with the reduction in the aspect ratio, the Reynolds number increased, and as a result, the efficiency of the VAWT grew [16]. The pitch angle, which is the position of the blades’ leading edge and has a direct effect on the angle of attack, is considered a design parameter. The obtained results of a study showed that the negative pitch angle has the best performance and, with the increase in the pitch angle, the Cp values dwindled [17]. It should be noted that using a proper turbulence model in numerical simulations affects the obtained results, and it has been shown that the k-omega SST turbulence model produced more accurate Cp results than the k-epsilon realizable model [18]. Various approaches have been adopted to analyze the performance of wind turbines. Various numerical methods were selected for the analysis due to the low cost of this approach [19]. The most promising method of numerical simulation approaches is a method based on computational fluid dynamics (CFD), which is the discretization of the Navier–Stokes equation. Although the CFD method includes a series of assumptions and simplifications, this method is more acceptable for many engineering applications [20]. Regarding numerical studies, it should be mentioned that 2D transition turbulence numerical modeling has been used due to the lower cost of calculation and acceptable flow prediction [21], while the more accurate behavior of the wind flow downstream of the turbine and the wake flow in the mentioned area, which is modeled by the 3D approach, is more valid [22]. The optimization methods have a wide application in wind turbines and obtaining a proper model would reduce costs and time in simulations. By comparing surrogate-based optimization with the Kriging model, the former model showed more accurate results and was selected to optimize airfoil shapes [23]. The energy cost evaluation for various power system is essential. HOMER Pro is one of the most commonly used software that suggests the optimized system configuration. Charabi et al. [24] simulation indicated that DW54 is the most efficient turbine with an electricity generation of USD 0.119/kW in northern Oman.
In the current study, a full-scale 3D URANS numerical simulation is performed. To achieve this aim, CFD simulation by Ansys CFD commercial software is conducted. As the Ansys workbench application also provides a platform for optimization, of the different optimization approaches, the Kriging method was selected to discover the optimum rotor configuration. However, for the final step, which is the techno-economic analysis, the HOMER Pro 3.14.2 software, which has a powerful library of different geographical information such as wind speed and solar radiation during a year, was selected. In the existing literature, a comprehensive investigation of the design parameter’s influence on aerodynamic behavior and power production is carried out. Additionally, a brief analysis of the improvement of the self-starting capacity is provided by considering the effect of different parameters. The novelty of this study is the design and modeling of a standard Darrieus turbine with auxiliary blades, the investigation of the flow behavior around the blades, and the evaluation of the proposed turbine performance in a wide TSR range. Finally, most papers have studied CFD, optimization, and economic analysis separately. Conversely, in this paper, we study all steps in an integrated manner and reach both an optimal design and power system generation. In general, the final goal of this numerical study is to provide an optimal geometry compared to other studies and to provide a feasible method for installing and operating the designed rotor in an industrial or commercial site. Thus, the reason for the study and its practicality are self-explanatory. The techno-economic analysis results can help to encourage investors to use small-scale VAWTs to generate power in buildings in areas that have favorable wind potential; as a result, it not only reduces fossil fuel consumption but also helps to control air pollution.
2. Problem Description and Solution Strategy
In this numerical simulation, the 3D aerodynamic efficiency of a Darrieus rotor and flow impact on power generation was investigated; therefore, the rotor hub, blade arms, and shaft were omitted. The computational domain consists of rotational and stationary domains, as shown in Figure 1, with proper dimensions to diminish the blockage effect around the turbine and ensure wake development. The cylindrical body, as the rotational domain, contains the blades. The stator width was set to 10D, the height to 15D, and the length to 30D, and the distance from the inlet to the rotor axis was 5D. These dimensions were set to be sufficiently large to ensure that the boundaries do not influence the flow around the rotor. The features of the turbine rotor tested by M. Raciti Castelli et al. [25] are listed in Table 1.
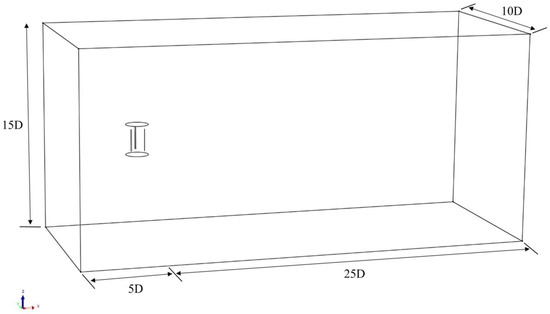
Figure 1.
Schematic of the computational domain.

Table 1.
Dimensions and main geometric features of the analyzed turbine.
In this simulation, unstructured meshing was employed. Additionally, the all triangles method was used for both rotating zones with a fine grid and stationary zones with a medium grid. To compromise between the results’ accuracy and computational time, the rotor and stator interface were proportionally sized. Moreover, to achieve more accurate CFD results and capture the effects of fluid flow separation around the blades, especially around the trailing edge, a suitable grid size and boundary layer mesh were used. The adopted grid features are listed in Table 2. The generated mesh in the computational domain is shown in Figure 2.
Table 2.
Mesh independence analysis.
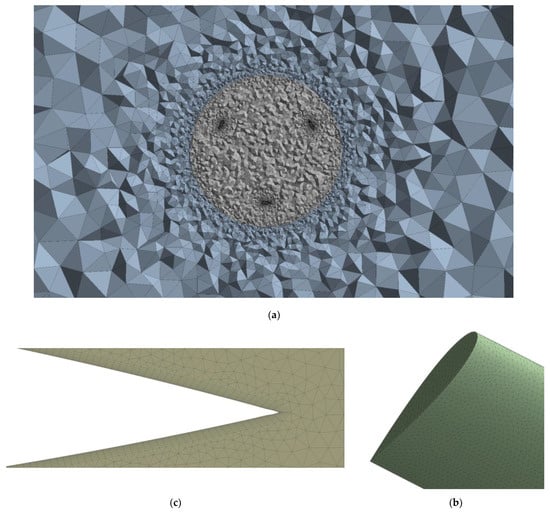
Figure 2.
Mesh discretization: (a) rotor; (b) blade boundary layer; and (c) single blade.
3. Governing Equations
3.1. Turbulence Modeling
In this CFD analysis, the simulation was based on incompressible, viscous Navier–Stokes equations governing the flow around the Darrieus turbine rotor. The velocity term consists of two terms, and , which are shown in Equation (1) and represent the time-averaged mean flow velocity and the fluctuating velocity components . Equation (2) derives time-averaged mean flow velocity. Furthermore, Equations (3) and (4) represent the continuity and momentum equations, respectively, of Unsteady Reynolds-Averaged Navier–Stokes (URANS) [26].
where u is the velocity of fluid flow (m/s), p is pressure (Pa), and ρ (kg/m3) is the fluid density.
In CFD, two commonly used two-equation turbulence models are k-ε and k-ω. The k-ε model is useful for free-shear layer-flow away surfaces with small pressure gradients. However, the k-ε model predicts turbulence in the boundary layer sub-layer and is used near the wall region. To take advantage of these two models, and given that stall phenomena is crucial at low Reynold numbers where VAWTs work, the SST k-ω model, which combines two previous models, offers a better prediction of the blades’ aerodynamic behavior. This model adequately captures behavior in the near wall and separated flow regions. The k-ω model is near the wall and transitions to a k-ε model away from the wall. The SST k-two equation model resolves the transport equation for turbulent kinetic energy (k) and turbulent specific dissipation (ω). Additionally, by obtaining the specific turbulent dissipation, the turbulent length scale can be defined. The SST k-ω model is expressed as [27]:
The coefficients of transport equations are blended forms of two models. The blending function is:
where
where is the normal distance to the wall and is defined as the positive part of the cross-diffusion term:
The coefficients , , , and represented in Equations (5) and (6) are calculated by:
and correspond to the coefficients of the k-ω and k-ε models, respectively. According to the SST model, the eddy viscosity is:
where is the vorticity vector’s magnitude. The first phrase in the denominator is taken from the conventional definition of eddy viscosity, and the performance of the model for adverse pressure gradients is demonstrated by the second phrase in the denominator. The coefficient is calculated by the following equation:
where
The shear stress relation is:
The constants of the SST model and are 0.09 and 0.31, respectively. It should be noted that this model is known as the shear stress transport (SST) model since it uses the shear stress relation to define the eddy viscosity of Equation (11).
3.2. Mathematical Equations
The tip speed ratio (TSR), an essential factor of efficiency, is defined by the ratio of the blade tip velocity to the free stream velocity as follows:
The dimensionless power coefficient (Cp) parameter, expressed as a ratio of the maximum generated power to the kinetic energy flux amount passing the turbine front section, can be written as follows:
where ρ (kg/m3) is the air density, (m/s) is the wind speed, and A (m2) is the swept area.
The mechanical power () is the product of the generated torque () on the rotor axis to the angular velocity.
Solidity is a crucial parameter to define rotor geometry and evaluate turbine performance, which is calculated by:
where n is the number of blades and c is the blade chord length.
The aspect ratio is considered a geometrical parameter and is defined as:
The angle of attack is a means of increasing the aerodynamic performance of the turbine, which is related to tip speed and azimuth angle :
Note that is the sum of the pitch angle and the flow angle .
4. Numerical Modeling and Simulation
4.1. Boundary Condition and Solver Setting
This 3D CFD simulation was studied on Ansys CFX. A transient approach was performed due to the interactions between the blade’s movement and the wake flow and the unsteady nature of the problem; therefore, an unsteady simulation cannot predict the fluid flow behavior around the blades and rotor domain. The blade’s surface was modeled as a non-slip wall. The inlet of the stator, which is upstream of turbine, was defined as the velocity inlet boundary condition with medium turbulence intensity. This means that the wind flow blows uniformly and at a constant velocity over time, perpendicular to the rotation axis of the rotor and blades. The downstream of the turbine was set as a pressure outlet with 1atm average static pressure. The lateral sides were considered as the symmetry boundary condition, which have no effect on the simulation results due to their large distance from the rotor. The rotor interface was appropriately coupled to the stator interface as a fluid–fluid interface. This boundary condition provides the ability to simulate the rotation of the rotor due to the wind force inside the stator. This boundary condition is necessary for transient modeling. In this numerical study, RMS was chosen as the convergence criteria with a residual of 10−5. Additionally, a high-resolution advection scheme was adopted, and a second-order backward Euler was obtained as a transient scheme. The time step, which was selected as 0.5 deg of turbine rotation, provided a more accurate solution for transient simulation and was determined for all simulations.
4.2. Validation and Grid Independence
The experimental results of a three-blade Darrieus VAWT, which was reported by Castelli et al. [25], was used to validate the present CFD simulation. Based on the experimental data, the inlet velocity of 9 (m/s) was adopted in a wind tunnel. The comparison between the numerical output and experimental study at four different TSRs are illustrated. The validation results for Cp are shown in Figure 3.
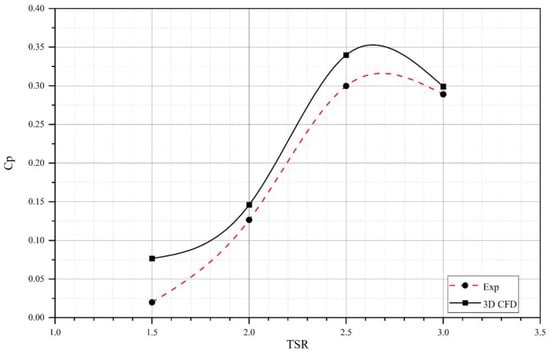
Figure 3.
Cp values from the CFD simulation compared with the experimental study results.
As shown in Figure 3, the CFD results showed an acceptable agreement with the experimental study data, and at = 2.5, both CFD and experimental results had the highest Cp value. Therefore, the validity of the numerical analysis can be verified. In the next step, the grid independence was performed to ensure the independence of the results from mesh resolution and considering that computational time and coarse, medium, and fine unstructured grids were initialized at TSR 2. The characteristics of the generated grids are listed in Table 2. Due to the significant impact of the blades and boundary layer grid structure on the results’ accuracy and prediction of tip effects, the airfoil grid size was gradually made smaller. The inflation layer features were carefully determined to guarantee that inflation layers capture the physical viscous layer.
As shown in Table 2, the Cp values had not significantly changed from each other. The obtained Cp value for medium mesh was higher 4.4% than for fine mesh. Also, the y+ dimensionless parameter was introduced to evaluate mesh resolution around the blades. To have proper flow behavior prediction around the airfoils, a y+ value of around 1 is required for the SST k-ω turbulence model. For a better comparison, Figure 4 shows the torque curve for the three blades at = 2 for three mesh resolutions, corresponding to one revolution.
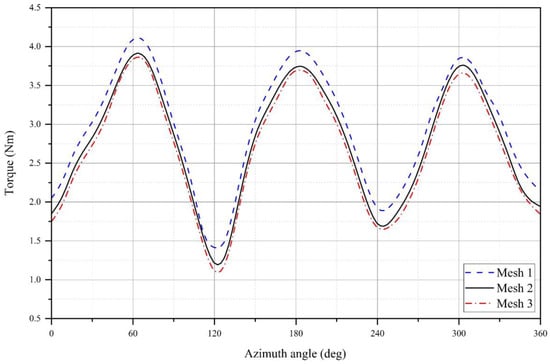
Figure 4.
Mesh sensitivity study.
As shown, the torque values of the fine and medium grids are close. Additionally, the coarser grid shows a slight overprediction in torque values. Therefore, to obtain a sufficient compromise between the results’ accuracy and simulation time, Mesh 2 was selected as the basis of the following numerical simulation.
5. Results and Discussion
In this section, the effect of geometrical parameters is investigated by CFD simulations. The studied parameters were the number of blades, solidity, airfoil profile, aspect ratio, and pitch angle. The Cp results, which represent the aerodynamic performance of the turbine, were evaluated for comparison. Additionally, the flow behavior is discussed comprehensively for each parameter. Finally, the study of the innovative Darrieus turbine with auxiliary blades is provided and the advantage of this configuration is discussed.
5.1. Effect of Number of Blades
The power extraction performance of the Darrieus turbine significantly depends on the blade number due to the effect on global torque. The higher number of turbine blades increases the oscillation frequency in the rotor torque, which reduces fluctuations and smoothes the torque on the shaft. However, a turbine with a higher blade number has more connecting arms, increasing the turbine drag, which has not been accounted for. Figure 5 represents the power coefficient of the three analyzed rotor configurations.
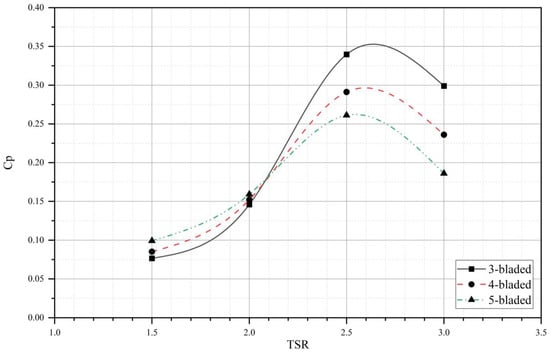
Figure 5.
Effect of the blade number on the power coefficient.
As it can be seen, increasing turbine solidity by increasing the blade number lowers the power coefficient peak. By placing the three-blade turbine as a reference, the four-blade and five-blade turbines registered a 14% and 23% decrease in performance at the optimal TSR, respectively. Additionally, a higher number of blades gained maximum power coefficient for a lower angular velocity, hence improving the turbine’s self-starting ability. The power coefficient increased by 11% at the initial tip speed ratio for the four-blade turbine and 23% for the five-blade turbine.
As clearly shown in Figure 6, as the blade number increases, the frequency of fluctuations increases and lowers the torque peaks because the higher blade number has a higher number of periods in one rotor revolution. Generally, a higher solidity turbine, which can be attained by increasing the blade numbers, generates a higher power at low TSRs. Similarly, the five-blade turbine generated more torque at the initial tip speed ratio in all azimuthal positions. However, the three-blade turbine showed a better performance in the upwind revolution than the four-blade turbine due to experiencing a high angle of attack, but the average torque is slightly higher. The velocity contours for the three rotor configurations for at = 2 are shown in Figure 7.
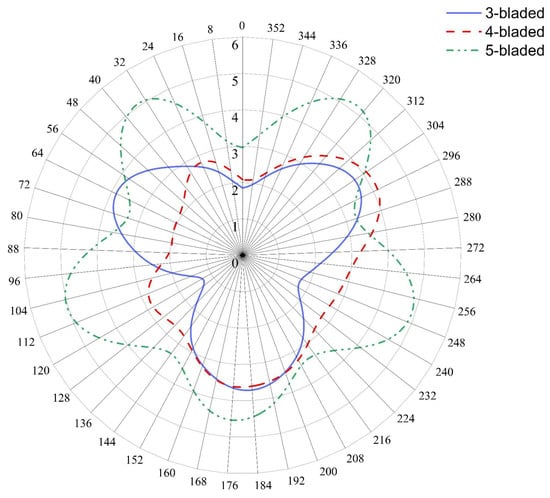
Figure 6.
Torques of all the blades of the three rotor configurations at = 1.5.
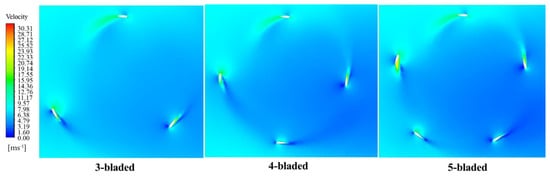
Figure 7.
Velocity contours for the different blade numbers at .
As depicted, no significant difference in blade 1 at was observed in different configurations. At a high rotational speed, the three-blade turbine experienced less blade-to-blade interaction, which improved the turbine performance. However, the five-blade turbine had the lowest efficiency because each blade wake was not replaced with the clean stream rapidly; therefore, the subsequent blade had no efficient angle of attack to create a lift force. The rotor with higher solidity impeded the upstream flow and stretched the frontal stagnation area forward, developing an unfavorable pressure gradient. In contrast, it caused diffusing upstream flow to the turbine’s sides, which makes a favorable pressure gradient. However, side velocity lowers rotor performance due to the turbine’s high solidity.
5.2. Effect of Solidity
In this study, the effect of solidity was studied by varying blade chord length while keeping blade number and rotor radius constant. Therefore, solidity values of 0.5, 0.9, and 1.2, corresponding to blade Reynolds numbers of about 53 k, 92 k, and 123 k at an upstream velocity of 9 (m/s), were investigated. Figure 8 reports the power coefficient versus TSR for three different solidities.
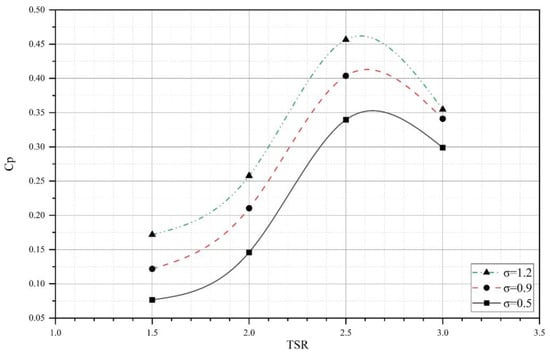
Figure 8.
Effect of solidity on the power coefficient.
As it is known, increasing the Reynolds number increases the blade’s lift-to-drag ratio mainly in the high angle of attack. Consequently, as illustrated in Figure 8, increasing the blade Reynolds number due to larger chord lengths led to higher Cp values. The optimal Cp was achieved at = 2.5 around 0.45, corresponding to σ = 1.2. Figure 7 also shows that, with an increase in solidity from σ = 0.5 to 1.2, Cp was boosted by 34.4%. The secondary effect of the high-solidity turbine is that a larger blade area engages with the wind, resulting in a higher energy extraction. However, in a higher rotational speed, the turbine’s Cp with σ = 1.2 drops rapidly due to facing a high blade–vortex interaction. It is notable that, by adopting a high solidity turbine with σ = 1.2, turbine performance in low TSRs, particularly at the starting point, is enhanced and more than doubles the power coefficient at the initial TSR, compared to the turbine with σ = 0.5. Furthermore, to analyze the flow behavior better, the velocity contours for various configurations at are shown in Figure 9.
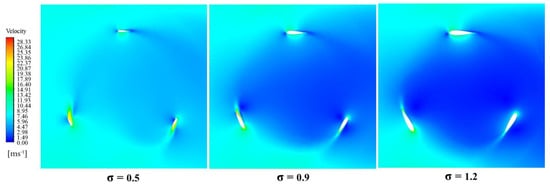
Figure 9.
Velocity contour for different solidities at .
Figure 9 depicts the velocity distribution around the rotor and the blades. As it is shown, by increasing solidity, a low-velocity region forms in the rotor and downstream, which exhibits the extraction of more energy by the high-solidity turbine. Additionally, a higher chord length means higher favorable pressure gradients between blade sides, which contributes to lift force generation. A larger chord length also makes the turbine more able to generate power in the rotor downstream compared to low-solidity turbines. However, at a high TSR, a blockage effect occurs in high-solidity turbines where a high-pressure field forms at the frontal area and obstructs the air flow, resulting in a turbine performance drop.
5.3. Effect of Airfoil
Different symmetrical airfoils were adopted for this simulation to study the aerodynamic performance of the turbine. Since the typical maximum of blade thickness is between 10% and 25%, NACA 0012, NACA 0015, and NACA 0021 were used for the investigation. The shapes of the studied airfoils are depicted in Figure 10.
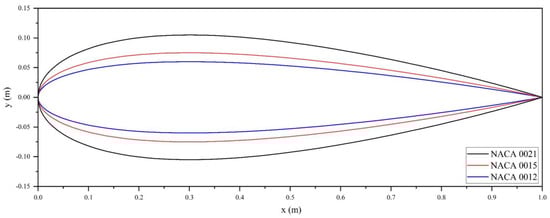
Figure 10.
Shape of the analyzed symmetrical airfoils.
As shown in Figure 10, the adopted airfoils varied in relative maximum thickness, t/c (%), in the range of 12–21%, with the constant chordwise position of maximum thickness, xt/c (%), of 30%. Figure 11 illustrates the Cp values’ variation as a function of for the adopted airfoils for the three-blade configuration.
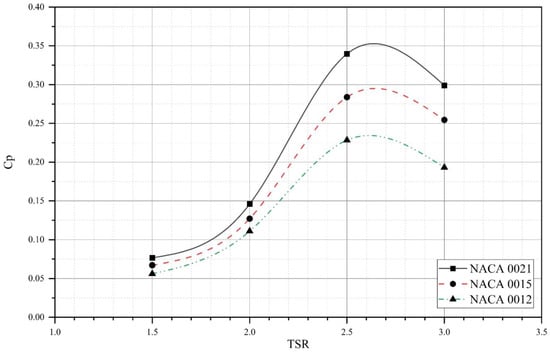
Figure 11.
Effect of airfoils on the power coefficient.
It can be seen from Figure 11 that increasing blade thickness will boost the power coefficient in all TSRs because blades become more capable of extracting power and producing a lift force. This improvement is more significant at the optimal tip speed ratio. However, it can be said that increasing blade thickness too much makes the drag force more significant. The NACA 0021 assigned 19% and 48% increment in power coefficient at = 2.5 vs. NACA 0015 and NACA 0012, respectively, and 13% and 36% at the initial tip speed ratio, which contributes to the turbine’s self-starting ability. The torque plot of the analyzed airfoils is shown in Figure 12 to provide more information at the initial TSR.
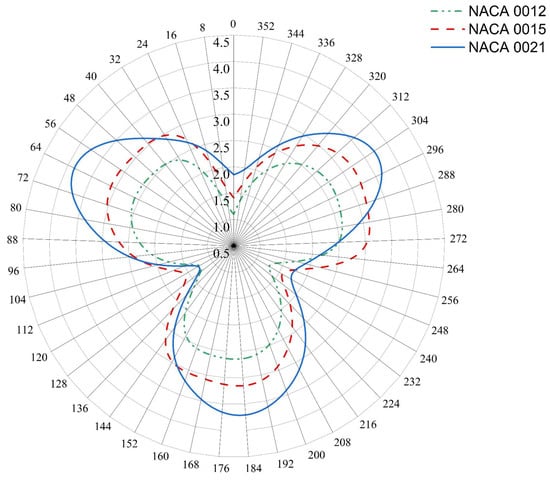
Figure 12.
Torque of different airfoils at = 1.5.
As seen in Figure 12, NACA 0021 generated a higher average torque in one rotation. However, from to and to , NACA 0015 experienced the highest torque value. It also can be observed that there is a smoother torque production in two thinner airfoils, NACA 0015 and NACA 0012, as a result of the lower pressure gradients. It should be noted that, since a high angle of attack occurs at low TSRs, when stall phenomena become critical, pressure contours for different airfoils at the initial TSR are shown in Figure 13.
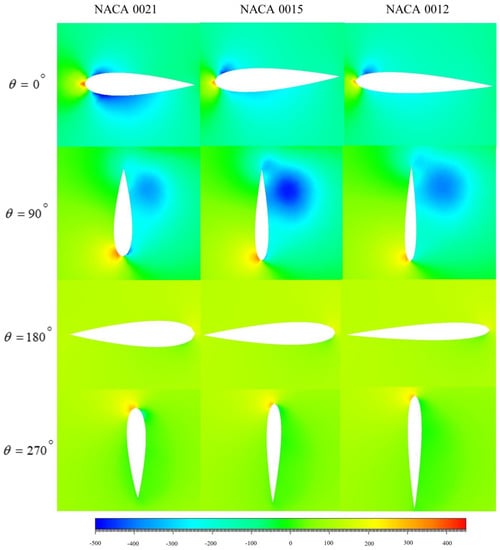
Figure 13.
Pressure contours for different symmetrical airfoils.
In general, increasing t/c results in a higher favorable pressure gradient along the blades, which is visible in Figure 13 at , where NACA 0021 experiences more negative pressure on the suction side of the blade. At the same time, in NACA 0015, this case is almost negligible compared to that of NACA 0012. The other effect of increasing blade thickness is delaying stall and reducing resultant fluctuations, which is distinguishable at . In addition, NACA 0015 achieved the most negative pressure at the trailing edge, and NACA 0021 formed the highest positive pressure at the leading edge. At the downstream, the pressure distribution around the blades is almost identical, and the effect of the t/c parameter is negligible after the stall regime.
5.4. Effect of Aspect Ratio
The effect of aspect ratio was studied by varying the turbine height and radius with a constant blade chord length by keeping the turbine’s swept area consistent. Aspect ratio values of 0.8 and 2, in addition to 1.4, which correspond to the main turbine geometry, were considered to analyze the effect of this parameter. Figure 14 shows the power coefficient for different aspect ratios.
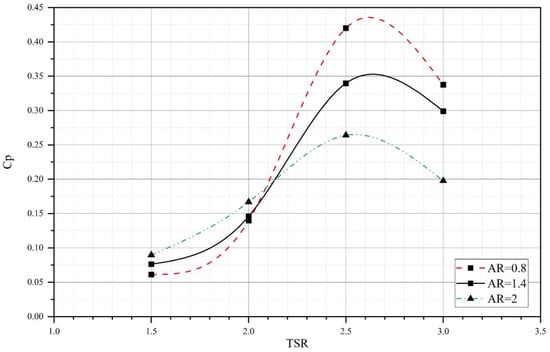
Figure 14.
Effect of aspect ratio on the power coefficient.
The results from the numerical simulations reveal that the lower aspect ratio obtained the largest power coefficient in higher TSRs and contributed positively to H-rotor performance. The turbine with an aspect ratio of 0.8 significantly boosted performance at the optimal tip speed ratio by 23% and 58%, corresponding to 1.4 and 2 aspect ratios. In general, varying aspect ratios, along with changing turbine blade span and diameter, change solidity, significantly affecting turbine performance. As the aspect ratio decreases, increasing the rotor diameter with the same swept area results in less solidity. Therefore, with a higher solidity, by increasing the aspect ratio, the turbine produces more power and helps the self-starting ability in low TSRs. Additionally, a higher turbine blade span reduces tip losses significantly, making the turbine aerodynamically efficient. Figure 15 illustrates this phenomenon at the initial TSR.
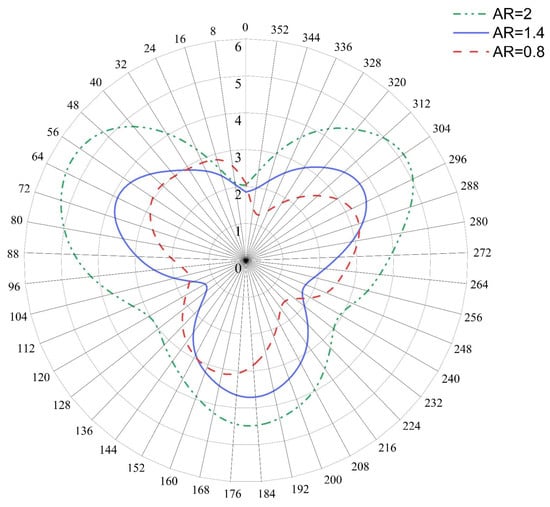
Figure 15.
Torque of different aspect ratios at = 1.5.
As shown in Figure 15, the turbine with a larger aspect ratio has the highest average torque in one revolution. In addition, the average torque production of AR = 1.4 is slightly larger than AR = 0.8 in the initial tip speed ratio. However, between and , AR = 0.8 was able to produce a higher torque value. In the following, from to and to , AR = 0.8 registered a greater torque value in contrast to AR = 1.4.
As illustrated in Figure 16, as the aspect ratio increases, the blades are closer to each other, causing the formation of a low-pressure region inside the rotor and contributing to vortex creation. This fact clarifies the power coefficient drop at higher TSRs at lower aspect ratios. From the figure, it can be observed that increasing the aspect ratio caused a high-pressure field at the turbine upstream. Alternatively, a turbine with a considerable aspect ratio produces a negative effect and makes a clear flow pass through the rotor and blades without effectively harnessing wind power. It should be noted that a larger aspect ratio decreases the ratio of induced drag to lift produced by the blade tip vortices. The vorticity figure shows that, at low TSRs, the blade vorticity formation of the higher aspect ratio is remarkably lower compared to other cases, making the turbine more capable of self-starting.
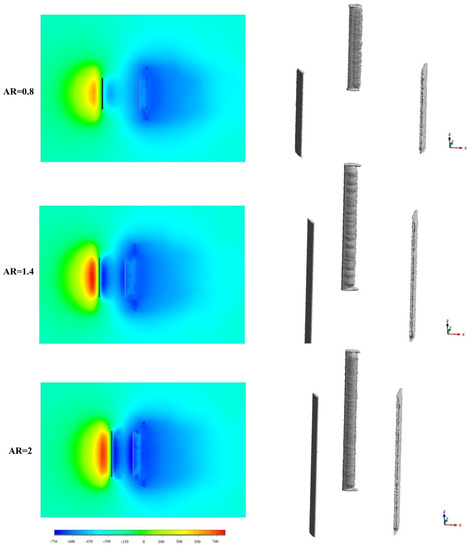
Figure 16.
Contour of different aspect ratios for at = 1.5. Pressure (left) and 3D vorticity (right).
5.5. Effect of Fixed Pitch Angle
Studies have shown that, by adopting a blade pitch angle, the turbine’s self-starting ability will improve primarily in low TSRs, in which the rotor experiences the highest angle of attack and, as a result, stall. The angle of attack is defined as the angle between the relative wind and the blade chord line. Additionally, the angle of attack α value is the sum of the pitch angle β and relative wind φ. The positive pitch angle is defined as a toe-in angle (inward rotation of the blade-leading edge), and the negative pitch angle is the opposite. Therefore, the effect of various pitch angles was studied with β = −6° to β = +6°. Using Equation (19), the angle of attack for the critical tip speed ratio of = 1.5 for different pitch angles in one rotation is represented in Figure 17.
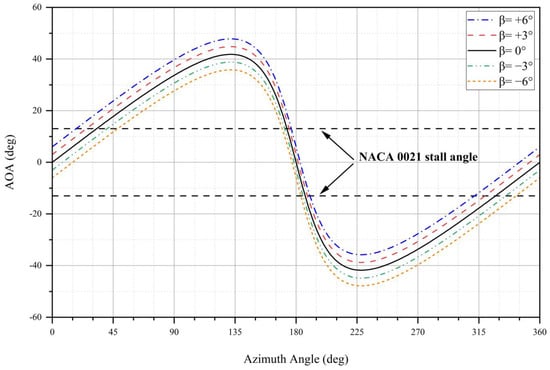
Figure 17.
The angle of attack as a function of the azimuth angle for different pitch angles at = 1.5.
The NACA 0021 static stall at [28] is also shown in Figure 17. It can be stated that a great part of the angles of attack are higher than the static stall condition for = 1.5, where varying the pitch angle assists power generation in lower TSRs. From Figure 17, which represents the theory of angle of attack, the negative pitch angles delayed stall upstream. Conversely, the positive pitch angles showed an efficient angle of attack downstream. The power coefficient results for the different pitch angles at different TSRs are depicted in Figure 18.
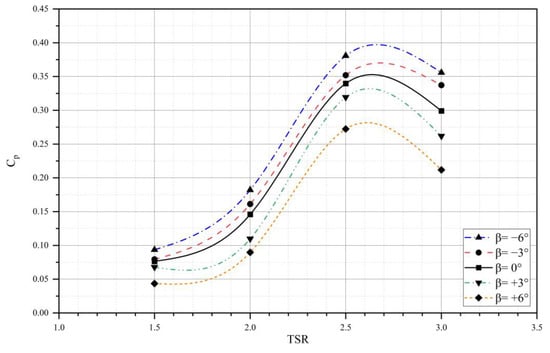
Figure 18.
Effect of the fixed pitch angle on the power coefficient.
From the results of Figure 18, the turbine with negative pitch angles achieved higher Cp in all TSRs compared to the positive pitch angles, and the turbine with β = 0° performed in the middle. As seen in Figure 17, by increasing the negative pitch angle upstream, where the majority of torque is generated, the highest torque was achieved by delaying the stall condition. However, positive pitch angles performed more efficiently at the second half of the rotor, in which the blades are in contact with the low-velocity region. Consequently, the net torque of the negative pitch angles was greater than that of the positive pitch angles in the entire rotation, and the overall performance increased. At initial TSR, the β = −6° increased the performance by 22.4% in comparison to the β = 0°, providing a self-starting capability. Figure 19 provides a better illustration of this phenomenon with different blade angles.
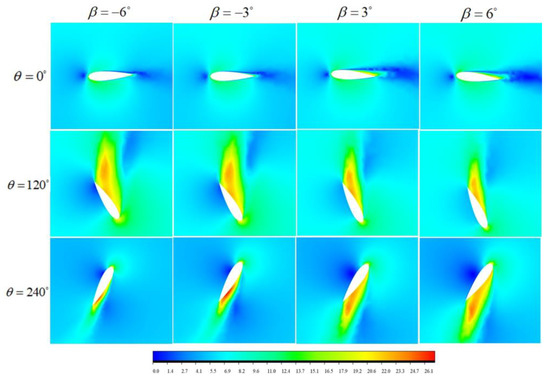
Figure 19.
Velocity contour for different pitch angles with different blade angles.
As depicted in Figure 19 at , the flow is attached to the toe-out blades (negative pitch angles). In contrast, in the positive pitch angles, the flow separates from the leading edge and decreases the lift force generation. At , when the blades experience stall, for the negative pitch angles compared to the positive angles, a weaker flow is formed at the blade upper side and a high-velocity flow at the lower side of the blade, which still creates a positive pressure gradient in a stall condition. At the turbine downstream , the blade’s lower side of the β= +6° is in the contact with wake region and, on the other side, a high-velocity flow is formed. Additionally, at the leading edge, the velocity is higher than that of other cases and this flow behavior contributes to a low positive torque production compared to the negative pitch angles.
5.6. Darrieus Turbine with Auxiliary Blades
This configuration is composed of the main turbine with three auxiliary blades. The schematic of this configuration is presented in Figure 20. The chord length of the auxiliary blades was 51.3 mm, and the angle of attack of both airfoils was considered at 13°. The distance of auxiliary blades along the chord line, x, and the distance between two blades, y, were 34.2 mm and 25.6 mm, respectively.
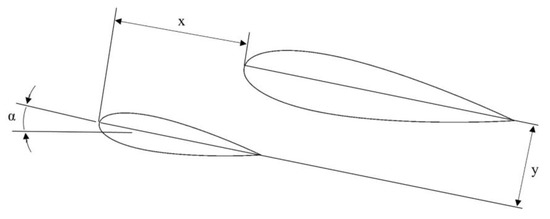
Figure 20.
The schematic details of the Darrieus turbine with the auxiliary blades.
The power coefficient of the Darrieus turbine with the auxiliary blades compared to the main turbine in various TSR ranges is represented in Figure 21.
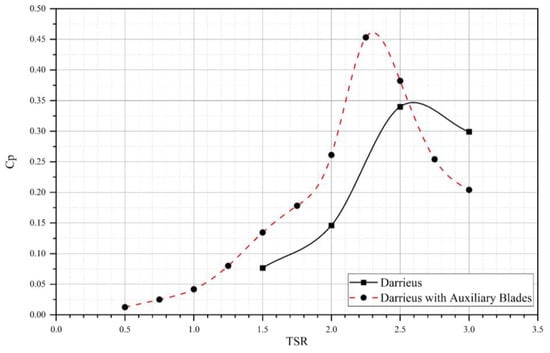
Figure 21.
Cp comparison of the standard Darrieus and the Darrieus with the auxiliary blades.
It can be observed from Figure 11 that the Darrieus turbine with the auxiliary blades is more suitable in low TSRs, and it is capable of generating power in a wider TSR range compared to the simple Darrieus turbine. Compared with the experimental results from M. Raciti Castelli et al. [25], it is concluded that the power of the Darrieus turbine practically reached zero at = 1.4; in contrast, the double-blade turbine is able to produce a considerable power at very-low tip speed ratios. It can also be observed that this configuration remarkably improved the turbine’s self-starting ability, which enhanced Cp, 75.8% in = 1.5. The optimal Cp value of the double-blade turbine is achieved at = 2.25, equal to 0.453, and registered a 33.4% increase in power coefficient compared to the maximum Cp of the standard Darrieus. Subsequent to reaching its optimal value, the turbine power drops at higher TSRs and reaches lower values than those of the standard turbine. Consequently, the simple Darreius turbine works better and attains a higher power in high TSRs.
As it can be seen from the velocity contour represented in Figure 22, by placing auxiliary blades next to the main blades, a particular flow structure is formed, which reattaches separated flow on blades, particularly at a high angle of attack. This configuration compensates for lift loss at a high angle of attack for the main blades. Additionally, auxiliary blades improve the lift production of the main blades by forming a high-velocity field depicted in different rotational angles. At , the flow on the main blade starts the separation again and forms a low-velocity regime on the lower surface of the blades, which decreases the generated torque.
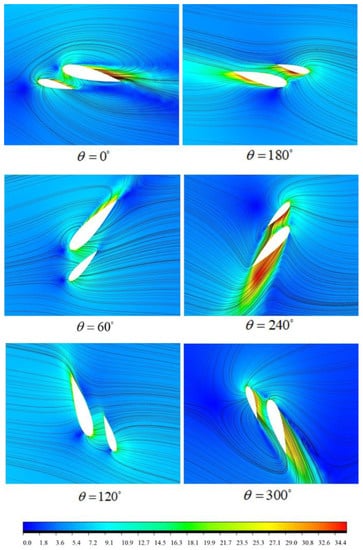
Figure 22.
Velocity contour and streamlines for the Darrieus turbine with the auxiliary blades at different angles at the optimal TSR.
6. Optimization
In this section, for the CFD parametric modeling of the Darrieus turbine, an efficient optimization model was employed to estimate the optimal design parameter and maximum power coefficient of the proposed turbine. Among the well-used models, the response surface model (RSM) and the Kriging model were selected for approximation and an efficient method was chosen to study. Response surface uses second-order polynomials for approximation and Kriging is represented as an alternative based on the statistical approximation method. These two models determine the design parameters and optimization output Cp relation. According to previous CFD results, 44 groups of design points were considered for optimization. Note that blade airfoil and auxiliary blades were not taken into account. Table 3 represents the error analysis of the two studied models.
Table 3.
Error analysis.
Based on Table 3, it can be stated that, since the Kriging model has a lower root-mean-squared error and a higher coefficient of determination, this model approximation is more accurate than the second-order response surface. Therefore, the Kriging model was selected for the optimization method to attain optimal parameters. Figure 23 indicates the graphical response Cp curves for different conditions based on the Kriging method.
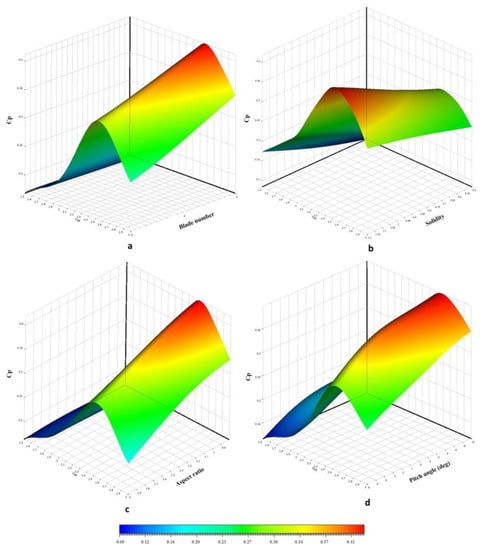
Figure 23.
Power coefficient as a function of TSR and (a) blade number, (b) solidity, (c) aspect ratio, and (d) pitch angle.
In addition, the local sensitivity of the Cp to the studied parameters was obtained, and the results are represented in a pie chart in Figure 24.
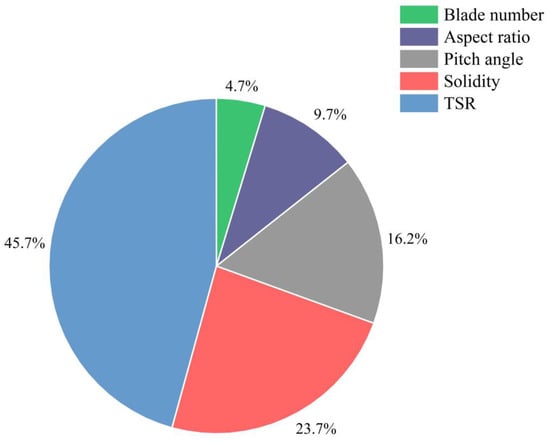
Figure 24.
Local sensitivity.
As clearly shown in Figure 24, by considering the geometrical parameters, solidity registered the highest sensitivity of Cp, which was predictable. In the second place, power coefficient sensitivity to pitch angle was 16.2% and it can be concluded that the blade number parameter was insignificant in the results. It should be noted that, by taking the relative weight into account, the obtained results may change, and the pitch angle parameter can have the highest percentage. Finally, the optimal design using the Kriging model is listed in Table 4.
Table 4.
Optimal design based on the Kriging model.
It is noteworthy that the design points were based on the NACA 0021 airfoil and the predicted Cp value for the optimal design was 0.457.
7. Economic Analysis
In this section, the economic analysis was performed using the HOMER Pro application introduced by National Renewable Energy Laboratory in the United States. This software uses the Net Present Cost (NPC) approach to select the optimum combination of initial investment, replacement, and maintenance costs [29]. Furthermore, sensitivity analysis for variables with uncertain values can be performed by this software. The HOMER Pro software allows users to investigate the effect of changing a parameter on the entire system [30].
7.1. Model Description and Components
To perform the economic analysis, a simple small hybrid power supply system, which is located in the southeast of Iran in the Zabul region and supplies the electrical power for the instrumentation of the water transmission line of a farm and guardroom, was considered as the prototype. The project lifetime was considered 10 years, with a nominal discount and expected inflation rates of about 25% and 30%, respectively. This power supply system consists of an electric load, a solar panel (PV), a wind turbine, a converter, and a battery. The schematic of the power supply system is depicted in Figure 25.
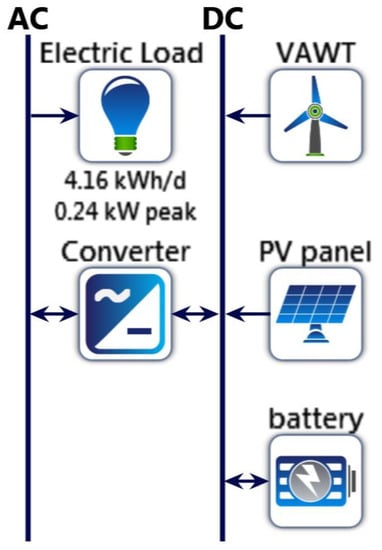
Figure 25.
The schematic of the power supply system.
7.1.1. Load Demand
The average electrical energy consumption of the instrumentation on the site is 4.16 kWh/d, with a calculated peak load of 0.24 kWh/d. Figure 26 represents the daily load profile during the year.
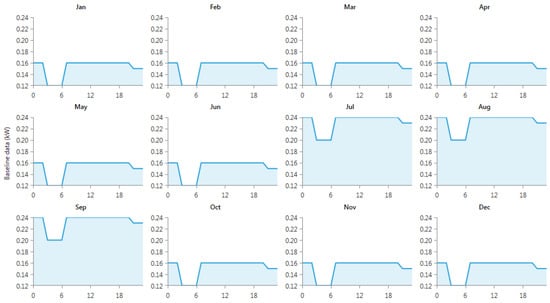
Figure 26.
Monthly load profiles.
7.1.2. Solar Radiation Information and Solar Panel
The solar energy data for the selected region was obtained from Solar Energy and Surface Meteorology, NASA [31]. The average daily radiation (kWh/m2/day) data for the mentioned area is illustrated in Figure 27.
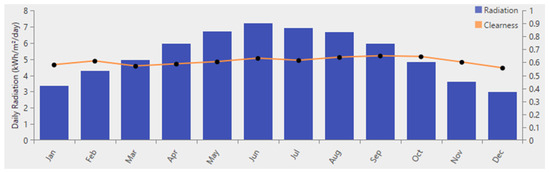
Figure 27.
Average daily radiation, kWh/m2/day.
Regarding the solar energy information, the annual average radiation in the selected area was 5.27kWh/m2/day. The chosen solar panel for the power supply system was a simple flat panel type (Sharp ND-250QCS), which operates without a tracking system, with the general specification of the HOMER library. This model of PV has a capital cost of 25,000,000 IRR per kilowatt. The replacement and operation and maintenance (O&M) costs were considered to be 10,000,000 IRR and 1,000,000 IRR per year, respectively. According to the manufacturer’s information, the lifetime of the solar panel was assumed as 25 years. A derating factor of 80% was applied to the electric generation from each solar panel. In this simulation, the temperature effect was considered; therefore, a reduction of about 0.485%/°C was assumed in the system output.
7.1.3. Wind Speed Information and Turbine
Additionally, wind resource data for this area were adopted from NASA’s prediction of worldwide energy resources [32]. Figure 28 shows the monthly average wind speed in the Zabul province.
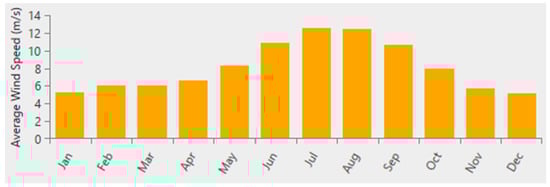
Figure 28.
Average wind speed in the Zabul province.
According to the optimal design of the Kriging model optimization and the local sensitivity obtained in Section 6, and considering the power–cost ratio of the turbine, since a high-solidity turbine, different aspect ratio, and turbine with auxiliary blades increases the cost significantly, the optimal turbine geometry is that with three blades with a pitch angle of β = −6°, which achieved the highest Cp with the same material. Therefore, the proposed Darrieus turbine was selected for this power supply system. The capital cost, replacement, and O&M costs of the Darrieus VAWT are 8,000,000 IRR, 4,000,000 IRR, and 500,000 IRR, respectively, and the lifetime of the turbine is equal to 20 years. This Darrieus VAWT output power for various wind speeds is shown in Figure 29.
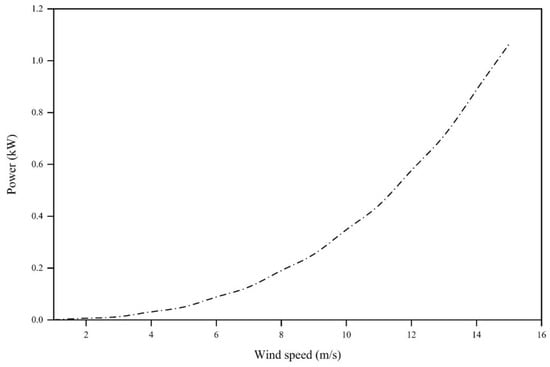
Figure 29.
Turbine power with wind speed variation.
7.1.4. Battery
For the energy storage component, a lithium-ion battery (Generic 1kWh Li-ion) with a nominal capacity of 1 kWh was chosen for this study. It is a low-maintenance energy storage solution that offers significant benefits in terms of cost per cycle, combined with the highest level of reliability and performance even for remote installations where long discharges occur and excellent recharging properties are essential. This model of Li-ion battery has capital and replacement costs of 10,000,000 IRR and 5,000,000 IRR per kilowatt, respectively, and the lifetime of this energy storage system is estimated at about 15 years.
7.1.5. Converter
To harmonize the AC and DC outputs of the different components, a converter system was used. A 1 kW converter’s capital, replacement, and O & M costs were obtained at 8,000,000 IRR, 4,000,000 IRR, and 1,000,000 IRR, respectively. Regarding the manufacturer’s data, the lifetime of this type of converter is about 15 years and the efficiency of the inverter is estimated to be about 95%.
7.2. Results
To accommodate the load demand, the NPC approach was adopted from the HOMER Pro software to explore and find an optimum combination of components. In this simulation, two different combinations of components were suggested as a power reservoir to provide the required electrical power:
- VAWT, Battery, and Converter
In this arrangement, the power supply system consists of a single Darrieus turbine, a battery, and a 0.259 kW converter. The total net present cost, cost of energy, initial capital cost, and operating cost of the system were 31,148,970 IRR, 2,066.68 IRR, 30,074,436 IRR, and 86,056.28 IRR, respectively. The NPC and an inclusive perspective of the system’s performance during the project lifetime (over 10 years) are presented in Table 5 and Table 6, respectively.
Table 5.
Net costs.
Table 6.
Optimization results for the Darrieus VAWT system.
The share of the different costs of the system in total NPC is illustrated in Figure 30.
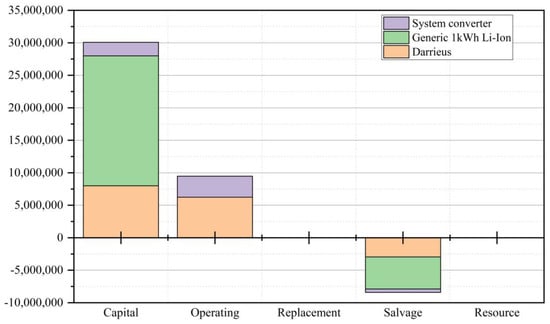
Figure 30.
Cost summary of the power supply system.
- VAWT, solar panel, battery, and converter
In the second scenario, a solar panel was added to the arrangement of the power generation system. The current system consisted of a 0.25 kW PV panel, a Darrieus wind turbine, a battery, and a 0.178 kW converter. The total net present cost, cost of energy, initial capital cost, and operating cost of the system were 57,744,720 IRR, 3755 IRR, 59,423,331 IRR, and 134,495 IRR, respectively. The NPC and an inclusive perspective of the system’s performance during the project lifetime (over 10 years) are presented in Table 7 and Table 8, respectively.
Table 7.
Net costs.
Table 8.
Optimization results for the Darrieus VAWT system.
Regarding the information in Table 8, most of the electricity is produced by solar panels (78.9%) and worked more hours during the year; however, the solar panel provided a smaller share of electrical energy (21.1%). The share of the different costs of the system in the total NPC is illustrated in Figure 31.
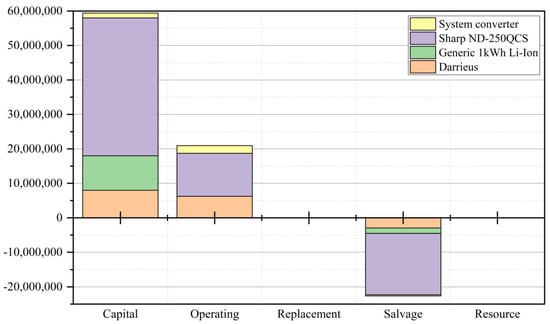
Figure 31.
Cost summary of the power supply system.
According to Figure 31, the capital cost of installing a solar panel is more than that of the Darrieus VAWT, and the operating cost of a solar panel is slightly more than the Darrieus VAWT’s operating cost, and finally, at the end of the project, the solar panel, turbine, and converter salvage generate income. To sum up, in the first scenario with a Darrieus VAWT, the NPC and COE are lower than in the second arrangement with a solar panel. In other words, an arrangement including a Darrieus VAWT, battery, and converter are suitable for the power supply system, and adding a solar panel only adds to the project’s cost.
8. Conclusions
The purpose of this study was CFD investigation, optimization, and economic analysis of a Darrieus VAWT and the illustration of the aerodynamic design and optimization stages, to suggest the most efficient and economically feasible turbine configuration for the particular application. The main conclusion results are as follows:
- The three-blade turbine achieved a maximum Cp at the optimal TSR, which registered 14% and 23% power increments compared to the four- and five-blade turbines, respectively.
- Adopting a high-solidity turbine with σ = 1.2 increased the blades’ energy extraction from the wind. Consequently, turbine performance and maximum Cp increased significantly by 34.4% in comparison to σ = 0.5.
- The blade’s maximum thickness in symmetrical airfoils is associated with the lift-to-drag ratio, with with the optimal value of the blade thickness of 21%, self-starting ability, and overall rotor performance having increased.
- The influence of the aspect ratio (H/D) was different in low and optimal TSR due to the blade tip effect. The AR = 0.8 enhanced the maximum Cp of the main turbine by 23%; conversely, AR = 2 performed better at the initial TSR by a 17.1% Cp enhancement.
- The variation in the angle of attack in a revolution and the importance of stall in particular low TSRs led to adopting a negative pitch angle by delaying stall upstream. It was found that, because of a favorable flow behavior around the blades with β < 0, a 22.4% performance improvement was registered with β = −6.
- The 3D analysis of the innovative turbine configuration by placing auxiliary blades alongside the main blades indicated that the turbine is able to produce power in a wider range of TSR and self-starting boosts near 75% compared to the standard Darrieus.
- The Kriging optimization method suggested that a high-solidity three-blade turbine with NACA0021 airfoil, AR = 0.8, and β = −6° can attain the highest Cp of 0.457 at = 2.8. Additionally, the varying parameters of turbine solidity and pitch angle have the most contributions to power production.
- The HOMER simulation determined that using the combination of VAWT, a battery, and a converter satisfied the required load of the facility’s instrumentation equipment for a local water transmission pipeline and guardroom with a net cost and levelized cost of energy of 31,148,970 IRR and 2066.68 IRR, respectively.
Author Contributions
Conceptualization, M.A., F.G., S.C. and M.M.; methodology, M.A.; software, M.A. and S.C.; validation, F.G.; formal analysis, M.A., F.G. and S.C.; investigation, M.A. and S.C.; resources, M.M. and A.J.; data curation, F.G. and M.A.; writing—original draft preparation, M.A. and S.C.; writing—review and editing, all authors; visualization, M.A. and F.G.; supervision, M.M. and A.J.; project administration, M.M. and A.J.; funding acquisition, M.M. and A.J. All authors have read and agreed to the published version of the manuscript.
Funding
This research received no external funding.
Institutional Review Board Statement
Not applicable.
Informed Consent Statement
Not applicable.
Data Availability Statement
Data is contained within the article.
Conflicts of Interest
The authors declare no conflict of interest.
Nomenclature
| Symbols | Subscript | ||
| Inlet flow velocity (m/s) | t | Turbulence | |
| N | Number of rotations (rpm) | Abbreviations | |
| T | Torque (N.m) | URANS | Unsteady Reynolds-Averaged Naiver–Stokes |
| P | Output power (W) | CFD | Computational fluid dynamic |
| R | Rotor radius (m) | HAWT | Horizontal-axis wind turbine |
| H | Rotor height (m) | VAWT | Vertical-axis wind turbine |
| A | Swept area (m2) | DMST | Double multi-stream tube |
| Φ | Relative wind angle | TSR | Tip speed ratio |
| Cp | Power coefficient | ||
| c | Blade chord (m) | ||
| N | Number of blades | ||
| AR | Aspect ratio | ||
| Greek | |||
| µ | Viscosity (Pa.s) | ||
| ω | Angular velocity (rad/s) | ||
| ρ | Density (kg/m3) | ||
| σ | Solidity |
References
- Zafar, U. Literature Review of Wind Turbines; Bauhaus Universität: Weimar, Gemany, 2018; p. 41. [Google Scholar]
- Dixon, S.L.; Hall, C.A. Fluid Mechanics and Thermodynamics of Turbomachinery, 7th ed.; Butterworth-Heinemann: Amsterdam, The Netherlands; Boston, MA, USA, 2014. [Google Scholar]
- Johari, M.K.; Jalil, M.A.; Shariff, M.F.M. Comparison of horizontal axis wind turbine (HAWT) and vertical axis wind turbine (VAWT). Int. J. Eng. Technol. 2018, 7, 74. [Google Scholar] [CrossRef]
- Akhlaghi, M.; Ghafoorian, F. Investigation of Arc Angle Rotor Blade Variations Effect of Savonius Vertical Axis Wind Turbine on Power and Torque Coefficients Using a 3D Modeling. Renew. Energy Res. Appl. 2023, 4, 13–19. [Google Scholar] [CrossRef]
- Möllerström, E.; Gipe, P.; Beurskens, J.; Ottermo, F. A historical review of vertical axis wind turbines rated 100 kW and above. Renew. Sustain. Energy Rev. 2019, 105, 1–13. [Google Scholar] [CrossRef]
- Liu, J.; Lin, H.; Zhang, J. Review on the technical perspectives and commercial viability of vertical axis wind turbines. Ocean Eng. 2019, 182, 608–626. [Google Scholar] [CrossRef]
- Asadi, M.; Hassanzadeh, R. Effects of internal rotor parameters on the performance of a two bladed Darrieus-two bladed Savonius hybrid wind turbine. Energy Convers. Manag. 2021, 238, 114109. [Google Scholar] [CrossRef]
- Akhlagi, M.; Ghafoorian, F.; Mehrpooya, M.; Sharifi Rizi, M. Effective Parameters Optimization of a Small Scale Gorlov Wind Turbine, Using CFD Method. Iran. J. Chem. Chem. Eng. 2022, in press.
- Mehrpooya, M.; Asadbeigi, M.; Ghafoorian, F.; Farajyar, S. Investigation and Optimization on Effective Parameters of a H-rotor Darrieus Wind Turbine, Using CFD Method. Iran. J. Chem. Chem. Eng. 2023, in press.
- Mabrouk, I.B.; El Hami, A. Effect of number of blades on the dynamic behavior of a Darrieus turbine geared transmission system. Mech. Syst. Signal Process. 2019, 121, 562–578. [Google Scholar] [CrossRef]
- Lee, Y.-T.; Lim, H.-C. Numerical study of the aerodynamic performance of a 500 W Darrieus-type vertical-axis wind turbine. Renew. Energy 2015, 83, 407–415. [Google Scholar] [CrossRef]
- Pramono, I.; Ambarita, H.; Kishinami, K. Effect of Chord Length on the Performance of H-Darrieus Wind Turbine with NACA 4415 Airfoil. IOP Conf. Ser. Mater. Sci. Eng. 2019, 648, 12030. [Google Scholar] [CrossRef]
- Subramanian, A.; Yogesh, S.A.; Sivanandan, H.; Giri, A.; Vasudevan, M.; Mugundhan, V.; Velamati, R.K. Effect of airfoil and solidity on performance of small scale vertical axis wind turbine using three dimensional CFD model. Energy 2017, 133, 179–190. [Google Scholar] [CrossRef]
- Zamani, M.; Nazari, S.; Moshizi, S.A.; Maghrebi, M.-J. Three dimensional simulation of J-shaped Darrieus vertical axis wind turbine. Energy 2016, 116, 1243–1255. [Google Scholar] [CrossRef]
- Batista, N.; Melício, R.; Mendes, V.; Calderón, M.; Ramiro, A. On a self-start Darrieus wind turbine: Blade design and field tests. Renew. Sustain. Energy Rev. 2015, 52, 508–522. [Google Scholar] [CrossRef]
- Brusca, S.; Lanzafame, R.; Messina, M. Design of a vertical-axis wind turbine: How the aspect ratio affects the turbine’s performance. Int. J. Energy Environ. Eng. 2014, 5, 333–340. [Google Scholar] [CrossRef]
- Abdalrahman, G.; Melek, W.; Lien, F.-S. Pitch angle control for a small-scale Darrieus vertical axis wind turbine with straight blades (H-Type VAWT). Renew. Energy 2017, 114, 1353–1362. [Google Scholar] [CrossRef]
- Wang, Y.; Shen, S.; Li, G.; Huang, D.; Zheng, Z. Investigation on aerodynamic performance of vertical axis wind turbine with different series airfoil shapes. Renew. Energy 2018, 126, 801–818. [Google Scholar] [CrossRef]
- Hilgenstock, A.; Ernst, R. Analysis of installation effects by means of computatiional fluid dynamics—CFD vs experiments? Flow Meas. Instrum. 1996, 7, 161–171. [Google Scholar] [CrossRef]
- He, J.; Jin, X.; Xie, S.; Cao, L.; Wang, Y.; Lin, Y.; Wang, N. CFD modeling of varying complexity for aerodynamic analysis of H-vertical axis wind turbines. Renew. Energy 2019, 145, 2658–2670. [Google Scholar] [CrossRef]
- Lanzafame, R.; Mauro, S.; Messina, M. 2D CFD Modeling of H-Darrieus Wind Turbines Using a Transition Turbulence Model. Energy Procedia 2014, 45, 131–140. [Google Scholar] [CrossRef]
- Alaimo, A.; Esposito, A.; Messineo, A.; Orlando, C.; Tumino, D. 3D CFD Analysis of a Vertical Axis Wind Turbine. Energies 2015, 8, 3013–3033. [Google Scholar] [CrossRef]
- Han, Z.; Zhang, K.; Song, W.; Liu, J. Surrogate-based Aerodynamic Shape Optimization with Application to Wind Turbine Airfoils. In Proceedings of the 51st AIAA Aerospace Sciences Meeting including the New Horizons Forum and Aerospace Exposition, Grapevine, TX, USA, 7–10 January 2013. [Google Scholar] [CrossRef]
- Charabi, Y.; Abdul-Wahab, S. Wind turbine performance analysis for energy cost minimization. Renew. Wind Water Sol. 2020, 7, 5. [Google Scholar] [CrossRef]
- Castelli, M.R.; Pavesi, G.; Battisti, L.; Benini, E.; Ardizzon, G. Modeling Strategy and Numerical Validation for a Darrieus Vertical Axis Micro-Wind Turbine. In Fluid Flow, Heat Transfer and Thermal Systems, Parts A and B, Proceedings of the International Mechanical Engineering Congress & Exposition 2010, Vancouver, BC, Canada, 12–18 November 2010; ASME: Vancouver, BC, Canada, 2010; Volume 7, pp. 409–418. [Google Scholar] [CrossRef]
- Siddiqui, M.S.; Rasheed, A.; Kvamsdal, T.; Tabib, M. Effect of Turbulence Intensity on the Performance of an Offshore Vertical Axis Wind Turbine. Energy Procedia 2015, 80, 312–320. [Google Scholar] [CrossRef]
- Nichols, R.H. Turbulence Models and Their Application to Complex Flows; University of Alabama at Birmingham: Birmingham, AL, USA, 2010; p. 214. [Google Scholar]
- Holst, D.; Church, B.; Wegner, F.; Pechlivanoglou, G.; Nayeri, C.N.; Paschereit, C.O. Experimental Analysis of a NACA 0021 Airfoil Under Dynamic Angle of Attack Variation and Low Reynolds Numbers. J. Eng. Gas Turbines Power 2018, 141, 31020. [Google Scholar] [CrossRef]
- Mehrpooya, M.; Mohammadi, M.; Ahmadi, E. Techno-economic-environmental study of hybrid power supply system: A case study in Iran. Sustain. Energy Technol. Assess. 2018, 25, 1–10. [Google Scholar] [CrossRef]
- Mousavi, S.A.; Mehrpooya, M.; Rad, M.A.V.; Jahangir, M.H. A new decision-making process by integration of exergy analysis and techno-economic optimization tool for the evaluation of hybrid renewable systems. Sustain. Energy Technol. Assess. 2021, 45, 101196. [Google Scholar] [CrossRef]
- Rousis, A.O.; Tzelepis, D.; Konstantelos, I.; Booth, C.; Strbac, G. Design of a Hybrid AC/DC Microgrid Using HOMER Pro: Case Study on an Islanded Residential Application. Inventions 2018, 3, 55. [Google Scholar] [CrossRef]
- Tizpar, A.; Satkin, M.; Roshan, M.; Armoudli, Y. Wind resource assessment and wind power potential of Mil-E Nader region in Sistan and Baluchestan Province, Iran—Part 1: Annual energy estimation. Energy Convers. Manag. 2014, 79, 273–280. [Google Scholar] [CrossRef]


Disclaimer/Publisher’s Note: The statements, opinions and data contained in all publications are solely those of the individual author(s) and contributor(s) and not of MDPI and/or the editor(s). MDPI and/or the editor(s) disclaim responsibility for any injury to people or property resulting from any ideas, methods, instructions or products referred to in the content. |
© 2023 by the authors. Licensee MDPI, Basel, Switzerland. This article is an open access article distributed under the terms and conditions of the Creative Commons Attribution (CC BY) license (https://creativecommons.org/licenses/by/4.0/).