
The Financing Efficiency of China’s Industrial Listed Enterprises Based on the Dynamic–Network SBM Model


Abstract
:1. Introduction
2. Literature Review
2.1. Geographical Coverage
2.2. Chronological Coverage (Last 3 Decades in China)
3. Methodology and Materials
3.1. Methodology
3.1.1. Network SBM DEA
3.1.2. Dynamic DEA Model
3.1.3. Dynamic Network SBM (DNSBM)
3.2. Materials
3.2.1. Data Sources
3.2.2. DEA Indicator Selection
- Input indicators:
- 2.
- Intermediate indicators:
- 3.
- Carry-over:
- 4.
- Output indicators:
4. Results
5. Discussion
6. Conclusions, Limitations and Future Research
6.1. Conclusions
6.2. Limitations and Further Research
Author Contributions
Funding
Institutional Review Board Statement
Informed Consent Statement
Data Availability Statement
Acknowledgments
Conflicts of Interest
References
- Creating World Industrialization Miracles—These Changes Have Taken Place in New China’s Industry. Available online: http://www.cinic.org.cn/xw/cjxw/625872.html (accessed on 20 August 2022).
- Song, X.Y.; Guo, M. 2017 National Enterprise Burden Survey and Evaluation Report. China Small Medium Enterp. 2017, 12, 2. [Google Scholar]
- Song, X.Y.; Chai, D.Q.; Pu, T.L. 2018 National Enterprise Burden Survey and Evaluation Report. China Small Medium Enterp. 2019, 2, 2. [Google Scholar]
- Shao, Y.H.; Bu, X.N.; Zhang, T.H. Resource Misallocations and TFP of Chinese Industrial Enterprises A Recalculation Based on Chinese Industrial Enterprises Database. China Ind. Econ. 2013, 12, 39–51. [Google Scholar]
- Jin, L.Q. Analysis on the Degree of Misallocation of Financial Resources Caused by Ownership Discrimination. Econ. Perspect. 2015, 6, 31–43. [Google Scholar]
- Fan, N.N.; Li, R.L. Financing Constraint Difference and Productivity Distribution: An Analysis Based on the Data of Industrial Enterprises in China. Financ. Trade Res. 2017, 28, 18–26,38. [Google Scholar]
- Williamson, O.E. Corporate Finance and Corporate Governance. J. Financ. 1988, 43, 567–591. [Google Scholar] [CrossRef]
- Demirgüç-Kunt, A.; Levine, R. Stock Markets, Corporate Finance, and Economic Growth: An Overview. World Bank Econ. Rev. 1996, 10, 223–239. [Google Scholar] [CrossRef]
- Parhankangas, A.; Smith, D.G. Conflict Management in The Entrepreneur-Venture Capital Relationship: An International Comparative Study; Working Paper; Northwestern School of Law of Lewis and Clark College and Helsinki University of Technology: Espoo, Finland, 2000. [Google Scholar]
- Smolarski, J.; Kut, C. The Impact of Venture Capital Financing Method on SME Performance and Internationalization. Int. Entrep. Manag. J. 2011, 7, 39–55. [Google Scholar] [CrossRef]
- Balakrishnan, K.; Core, J.E.; Verdi, R.S. The Relation Between Reporting Quality and Financing and Investment: Evidence from Changes in Financing Capacity. J. Account. Res. 2014, 52, 1–36. [Google Scholar] [CrossRef] [Green Version]
- Stulz, R. Managerial Discretion and Optimal Financing Policies. J. Financ. Econ. 1990, 26, 3–27. [Google Scholar] [CrossRef]
- Jayaraman, S. The Effect of Enforcement on Timely Loss Recognition: Evidence from Insider Trading Laws. J. Account. Econ. 2012, 53, 77–97. [Google Scholar] [CrossRef]
- Forrester, S.P.; Reames, T.G. Understanding the Residential Energy Efficiency Financing Coverage Gap and Market Potential. Appl. Energy 2020, 260, 114307. [Google Scholar] [CrossRef]
- Gomariz, M.F.C.; Ballesta, J.P.S. Financial Reporting Quality, Debt Maturity and Investment Efficiency. J. Bank. Financ. 2014, 40, 494–506. [Google Scholar] [CrossRef] [Green Version]
- Cardone, C.; Casasola, M.J.; Samartín, M. Do Banking Relationships Improve Credit Conditions for Spanish SMEs; Business Economics; Working Papers; Universidad Carlos III, Departamento de Economıa de la Empresa: Madrid, Spain, 2005. [Google Scholar]
- Gheeraert, L.; Weill, L. Does Islamic Banking Development Favor Macroeconomic Efficiency? Evidence on the Islamic Finance-Growth Nexus. Econ. Model. 2015, 47, 32–39. [Google Scholar] [CrossRef] [Green Version]
- Zeng, K.L. What About Direct Financing and Indirect Financing. Southwest Financ. 1993, 11, 30–32. [Google Scholar]
- Lu, F.C. Analysis of Enterprise Financing Efficiency; Economic Management Press: Beijing, China, 2001. [Google Scholar]
- Ma, Y.J.; Song, L. Enterprise Financing Efficiency and Theoretical Analysis Framework. J. Jilin Bus. Technol. Coll. 2004, 2, 19–23. [Google Scholar]
- Zhang, Y.X.; Zhao, L.L. Government Support and Financial Development, Social Capital and The Financing Efficiency of S&T Innovation Enterprises. Sci. Res. Manag. 2015, 36, 55–63. [Google Scholar]
- Wu, Y.L.; Huang, S.L. Financial Efficiency Product Market Competition and Ambidextrous Innovation-Empirical Analysis Based on Listed Companies in China. Account. Res. 2021, 12, 121–135. [Google Scholar]
- Charnes, A.; Cooper, W.W.; Rhodes, E. Measuring the Efficiency of Decision Making Units. Eur. J. Oper. Res. 1978, 2, 429–444. [Google Scholar] [CrossRef]
- Liu, L.C.; Feng, G.F.; Zhang, D.H. Evaluation of Equity Financing Efficiency of Listed Companies Based on DEA. Syst. Eng. 2004, 22, 55–59. [Google Scholar]
- Wang, Y.; Zhong, P.C. Evaluation of Equity Financing Efficiency of Small and Medium-Sized Enterprises. Econ. Forum 2006, 23, 108–109,128. [Google Scholar]
- Liu, C. Research on Equity Financing Efficiency of Listed Companies on GEM—Based on DEA Model. Financ. Account. Int. Commer. 2017, 11, 79–84. [Google Scholar]
- Wang, X.Z.; Ding, H.P.; Hu, Y. The Evaluation of Financing Efficiency for China’s Small and Medium-Sized Enterprises Based on DEA Model. Syst. Eng.-Theory Pract. 2017, 37, 865–874. [Google Scholar]
- Zeng, G.; Geng, C.X. Empirical Measurement of Financing Efficiency of China’s Listed High-end Equipment Manufacturing Enterprises: Based on Super-SBM and Malquist Models. Sci. Technol. Manag. Res. 2019, 39, 233–242. [Google Scholar]
- Liu, X.; Yu, X.; Gao, S. A Quantitative Study of Financing Efficiency of Low-carbon Companies: A Three-stage Data Envelopment Analysis. Bus. Strat. Environ. 2019, 28, 858–871. [Google Scholar] [CrossRef]
- Jin, Y.; Gao, X.; Wang, M. The Financing Efficiency of Listed Energy Conservation and Environmental Protection Firms: Evidence and Implications for Green Finance in China. Energy Policy 2021, 153, 112254. [Google Scholar] [CrossRef]
- Bi, G.B.; Liang, L.; Yang, F. A DEA-based Efficiency-Measuring Model for a Two-Stage Production System. Chin. J. Manag. Sci. 2007, 2, 94–98. [Google Scholar]
- Färe, R.; Grosskopf, S. Productivity and Intermediate Products: A Frontier Approach. Econ. Lett. 1996, 50, 65–70. [Google Scholar] [CrossRef]
- Färe, R.; Grosskopf, S. Network DEA. Socio-Econ. Plan. Sci. 2007, 34, 35–49. [Google Scholar] [CrossRef]
- Kao, C.; Hwang, S.N. Efficiency Decomposition in Two-Stage Data Envelopment Analysis: An application to non-life insurance companies in Taiwan. Eur. J. Oper. Res. 2008, 185, 418–429. [Google Scholar] [CrossRef]
- Tone, K.; Tsutsui, M. Network DEA: A Slacks-Based Measure Approach. Eur. J. Oper. Res. 2009, 197, 243–252. [Google Scholar] [CrossRef] [Green Version]
- Färe, R.; Grosskopf, S. Intertemporal Production Frontiers: With Dynamic DEA. J. Oper. Res. Soc. 1997, 48, 656. [Google Scholar] [CrossRef]
- Bogetoft, P.; Färe, R.; Grosskopf, S.; Hayes, K.; Taylor, L. Network DEA: Some Applications and Illustrations. In Proceedings of the DEA Symposium 2008, Musashino, Japan; pp. 5–12.
- Kao, C. Network Data Envelopment Analysis: Current Development and Future Research. In Proceedings of the Asia-Pacific Productivity Conference (APPC), Seoul, Republic of Korea, 4–6 July 2008; pp. 17–19. [Google Scholar]
- Sueyoshi, T.; Sekitani, K. Returns to Scale in Dynamic DEA. Eur. J. Oper. Res. 2005, 161, 536–544. [Google Scholar] [CrossRef]
- Tone, K.; Tsutsui, M. Dynamic DEA: A Slacks-Based Measure Approach. Omega 2010, 38, 145–156. [Google Scholar] [CrossRef] [Green Version]
- Tone, K.; Tsutsui, M. Dynamic DEA with Network Structure: A Slacks-Based Measure Approach. Omega 2014, 42, 124–131. [Google Scholar] [CrossRef] [Green Version]
- The National Bureau of Statistics released Report Series III on Economic and Social Development Achievements for the 70th Anniversary of the Founding of the People’s Republic of China. Available online: http://www.gov.cn/xinwen/2019-07/11/content_5408071.htm (accessed on 15 July 2022).
- Tan, X.; Na, S.; Guo, L.; Chen, J.; Ruan, Z. External Financing Efficiency of Rural Revitalization Listed Companies in China—Based on Two-Stage DEA and Grey Relational Analysis. Sustainability 2019, 11, 4413. [Google Scholar] [CrossRef] [Green Version]
- Xiong, Z.D.; Yang, F.J.; Wan, J. Research on the Efficiency of Debt Financing of Listed Companies Based on the Two-Stage DEA Model—Taking the Strategic Emerging Industry New Energy Vehicles as an Example. Financ. Theory Pract. 2014, 35, 51–56. [Google Scholar]
- Fang, X.M.; Wu, Y.Y. Research on Financing Efficiency of Small and Medium-Sized Enterprises in the New Third Board Market. Econ. Manag. 2015, 37, 42–51. [Google Scholar]
- The Total Profit of Industries above Designated Size Increased by 12.2% in 2013. Available online: http://finance.people.com.cn/n/2014/0129/c70846-24262188.html (accessed on 20 September 2022).
- In 2014, the Profit Growth of Industrial Enterprises Was Less than 1/3 of the Previous Year. Available online: https://news.cnstock.com/news,bwkx-201501-3325065.htm (accessed on 20 September 2022).
- In 2015, the Total Profit of Industrial Enterprises Above Designated Size in China Decreased by 2.3% Year-on-Year. Available online: http://jingji.cntv.cn/2016/01/28/ARTIhCyhUCWt8z8TBhI9APvB160128.shtml (accessed on 20 September 2022).
- Industrial Enterprises Develop to Higher Levels. Available online: http://www.gov.cn/xinwen/2016-01/30/content_5037462.htm (accessed on 20 September 2022).
- The Supply-Side Structural Reform in the Industrial Sector Has Achieved Remarkable Results. Available online: http://www.cinic.org.cn/hy/yw/420352.html (accessed on 21 September 2022).
- Rao, P.G.; Jiang, G.G. Monetary Policy, Credit Resource Allocation and Corporate Performance. Manag. World 2013, 3, 12–22,47. [Google Scholar]
- Wang, Y.; Luo, L.Q.; Guo, Q. Does Local Government Intervention Damage Credit Market Efficiency? Financ. Res. 2015, 418, 103–118. [Google Scholar]
- Lu, Z.F.; Zhu, J.G.; Fan, Z. Monetary Contractions, Bank Discrimination and the Wealth Loss of Non-State Listed Firms’ Investors. Financ. Res. 2009, 336, 124–136. [Google Scholar]
- Lai, M.F.; Chen, W.T.; Zheng, K.Y. Puzzle of the Deviation Between Financing Advantage and Investment Efficiency for State-owned Enterprises: Based on a Comparative Analysis in the View of Property Right and Industry. Econ. Probl. 2019, 5, 58–66. [Google Scholar]
- Chinese Statistical Yearbook 2018 Complied by the National Bureau of Statistics of China. Available online: http://www.stats.gov.cn/tjsj/ndsj/2018/indexeh.htm (accessed on 30 December 2022).
- Eight Difficulties in Guangxi’s Industrial Development. Available online: http://www.gxcounty.com/news/jjyw/20160826/128710.html (accessed on 18 October 2022).
- Li, Y. Enterprise Heterogeneity, Regional Development Strategy and Resources Misallocation. West Forum 2017, 27, 105–115. [Google Scholar]
- Ma, H.L.; Wang, Z.X.; Chan, F.T.S. How Important Are Supply Chain Collaborative Factors in Supply Chain Finance? A View of Financial Service Providers in China. Int. J. Prod. Econ. 2020, 219, 341–346. [Google Scholar] [CrossRef]
- Yi, X.; Sheng, K.; Yu, T.; Wang, Y.; Wang, S. R&D Investment and Financing Efficiency in Chinese Environmental Protection Enterprises: Perspectives of COVID-19 and Supply Chain Financial Regulation. Int. J. Logist. Res. Appl. 2022, 25, 569–590. [Google Scholar]
- He, Y.; Chen, C.; Hu, Y. Managerial Overconfidence, Internal Financing, and Investment Efficiency: Evidence from China. Res. Int. Bus. Financ. 2019, 47, 501–510. [Google Scholar] [CrossRef]
- China’s Private Economy is Showing Bright Data, with Tax Revenue Contributing More Than 50%. Available online: https://www.sohu.com/a/347153724_161795 (accessed on 23 December 2022).
- Cai, J.Y. Research on Enterprise Performance, Supply Chain Finance and Financing Constraints of SMEs—Based on Empirical Evidence of GEM Listed Companies. J. Shanxi Inst. Energy 2021, 34, 4. [Google Scholar]
- Wei, R.; Ma, Y.F. Research on the Impact of Supply Chain Finance on Financing Constraints of Manufacturing SMEs—Based on Empirical Data of Listed SMEs. Ind. Innov. 2022, 3, 88–94. [Google Scholar]
- Li, J.; Peng, F.; Mao, D.F. Resource Misallocation and Total Factor Productivity of Industrial Enterprise in China. Financ. Trade Res. 2012, 23, 46–53. [Google Scholar]


| Data | Variable | Definition |
|---|---|---|
| Input | Input resource to for division k at period | |
| Output | Output product from for division at period . | |
| Link | from division to division at period . | |
| Carry-over | Carry-over of at division from period to period . | |
| Input slack | Slack of input of for division at period . | |
| Output slack | Slack of output r of for division at period . | |
| Link slack | Slack of link of at period .a stands for free, as-input, and as-output. | |
| Carry-over slack | Slack of carry-over from period o period . | |
| Intensity | Intensity of corresponding to division at period . |
| Indicator | Indicator Definition | Units | |
|---|---|---|---|
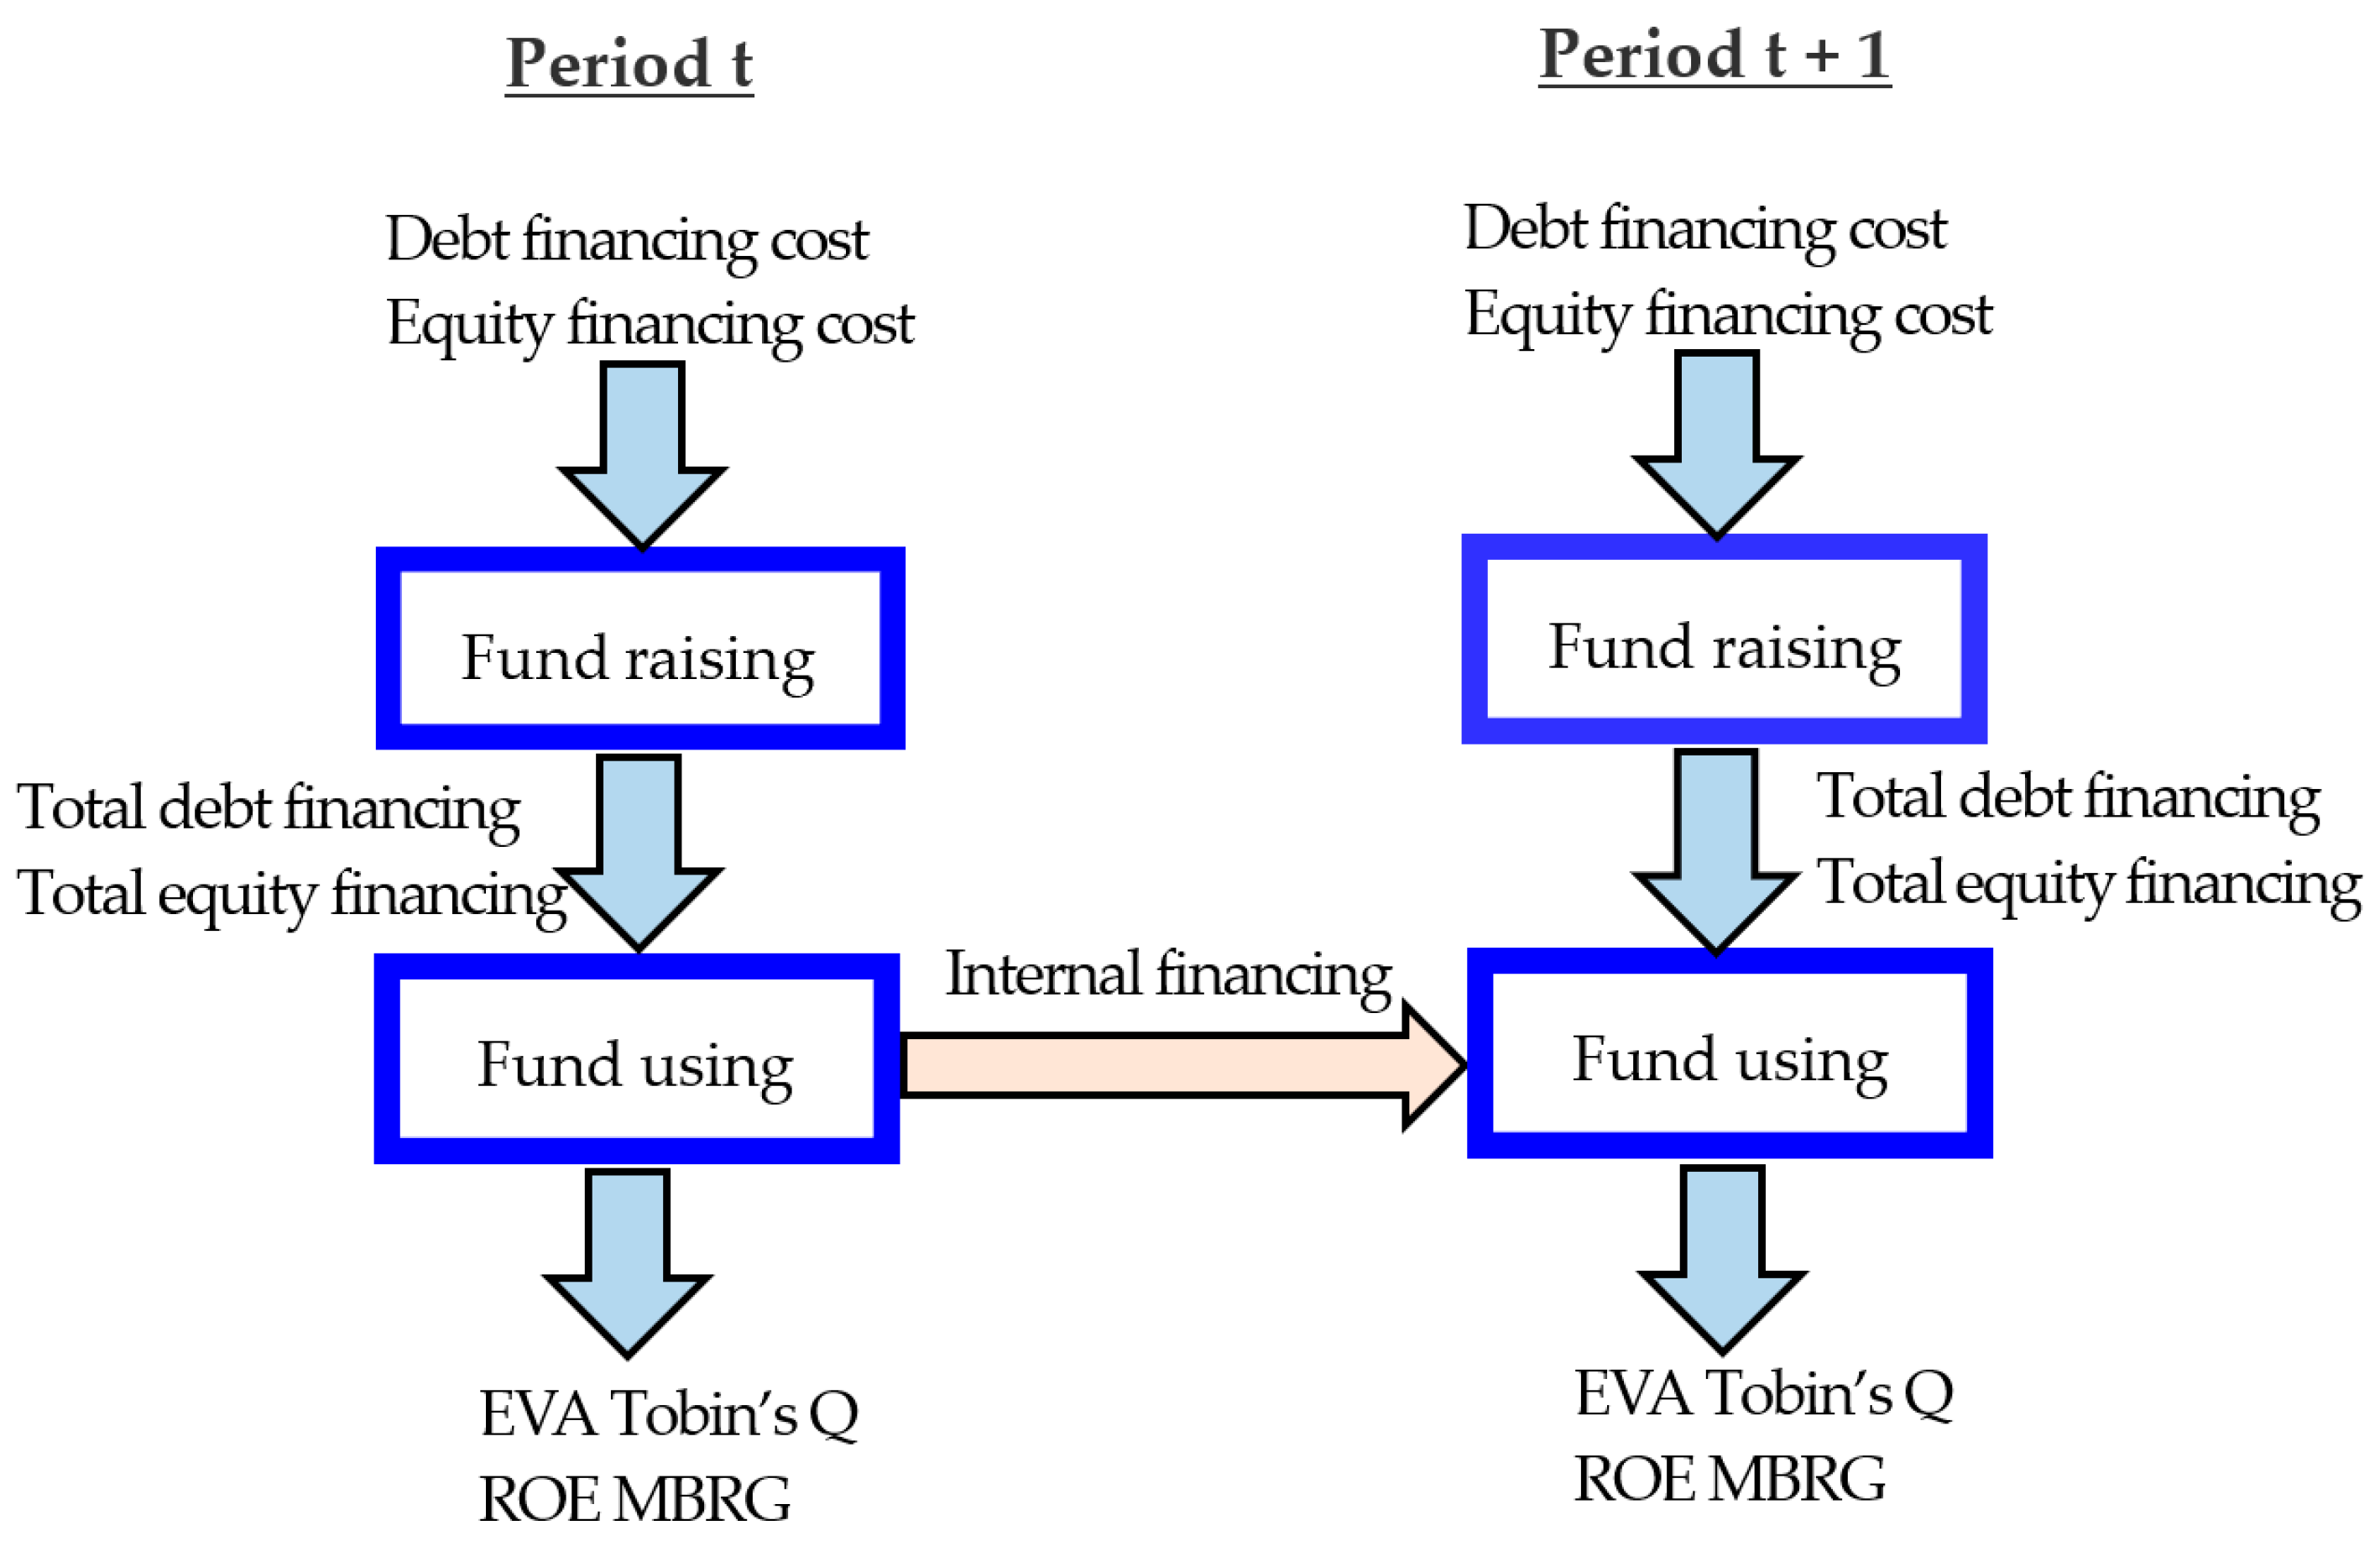
| Input | Debt financing cost | The cost of fund raising | yuan |
| Equity financing cost | yuan | ||
| Intermediate | Total debt financing | Short-term loans+ bonds payable +long-term liabilities maturing in one-year +long-term loans | yuan |
| Total equity financing | Equity + equity premium | yuan | |
| Carry-over | Internal financing | Retained earnings + undistributed profits +accumulated depreciation | yuan |
| Output | Economic value added (EVA) | Net operating profit after tax (NOPAT)–capital cost | yuan |
| Tobin’s Q | Market value/asset replacement cost | - | |
| Return on equity (ROE) | Net profit/average net assets | - | |
| Main business revenue growth rate (MBRG) | (Revenue growth/total revenue of last year) × 100% | - | |
| Year | Score | Mean | Max | Min | Score = 1 | 0.5 ≤ Score < 1 | 0 ≤ Score < 0.5 |
|---|---|---|---|---|---|---|---|
| 2011–2017 | θ | 0.598 | 1 | 0.203 | 4 (0.89%) | 375 (83.33%) | 71 (15.78%) |
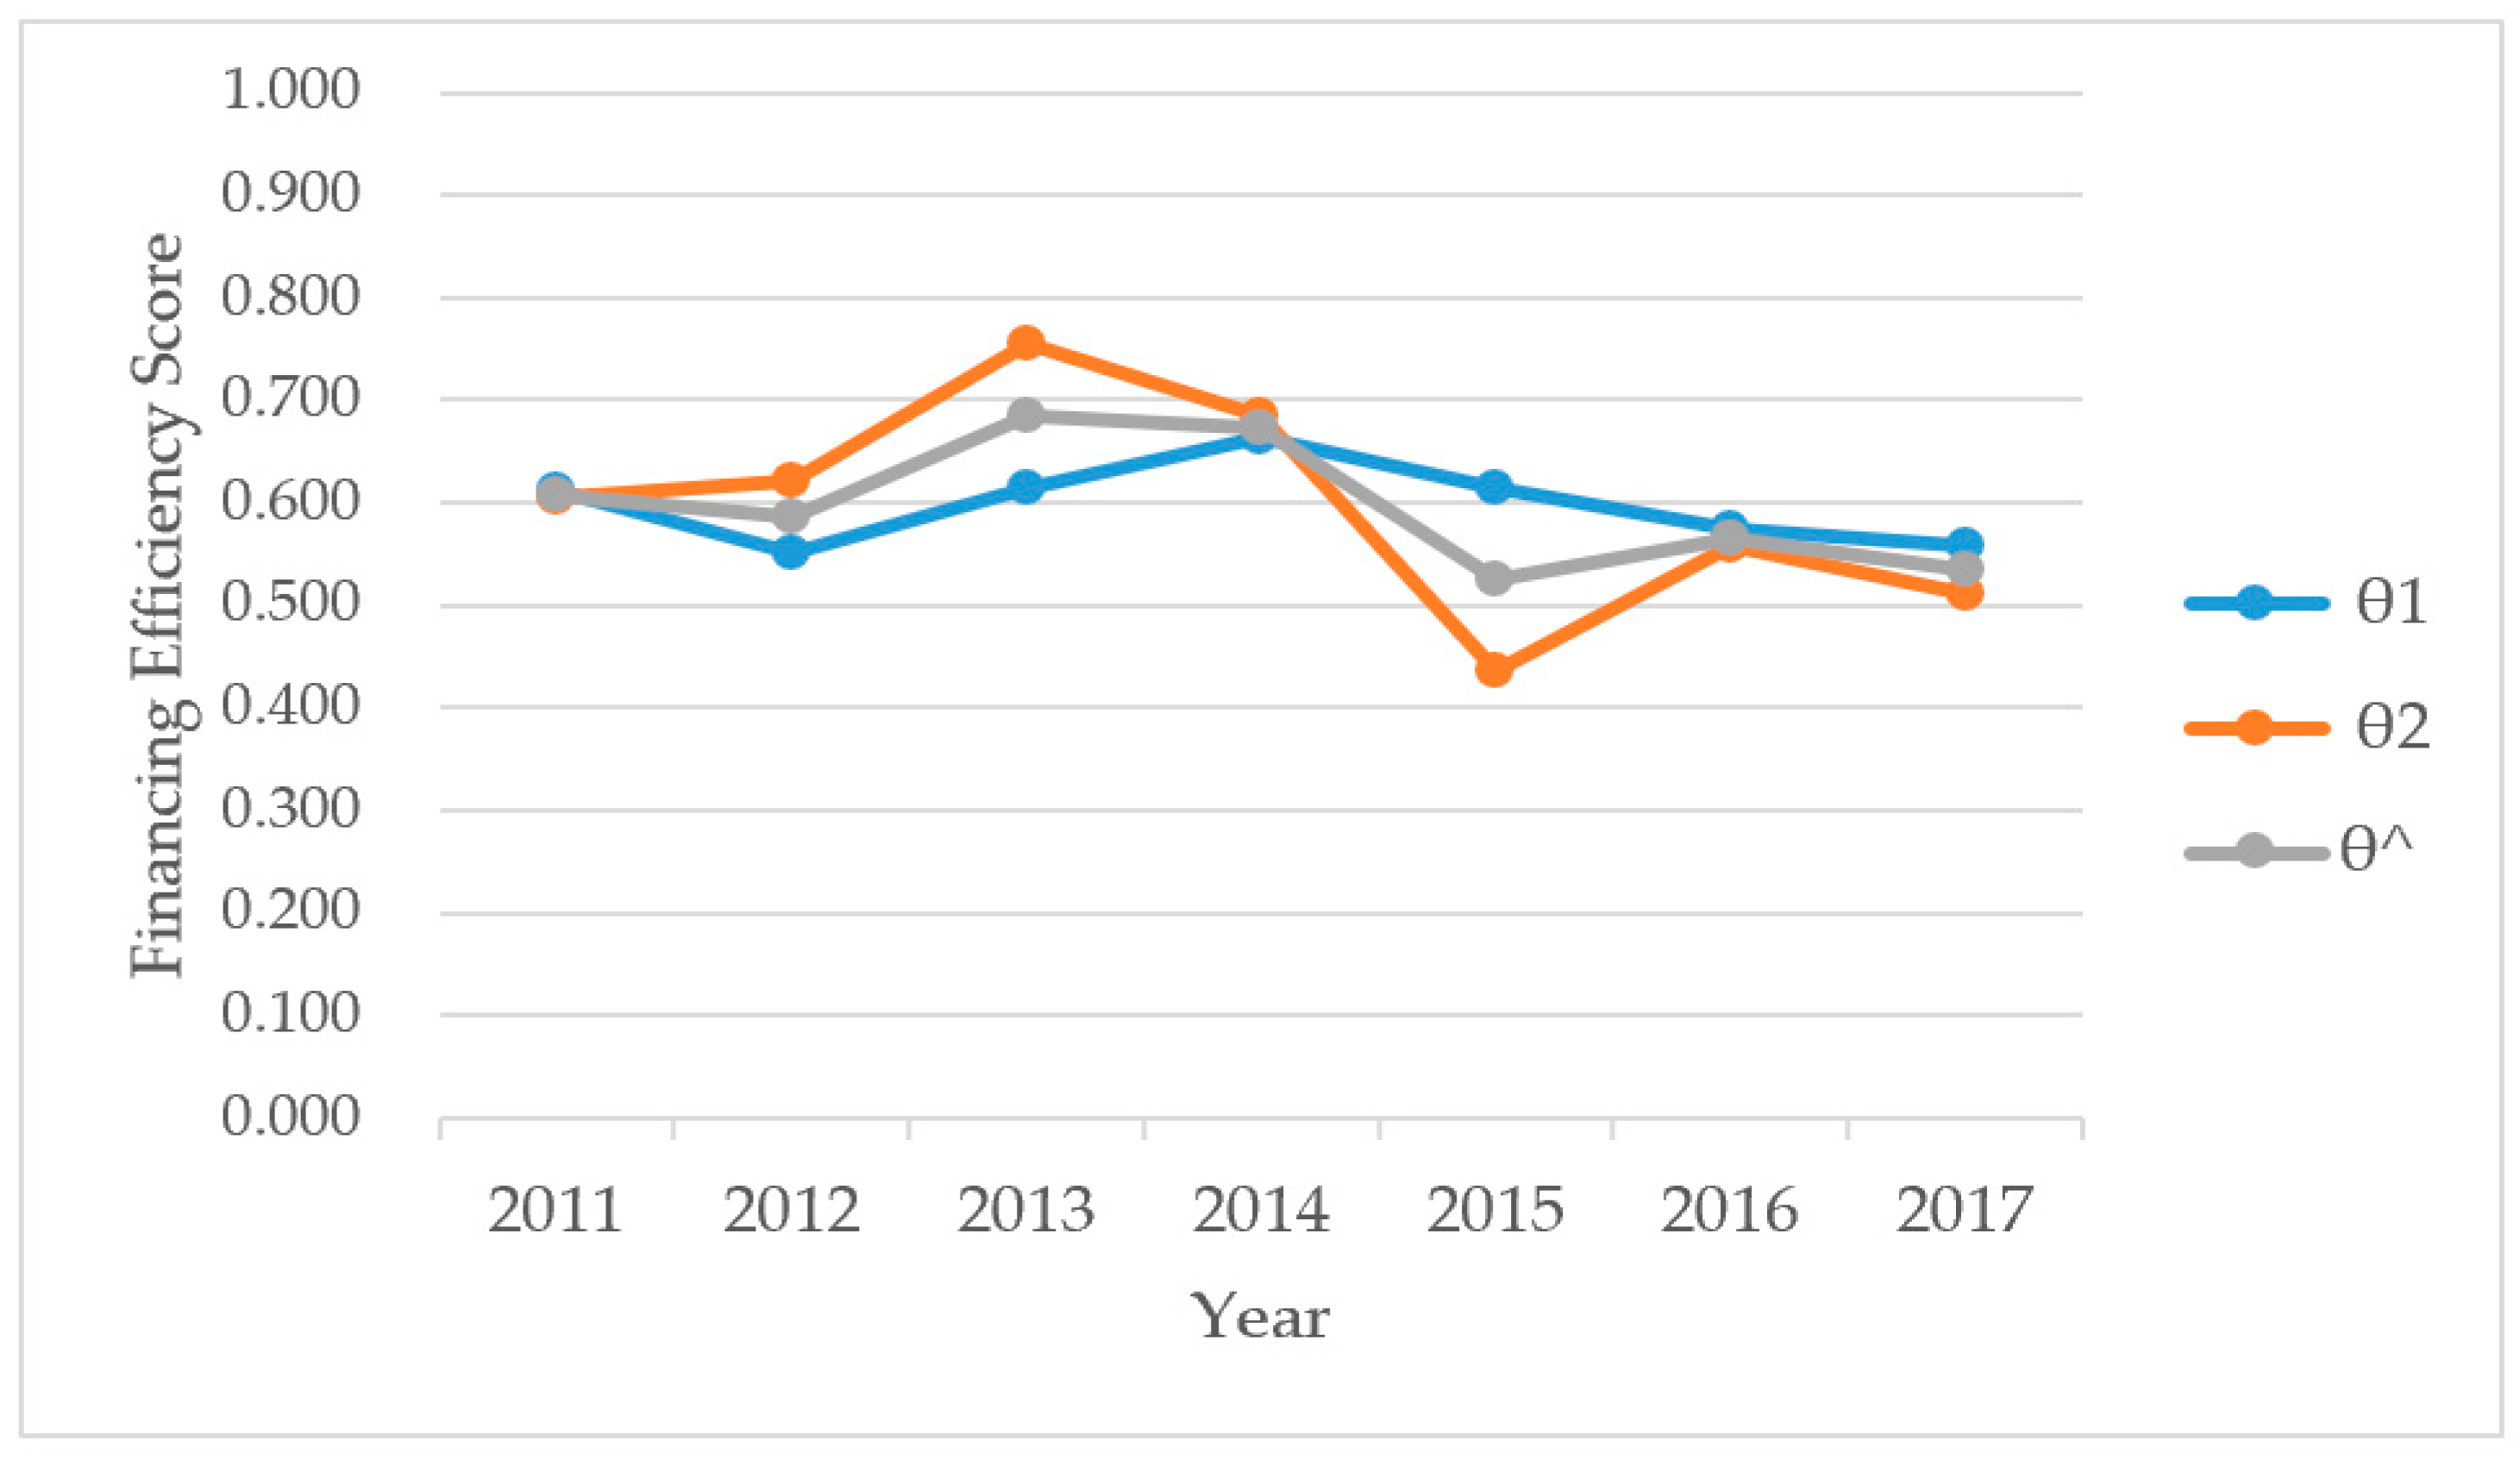
| 2011 | θ1 | 0.612 | 1 | 0.199 | 19 (4.22%) | 396 (88.00%) | 35 (7.78%) |
| θ2 | 0.604 | 1 | 0.022 | 113 (25.11%) | 164 (36.44%) | 173 (38.44%) | |
| θ^ | 0.608 | 1 | 0.161 | 19 (4.22%) | 287 (63.78%) | 144 (32.00%) | |
| 2012 | θ1 | 0.551 | 1 | 0.080 | 18 (4.00%) | 290 (64.44%) | 142 (31.56%) |
| θ2 | 0.622 | 1 | 0.026 | 88 (19.56%) | 228 (50.67%) | 134 (29.78%) | |
| θ^ | 0.586 | 1 | 0.079 | 18 (4.00%) | 287 (63.78%) | 145 (32.22%) | |
| 2013 | θ1 | 0.614 | 1 | 0.159 | 26 (5.78%) | 359 (79.78%) | 65 (14.44%) |
| θ2 | 0.756 | 1 | 0.063 | 126 (28.00%) | 250 (55.56%) | 74 (16.44%) | |
| θ^ | 0.685 | 1 | 0.156 | 26 (5.78%) | 351 (78.00%) | 73 (16.22%) | |
| 2014 | θ1 | 0.663 | 1 | 0.206 | 21 (4.67%) | 389 (86.44%) | 40 (8.89%) |
| θ2 | 0.685 | 1 | 0.037 | 81 (18.00%) | 281 (62.44%) | 88 (19.56%) | |
| θ^ | 0.674 | 1 | 0.213 | 21 (4.67%) | 349 (77.56%) | 80 (17.78%) | |
| 2015 | θ1 | 0.615 | 1 | 0.224 | 22 (4.89%) | 380 (84.44%) | 48 (10.67%) |
| θ2 | 0.435 | 1 | 0.019 | 53 (11.78%) | 121 (26.89%) | 276 (61.33%) | |
| θ^ | 0.525 | 1 | 0.167 | 22 (4.89%) | 177 (39.33%) | 251 (55.78%) | |
| 2016 | θ1 | 0.574 | 1 | 0.272 | 17 (3.78%) | 262 (58.22%) | 171 (38.00%) |
| θ2 | 0.558 | 1 | 0.019 | 82 (18.22%) | 164 (36.44%) | 204 (45.33%) | |
| θ^ | 0.566 | 1 | 0.179 | 17 (3.78%) | 231 (51.33%) | 202 (44.89%) | |
| 2017 | θ1 | 0.558 | 1 | 0.138 | 14 (3.11%) | 298 (66.22%) | 138 (30.67%) |
| θ2 | 0.512 | 1 | 0.017 | 67 (14.89%) | 155 (34.44%) | 228 (50.67%) | |
| θ^ | 0.535 | 1 | 0.137 | 14 (3.11%) | 228 (50.67%) | 208 (46.22%) |
| Statistics Type | Mean | Max | Min | Score = 1 | 0.5 ≤ Score < 1 | 0 ≤ Score < 0.5 | |
|---|---|---|---|---|---|---|---|
| All samples (450) | 0.598 | 1 | 0.203 | 4 (0.89%) | 375 (83.33%) | 71 (15.78%) | |
| Property | SOEs (232) | 0.589 | 1 | 0.203 | 4 (1.72%) | 179 (77.16%) | 49 (21.12%) |
| NSOEs (218) | 0.608 | 0.940 | 0.322 | 0 (0%) | 196 (89.91%) | 22 (10.09%) | |
| Listed board | Main board (294) | 0.581 | 1 | 0.203 | 4 (1.36%) | 225 (76.53%) | 65 (22.11%) |
| SME board (134) | 0.623 | 0.893 | 0.416 | 0 (0.00%) | 128 (95.52%) | 6 (4.48%) | |
| GEM board (22) | 0.674 | 0.929 | 0.539 | 0 (0.00%) | 22 (100.00%) | 0 (0.00%) | |
| Region | Eastern (292) | 0.606 | 1 | 0.203 | 3 (1.03%) | 248 (84.93%) | 41 (14.04%) |
| Central (96) | 0.590 | 1 | 0.361 | 1 (1.04%) | 77 (80.21%) | 18 (18.75%) | |
| Western (62) | 0.573 | 0.821 | 0.324 | 0 (0.00%) | 50 (80.65%) | 12 (19.35%) | |
| Score | SOEs | NSOEs | |||||
|---|---|---|---|---|---|---|---|
| Year | θ1 | θ2 | θ^ | θ1 | θ2 | θ^ | |
| 2011 | 0.605 | 0.543 | 0.574 | 0.620 | 0.668 | 0.644 | |
| 2012 | 0.526 | 0.589 | 0.553 | 0.578 | 0.656 | 0.622 | |
| 2013 | 0.619 | 0.729 | 0.653 | 0.609 | 0.785 | 0.719 | |
| 2014 | 0.655 | 0.679 | 0.655 | 0.673 | 0.690 | 0.694 | |
| 2015 | 0.614 | 0.418 | 0.516 | 0.617 | 0.452 | 0.535 | |
| 2016 | 0.571 | 0.520 | 0.543 | 0.577 | 0.599 | 0.590 | |
| 2017 | 0.552 | 0.488 | 0.519 | 0.564 | 0.537 | 0.552 | |
| Mean | 0.592 | 0.567 | 0.573 | 0.605 | 0.627 | 0.622 | |
| Score | Main Board | SME Board | GEM Board | |||||||
|---|---|---|---|---|---|---|---|---|---|---|
| Year | θ1 | θ2 | θ^ | θ1 | θ2 | θ ^ | θ1 | θ2 | θ^ | |
| 2011 | 0.596 | 0.521 | 0.559 | 0.639 | 0.733 | 0.686 | 0.661 | 0.924 | 0.792 | |
| 2012 | 0.514 | 0.558 | 0.536 | 0.613 | 0.715 | 0.664 | 0.671 | 0.906 | 0.788 | |
| 2013 | 0.607 | 0.747 | 0.652 | 0.613 | 0.763 | 0.735 | 0.717 | 0.837 | 0.825 | |
| 2014 | 0.653 | 0.674 | 0.652 | 0.677 | 0.700 | 0.712 | 0.725 | 0.732 | 0.740 | |
| 2015 | 0.608 | 0.417 | 0.512 | 0.625 | 0.452 | 0.539 | 0.653 | 0.569 | 0.611 | |
| 2016 | 0.575 | 0.511 | 0.537 | 0.574 | 0.625 | 0.606 | 0.572 | 0.776 | 0.713 | |
| 2017 | 0.548 | 0.489 | 0.514 | 0.566 | 0.539 | 0.561 | 0.643 | 0.656 | 0.649 | |
| Mean | 0.586 | 0.559 | 0.566 | 0.615 | 0.647 | 0.643 | 0.663 | 0.771 | 0.731 | |
| Score | Eastern Region | Central Region | Western Region | ||||||||
|---|---|---|---|---|---|---|---|---|---|---|---|
| Year | θ1 | θ2 | θ^ | θ1 | θ2 | θ^ | θ1 | θ2 | θ^ | ||
| 2011 | 0.617 | 0.633 | 0.625 | 0.599 | 0.591 | 0.595 | 0.609 | 0.487 | 0.548 | ||
| 2012 | 0.565 | 0.650 | 0.605 | 0.520 | 0.603 | 0.569 | 0.532 | 0.519 | 0.527 | ||
| 2013 | 0.616 | 0.785 | 0.699 | 0.619 | 0.696 | 0.684 | 0.596 | 0.716 | 0.620 | ||
| 2014 | 0.666 | 0.695 | 0.682 | 0.669 | 0.671 | 0.673 | 0.641 | 0.657 | 0.635 | ||
| 2015 | 0.621 | 0.459 | 0.540 | 0.618 | 0.443 | 0.531 | 0.583 | 0.309 | 0.446 | ||
| 2016 | 0.585 | 0.580 | 0.583 | 0.554 | 0.537 | 0.549 | 0.556 | 0.488 | 0.514 | ||
| 2017 | 0.563 | 0.527 | 0.547 | 0.557 | 0.500 | 0.525 | 0.534 | 0.462 | 0.494 | ||
| Mean | 0.605 | 0.618 | 0.612 | 0.591 | 0.577 | 0.589 | 0.579 | 0.520 | 0.541 | ||
| Region | Province | Score | Region | Province | Score | Region | Province | Score |
|---|---|---|---|---|---|---|---|---|
| Eastern region (292) | Beijing (30) | 0.610 | Central region (96) | Anhui (12) | 0.660 | Western region (62) | Gansu (7) | 0.534 |
| Fujian (10) | 0.615 | Henan (18) | 0.534 | Guizhou (7) | 0.610 | |||
| Guangdong (63) | 0.618 | Heilongjiang (3) | 0.551 | Ningxia (2) | 0.570 | |||
| Guangxi (5) | 0.501 | Hubei (14) | 0.662 | Qinghai (1) | 0.502 | |||
| Hebei (13) | 0.651 | Hunan (13) | 0.626 | Shaanxi (6) | 0.589 | |||
| Jiangsu (45) | 0.599 | Jilin (9) | 0.551 | Sichuan (15) | 0.608 | |||
| Liaoning (9) | 0.591 | Jiangxi (14) | 0.601 | Xinjiang (11) | 0.554 | |||
| Shandong (38) | 0.627 | Inner Mongolia (8) | 0.499 | Yunnan (7) | 0.567 | |||
| Shanghai (25) | 0.561 | Shanxi (5) | 0.643 | Chongqing (6) | 0.576 | |||
| Tianjin (9) | 0.590 | |||||||
| Zhejiang (45) | 0.612 |
Disclaimer/Publisher’s Note: The statements, opinions and data contained in all publications are solely those of the individual author(s) and contributor(s) and not of MDPI and/or the editor(s). MDPI and/or the editor(s) disclaim responsibility for any injury to people or property resulting from any ideas, methods, instructions or products referred to in the content. |
© 2023 by the authors. Licensee MDPI, Basel, Switzerland. This article is an open access article distributed under the terms and conditions of the Creative Commons Attribution (CC BY) license (https://creativecommons.org/licenses/by/4.0/).
Share and Cite
Tan, X.; Zheng, D.; Zhu, Y.; Na, S. The Financing Efficiency of China’s Industrial Listed Enterprises Based on the Dynamic–Network SBM Model. Sustainability 2023, 15, 4723. https://doi.org/10.3390/su15064723
Tan X, Zheng D, Zhu Y, Na S. The Financing Efficiency of China’s Industrial Listed Enterprises Based on the Dynamic–Network SBM Model. Sustainability. 2023; 15(6):4723. https://doi.org/10.3390/su15064723
Chicago/Turabian StyleTan, Xianhua, Danting Zheng, Yuanyuan Zhu, and Sanggyun Na. 2023. "The Financing Efficiency of China’s Industrial Listed Enterprises Based on the Dynamic–Network SBM Model" Sustainability 15, no. 6: 4723. https://doi.org/10.3390/su15064723