Article

Sustainable Design of Self-Consolidating Green Concrete with Partial Replacements for Cement through Neural-Network and Fuzzy Technique

1
School of Information Engineering and Technology, Changzhou Vocational Institute of Industry Technology, Changzhou 213164, China
2
Postdoctoral Scientific Research Workstation, Bank of Zhengzhou, Zhengzhou 450015, China
3
College of Computer Science and Artificial Intelligence, Wenzhou University, Wenzhou 325035, China
4
School of Civil and Environmental Engineering, University of Technology Sydney, Sydney, NSW 2007, Australia
5
Industrial Engineering Department, College of Engineering, King Saud University, Riyadh 11421, Saudi Arabia
6
Centre for Applied Physics and Radiation Technologies, School of Engineering and Technology, Sunway University, Bandar Sunway 47500, Selangor, Malaysia
7
Department of General Educational Development, Faculty of Science and Information Technology, Daffodil International University, DIU Rd, Dhaka 1341, Bangladesh
8
College of Engineering and Technology, American University of the Middle East, Egaila 54200, Kuwait
9
Centre for Infrastructure Engineering, Western Sydney University, Penrith, NSW 2751, Australia
*
Authors to whom correspondence should be addressed.
Sustainability 2023, 15(6), 4752; https://doi.org/10.3390/su15064752
Submission received: 12 January 2023 / Revised: 21 February 2023 / Accepted: 22 February 2023 / Published: 7 March 2023
(This article belongs to the Section Environmental Sustainability and Applications)

Abstract

:
In order to achieve a sustainable mix design, this paper evaluates self-consolidating green concrete (SCGC) properties by experimental tests and then examines the design parameters with an artificial intelligence technique. In this regard, cement was partially replaced in different contents with granulated blast furnace slag (GBFS) powder, volcanic powder, fly ash, and micro-silica. Moreover, fresh and hardened properties tests were performed on the specimens. Finally, an adaptive neuro-fuzzy inference system (ANFIS) was developed to identify the influencing parameters on the compressive strength of the specimens. For this purpose, seven ANFIS models evaluated the input parameters separately, and in terms of optimization, twenty-one models were assigned to different combinations of inputs. Experimental results were reported and discussed completely, where furnace slag represented the most effect on the hardened properties in binary mixes, and volcanic powder played an effective role in slump retention among other cement replacements. However, the combination of micro-silica and volcanic powder as a ternary mix design successfully achieved the most improvement compared to other mix designs. Furthermore, ANFIS results showed that binder content has the highest governing parameters in terms of the strength of SCGC. Finally, when compared with other additive powders, the combination of micro-silica with volcanic powder provided the most strength, which has also been verified and reported by the test results.

1. Introduction

Since global warming has become an emerging global issue, many researchers have proposed alternative approaches to control the emission of greenhouse gases. Cement is a widely used construction material which emits greenhouse gases during its manufacture [1]. Self-consolidating concrete (SCC) uses a prominent amount of cement. Reducing SCC’s carbon footprint and dependence on cement use is of great environmental benefit. SCC in its fresh state offers significant advantages in its rheological properties. It can be placed in formwork without applying vibration due to its high deformability. However, some challenges posed by the use of SCC include high cement consumption, segregation, and a sudden reduction in its viscosity. These challenges have encouraged researchers to seek suitable alternatives for cement used in SCC [2,3]. Natural and synthetic replacements are produced either simultaneously as powder and aggregate, or individually either as powder or aggregate [4,5,6].
Different types of cement and aggregate alternatives have been proposed, with a large range of characteristics [7]. A study on waste glass’s effect on mechanical properties, such as compressive strengths, indicated that using waste glass gradually reduces the strength of concrete while increasing the content of waste glass [8]. In addition, in order to increase the workability and strength factor of SCC, the best replacement dosage for crushed waste glass is 20% coarse aggregate [9]. In the case of marble powder, compressive strength tends to decrease after the marble powder content exceeds 5% [10]. Additionally, marble dust increased the water demand of the concrete; however, the effect of marble aggregates on the mechanical properties of concrete is hard to quantify [11]. It is confirmed that basalt powder enhanced concrete strength, ductility, and energy absorption, especially at elevated temperatures, with an optimum of 2% as replacement content [12]. However, basalt powder is vulnerable to harsh environments such as chloride attacks and direct flame [13]. Furthermore, wood wastes such as woodchips, wood fiber, and sawdust are potential materials that could be used to establish a sustainable recycling system. For example, porous concrete with clay–cement–wood aggregates was reported to exhibit a reduced capillary water absorption ability [14]. The mechanical properties, with the addition of coconut fiber in concrete, have also been studied. Coconut fibers have the highest toughness among natural fibers. It was reported that with coconut fiber having a 50 mm length and 2% content, the compression strength and split tension strength were improved by 20% and 10%, respectively [15]. Additionally, in high contents of coconut fiber, the modulus of elasticity would increase up to 16% [16]. In regards to the possibility of using ceramic waste in concrete and mortar, studies have pointed out that by partially substituting sand and through waste fine aggregate, there is a great effect on the workability of fresh mortar due to the significant water absorption during the preparation of ceramic waste materials. In addition to per reported documents, concrete incorporating up to 50% fine ceramic aggregates as natural aggregates resulted in higher compressive strength and durability performance. Moreover, the use of up to 40% ceramic waste as coarse aggregates in high-performance concrete revealed a significant reduction in autogenous shrinkage [17,18]. Rubber was used for the partial replacement of fine aggregate up to 7.5% as replacement content which led to a decline in the concrete’s desired strength; accordingly, the compressive strength decreased as the rubber incorporation range increased. Rubberized concrete also gained strength from magnesium oxychloride cement, providing favorable bonding properties to rubber and essentially improving the rubber–concrete performance [19,20]. Rubber tree seeds were also used as concrete aggregate replacement in concrete mix, where a 4% replacement of aggregates led to a dramatically improved concrete performance [21]. Although using waste plastic fibers (WPFs) has a negative effect on compressive strength, using WPFs as replacement aggregates improved the flexural strength and increased the ductility of the specimen(s). The more elongated the PET fibers, the more flexural capacity was gained. Employing the PET fibers and WPAs decreased the split tensile strength of concrete, and even with the increment in fiber content, this tensile strength loss increased [22,23]. Using PET fibers actively restricted crack propagation through the load–deflection experimental test, where the WPF played a reinforcing role and enclosed the connection between interior parts [24]. Steel fibers (SF) have also been used to develop some of the mechanical properties of different types of concrete. Another type of SF extracted from waste tires is wire SF, and when concrete is reinforced with wire SF, the flexural strength increased proportionally with the addition of high wire fiber [25]. Commonly, the crack propagation dramatically decreases and strength properties increase in the presence of SF. However, with the incorporation of 10% micro-silica and 1% SF content, compressive and flexural strength improved by 19% and 61%, respectively [26]. It was found that the 1.5% SF, with the addition of 15% fly ash content, showed improvement in compressive and flexural strength by less than 10% and 35%, respectively [27]. Accordingly, using waste steel lathe and waste lathe scrap fiber dramatically enhanced the cohesion of the paste and strengthened the bond behavior, which restricted the crack [28].
Many factors affect the quality of SCC properties. The use of supplementary cementitious materials (SCM) in SCC mixes is one such factor. Identifying the most prominent factor affecting SCC properties when SCMs are employed could lead to finding more optimized SCC mix designs. Several studies have been carried out to date on the use of SCMs in SCC to establish relationships that can achieve the desired set of requirements. According to ASTM C618, a pozzolan is defined as a siliceous or aluminosiliceous materials, which in the presence of water and calcium hydroxide acts as a binder [5,29,30]. Pumice is an igneous rock that is suitable for use as a natural pozzolan [31]. When processed, pumicite (VP) improves not only early- and long-term concrete strength [32] but also shows excellent resistance against sulphate attacks [33]. Ground granulated blast furnace slag (GGBFS) is a similar material to cement but with far less environmental impact when used as an SCM [7]. In terms of its cementitious and pozzolanic benefits, GGBFS lowers the heat of hydration, increases the strength, enhances the impermeability, and improves the resistance to sulphate attacks [5]. Micro-silica (MS) has been utilized in different types of concrete as an admixture, and it has enhanced the durability and reduced the concrete thermal cracking and has been shown to generally improve the engineering properties of concrete [4]. However, MS as a partial replacement of cement does lead to adverse effects on the early age strength of concrete [34]. MS has also been used as cement replacement in binary and ternary mix designs in SCC production [5], where the MS showed a dramatic increase in compressive strength, especially at older ages [23]. Fly ash (FA) is an aluminosiliceous material produced from the exhaust gas of coal-fired thermal power plants [22]. The use of FA increases the workability, aids binder hydration, and lowers the heat of hydration [35]. Many properties of concrete are improved by the use of SCMs. Furthermore, the addition of MS significantly improved the mechanical and durability properties of concretes. On the other hand, high cost, limited availability, dispersion difficulties, and the high-water demand of MS are shortcomings of using this powder in dosages any higher than 5% [8,36,37]. In this study, FA was employed as an authoritative reference to better understand the performance of VP, GGBFS, and MS as SCMs in SCC. ASTM C618 classifies FA according to its chemical composition, particle fineness, and strength activity index. For this study, FA has been selected as an appropriate reference along with Portland cement, to make the comparison more reliable.
Numerical assessment of concrete characteristics has been performed through a variety of methods including classical mathematical algorithms and intelligent-based algorithms. The Wiener approach was used to evaluate the concrete reliability index, although this method was challenged by non-linear relations [38]. Intelligent-based algorithms can be used to deal with non-linear problems and are commonly useful for concrete stochastic problems [1]. An adaptive neuro-fuzzy inference system (ANFIS) is a neural network that proceeds with the analysis of data using a fuzzy logic algorithm. It can be used to learn and adapt to the data automatically [39]. ANFIS has been used in many applications including the real-time identification and estimation of multivariate systems [40]. ANFIS, in contrast to most analytical procedures, does not rely on system parameters to be known [41]. Its more straightforward approach allows it to be used in multivariate systems where input data is limited. The partial replacement of cement in SCC with SCMs leads to a change in the concrete properties; for example, a change in the compressive strength can result as a function of time [41,42]. Quantifying the degree of this change is a challenge. Therefore, using artificial intelligence (AI) to quantify the amount of change is a useful tool [43]. ANFIS will be utilised in this study to evaluate the influence of different factors affecting the outcome of SCC properties.
This paper aims to develop a sustainable self-consolidating green concrete (SCGC) utilising VP, GGBFS, MS, and FA at replacement levels for Portland cement ranging from 10 to 50% to formulate binary mixtures. MS and VP have been further added to these binders in order to formulate ternary mixtures. The slump flow, compressive strength, water absorption, and electrical resistance of SCC mixes have been evaluated. The outcome of a compressive strength test in SCGC mixes has been assessed with the generation of 28 ANFIS models, including 7 models examining individual material input factors and 21 models examining coupled material input factors. The ranking of material input factors such as VP, GGBFS, MS, FA, and Portland cement contents, and property input factors such as compressive strength, electrical resistivity, and water absorption, have also been assessed.

2. Materials and Methods

2.1. Raw Materials

The chemical and physical properties of the raw materials used in this study are listed in Table 1 and Table 2. As mentioned in Section 1, VP, FA, GGBFS, and MS have been used as the source of SCMs in this study for the partial replacement of Portland cement and the formulation of the various binary and ternary mixtures.
Meanwhile, in order to satisfy the EFNARC recommendations for aggregate grading, both sand and gravel were provided from two different gradings [44]. Based on the aggregate sizes, blue curves show the coarse aggregate size and grey curves show the finest aggregate sizes. Figure 1 shows the grading curve of the coarse and fine aggregates used in this study where the grading test based on the sieving procedure has been operated at different times for deriving the grading status. The gray line illustrates the high-range curve and the blue line illustrates the low-range curve [45]. Meanwhile, orange curves are pointing to the main grading quality that has been utilized in the experimental tests, while mixing the two blue and grey curves with the same participation has been derived.

2.2. Mix Proportions

Cement has been replaced by FA, VP, and GBFS at 10, 20, 30, 40, and 50% in binary models. Moreover, for the ternary mixtures, the VP was replaced at 25, 40, and 45% along with MS with 5 and 10% as replacement percentage values. Furthermore, the mix designs had a constant water to binder ratio of 0.38. The cementitious material content in all designs was 500 kg/m3, and the specific weight of the mixtures was 2350 kg/m3. The dry materials were mixed first, then water and HWRA were added during the following stages. The mixing process was followed according to the AS 1012.2 provisions. The slump flow test was performed immediately after the mixing, according to EFNARC, until 50 min after the initial mix. As per EN12390-2 and EN12390-3, the specimens were molded into 15 × 15 × 15 cm standard cube samples and three specimens from each sample were tested at the selected ages.

Specimens

Each series of mix designs includes 12 standard cube specimens measuring 15 × 15 × 15 cm3 (Figure 2) which are molded in 24h under laboratory conditions after the mixing process and immersed in lime-saturated water tanks for further curing at an average temperature of 23 +/− 2 °C. Mix proportions of the binary and ternary mixtures have been listed in Table 3 and Table 4, respectively.

2.3. ANFIS Methodology

2.3.1. Statistical Data

A total of 109 compressive strength test results were carried out in this investigation, and the results of these tests were used in the ANFIS models. Table 5 shows the inputs and the outputs of the models.

2.3.2. ANFIS Architecture

The ANFIS has been developed from a fuzzy method inside the neural-network system that has been performed in different types of prediction and evaluation applications in engineering studies. The initial results in data sets are mainly unpredictable due to the irregular patterns or non-linearity of relations for predication networks, hence directly performing the algorithms on these data (called crisp data) may not be feasible. Therefore, in the fuzzy method, crisp data turns into the fuzzy inference engine with a fuzzifier step and the fuzzification process begins within the system, and finally, the predicted results come out in crisp state with DE fuzzifier process. Figure 3 indicates the fuzzification process of the fuzzy technique.
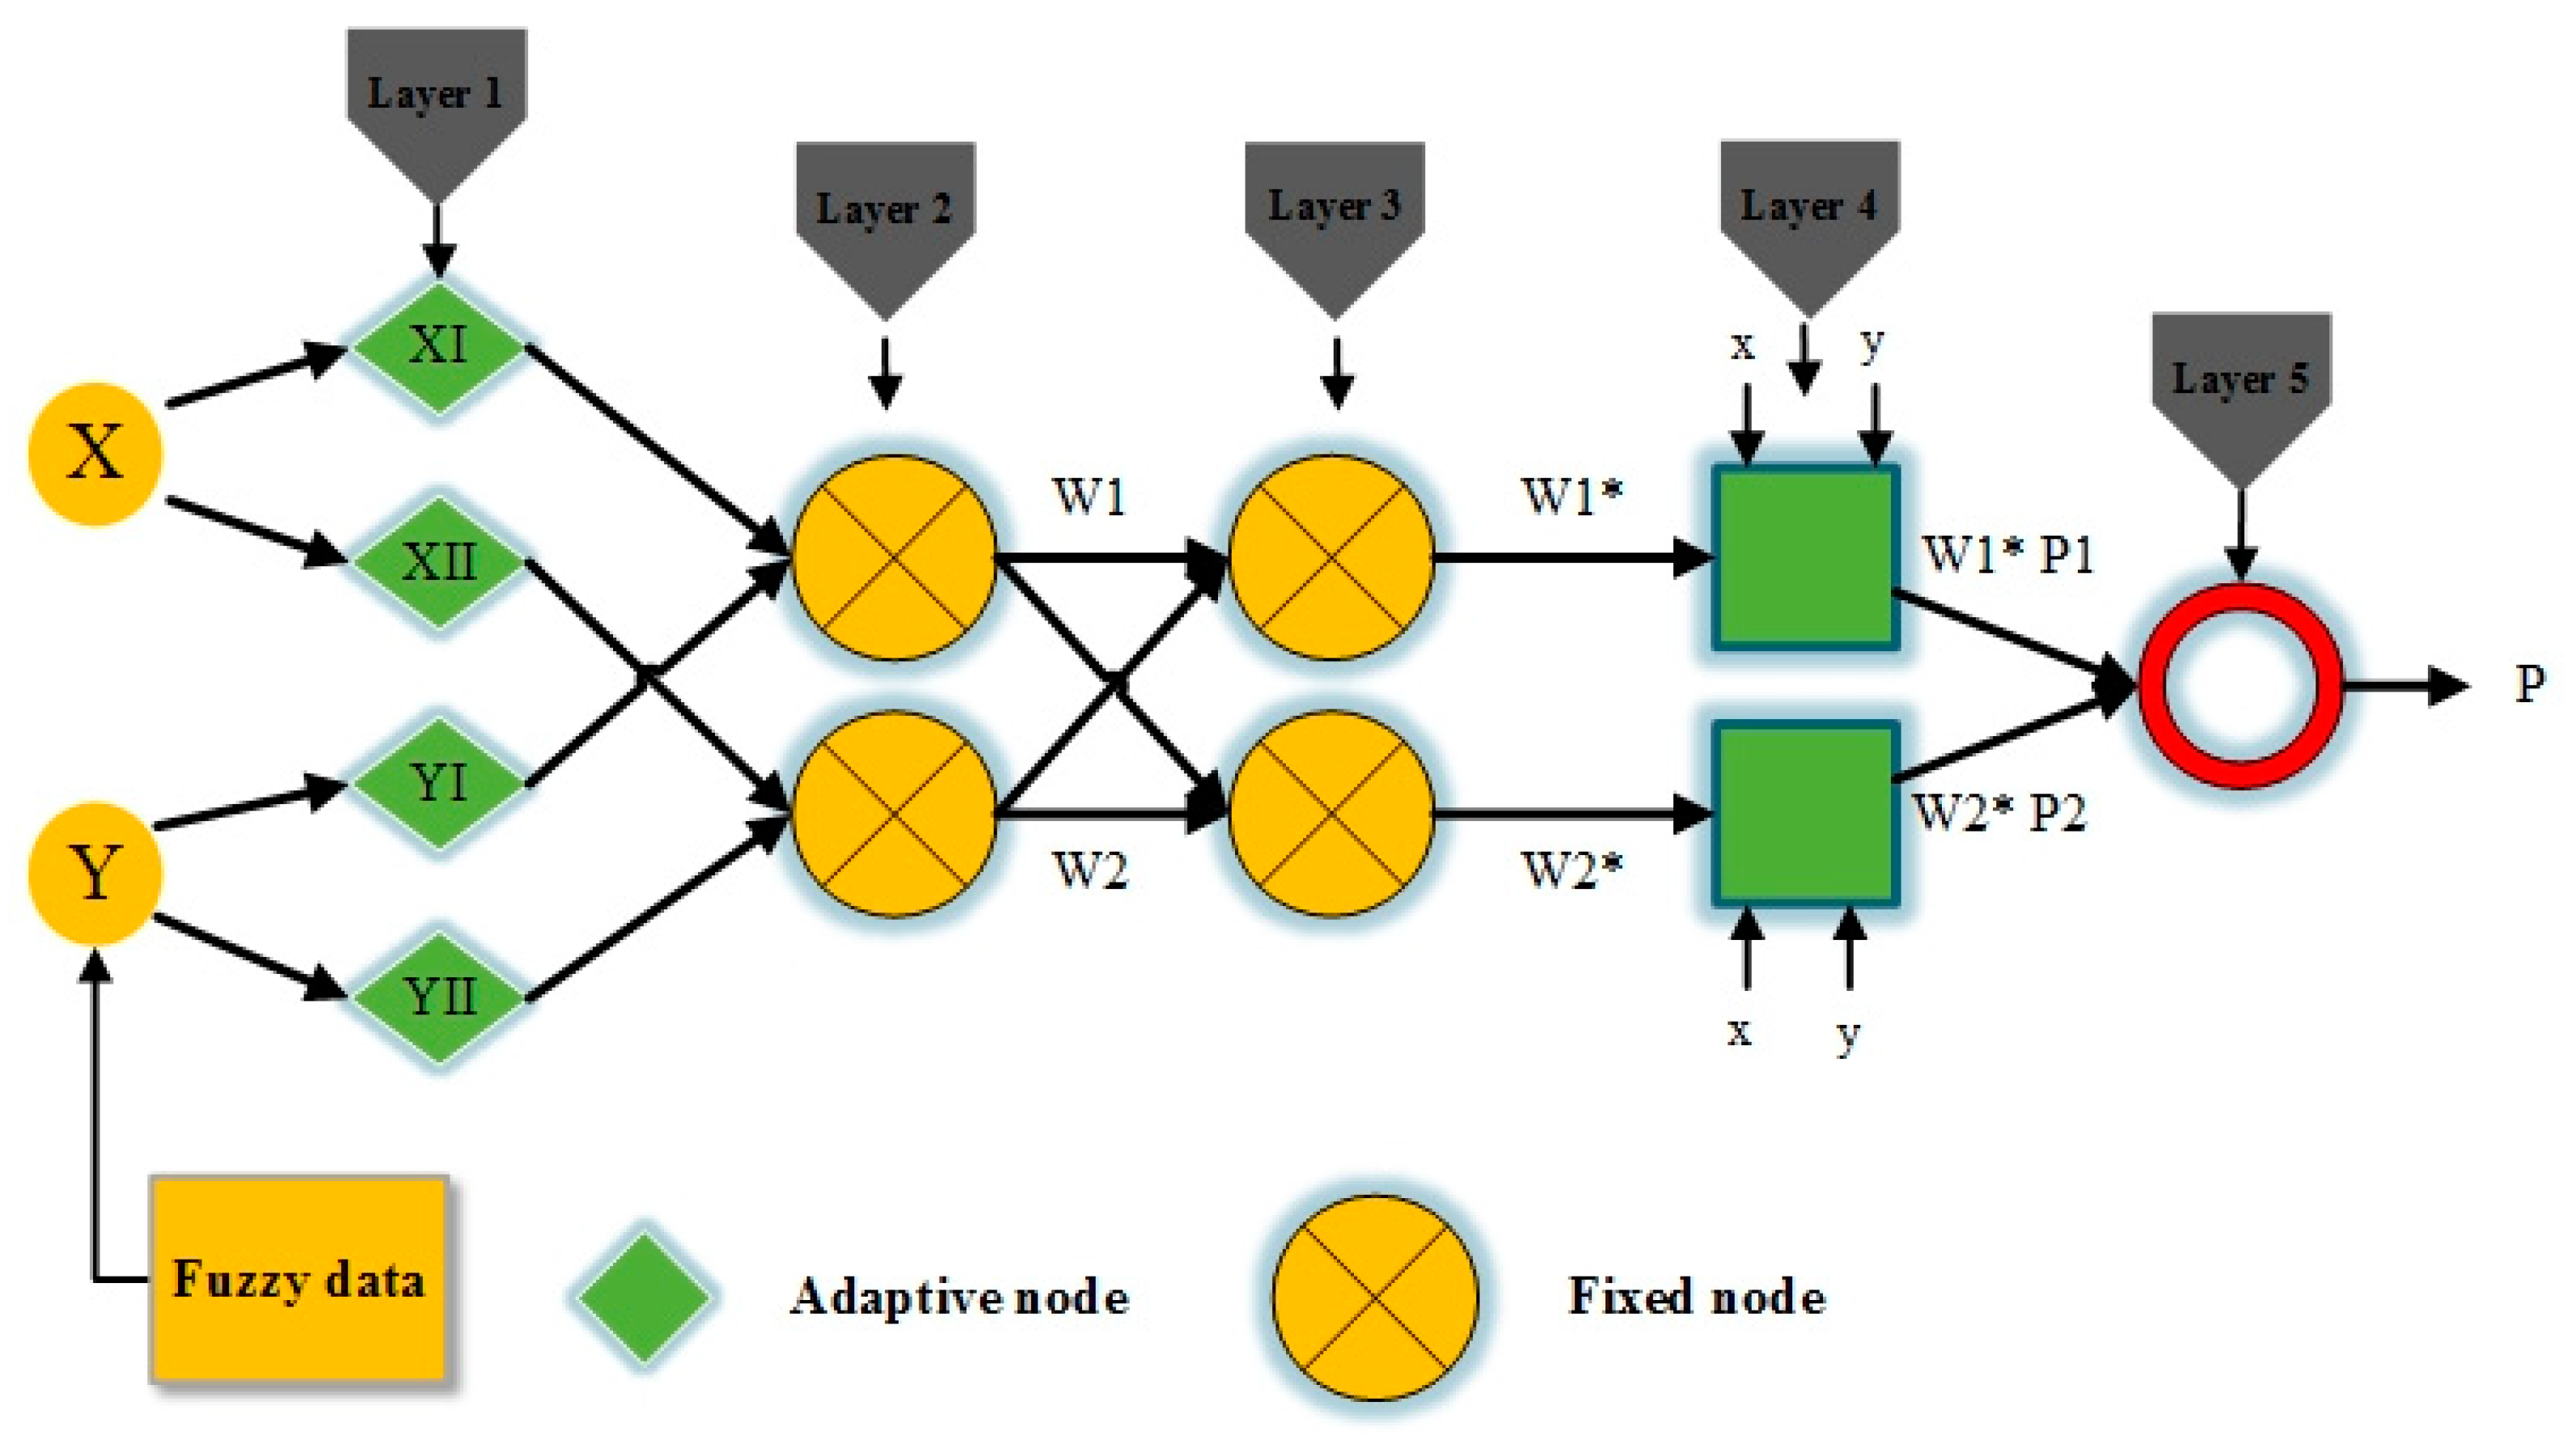
As shown in Figure 4, the ANFIS network consists of 5 layers in which the central core of the network is a fuzzy inference system, and layer 1 receives the inputs and converts them into the fuzzy value by membership functions. In this study, the bell-shaped membership function was used since this function has the highest capacity for the regression of the nonlinear data [46].
The bell-shaped membership function is defined as follows:
μ x = b e l l x ; a i , b i , c i = 1 1 + x c i a i 2 b i
where a i ,   b i ,   c i ,   d i are the parameters set and x is the input.
The second layer multiplies the fuzzy signals from the first layer and provides the firing strength of a rule. The third layer is the rule layer, where all signals from the second layer are normalized. The fourth layer provides the inference of rules, and all signals are converted into crisp values. The final layer summarizes all signals and provides a crisp output value.
A hybrid learning algorithm was employed in the process of variable identification. The functional signals process up to the fourth layer, whereby the hybrid learning algorithm runs throughout the layers. Least squares estimation was applied to obtain the resulting variables. In contrast, for the backward path, the error rate courses backward and through the gradient decline order, and the premise variables are synchronized.

2.3.3. Parameter Identification

For the parameter identification, the ANFIS network is initially trained for each input, and then the combination of inputs is considered [47]. The influence of each input on the output can be evaluated by the value of Root Means Square Error (RMSE), which is one of the most authenticated criteria for identifying accuracy [48]. RMSE is the forecasting parameter representing the performance of the developed network [49]. The above parameter is defined by the following equation [50]:
R M S E = q = 1 q = z P q O q 2 z  
where P q and O q are the predicted and observed variables, and z is the total number of considered data.
In this study, RMSE was used to identify the effective parameters of the ANFIS models due to the high number of developed models (i.e., 7 models with separate inputs and 21 models with coupled inputs). To evaluate the accuracy of the parameter identification process, 70% of the data were randomly selected for the training phase, and the other 30% were randomly devoted to the testing phase. It is also important to note that the Fuzzy inference system in the MATLAB 2019 environment was applied in the ANFIS training and testing phases.
Interventional studies involving animals or humans and other studies that require ethical approval must list the authority that provided approval and the corresponding ethical approval code.

3. Results and Discussions

3.1. Fresh Concrete Properties

Slump Flow

The concrete was designed to give a slump flow of 650 ± 25 mm according to the EFNARC committee recommendation, which was obtainable by using varying dosages of HWRA [38,51]. The slump flow was examined (according to ASTM C1611 [5]) to determine the workability of fresh SCC at different intervals, including at 10, 20, 30, 40, and 50 min. When the initial slump flow of the SCC was deemed satisfactory, the mixture was placed into five slump cones, and the slump flow test was conducted at intervals of 10 min [5,23,43]. Therefore, 10 min after the initial slump flow test, 1 slump cone was lifted after another 10 min, up to 50 min. The slump flow value was recorded for 5 cones for each mixture. Furthermore, the tests were repeated more than 4 times for different percentages to increase the accuracy and confirmation of observations, and the same result was observed. The mixture should be stirred for 20 s before each test.
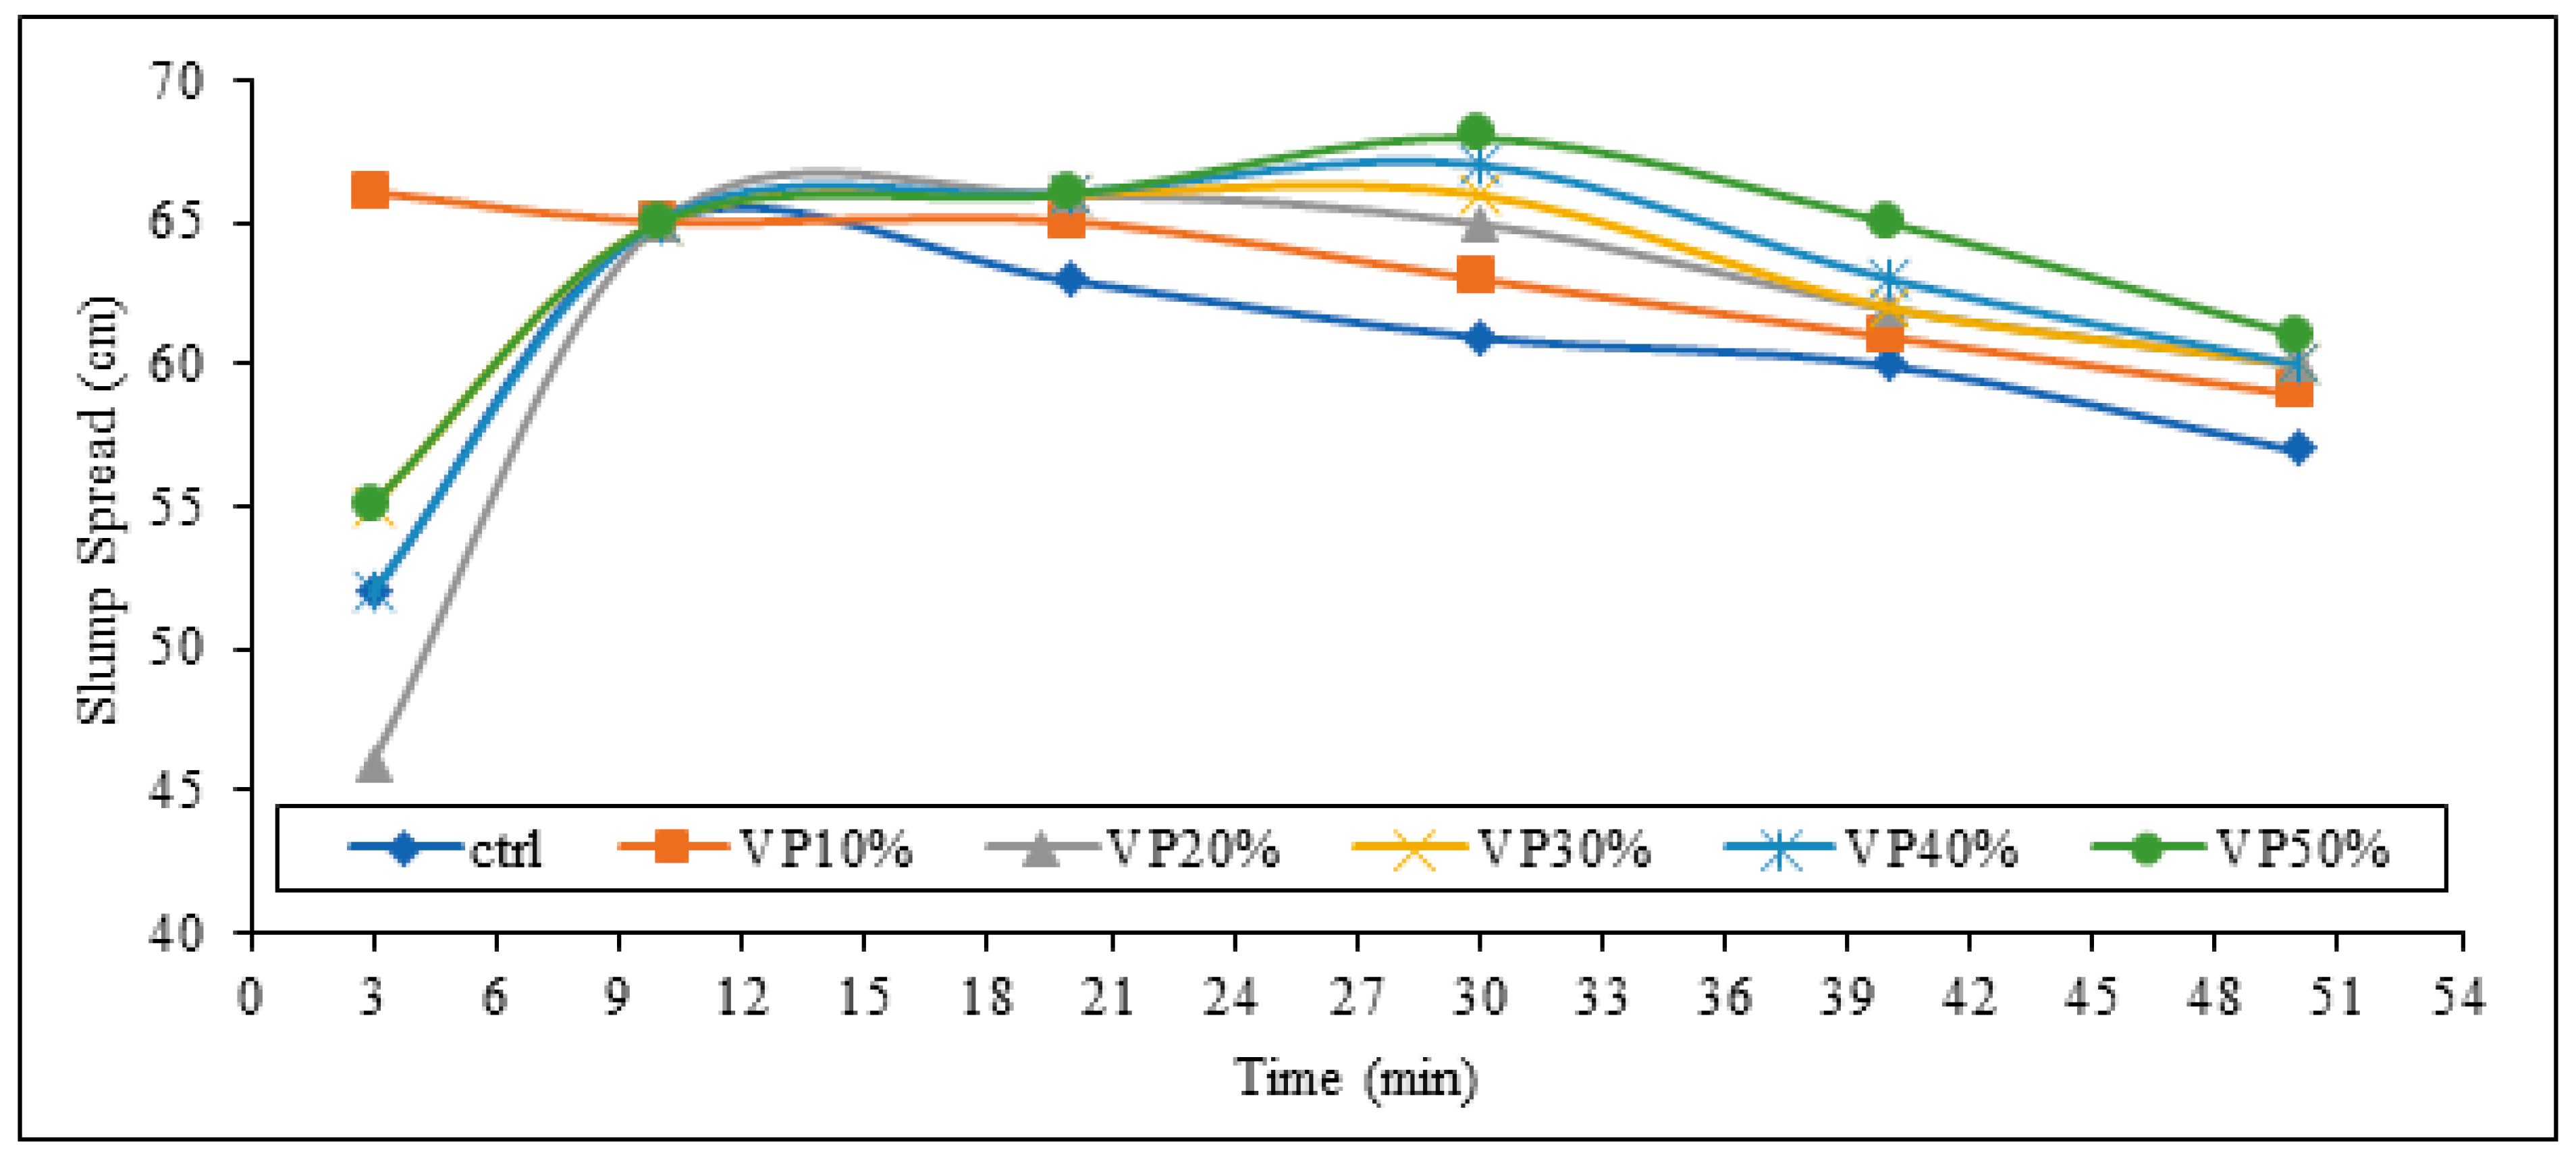
This test measures the concrete propagation after the funnel removal and obtained results indicate the degree of filling ability and self-consolidating concrete stability. The measured slump flow of the specimens with VP in the ranges of 3 to 50 min is shown in Figure 3, and other slump values are tabulated in Table 6.
As per Figure 5, not all of the samples were able to reach the required level in a 3-min slump, excepting the VP 10% sample. However, according to the 10 min results, all of the mixtures managed to obtain the suitable slump value, which could be related to the effect of HWRA by mixing in a rotary drum. Moreover, it is obvious that using VP has played a retention role for slump value, while from the 10 to 50 min intervals, all of the samples containing VP indicated higher slump value in comparison to the control specimens. In addition, the more the VP content was represented, the more slump retention was observed through the durations of 10 to 50 min. The increasing trend of slump flow, which leads to the creation of a bell-curve, should be related to the physical properties of VP particles. It seems that in the first few minutes, VP particles can absorb mixed water, and after a while, the absorbed water is returned to the mixture. Therefore, this leads to an increased water to cement ratio and fluidity during the middle minutes. Subsequently, the cement paste enters its normal phase and again reduces the slump flow. As seen in Hossain and Lachemi [52], increasing the quantity of volcanic pozzolan powder by up to 40% resulted in an increased slump and more entrapped air that leads to better workability and less compressive strength.
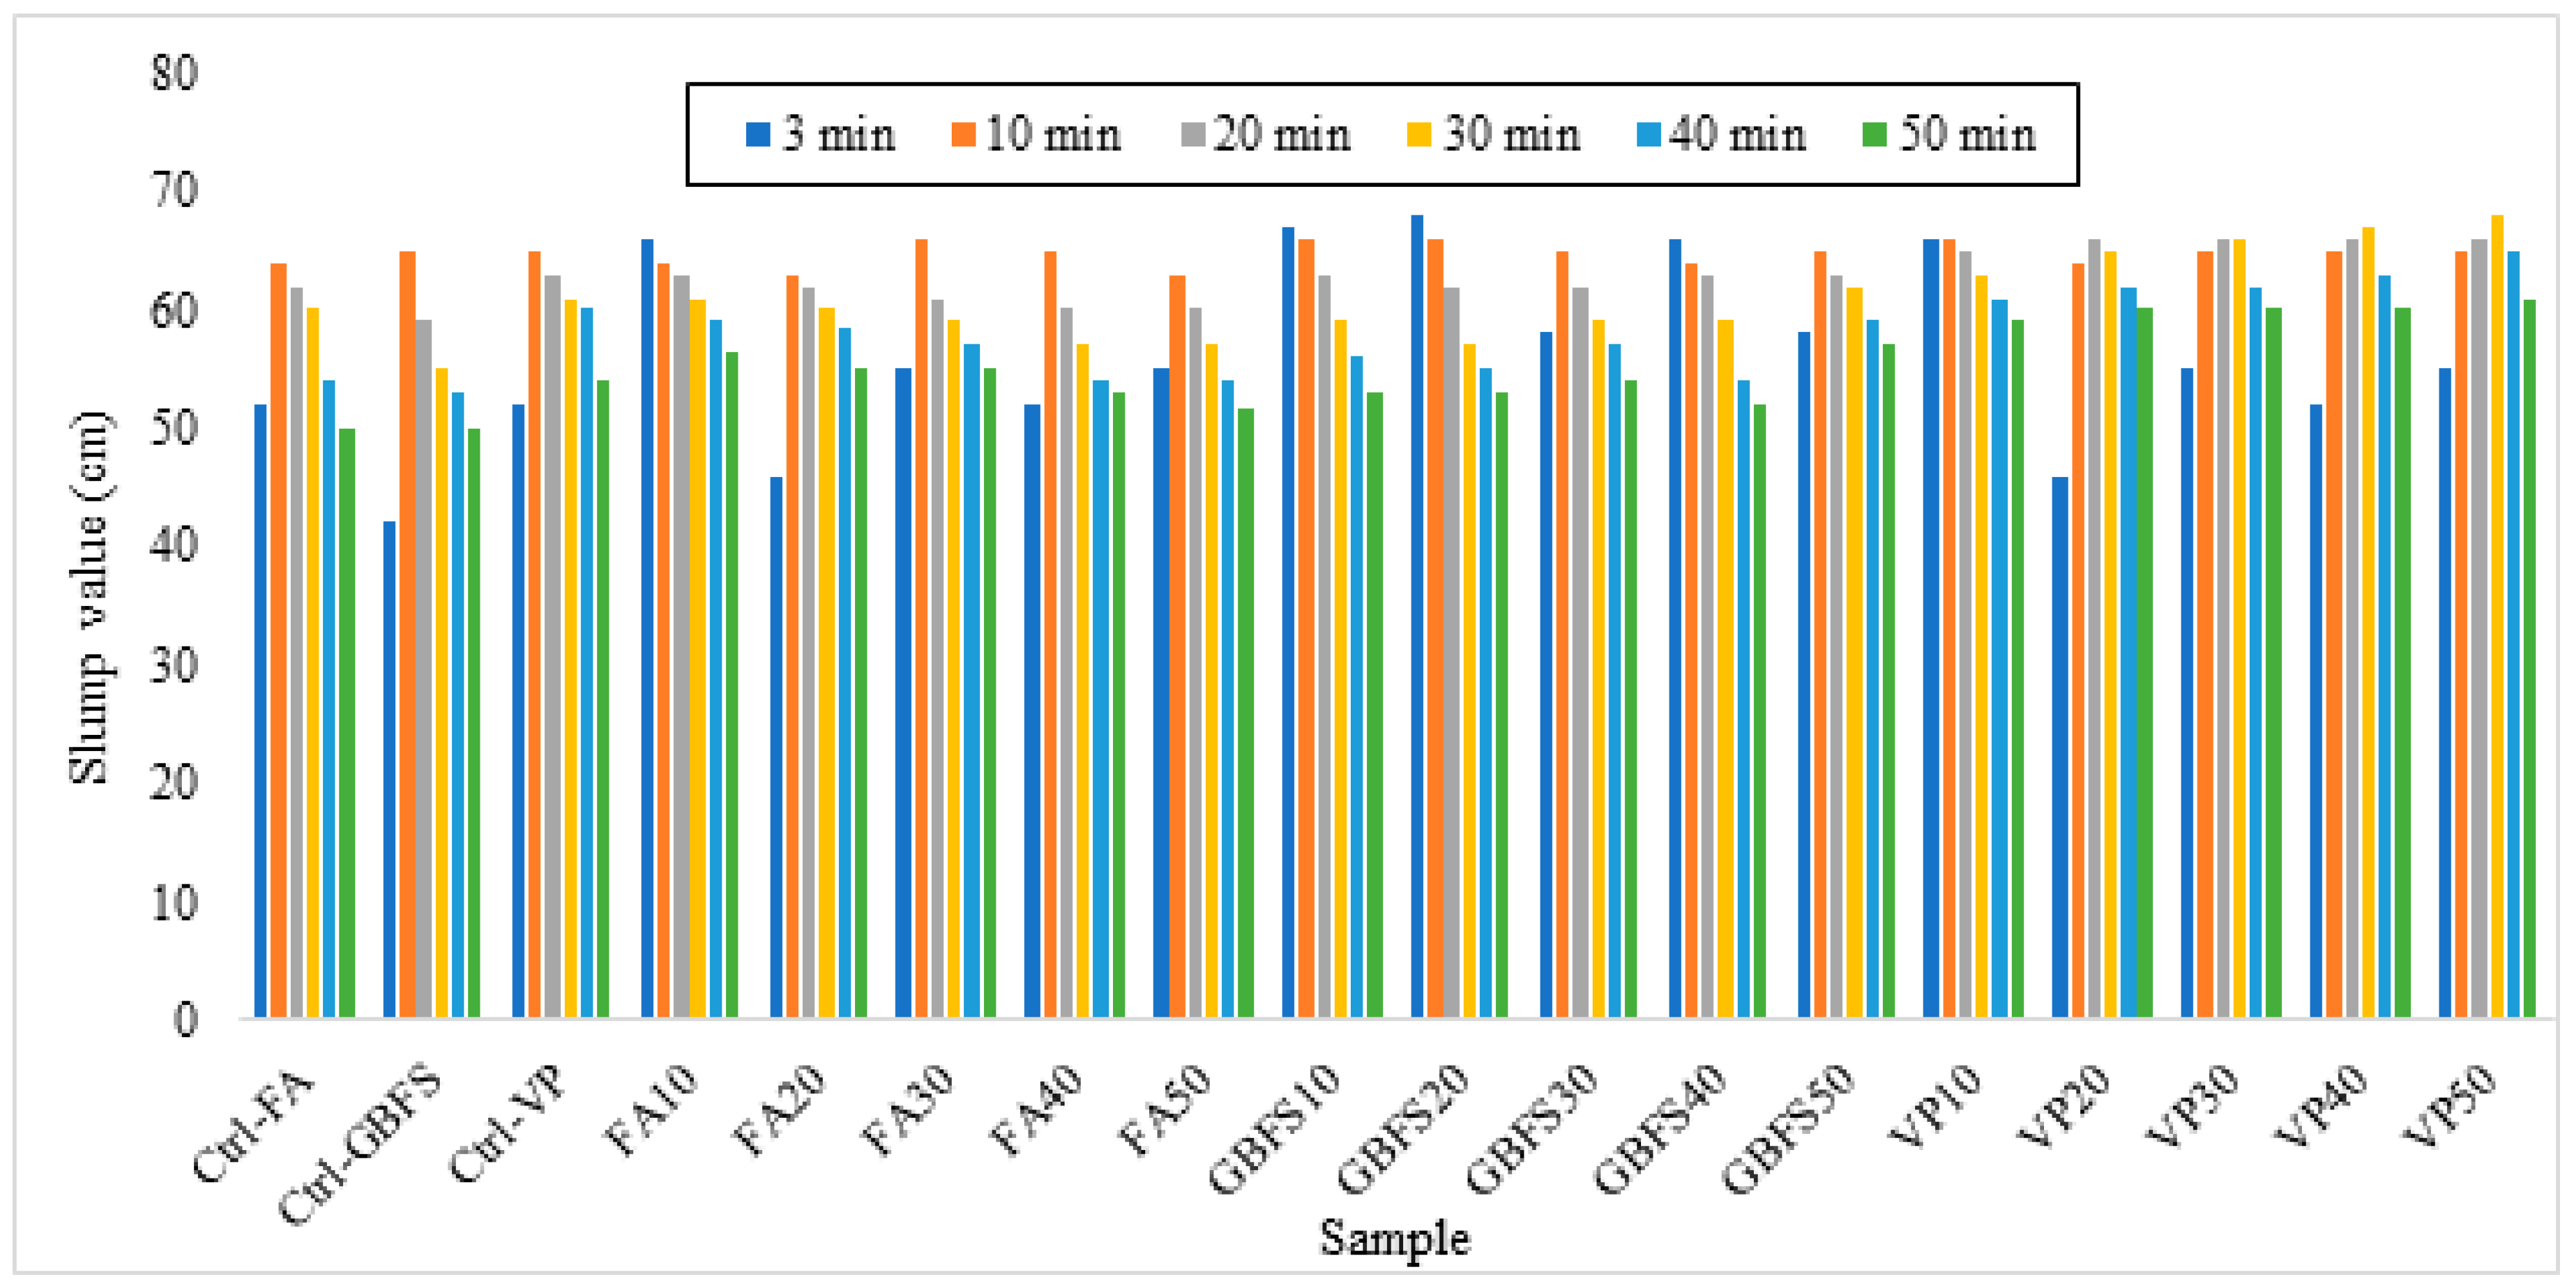
In addition, Table 6 represents other slump values, where the GBFS specimens indicate the most slump values, and the best slump retention is for 50% replacement. Thoughtfully, the GBFS has provided a lower-paste viscosity, and its glass crystalline particles are less water-soluble than VP, which leads to lower water absorption. Thus, in earlier times, the mixtures have a high slump value, and this value increases with increasing GBFS replacement. Additionally, as per Bheel et al. [53], any decrease in workability is caused by porous GGBFS and FA particles, which absorb more water as their percentages in the concrete mixture grow. Furthermore, Bheel et al. [54] verified that increasing the substitution of Portland cement with VP resulted in greater workability of fresh concrete.
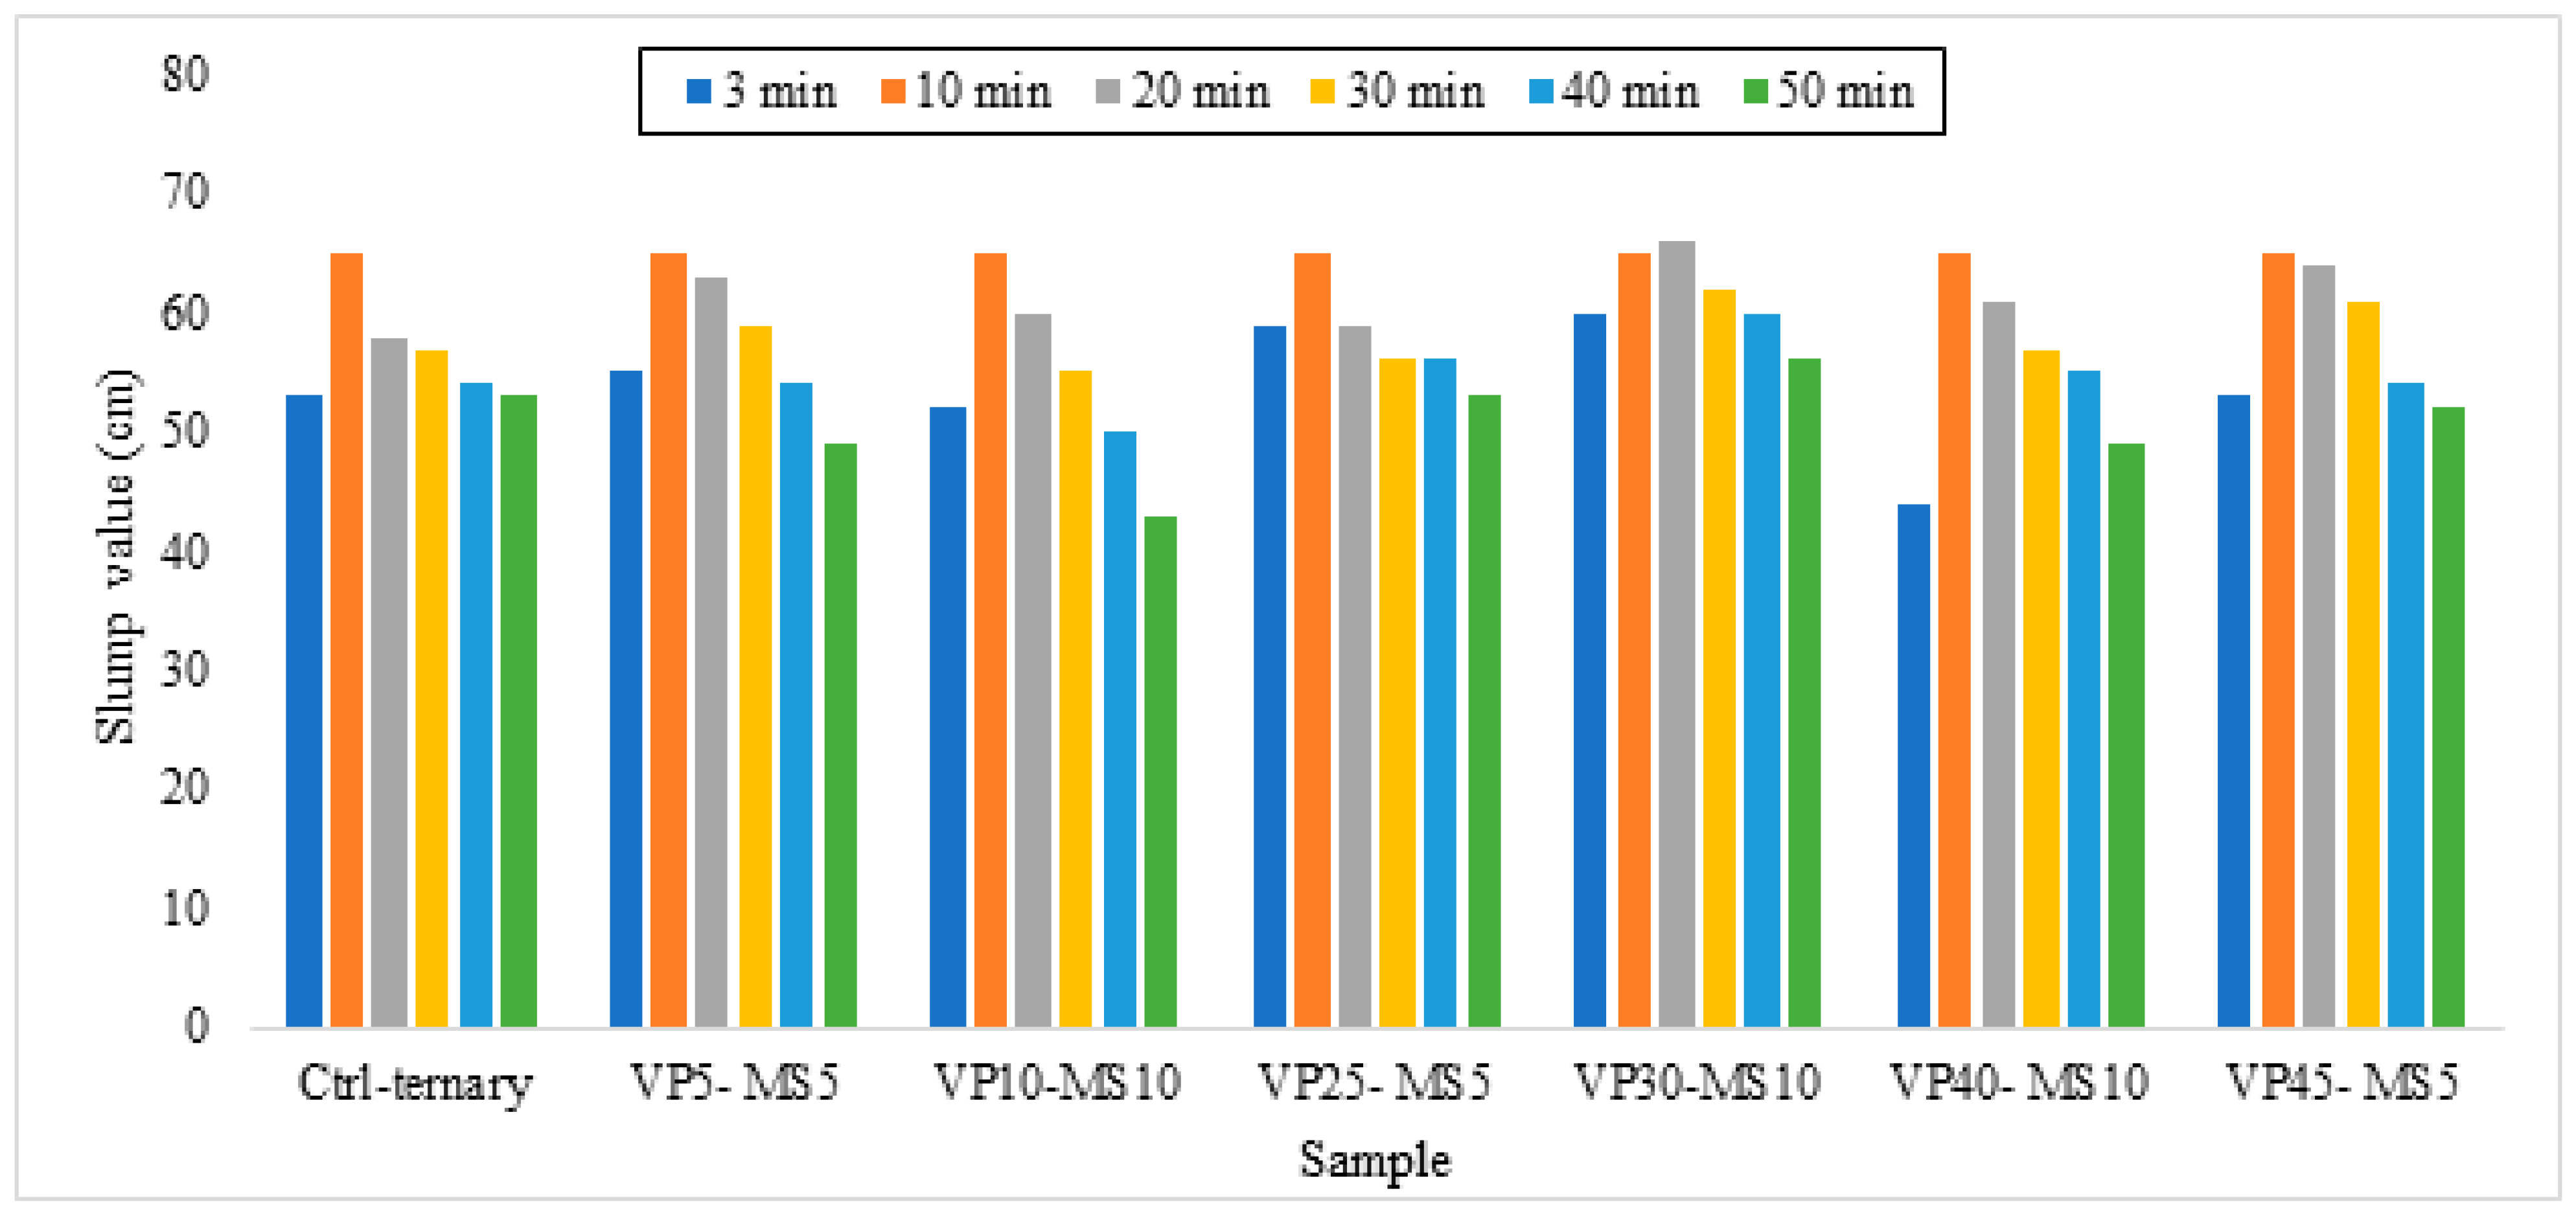
Based on Figure 6 and Figure 7, unlike GBFS and VP samples, FA shows the opposite result, while the increasing FA amount leads to increasing slump loss. This behaviour could be related to the fine particles of FA compared to the size of cement, VP, and GBFS particles, which provide more surface and lead to higher friction between particles, whereas, per Table 2, MS has the smoothest particles compared to the other powders, and the GBFS stands in second place. Moreover, regarding the ternary results, using VP and MS increased the slump up to 30 and 10%, respectively. MS has the smallest particle size among all the powders and a surface area of 30 m2.g−1. Therefore, it is expected that, by increasing the micro-silica incorporation, a further slump flow reduction will occur, as shown in Table 6. However, the results at 30 min show that the presence of VP provides a suitable capability for slump retention. Moreover, in the VP30-MS10 mixture, the slump retention was significantly enhanced compared to other SCC mixtures.

3.2. Mechanical Properties

Compressive Strength

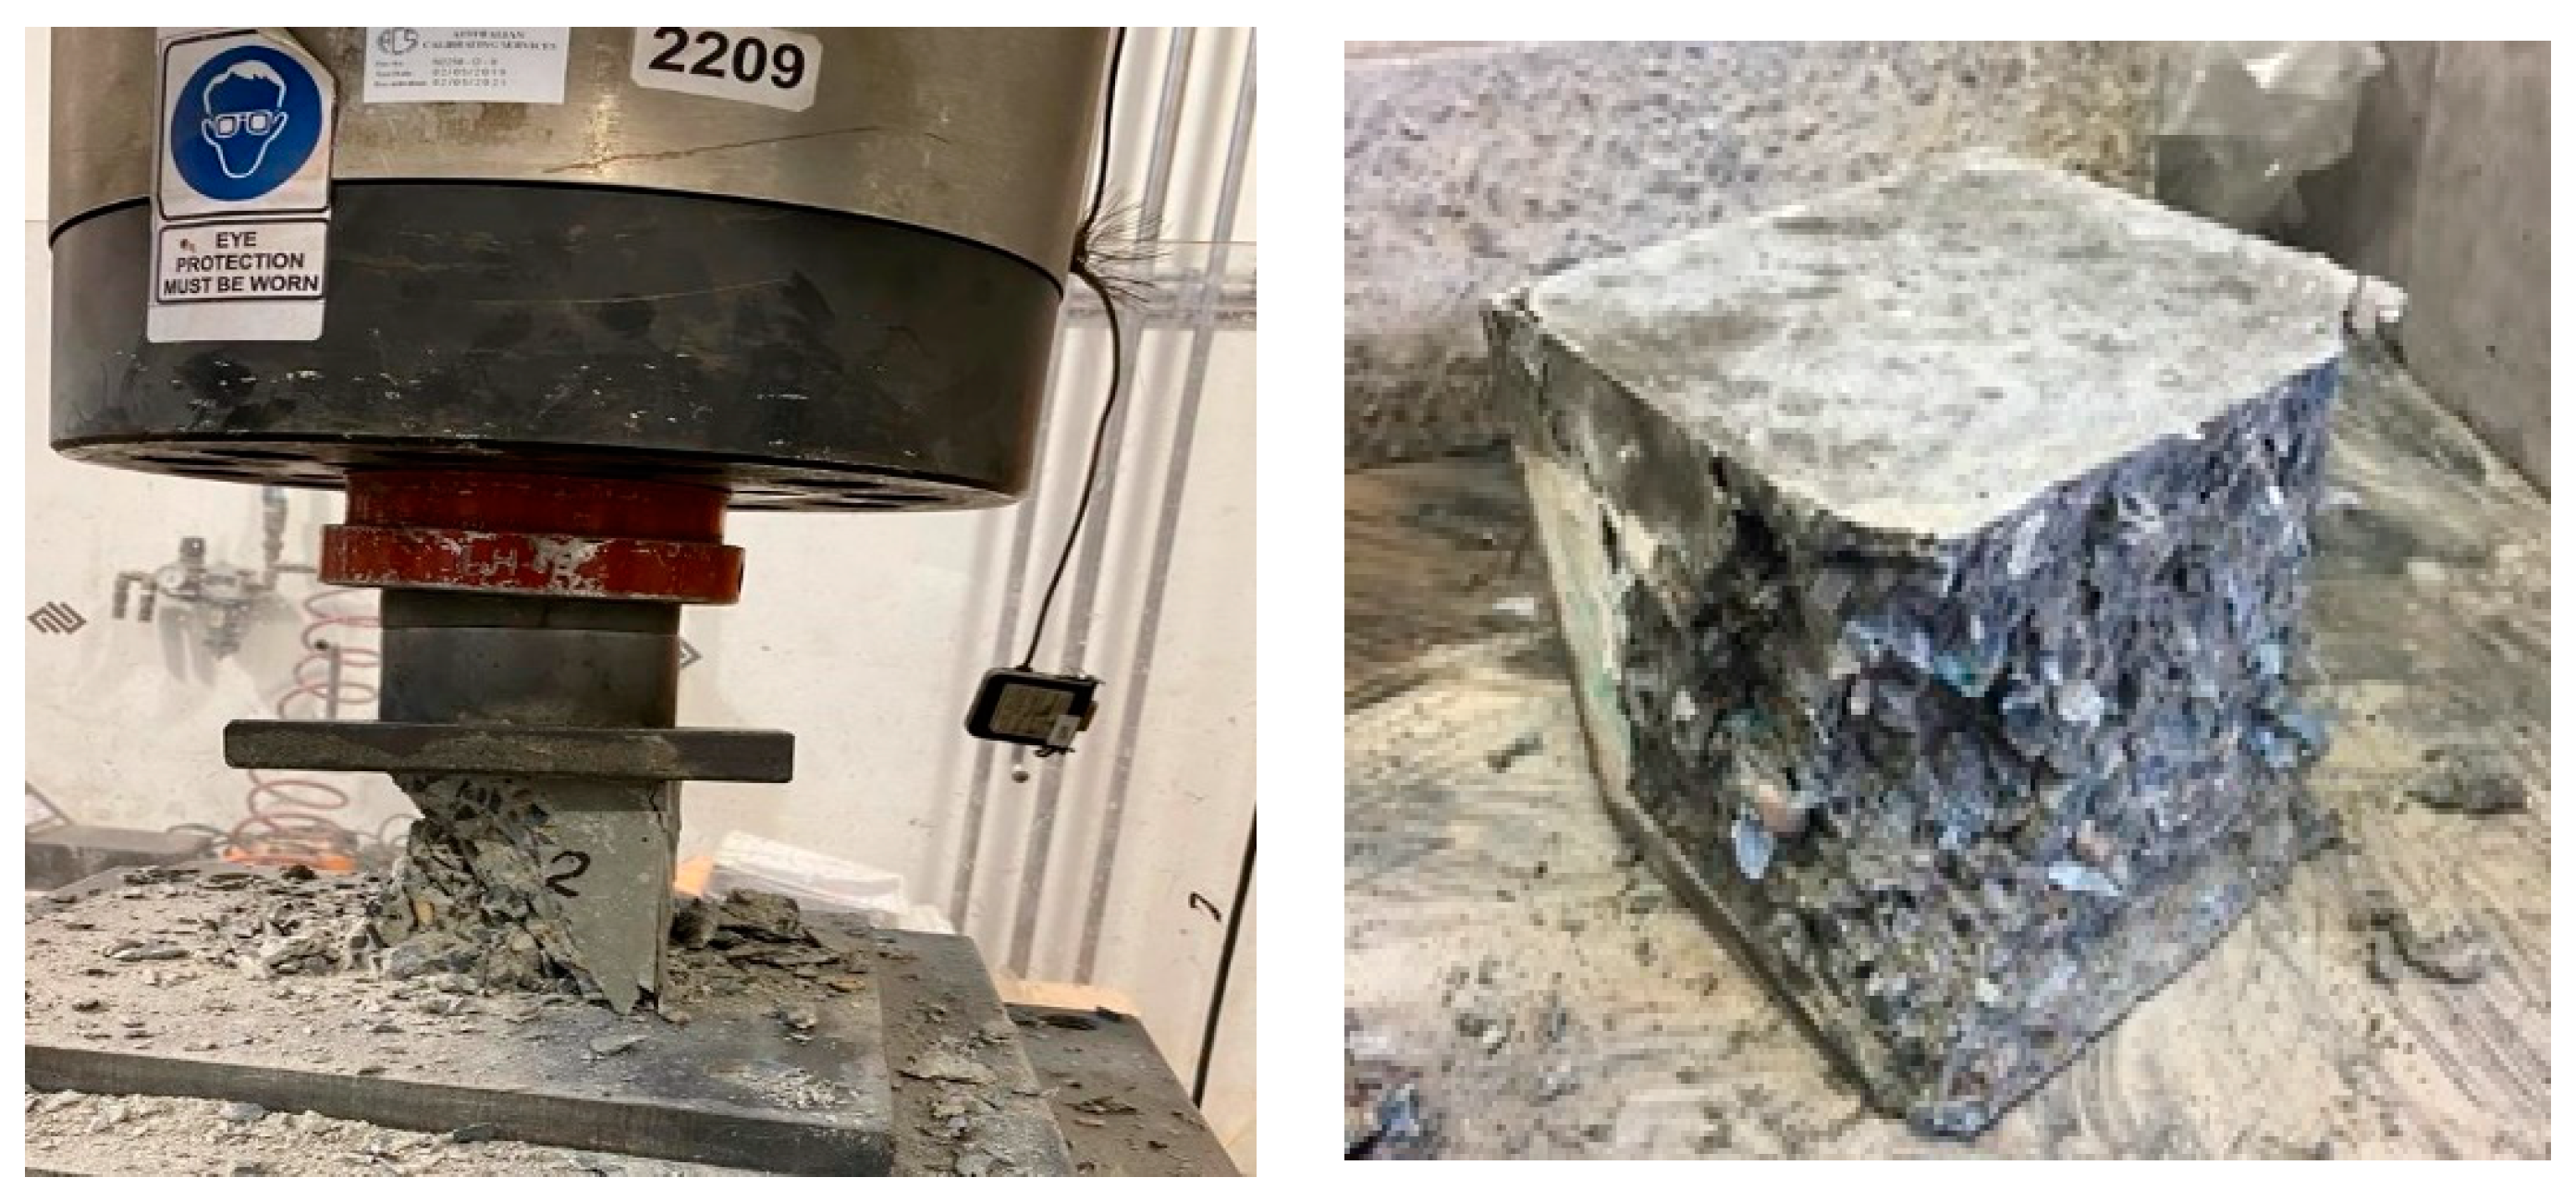
According to the ASTM C39 [55] recommendations, the compressive strength results were collected at 7, 28, and 90 days and tabulated in Table 7. Figure 8 shows a sample of crushed specimens in the compressive test.
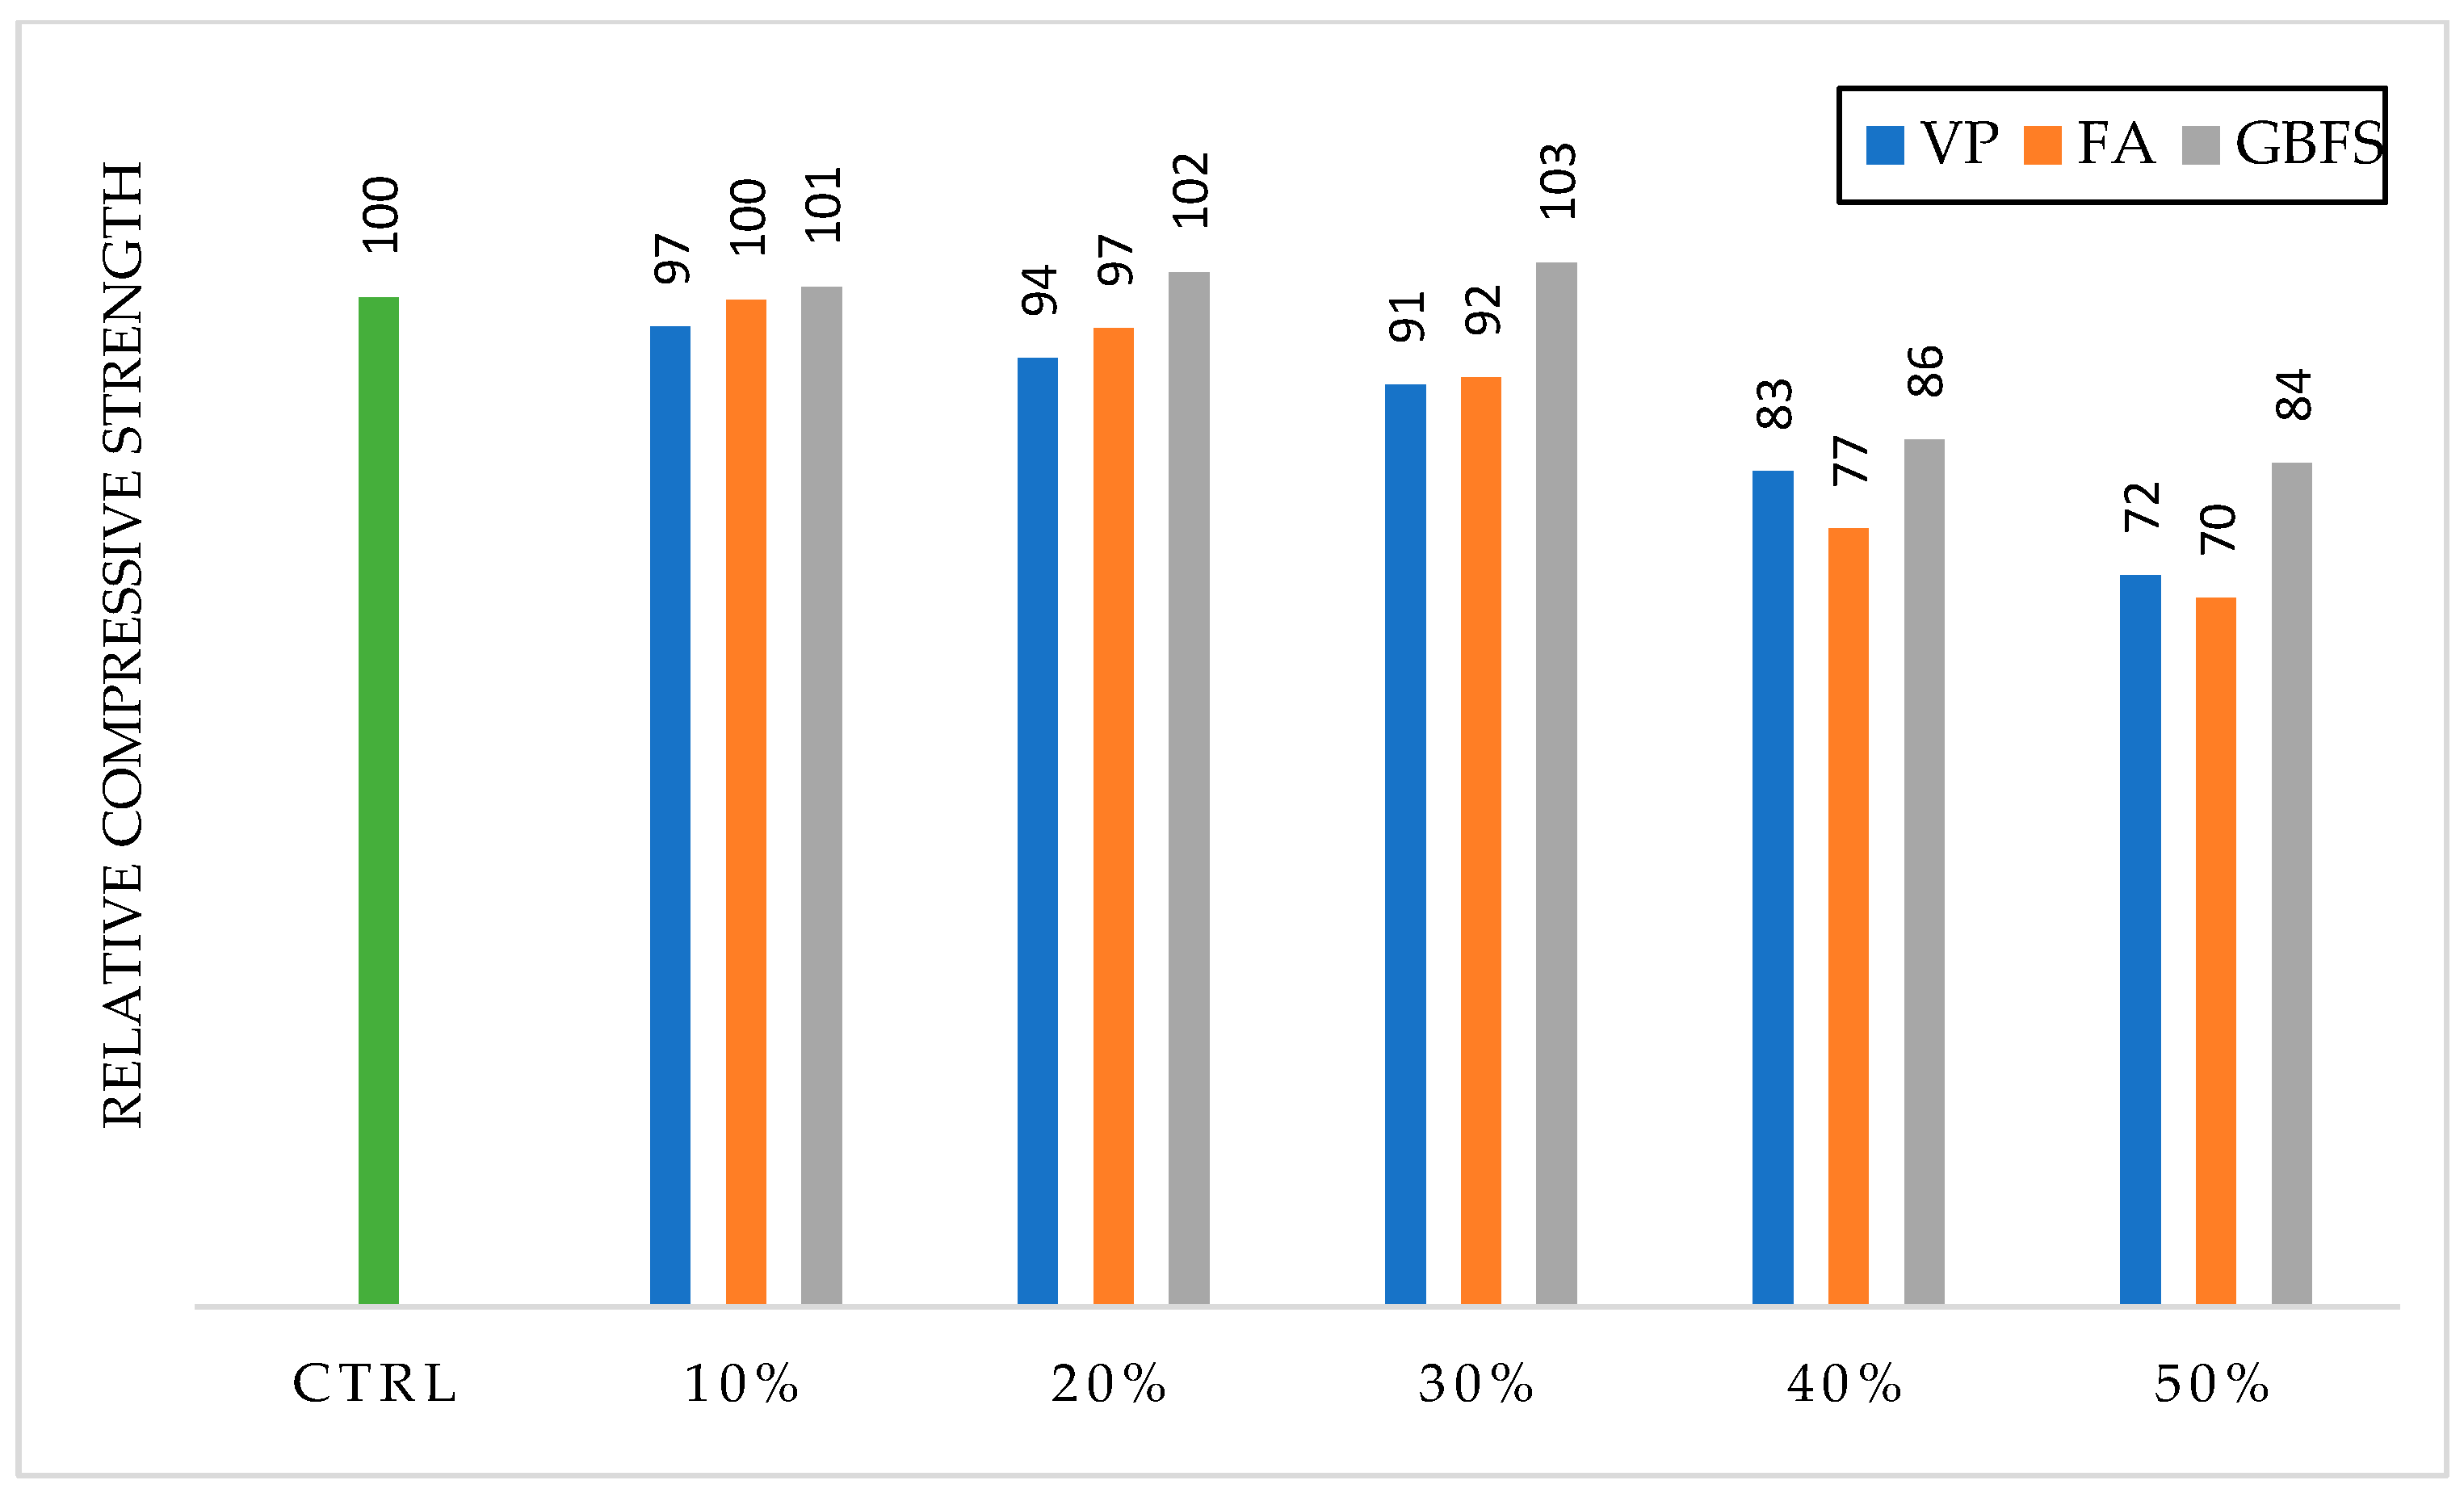
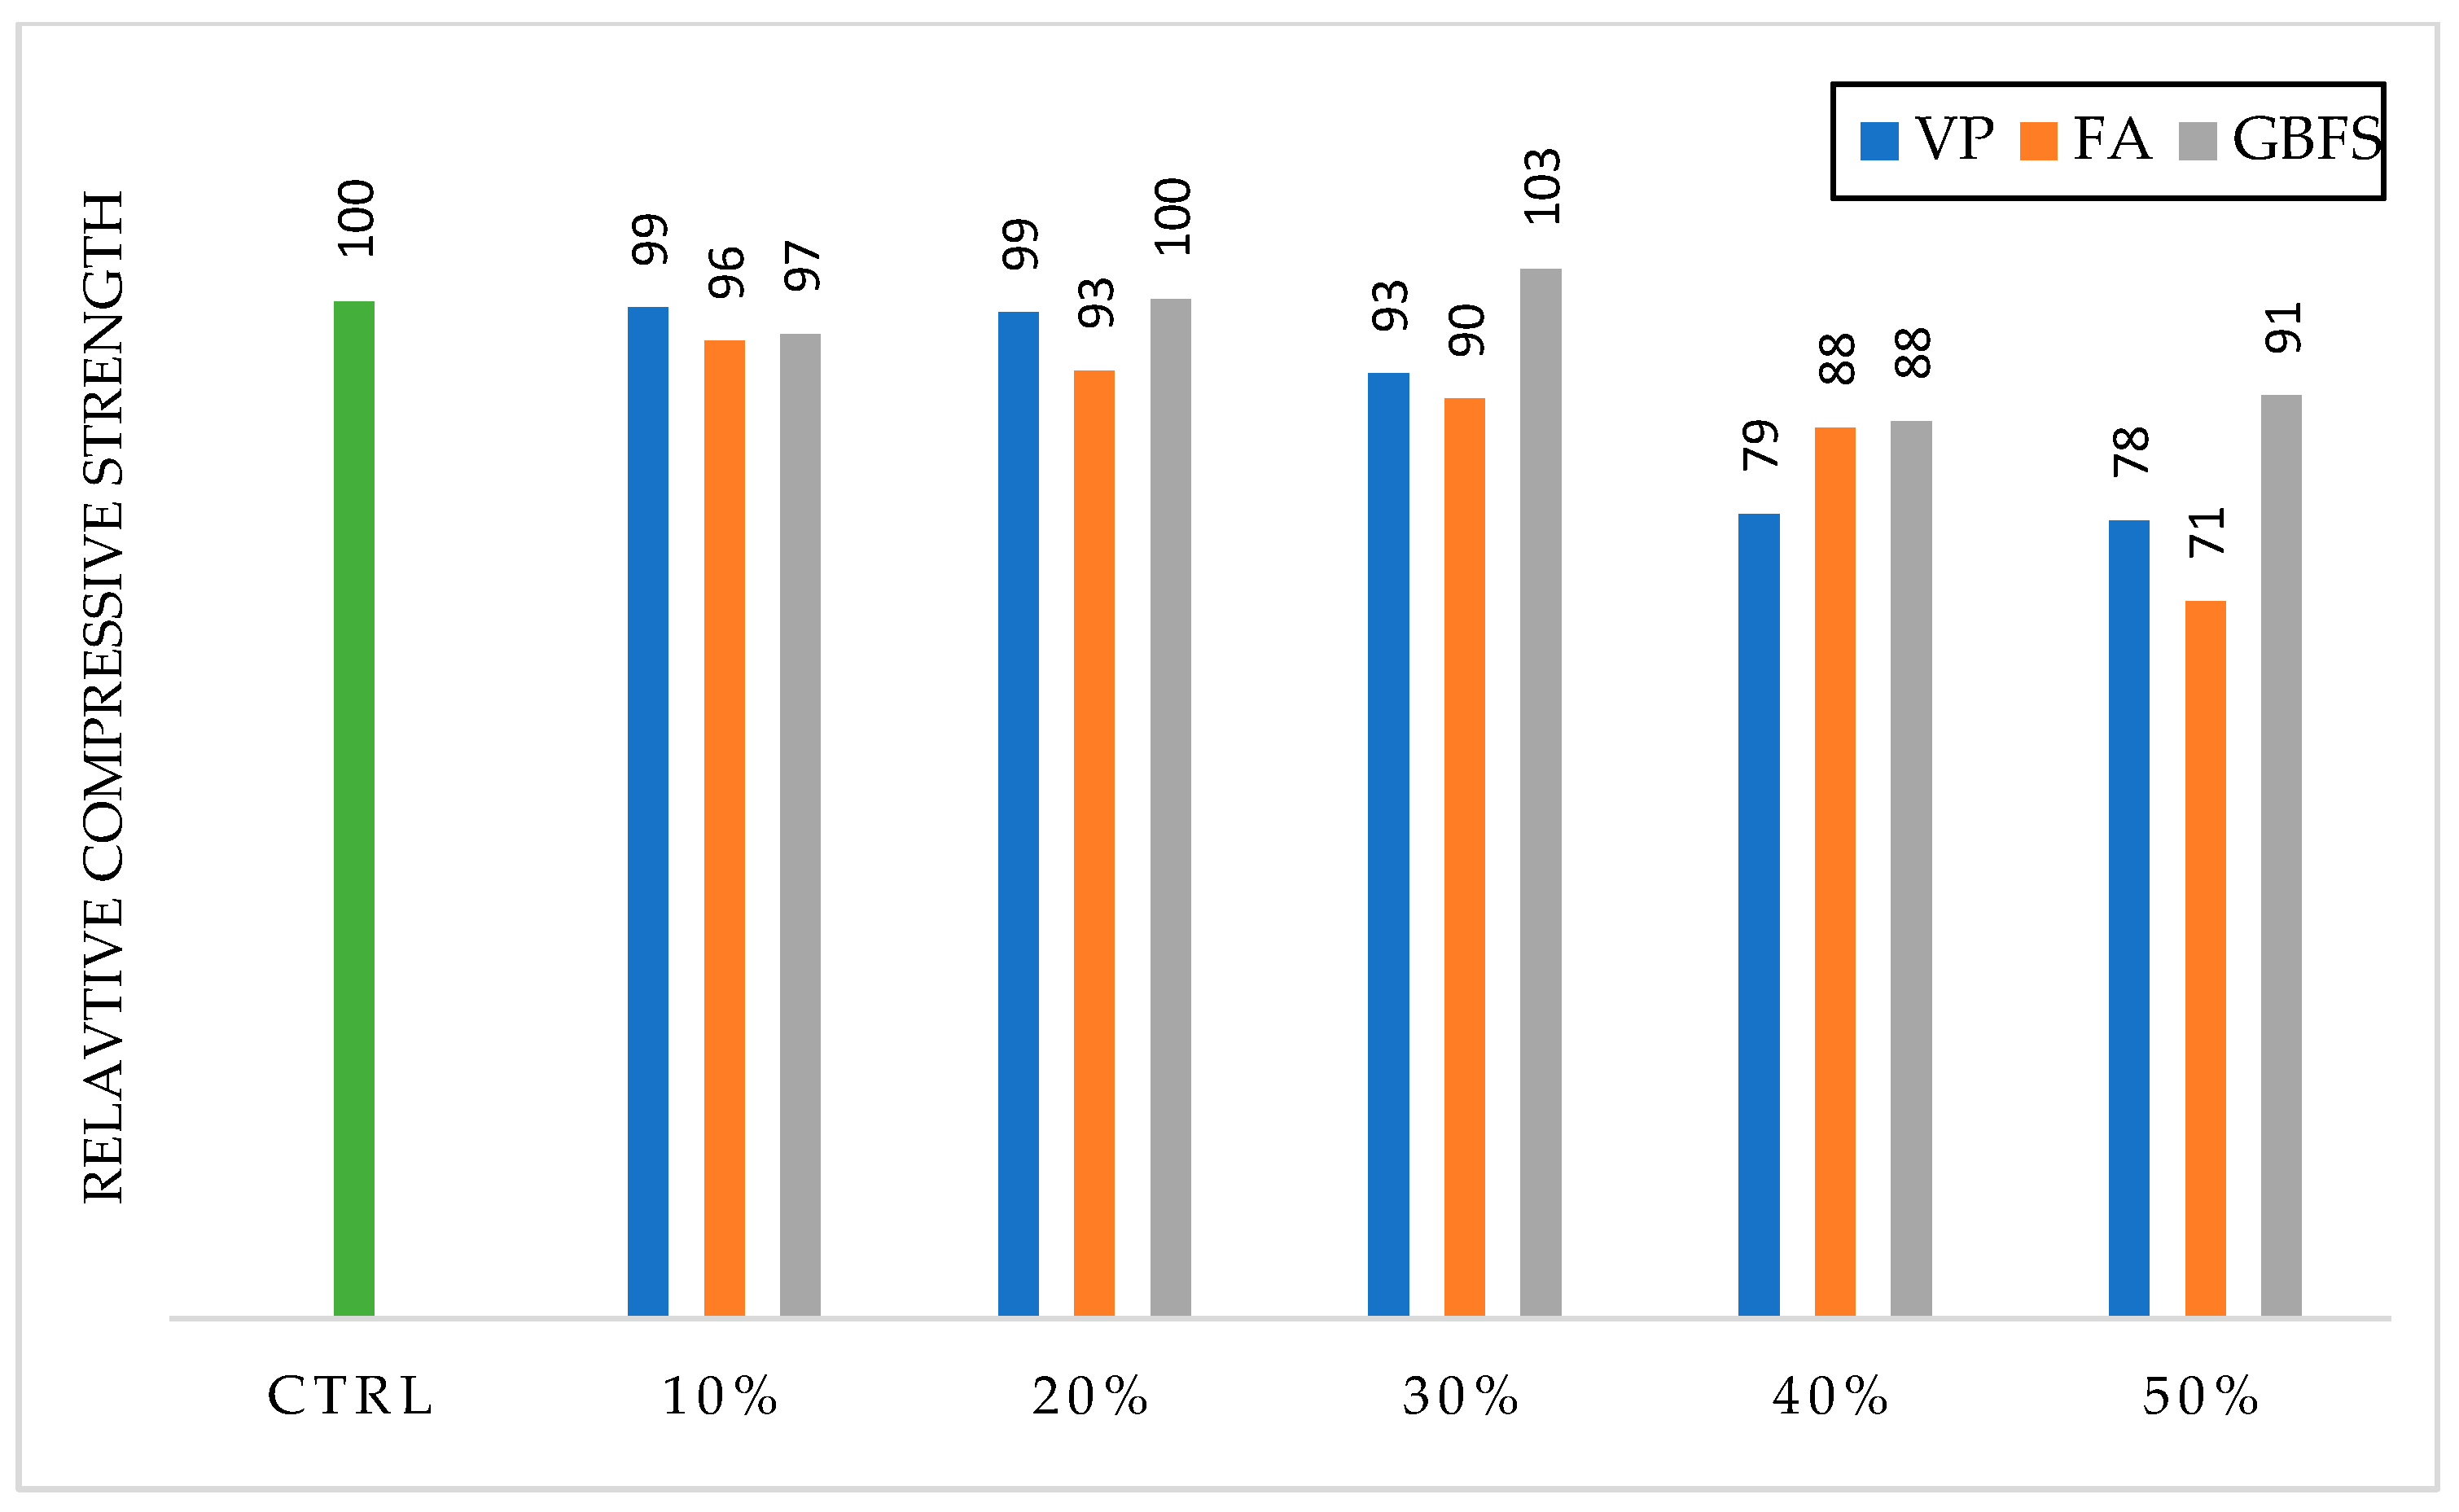
Generally, the quantity of SiO2 and Al2O3 are two determining chemical factors among cementitious materials which could directly affect the compressive strength. As per Table 2, FA has the most quantity of Al2O3 among other powders and MS contains the most SiO2. It is predictable that these powders have a significant improvement in compressive strength [56]. The results of FA in Figure 9 indicate that as the percentage of replacement increases, the compressive strength decreases. As shown in Figure 10, at 28 days, 30% of strength loss was induced by the replacement of FA between 0 and 50%. However, the reduction value is constant up to 30%, and then a sharp drop occurs. The main reason for this behavior is that the FA reacts with Ca(OH)2 in concrete paste and forms adherent components. The Ca(OH)2 is the byproduct of the reaction between C3S and H2O. As long as the amount of Ca(OH)2 is dependent on the cement value, increasing the replacement of fly ash will increase the mechanical properties of concrete and decrease the Ca(OH)2. Results show that Ca(OH)2 was sufficiently present in the concrete paste for up to 30% of the replacement. Meanwhile, 10% additional FA caused Ca(OH)2 to dissipate and thus resulted in a sudden reduction in compressive strength. It is expected that a higher strength will be observed in the binary mixtures by the pozzolanic reaction over time. From a chemical point of view, FA combines with the Ca(OH)2 produced by the hydration of cement to form additional C–S–H gel and aluminates, resulting in the improvement of the microstructure of hardened cement [35]. The compressive strength of binary mixtures in older ages (90 days) approaches its control specimen, which is clearly shown in Figure 11.
As discussed above, the compressive strength of binary mixtures is represented in Figure 9, Figure 10 and Figure 11. VP reduces the compressive strength with increasing replacement percentage, which is similar to the FA results. At the age of 90 days, no difference was observed between 0, 10, and 20% replacements. The same trend is also true for earlier age testing. Even a 30% replacement does not make a significant difference. Finally, the strength loss during the 50% replacement is about 22%, which is relatively less than the measured value for fly ash (30%). According to the results, VP operates more efficiently in developing concrete’s compressive strength than FA. Using pozzolans (except silica fume) will for the most part delay the hardening time of concrete unless they exhibit high adhesion properties in ways similar to cement. According to Cervantes and Roesler [57], using GGBFS ingredients as a cement substitute in concrete boosted the compressive and flexural strengths at 28 days. Karri et al. [58] evaluated concrete of different grades containing 30% to 50% GGBFS as a PC substitute, where the introduction of GGBFS as a cementitious ingredient in the mixture enhanced the split tensile, compressive, and flexural strengths of the cured concrete at 28 days. According to Raman and Krishnan [59], using 40–50% GGBFS as a cementitious material offered the highest compressive strength of the combination. Hossain’s and Erhan et al.’s [60,61] investigations, showed that VP used up to 50% of the cement at different amounts, while VP reduced the compressive strength of the concretes by up to 75% depending on the degree of VP substitution.
The delay in hardening can occur due to the pozzolanic activity not happening earlier than cement hydration reactions. Based on Figure 4, Figure 5 and Figure 6, the GBFS contribution to the binary mixes confirms the fact that GBFS is more closer to cement in its performance and thus has a higher compressive strength gain than VP and FA. The column chart in Figure 6 also shows that replacement percentages of 10, 20, and 30% are approximately equal to the control specimen and the value of compressive strength for the 50% mixture was reduced by 9%, which is much lower than the obtained results for VP and FA powders by 22% and 30%, respectively.
The results of the 90-day compressive strength tests were converted to relative percentages to compare all 3 groups, as illustrated in Figure 11. All control specimens were considered 100%, and other designs were assigned a proportional ratio to their control specimen. In this comparison, GBFS has the most significant effect on compressive strength development. The mentioned benefit should be due to the larger surface area of GBFS particles, which provide more space for OH- and alkaline ions to penetrate the pores of the paste [62]. Another reason for the strength development in binaries of GBFS is the high amount of SiO2 and CaO as its constituents, and as long as these two components are responsible for the mechanical properties of the concrete paste, greater compressive strength is observed when compared to VP and FA [5]. The high percentage of replacements resulting from binaries indicates that additional time is required to increase compressive strength, especially at earlier ages. Therefore, in this study, the ternary of VP with micro-silica was investigated in six different ratios, in which micro-silica will act as an enhancer for the compressive strength and durability of concrete. The mixture designs ratio and results of the 3-, 28-, and 90-day compressive strength tests are shown in Table 7 and Figure 12.
Several studies indicate that the growth of compressive strength can be accelerated by 2.5–10% replacement of micro-silica [4,5,31]. Moreover, as per the findings of Chang et al. [63], when the replacement of GGBFS grew from 0% to 20%, GGBFS generated a pozzolanic response that raised the compactness of the sample’s interior body over that of the control group. The resistivity was greater when 20% GGBFS was introduced late in the time, followed by the 10% GGBFS group.
At early ages, the highest and lowest strengths are found in the control and C50-MS5-VP45 mixtures, respectively. At 28 days, C50-MS5-VP45, C70-MS5-VP25, and C90-MS5-VP5 are close to the control strength; however, C50-MS10-VP40 strength is much higher than the control strength. Finally, at 90 days, the control mixture had the lowest strength, and the C50-MS10-VP40 mixture represented the most strength. The more lime content in MS improved the ability of cohesion among other powders. [22]. Furthermore, strengthening the weak layer between paste and aggregates can be attributed to the filling role of MS granules and the effect of MS [49].
In contrast, according to the results, a high replacement of VP reduces compressive strength under 90 days of age. Thus, the result of the ternary combination in the early ages indicates that the micro-silica will not be able to overcome the VP reducing effect, and the strength of all specimens is less than the control specimen strength. Over time, and with the availability of more lime, micro-silica works more efficiently, and reinforcing the interfacial transition zone (ITZ) layer increases the compressive strength of all specimens to be higher than control ones [7]. This resistance development is quite desirable to the authors and completely satisfies the purpose of this study. Small amounts of micro-silica could be combined with high percentages of VP, and as the results confirm, the compressive strength is at an acceptable level.

3.3. Water Absorption

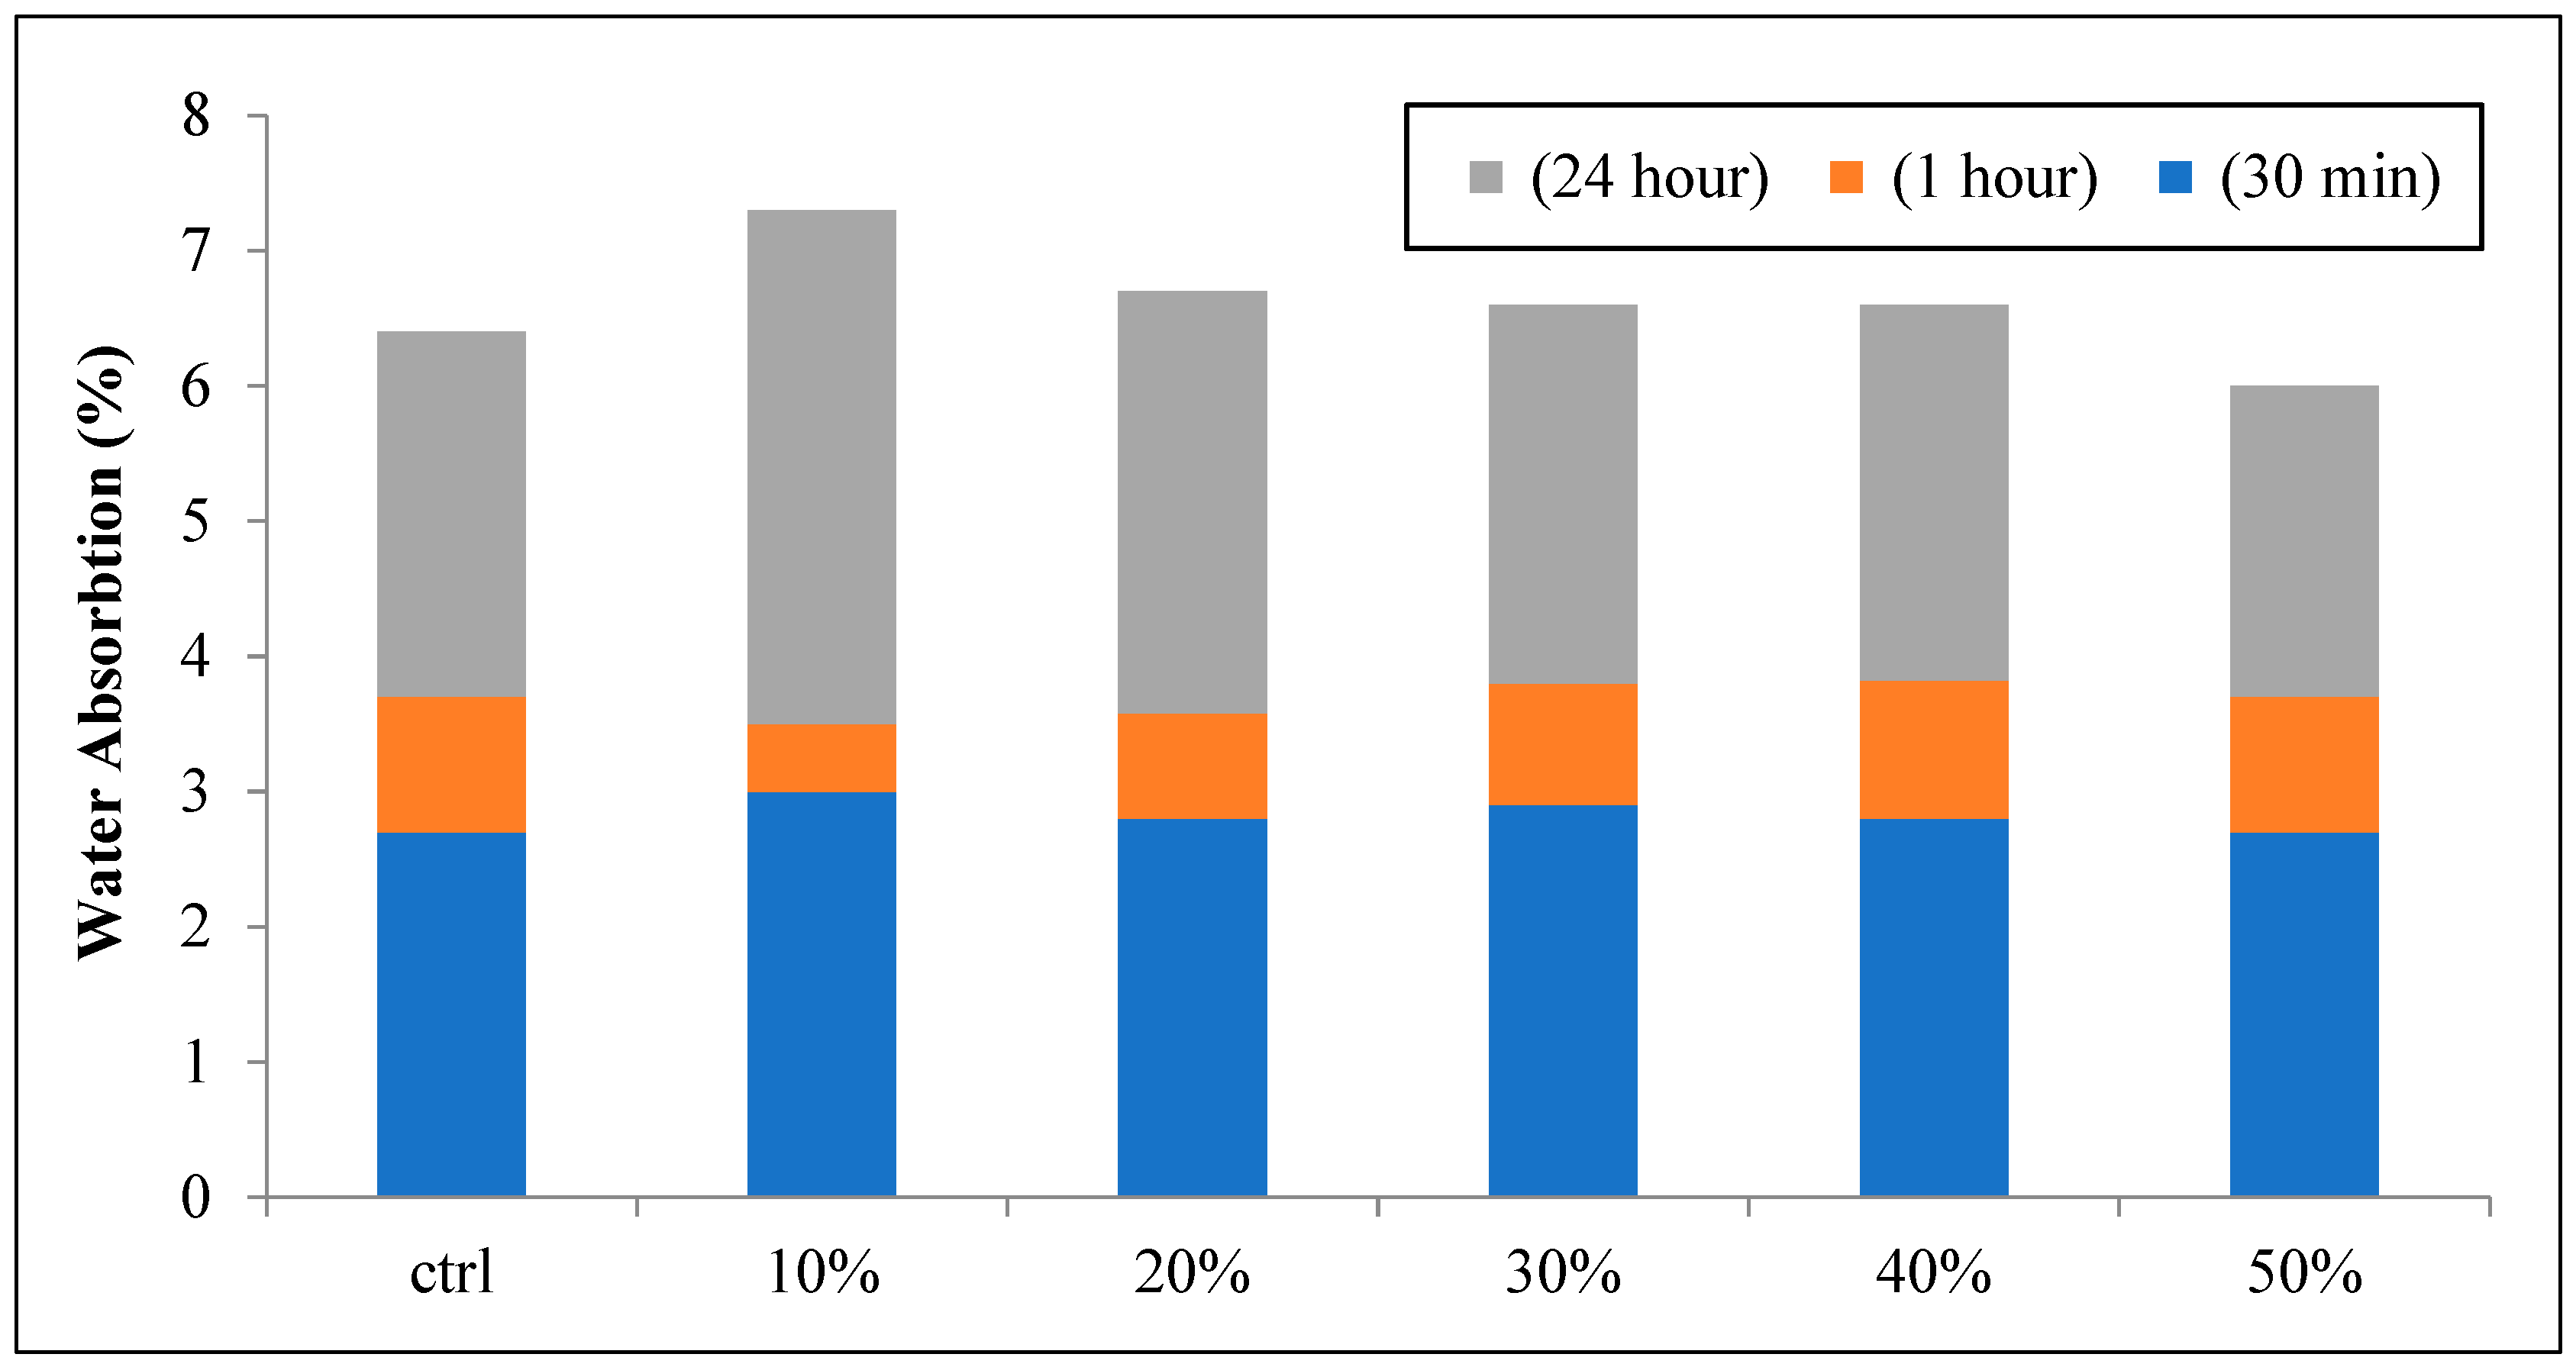
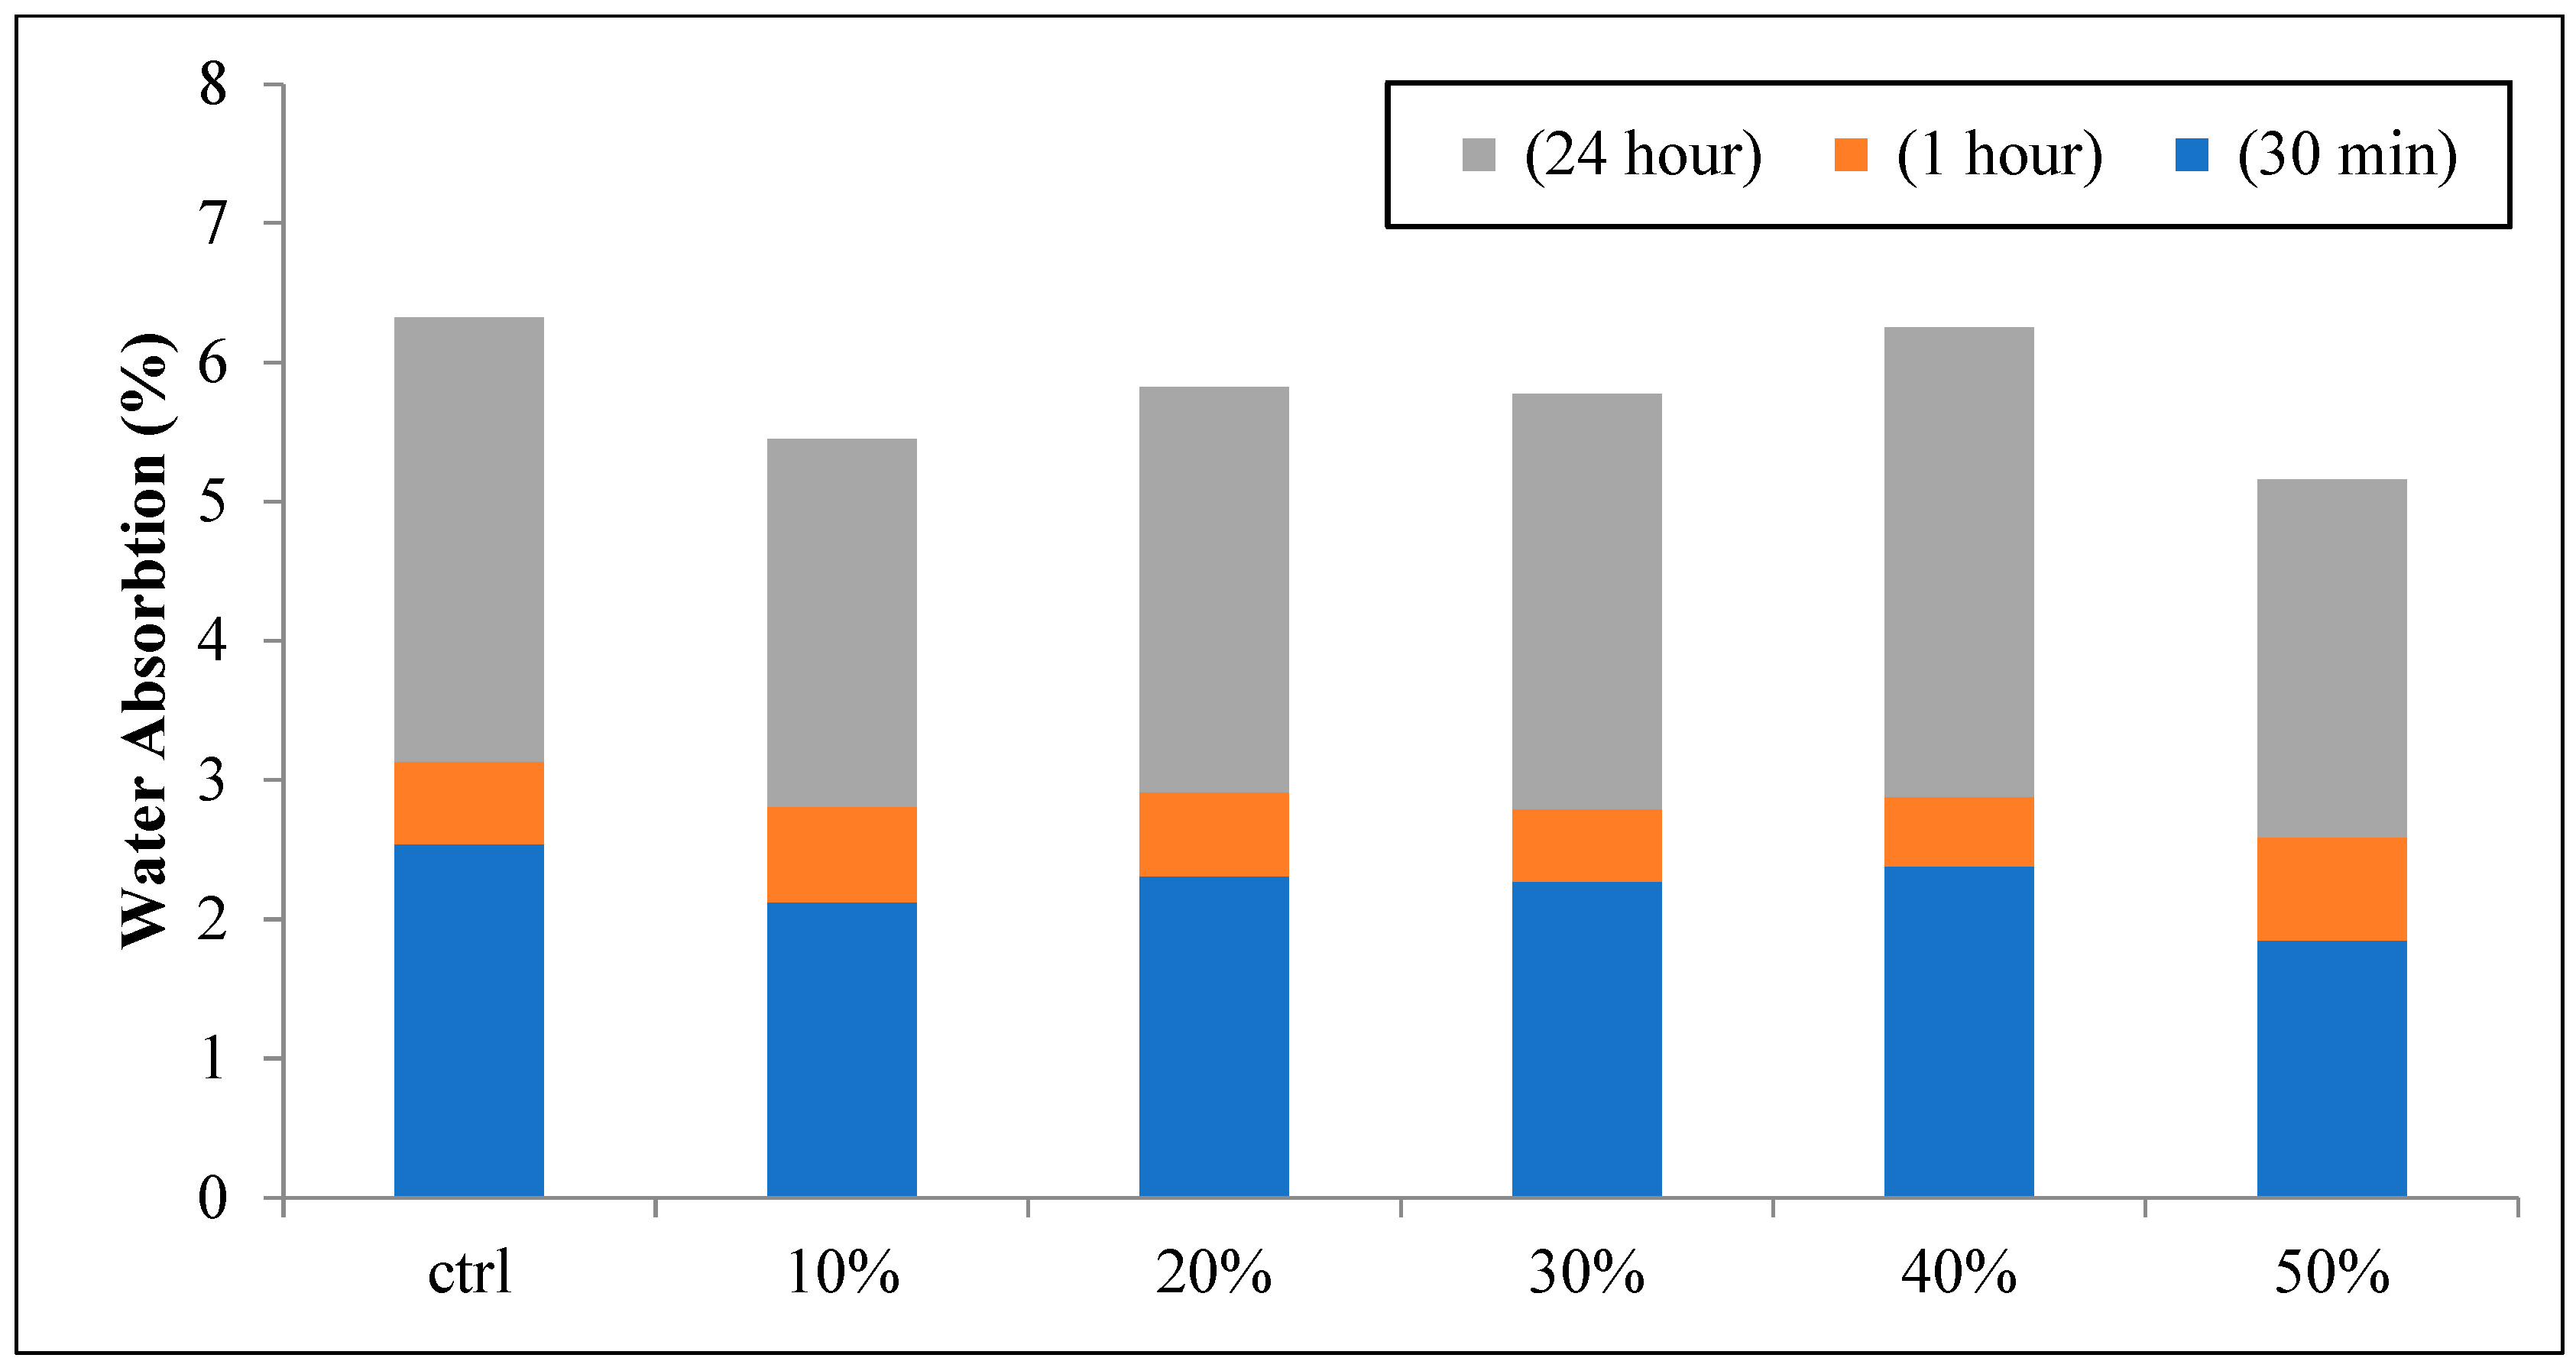
The water absorption values for VP, GGBFS, and FA mixtures between 10% to 50% addition levels during 30 min, 1 h, and 24 h are shown in Figure 13, Figure 14, and Figure 15, respectively. It seems that mixtures with lower VP (10%) increased their water absorption, and by adding VP up to 50% the water absorption slightly decreased. It appears that the addition of the VP content increases the impermeability of the concrete. The water absorption results for VP and GGBFS mixtures as partial cement replacement in SCCG concrete with 50% content are lower. These results are shown in Figure 13 and Figure 14. The final results showed diminished water absorption compared to the control mixture, which varied between 6%, and 5.2%, respectively.
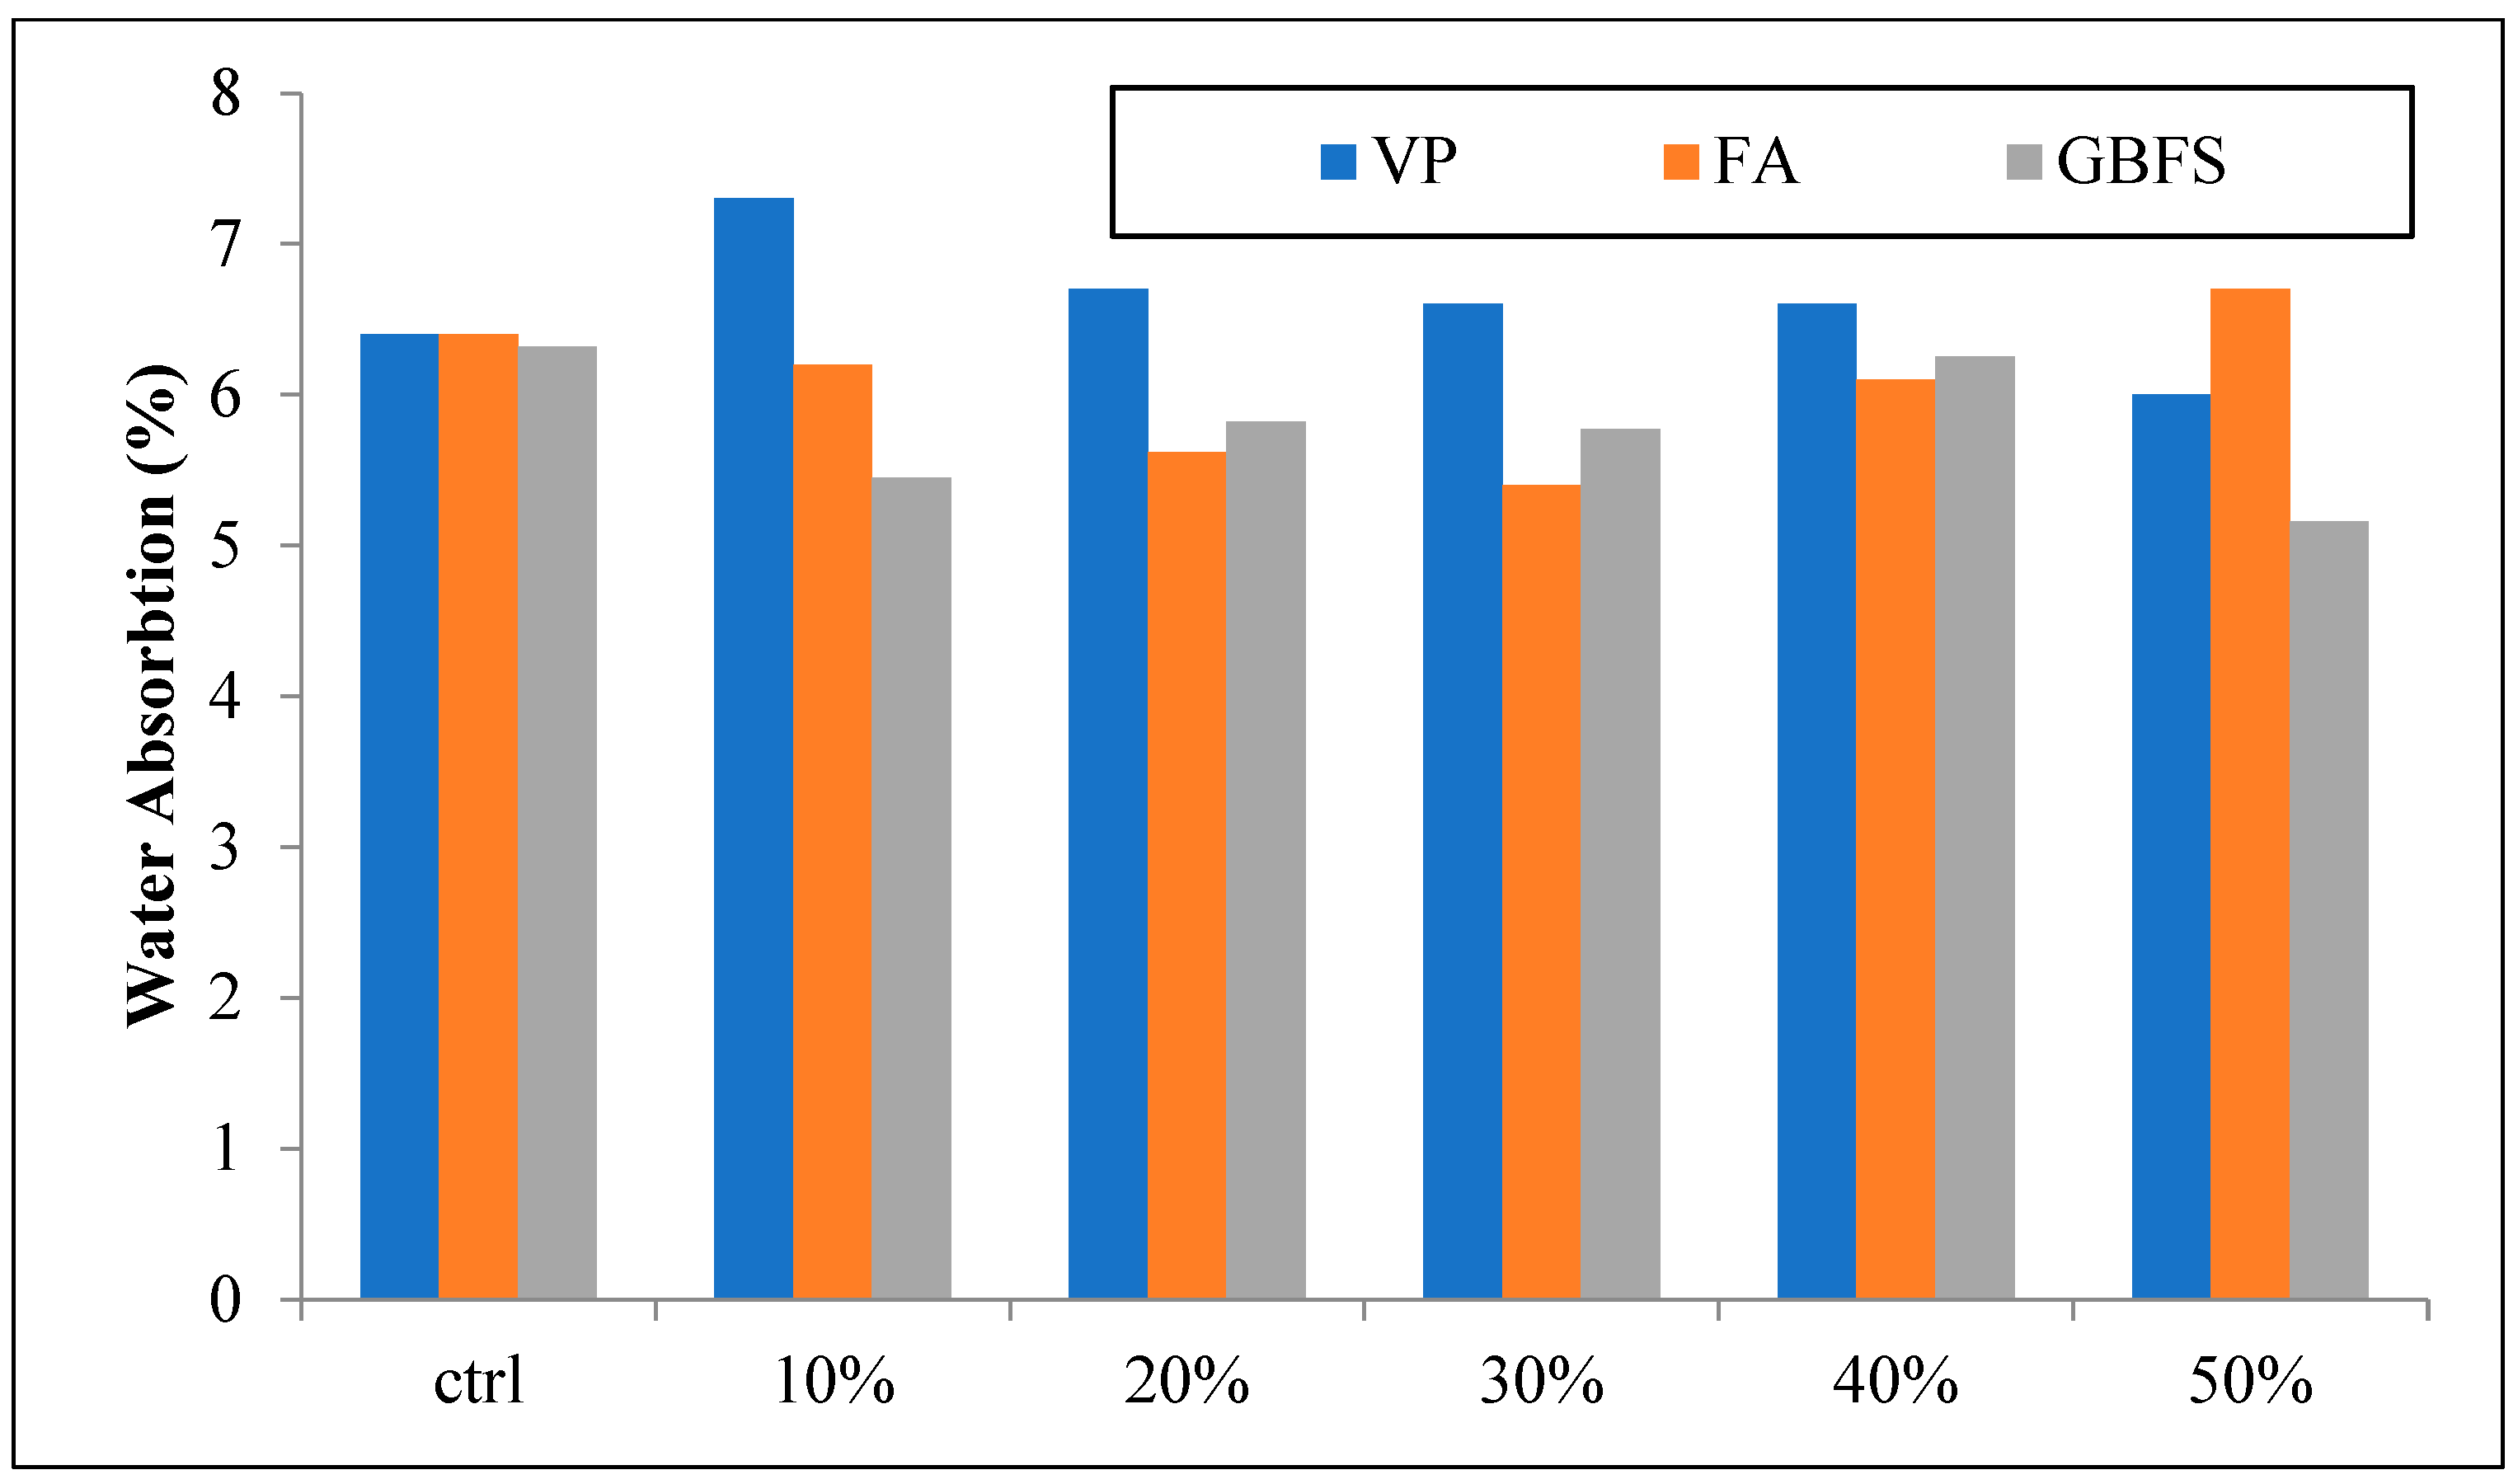
The result of FA mixtures can be seen in Figure 15. The range of water absorption values slightly increase in all SCC mixtures with increasing FA content up to 50%, which measured 7.8% in comparison with the control mixture that measured 7.2% at 24 h. Figure 16 shows the comparative column chart of 24 h water absorption for VP, GBFS, and FA mixtures. The results indicate that the mixtures containing 10% VP achieved the highest water absorption and the lowest water absorption belongs to 50% of GGBFS. In the meantime, the FA mixtures have the most water absorption changes compared to the control mixture.
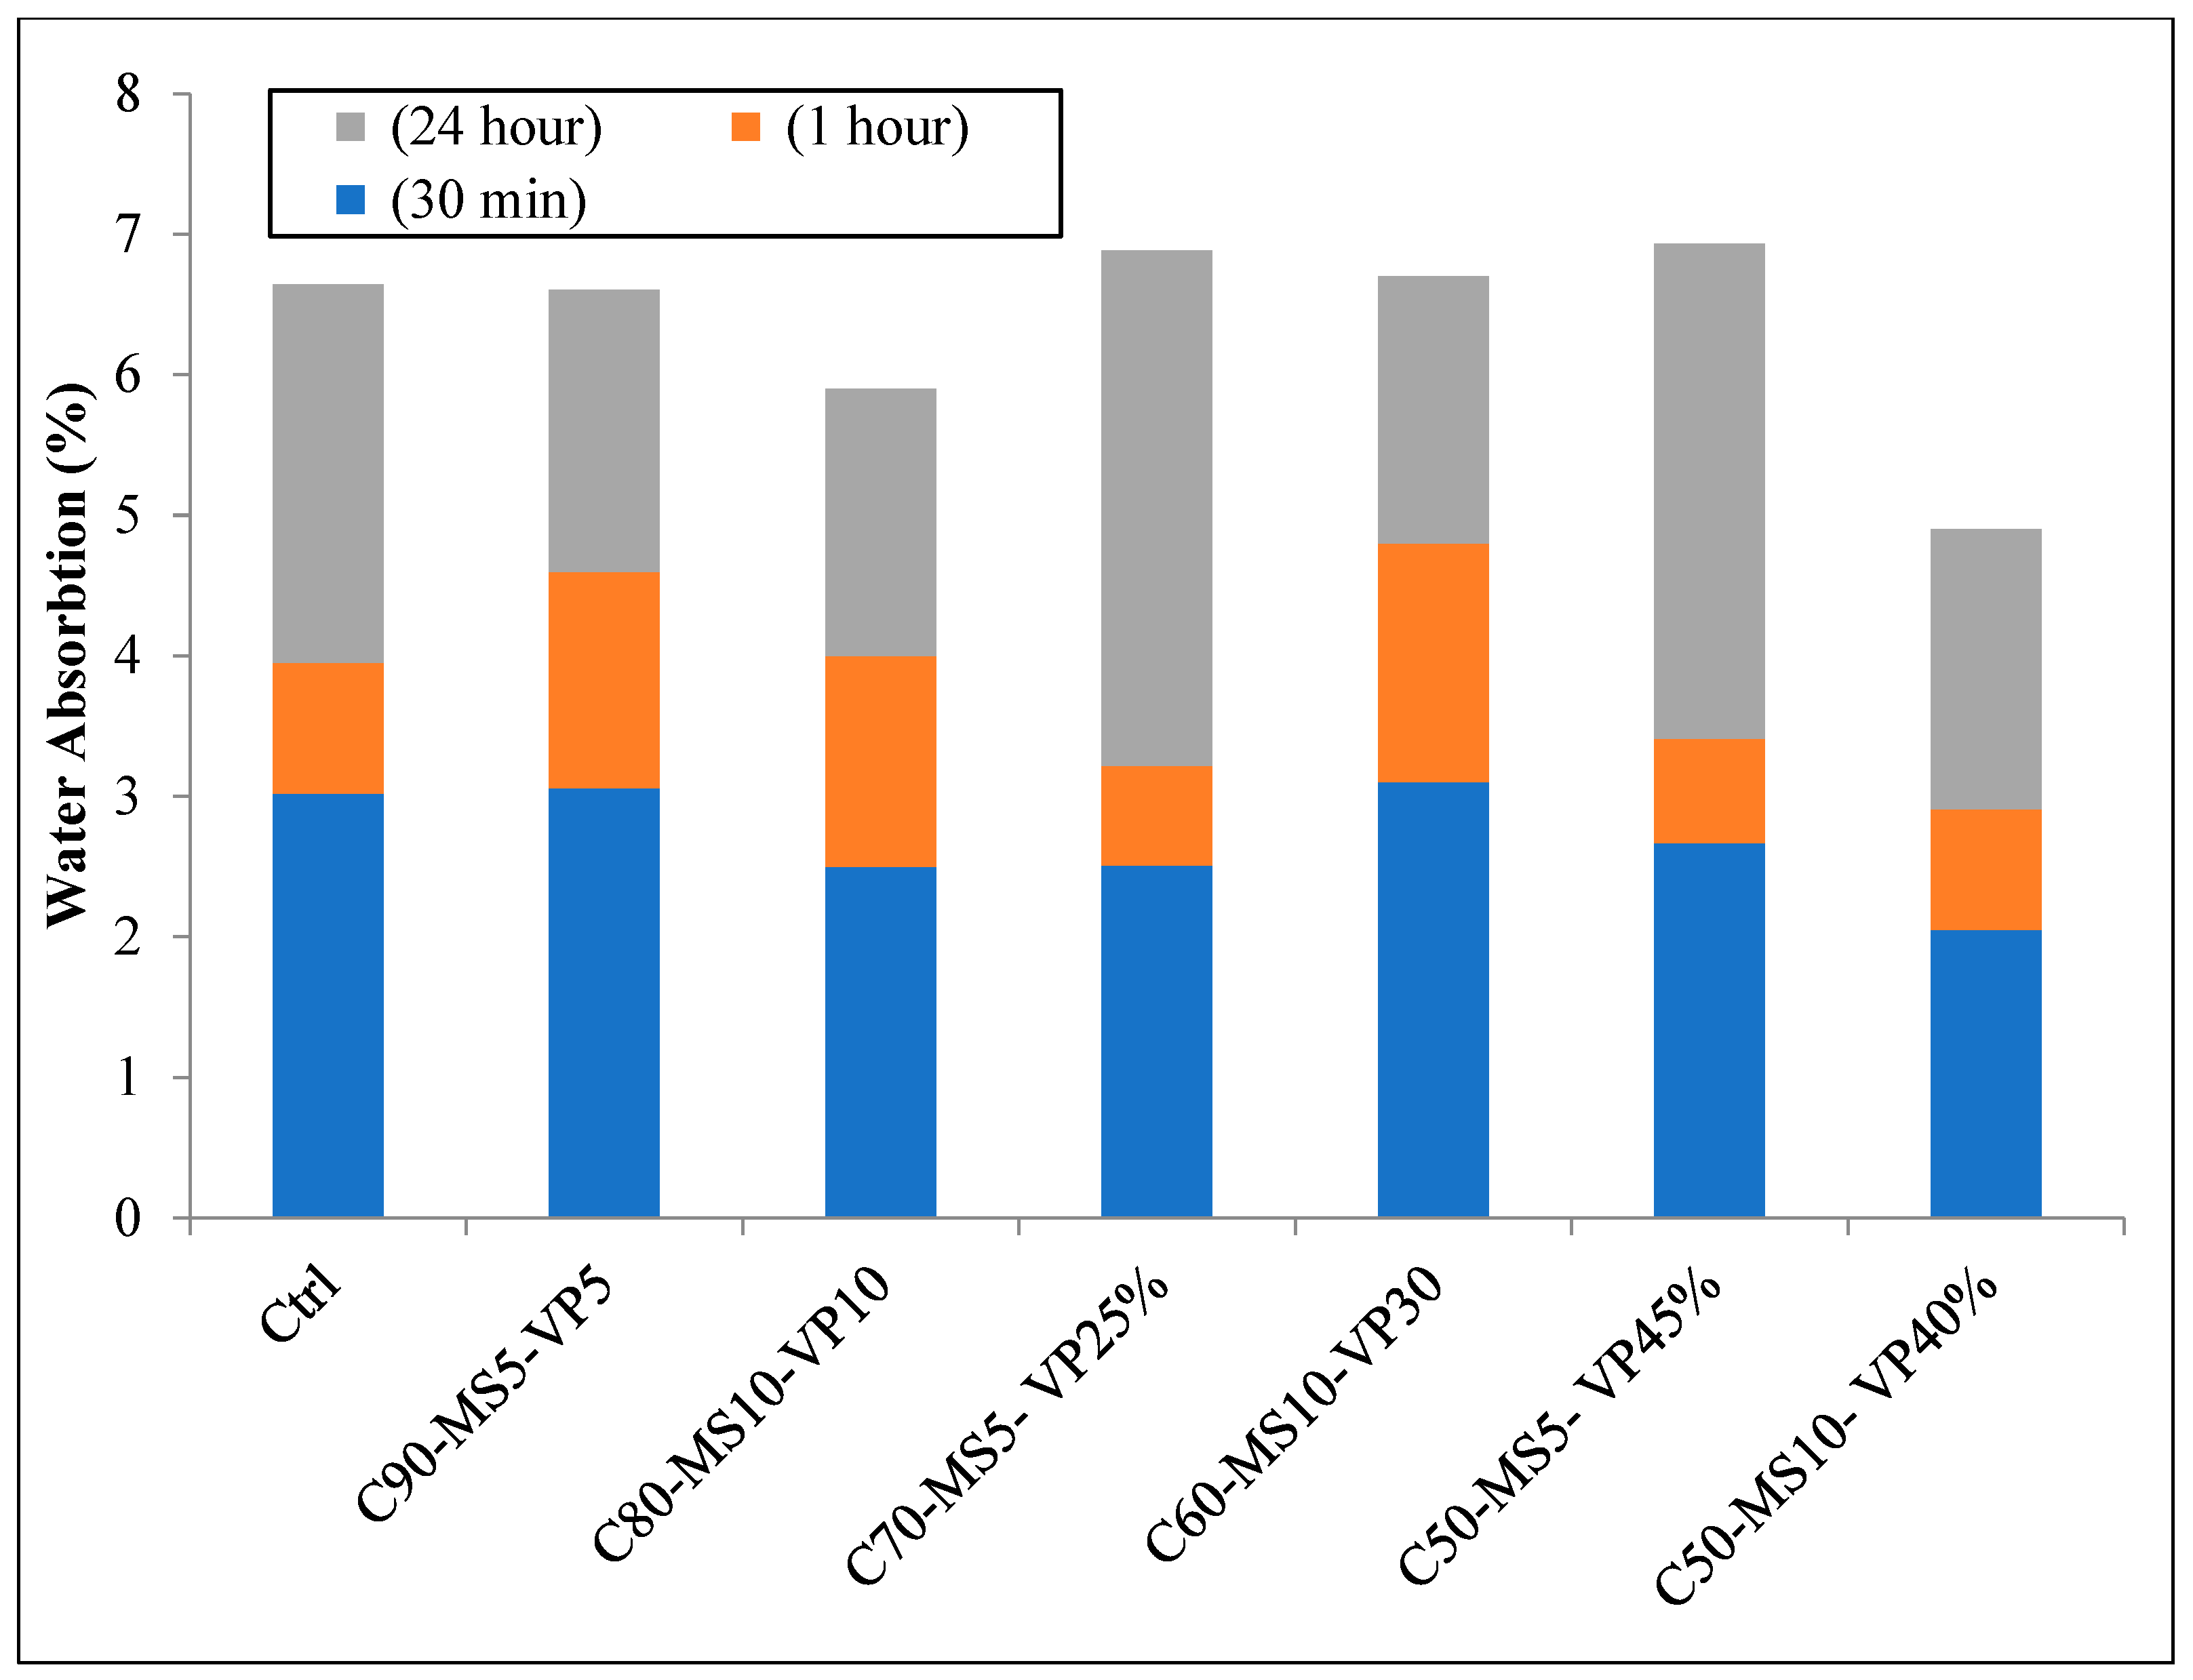
The water absorption results of the ternary samples are presented in Figure 17, which show a significant improvement in the presence of MS content. The incorporation of VP and MS as a part of cement substitution in SCG concrete also reduced water absorption. Based on previous findings, the water absorption percentage in SCC with GGBFS is enhanced from 0% to 50% in the durability attributes [64]. The most remarkable lowering was observed in C50-MS10-VP40, which revealed an almost 4.9% reduction in the water absorption compared to the control mixture. Since the water absorption test generally demonstrates the volume of the voids in cement-based materials, it can be deduced that increasing the content of VP and GBFS up to 50% leads to a diminution of the volume of the voids in this ternary combination. Consequently, the water absorption will decrease. The measured water absorption reduction could also affect the influence of pozzolanic reactions through which Ca(OH)2 is used up and generates more C–S–H, resulting in a more densified and compressed microstructure [65]. It is an effective way to improve the durability properties of concrete.

3.4. Electerical Resistance

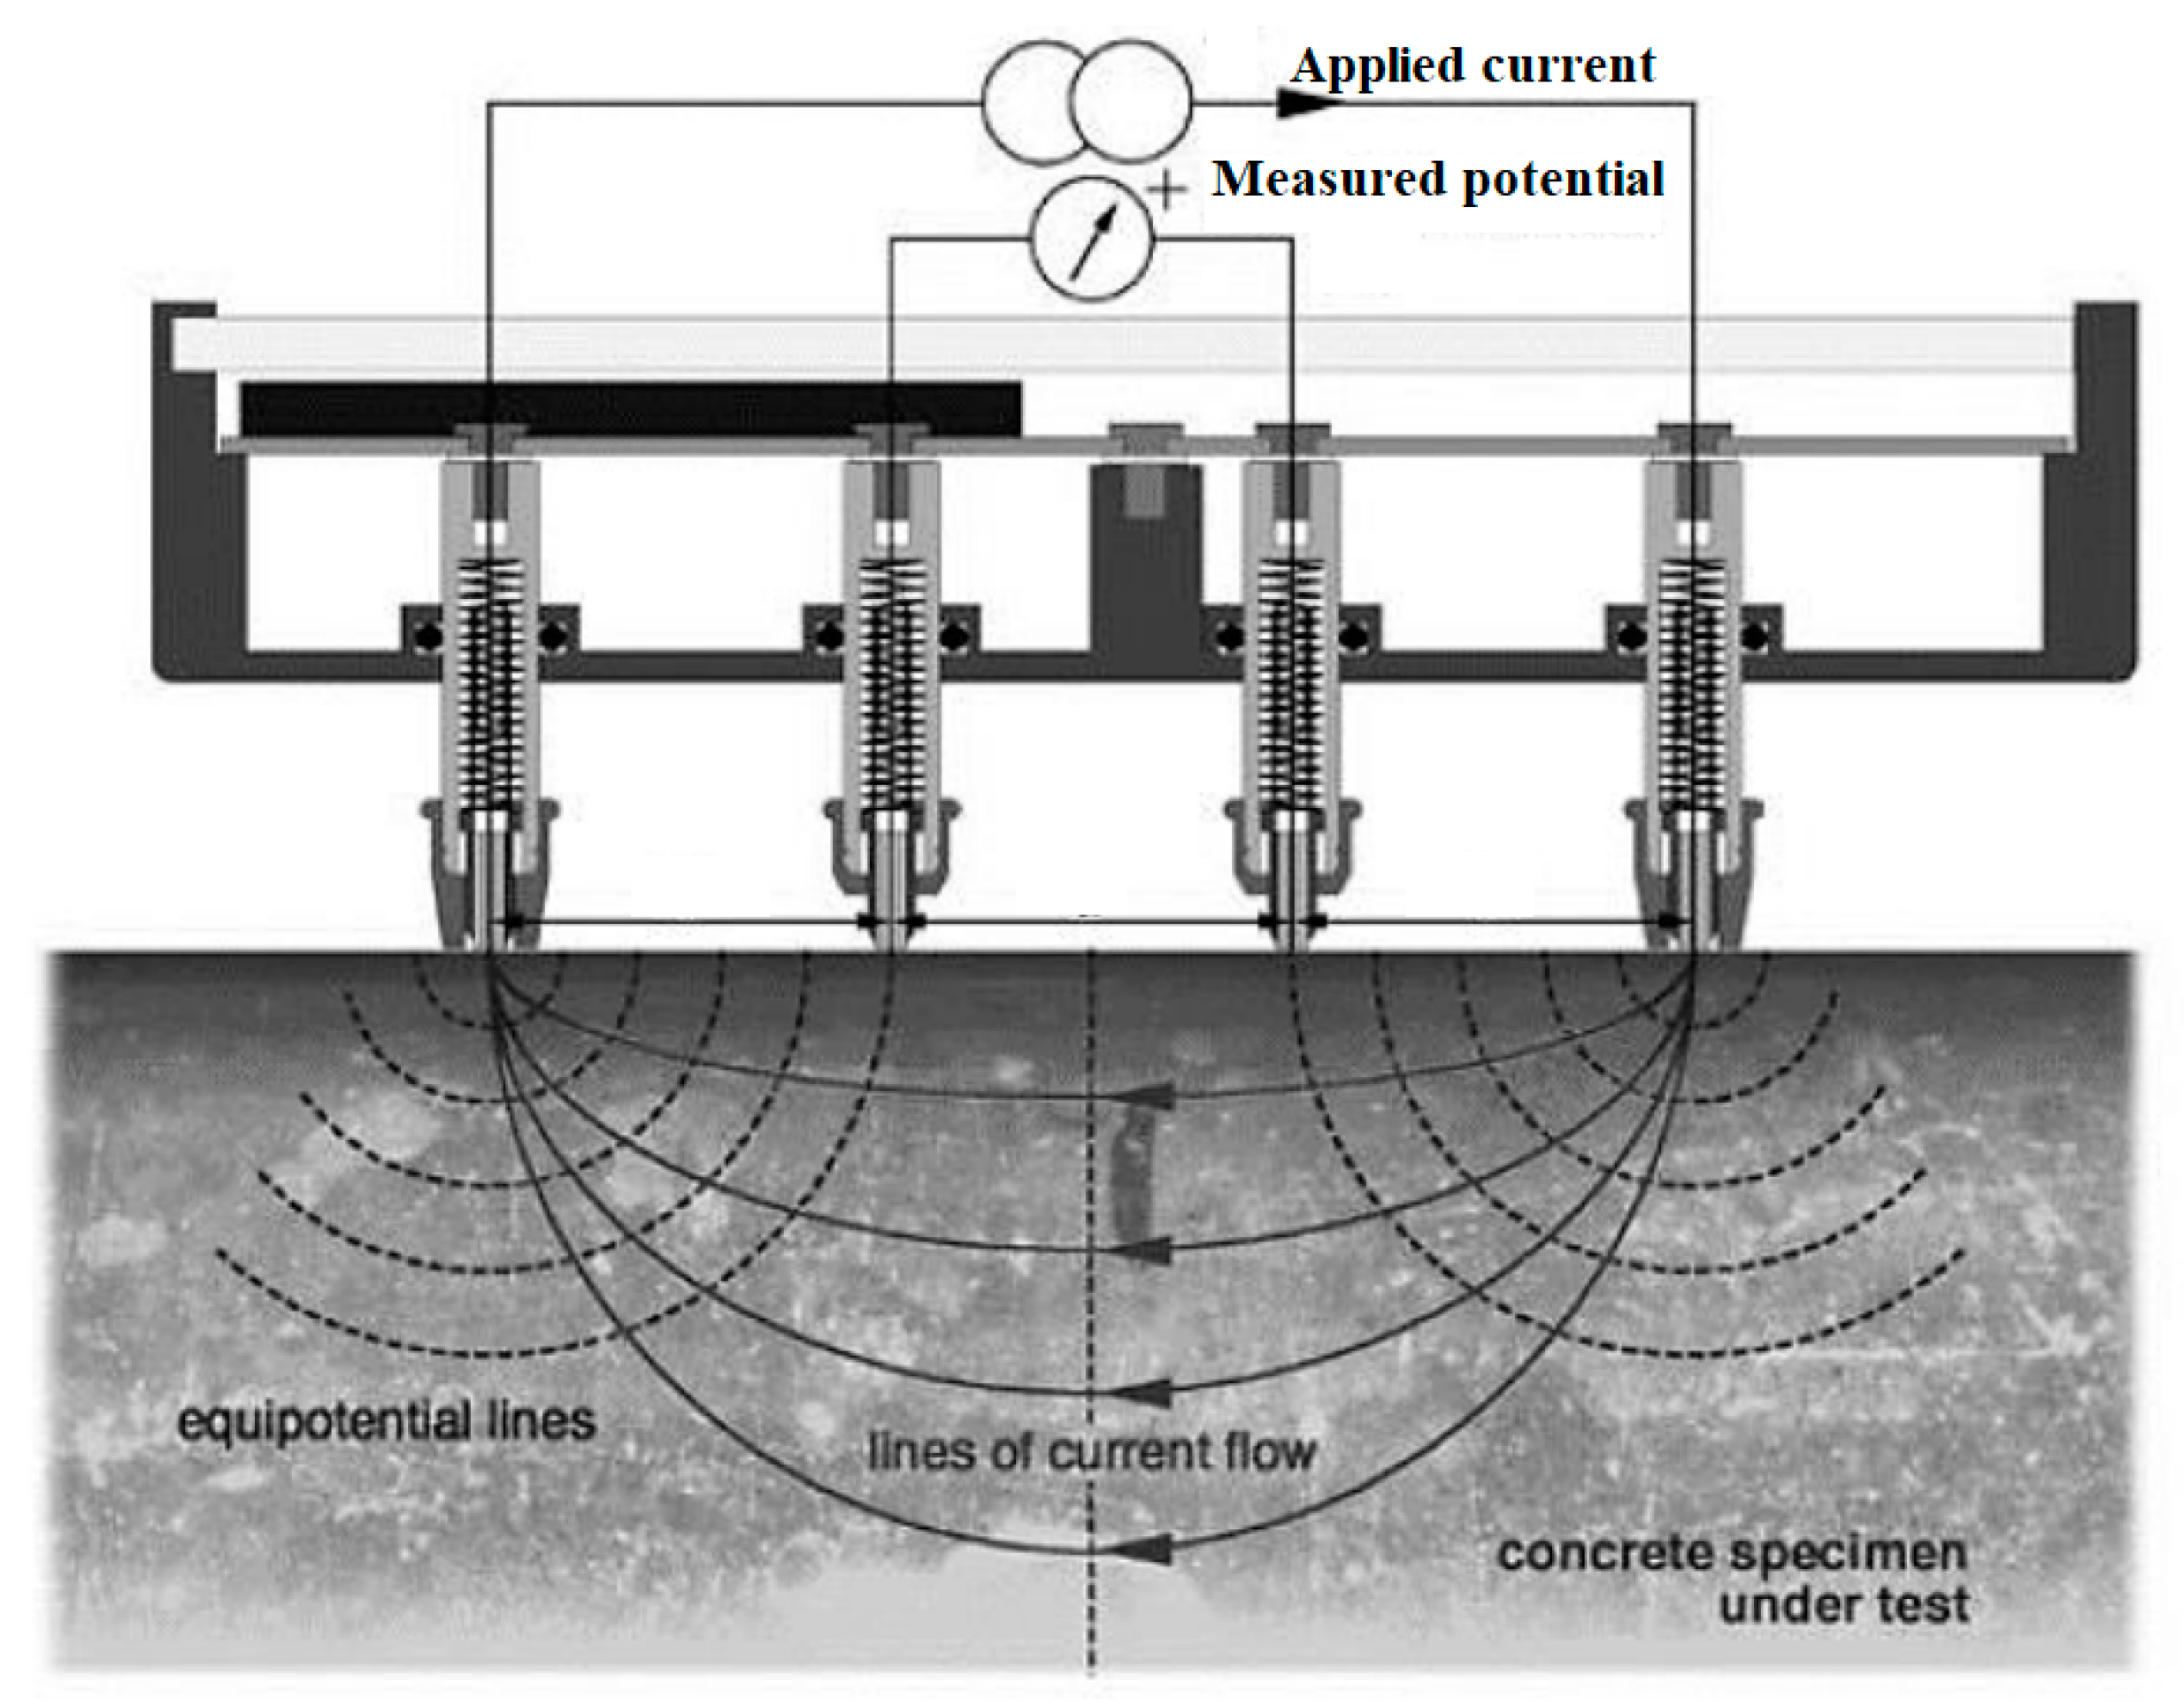
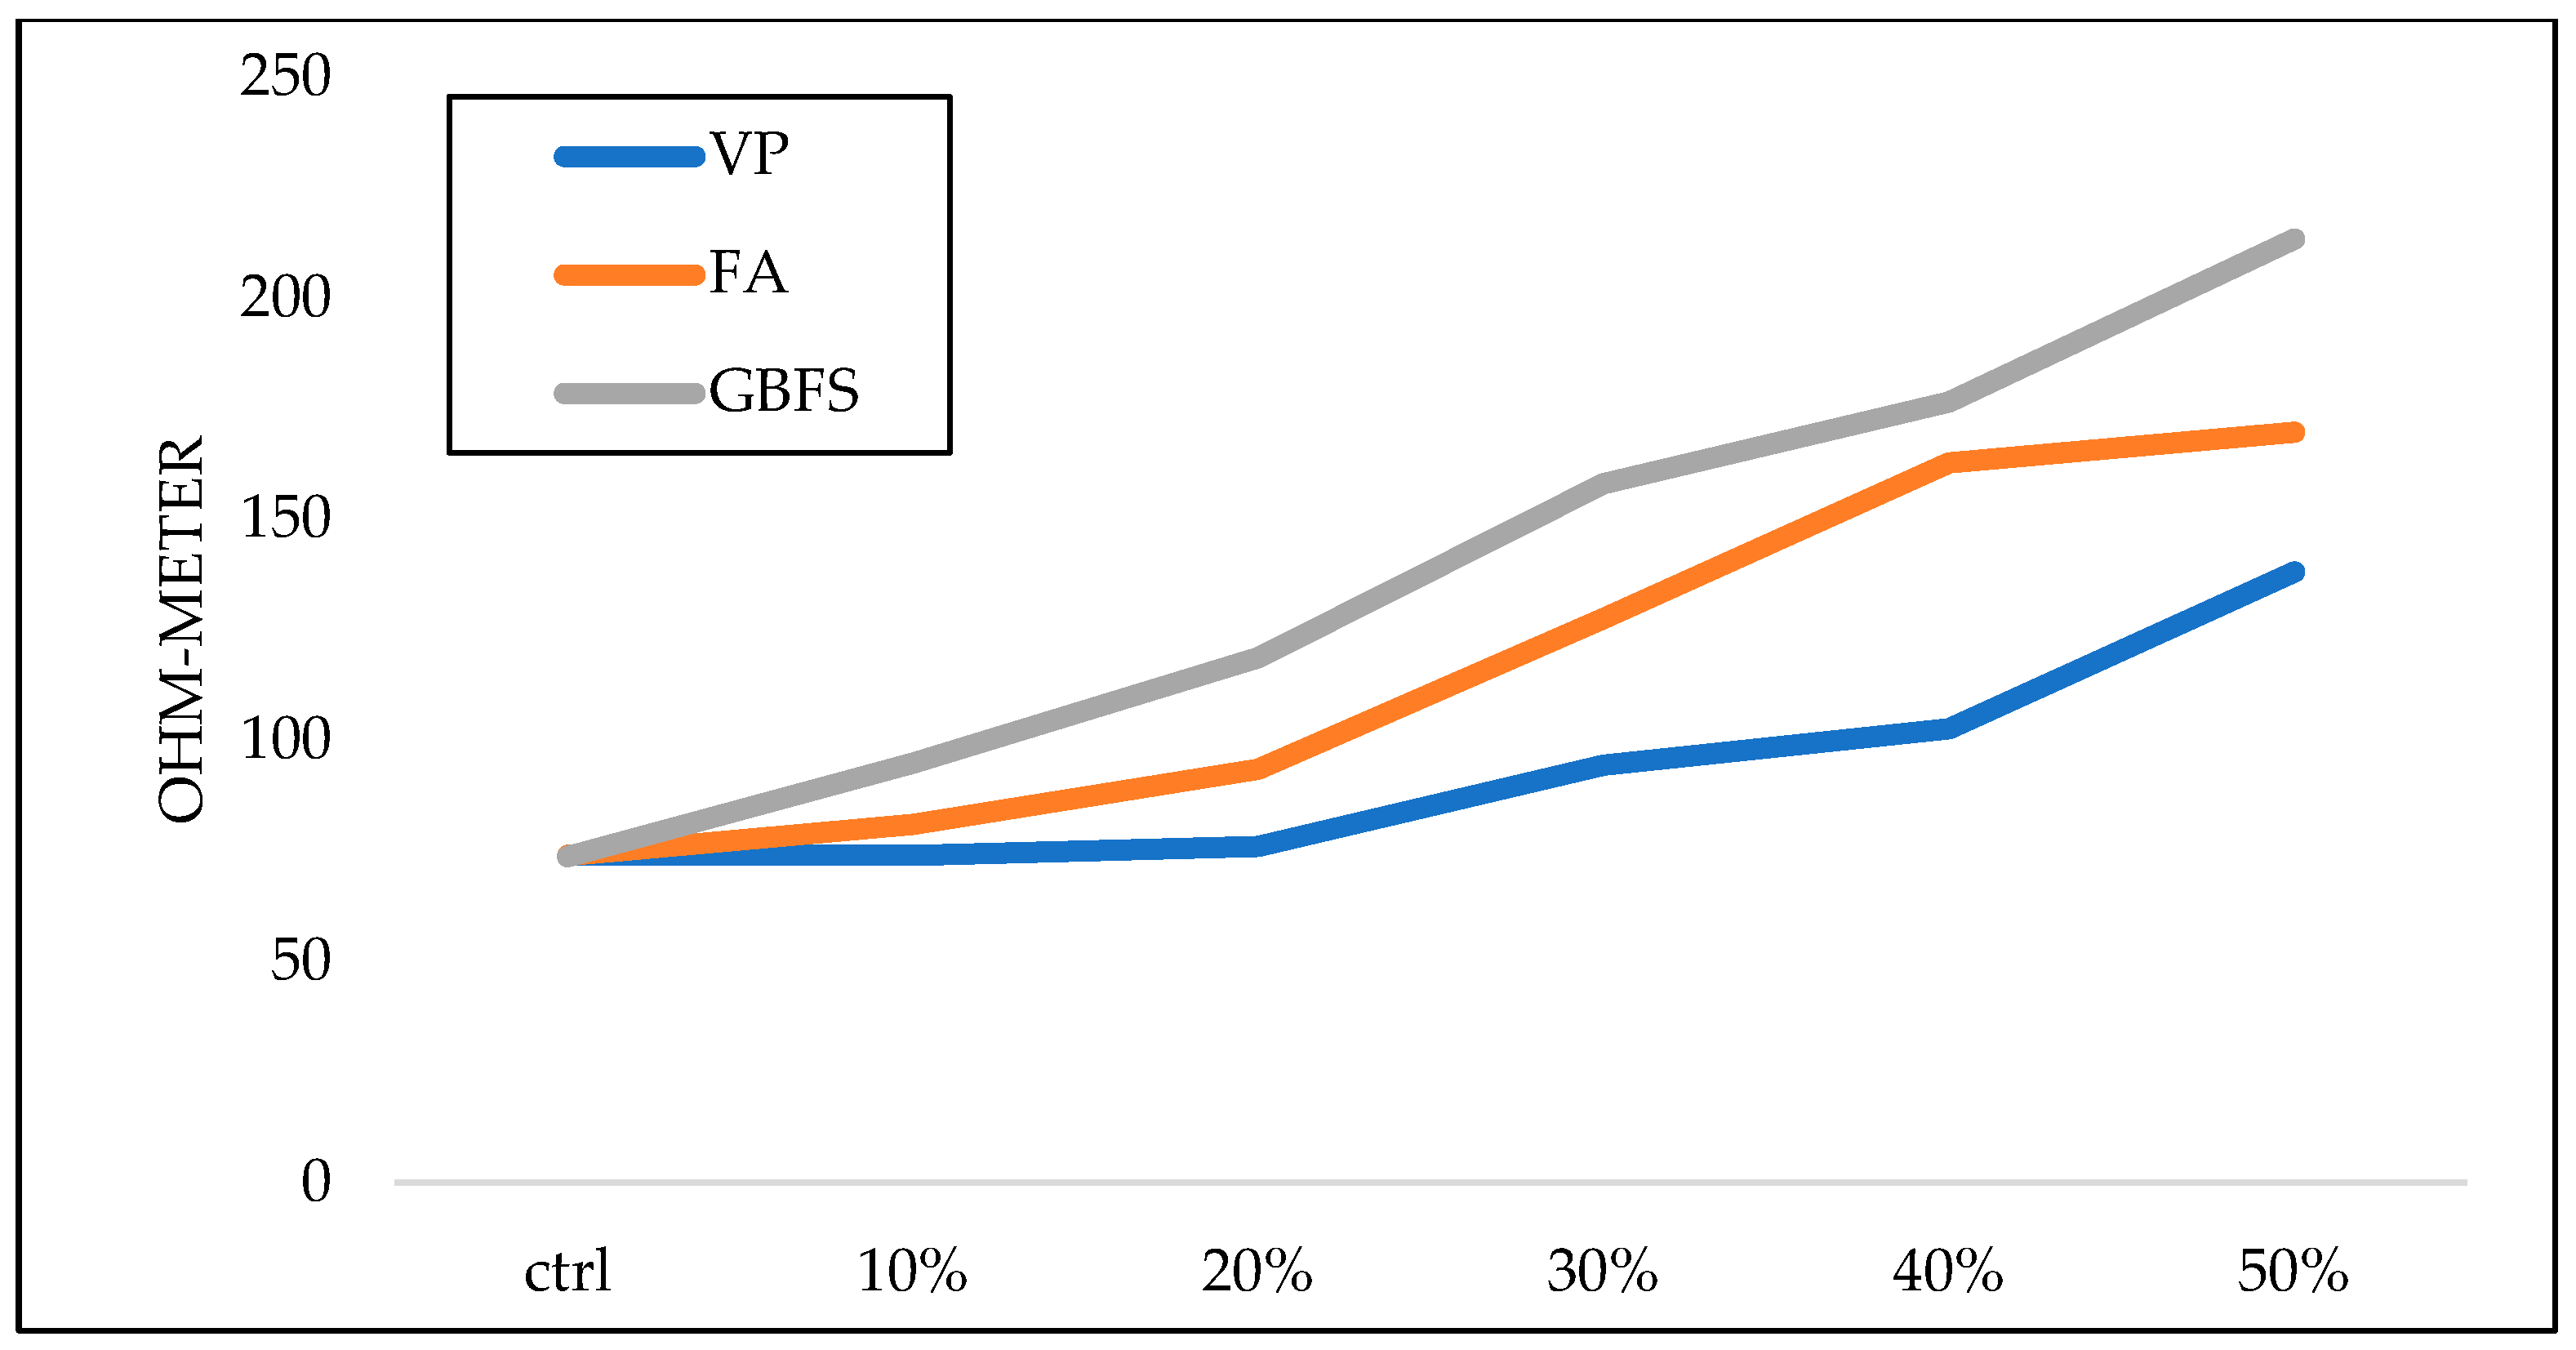
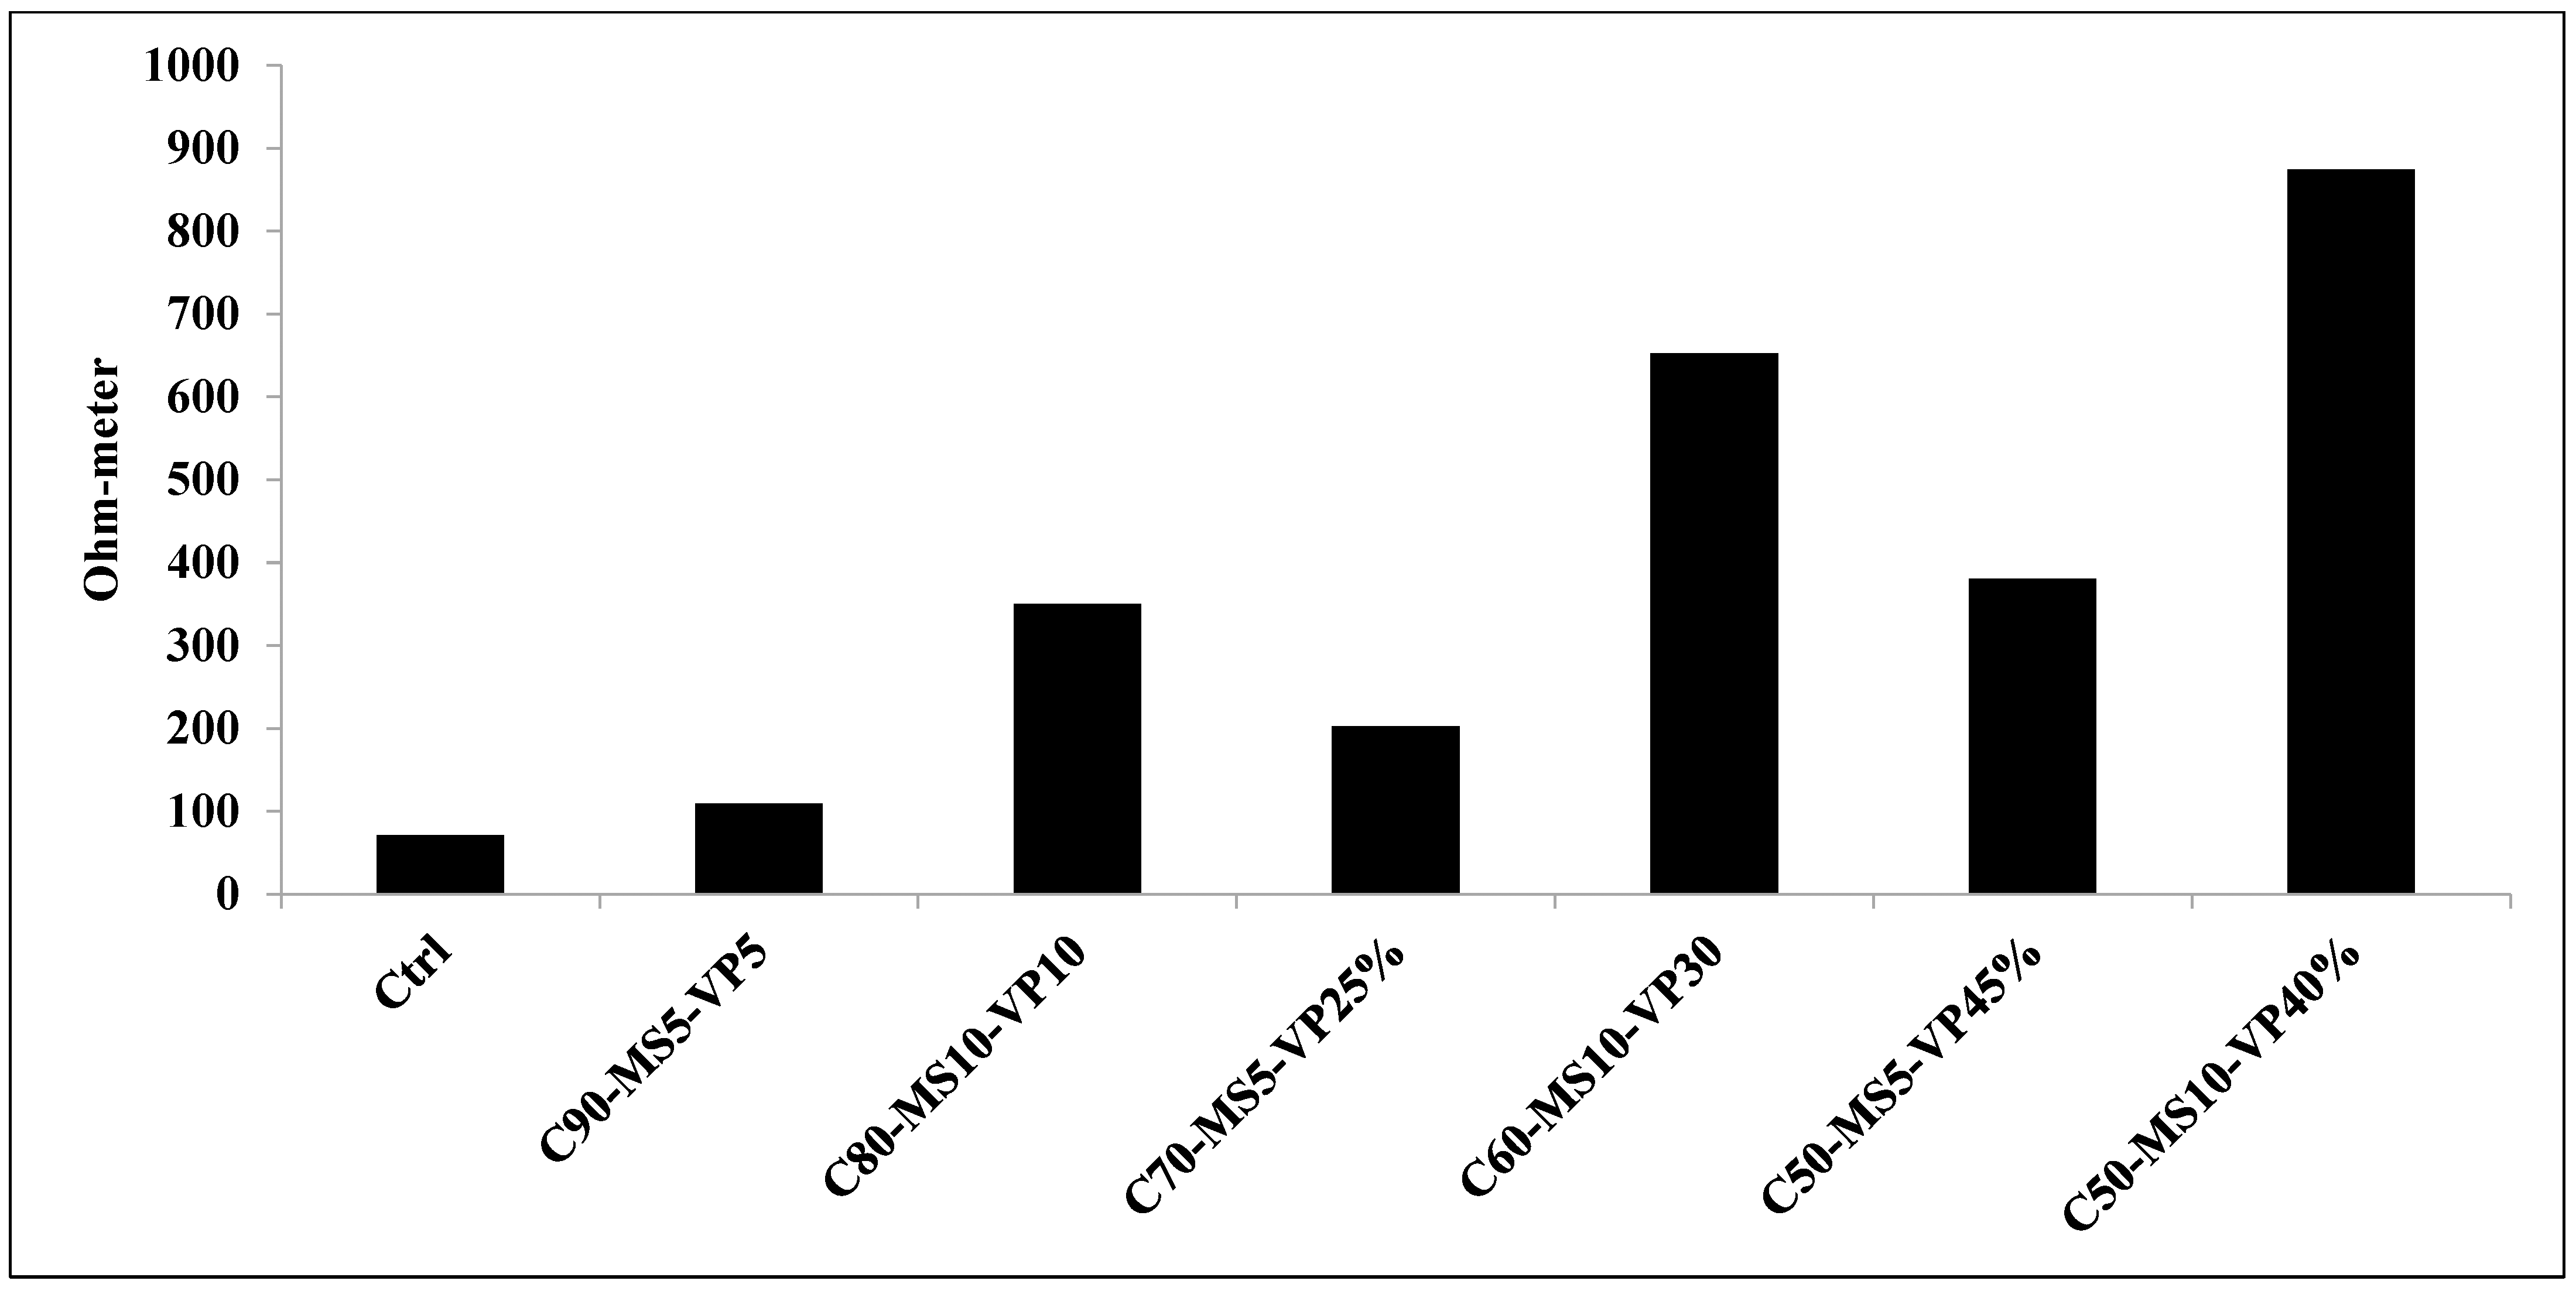
The four-point Wenner probe method has been performed on the samples to measure the electrical resistivity of the specimens based on the ASTM C1760 (Figure 18). The electrical resistance results of binary and ternary mixtures to evaluate the durability of SCGC are shown in Figure 19 and Figure 20. Increasing addition levels of SCMs in all binary and ternary mixtures leads to rising electrical resistance. However, the increased amount for all three SCMs is not the same. Based on the binary mixtures, GGBFS and VP had the highest and lowest effect on increasing electrical resistance, respectively. The Ca(OH)2 consumption by pozzolan leads to the paste matrix grid being denser. Therefore, the addition of pozzolans mainly increases electrical resistance. Moreover, the mixing of VP and MS shows the highest increase in electrical resistance. In addition to the reasons mentioned earlier in Section 3.1, reducing the pore volume and increasing the cohesion between the cement–aggregate paste is one of the key factors contributing to this increase [66,67]. In this regard, the electrical resistivity of the concrete matrix is viewed as one of the most critical parameters controlling the diffusion rate of chloride ions to initiate and propagate steel reinforcement corrosion [68]. Utilizing VP and micro-silica in SCGC concrete as replacement materials for PC in binary and ternary mixtures is recommended as a clear choice to improve the durability of SCGC concrete.

3.5. ANFIS Analysis Results

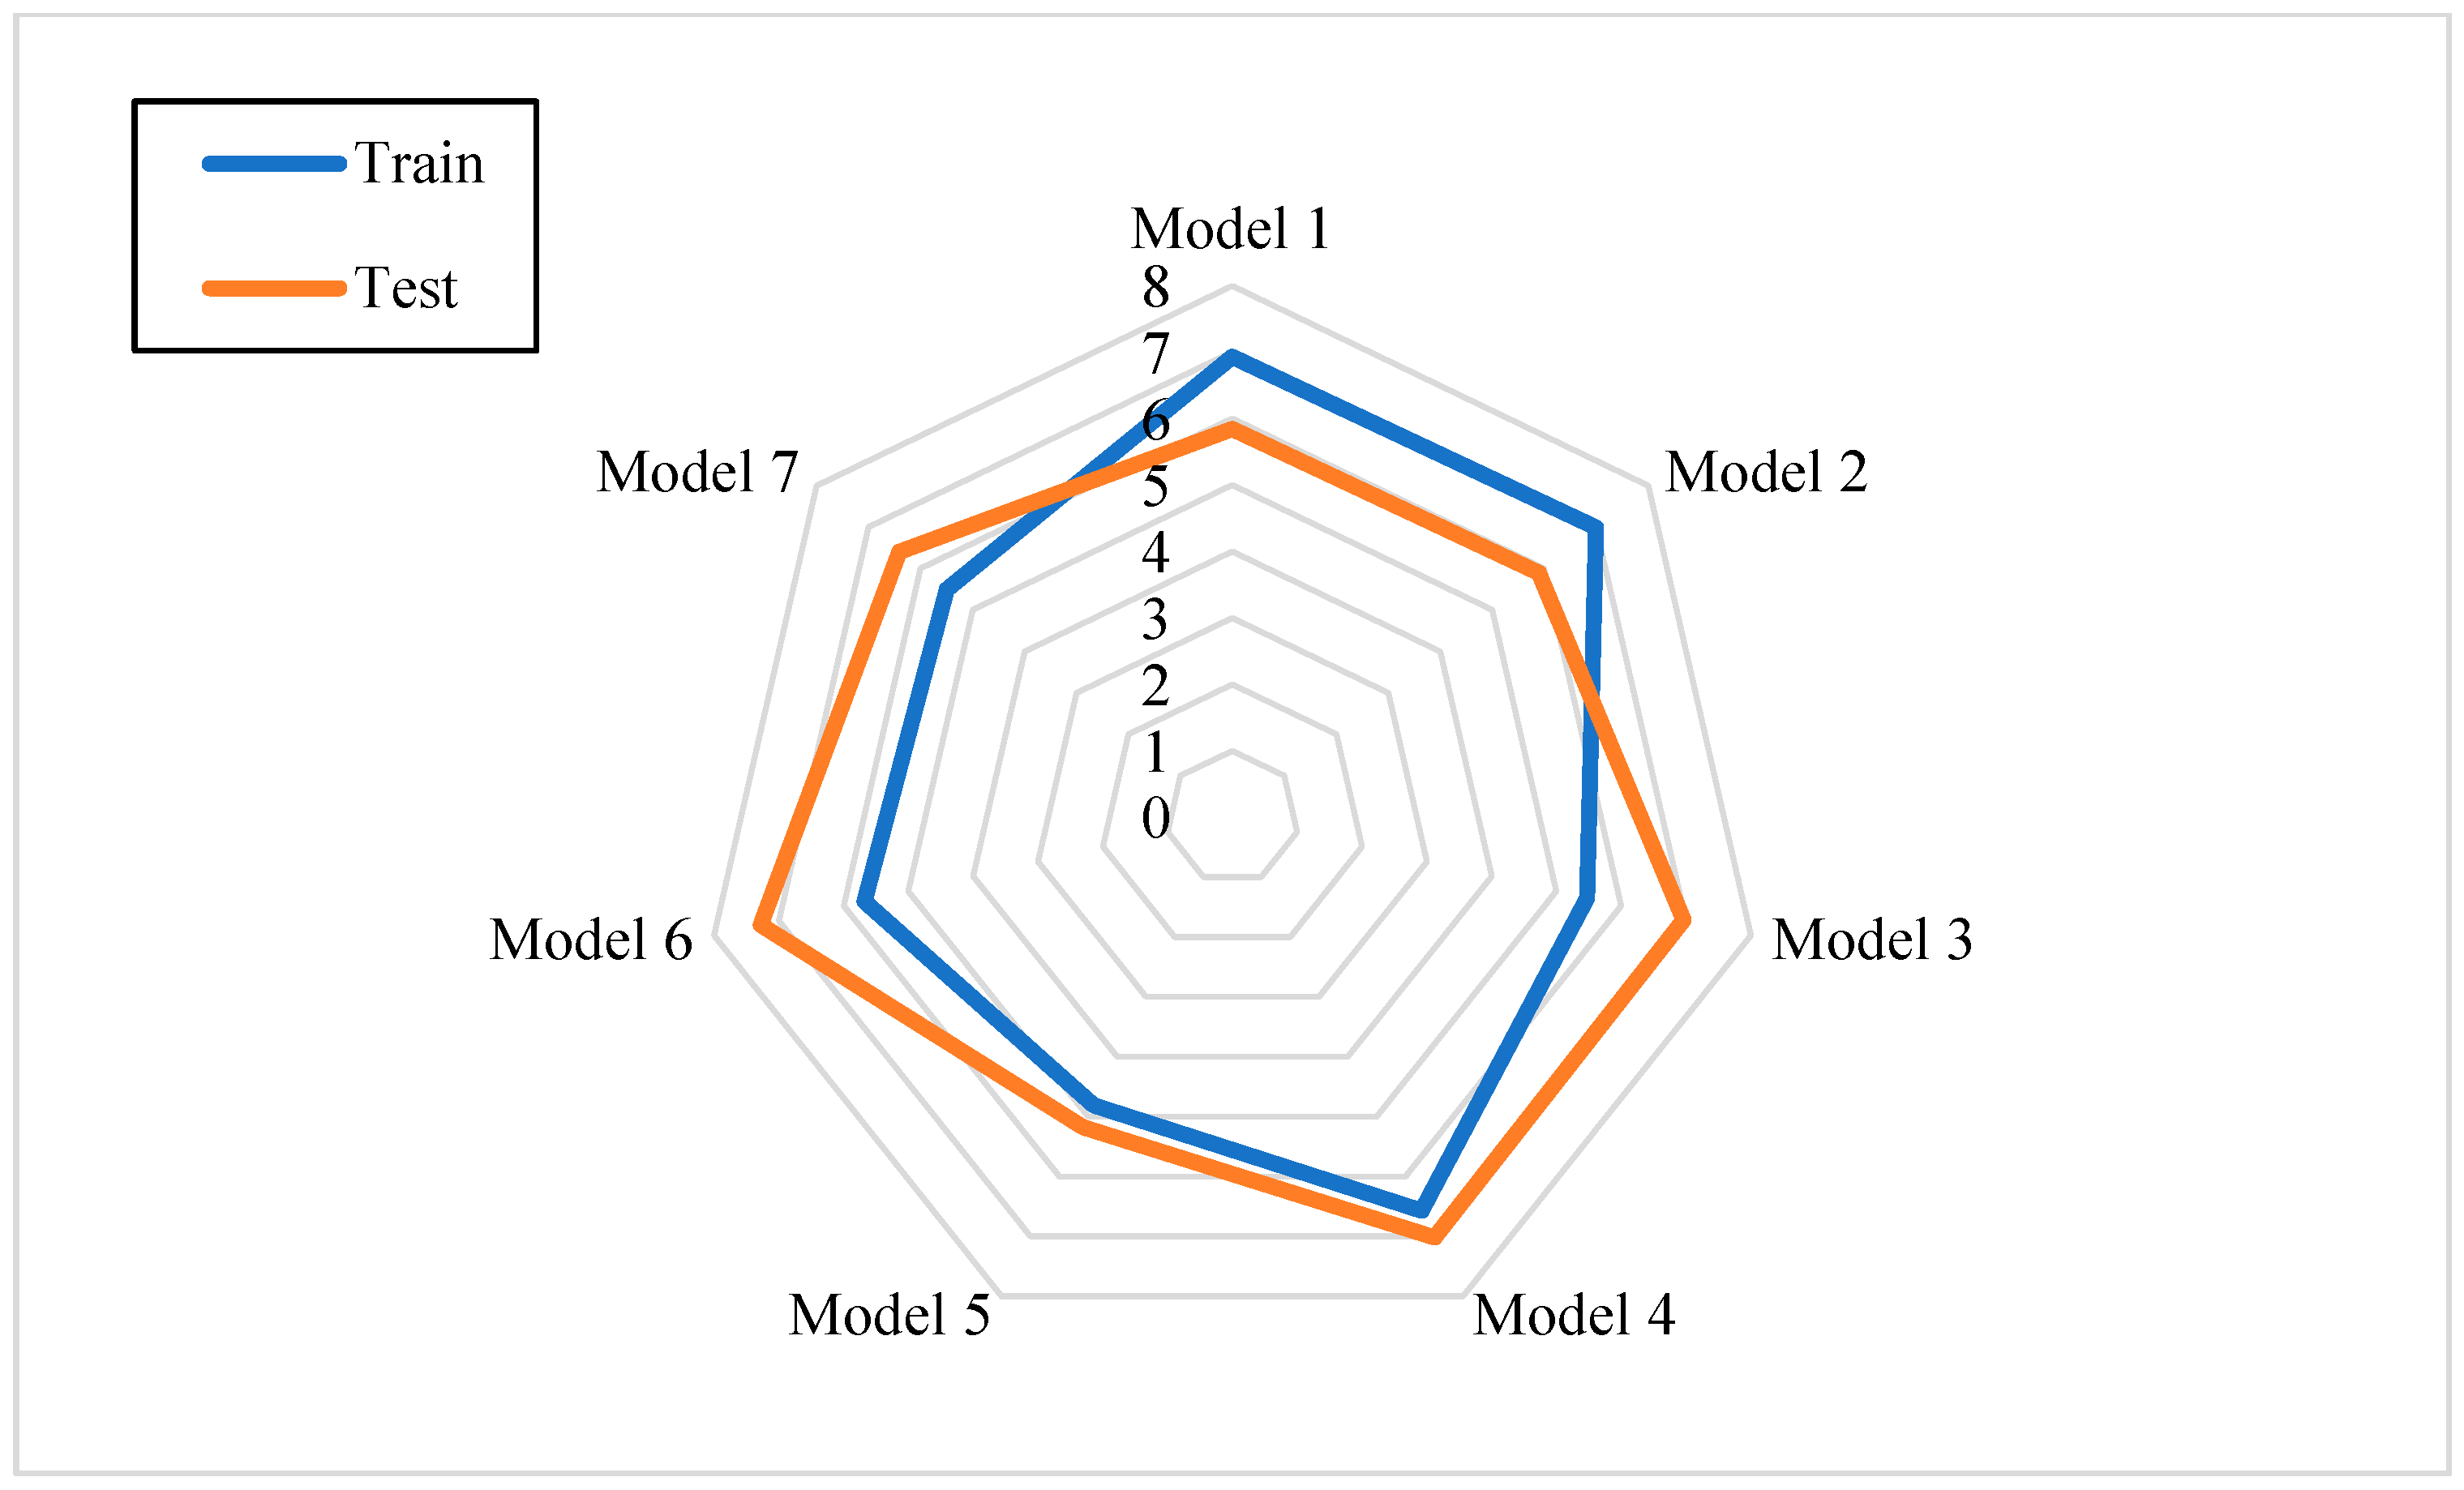
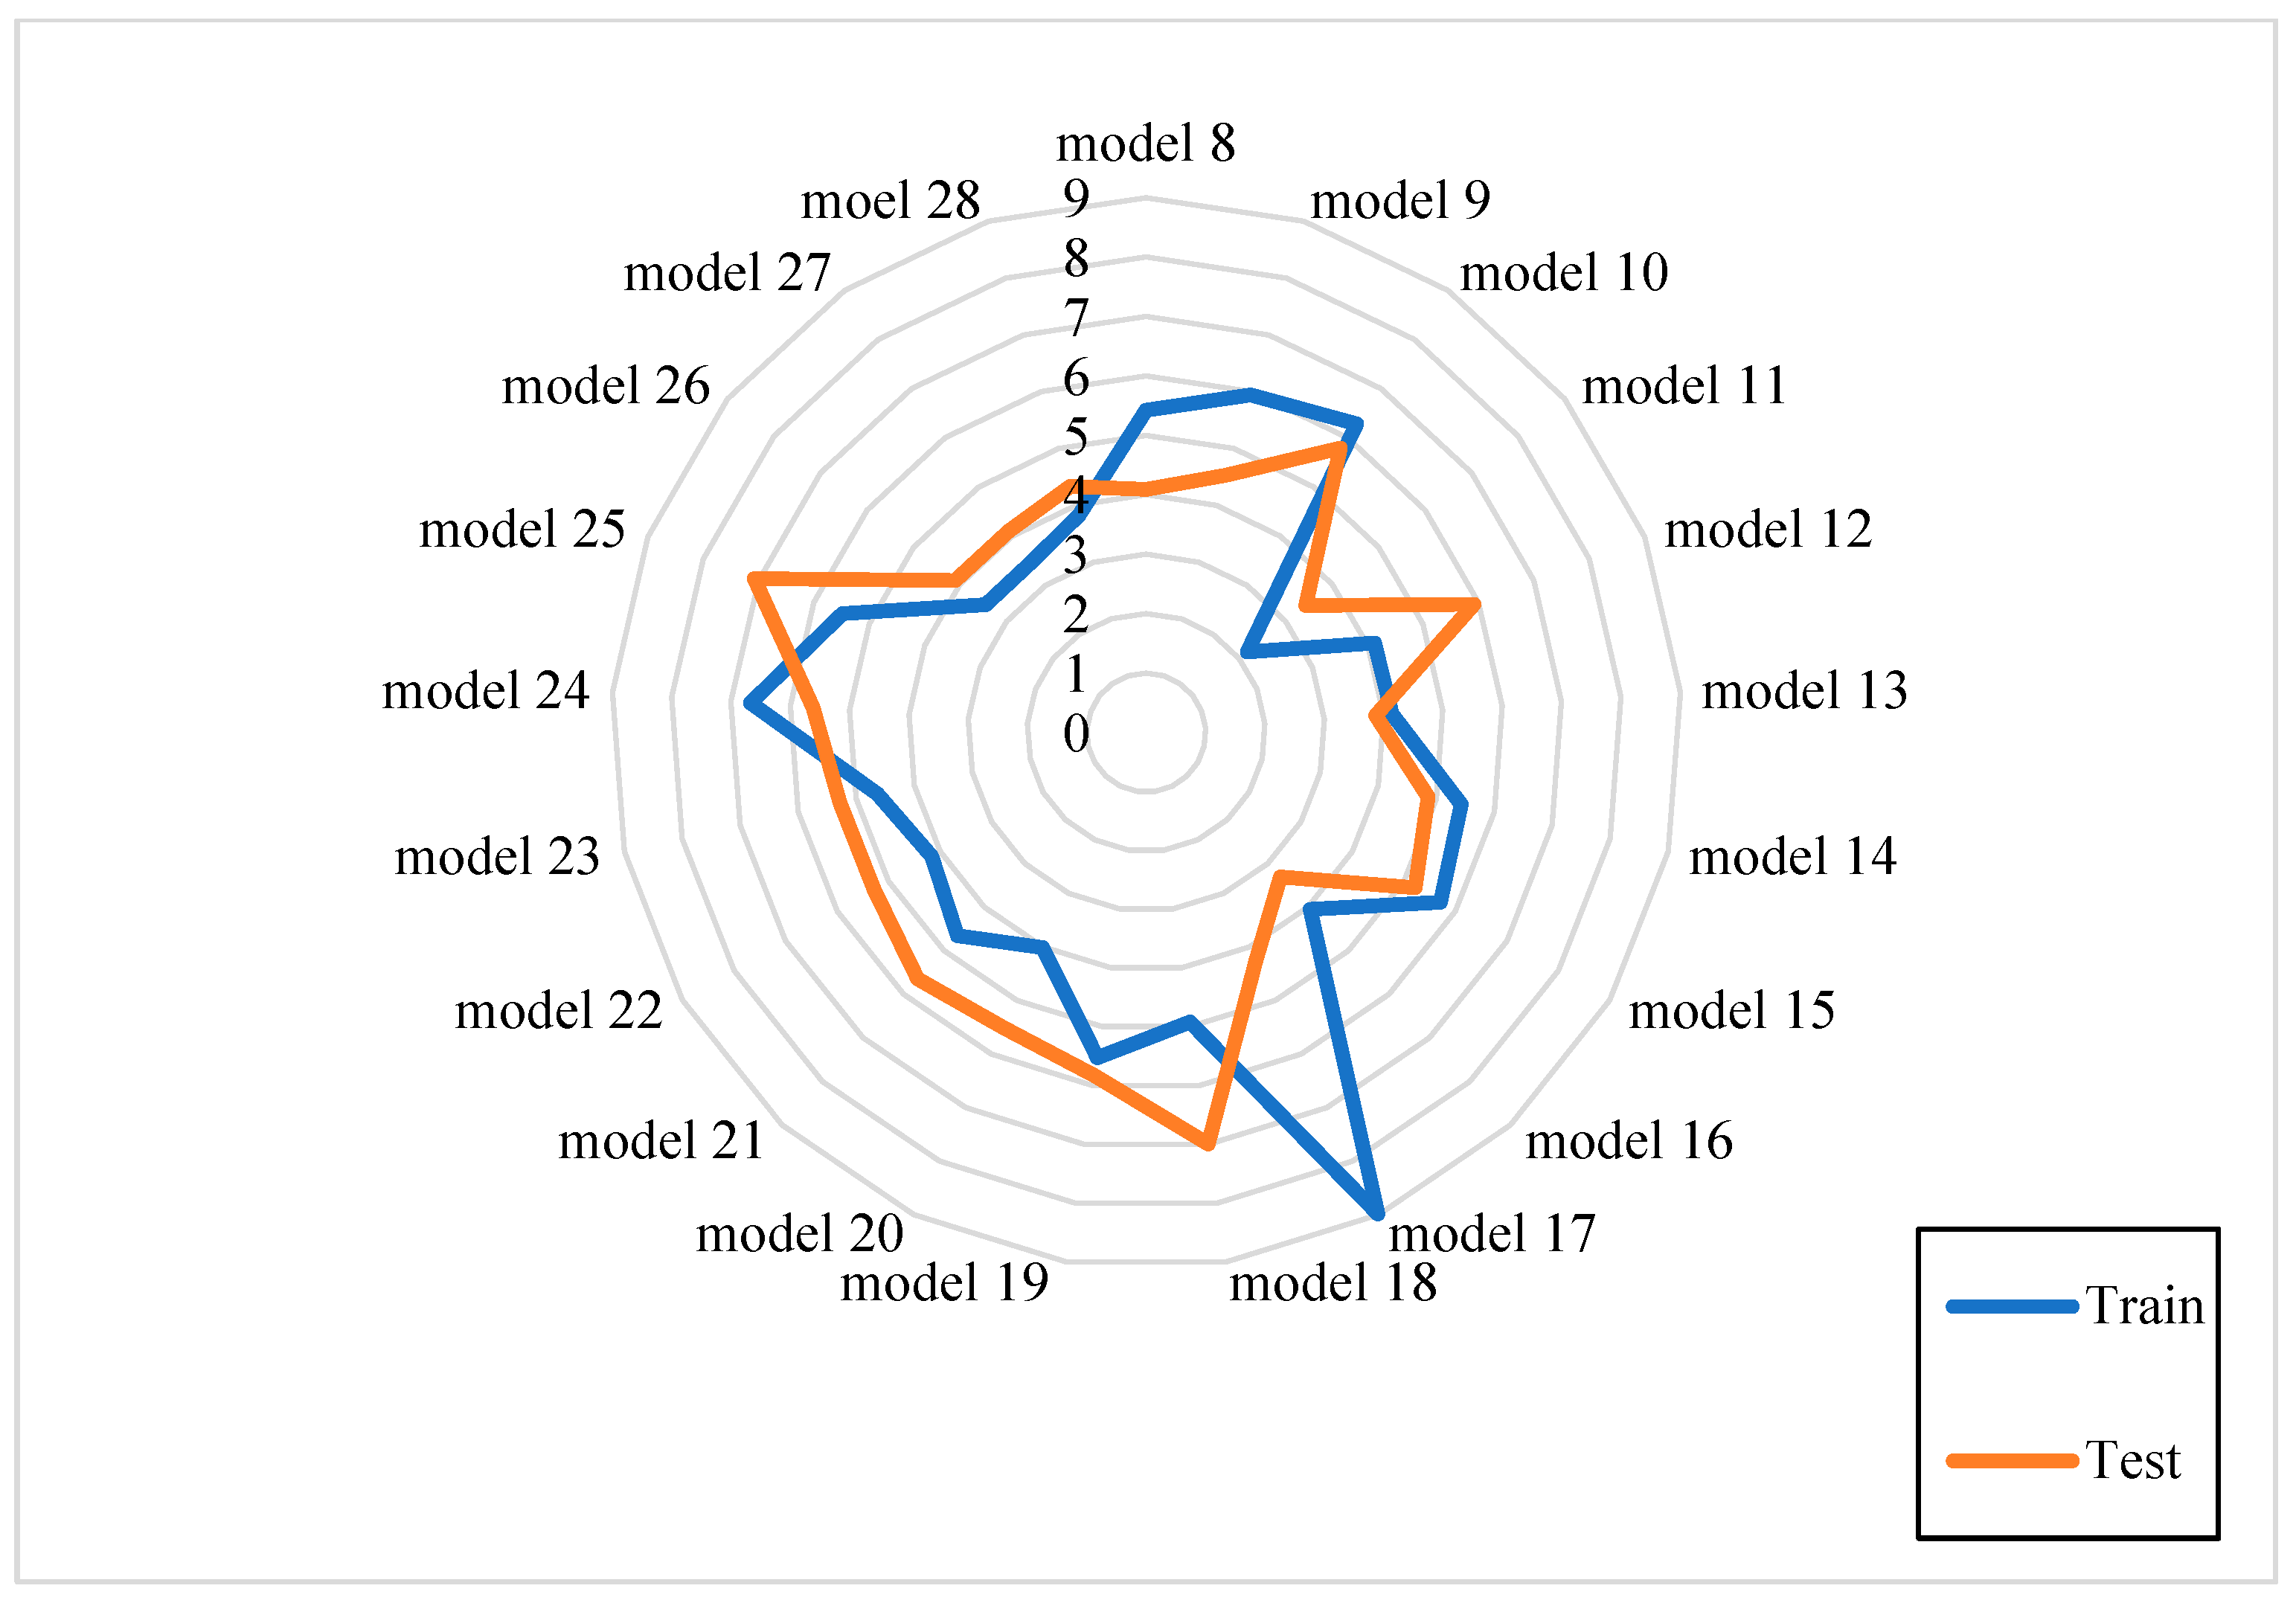
The training and testing RMSE for each input are shown separately in Table 8. As can be seen, input 5 (electrical resistivity) has the smallest training RMSE. In other words, the most substantial influence on the output is induced by input 5. On the contrary, the highest training RMSE is obtained by input 2 (micro-silica), which has a minor effect on the output, although this value could be related to the fact that it was not used separately in any specimen and was only used with VP. In order to achieve a better understanding of the most influential parameters on the output (compressive strength) and identify the relative parameters, models with the combination of two inputs have also been studied. Hence, it is more reasonable to compare the ANFIS models in Table 8 with the inputs in Table 5. As can be seen, the combination of micro-silica with VP (model 8) has the most influence on the output due to having the highest reduction in the RMSE value. In addition, by comparing the training RMSE value of the ANFIS model 1 to 7 in Table 8 and ANFIS model 8 to 17 in Table 9, it can be concluded that the combination of micro-silica with VP has the most substantial influence among the added powders (i.e., micro-silica, GBFS, FA, and VP) on the compressive strength of SCGC. In addition, the RMSE values for training and testing phases are shown in Figure 21, which indicates that they are close to each other. Therefore, the network has been trained appropriately, and there is not any sign of overfitting. Table 9 shows the other 21 ANFIS models in which the effect of combined input parameters was seen on the output value. As indicated in this figure, the ANFIS model 11 whose input parameters were VP replacements and electrical resistivity, has the most considerable influence on the output.
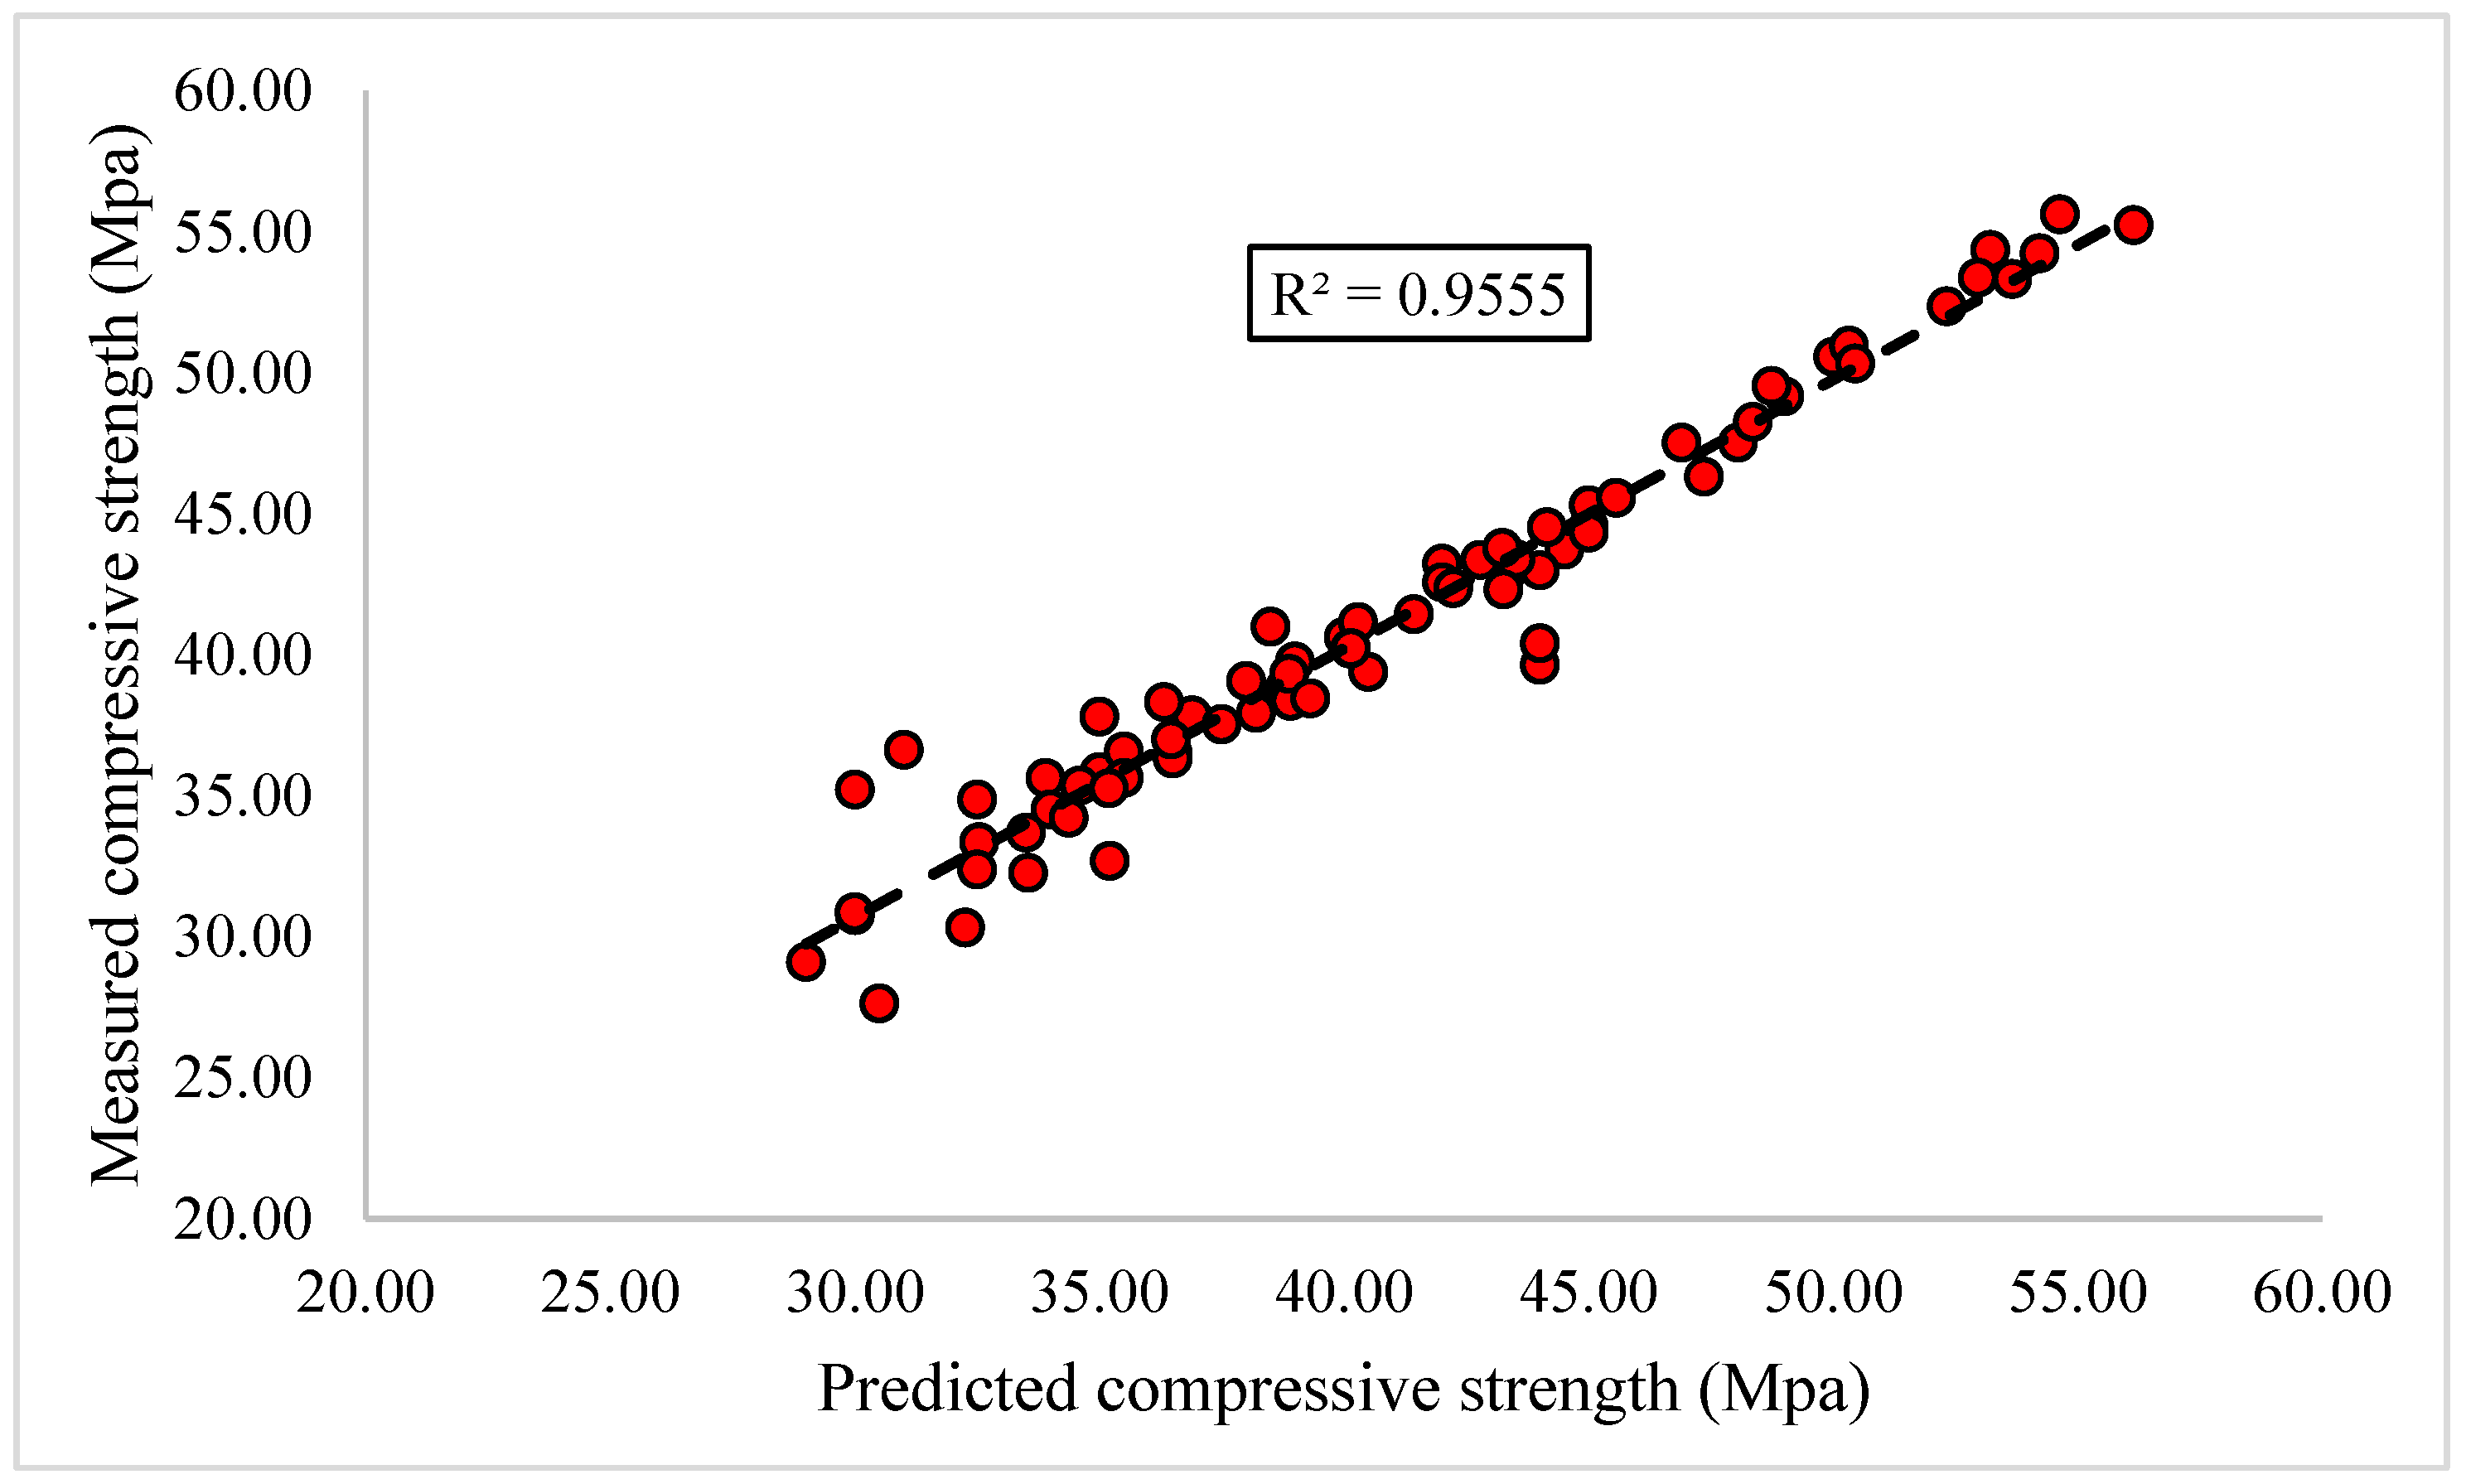
Accordingly, Figure 22 represents the regression chart for the developed ANFIS prediction, corresponding to model 5. Figure 22 also shows the r-squared number (i.e., coefficient of determination) which is equal to 0.955. In this case, numbers closer to one mean that predicted and measured values are very close together.
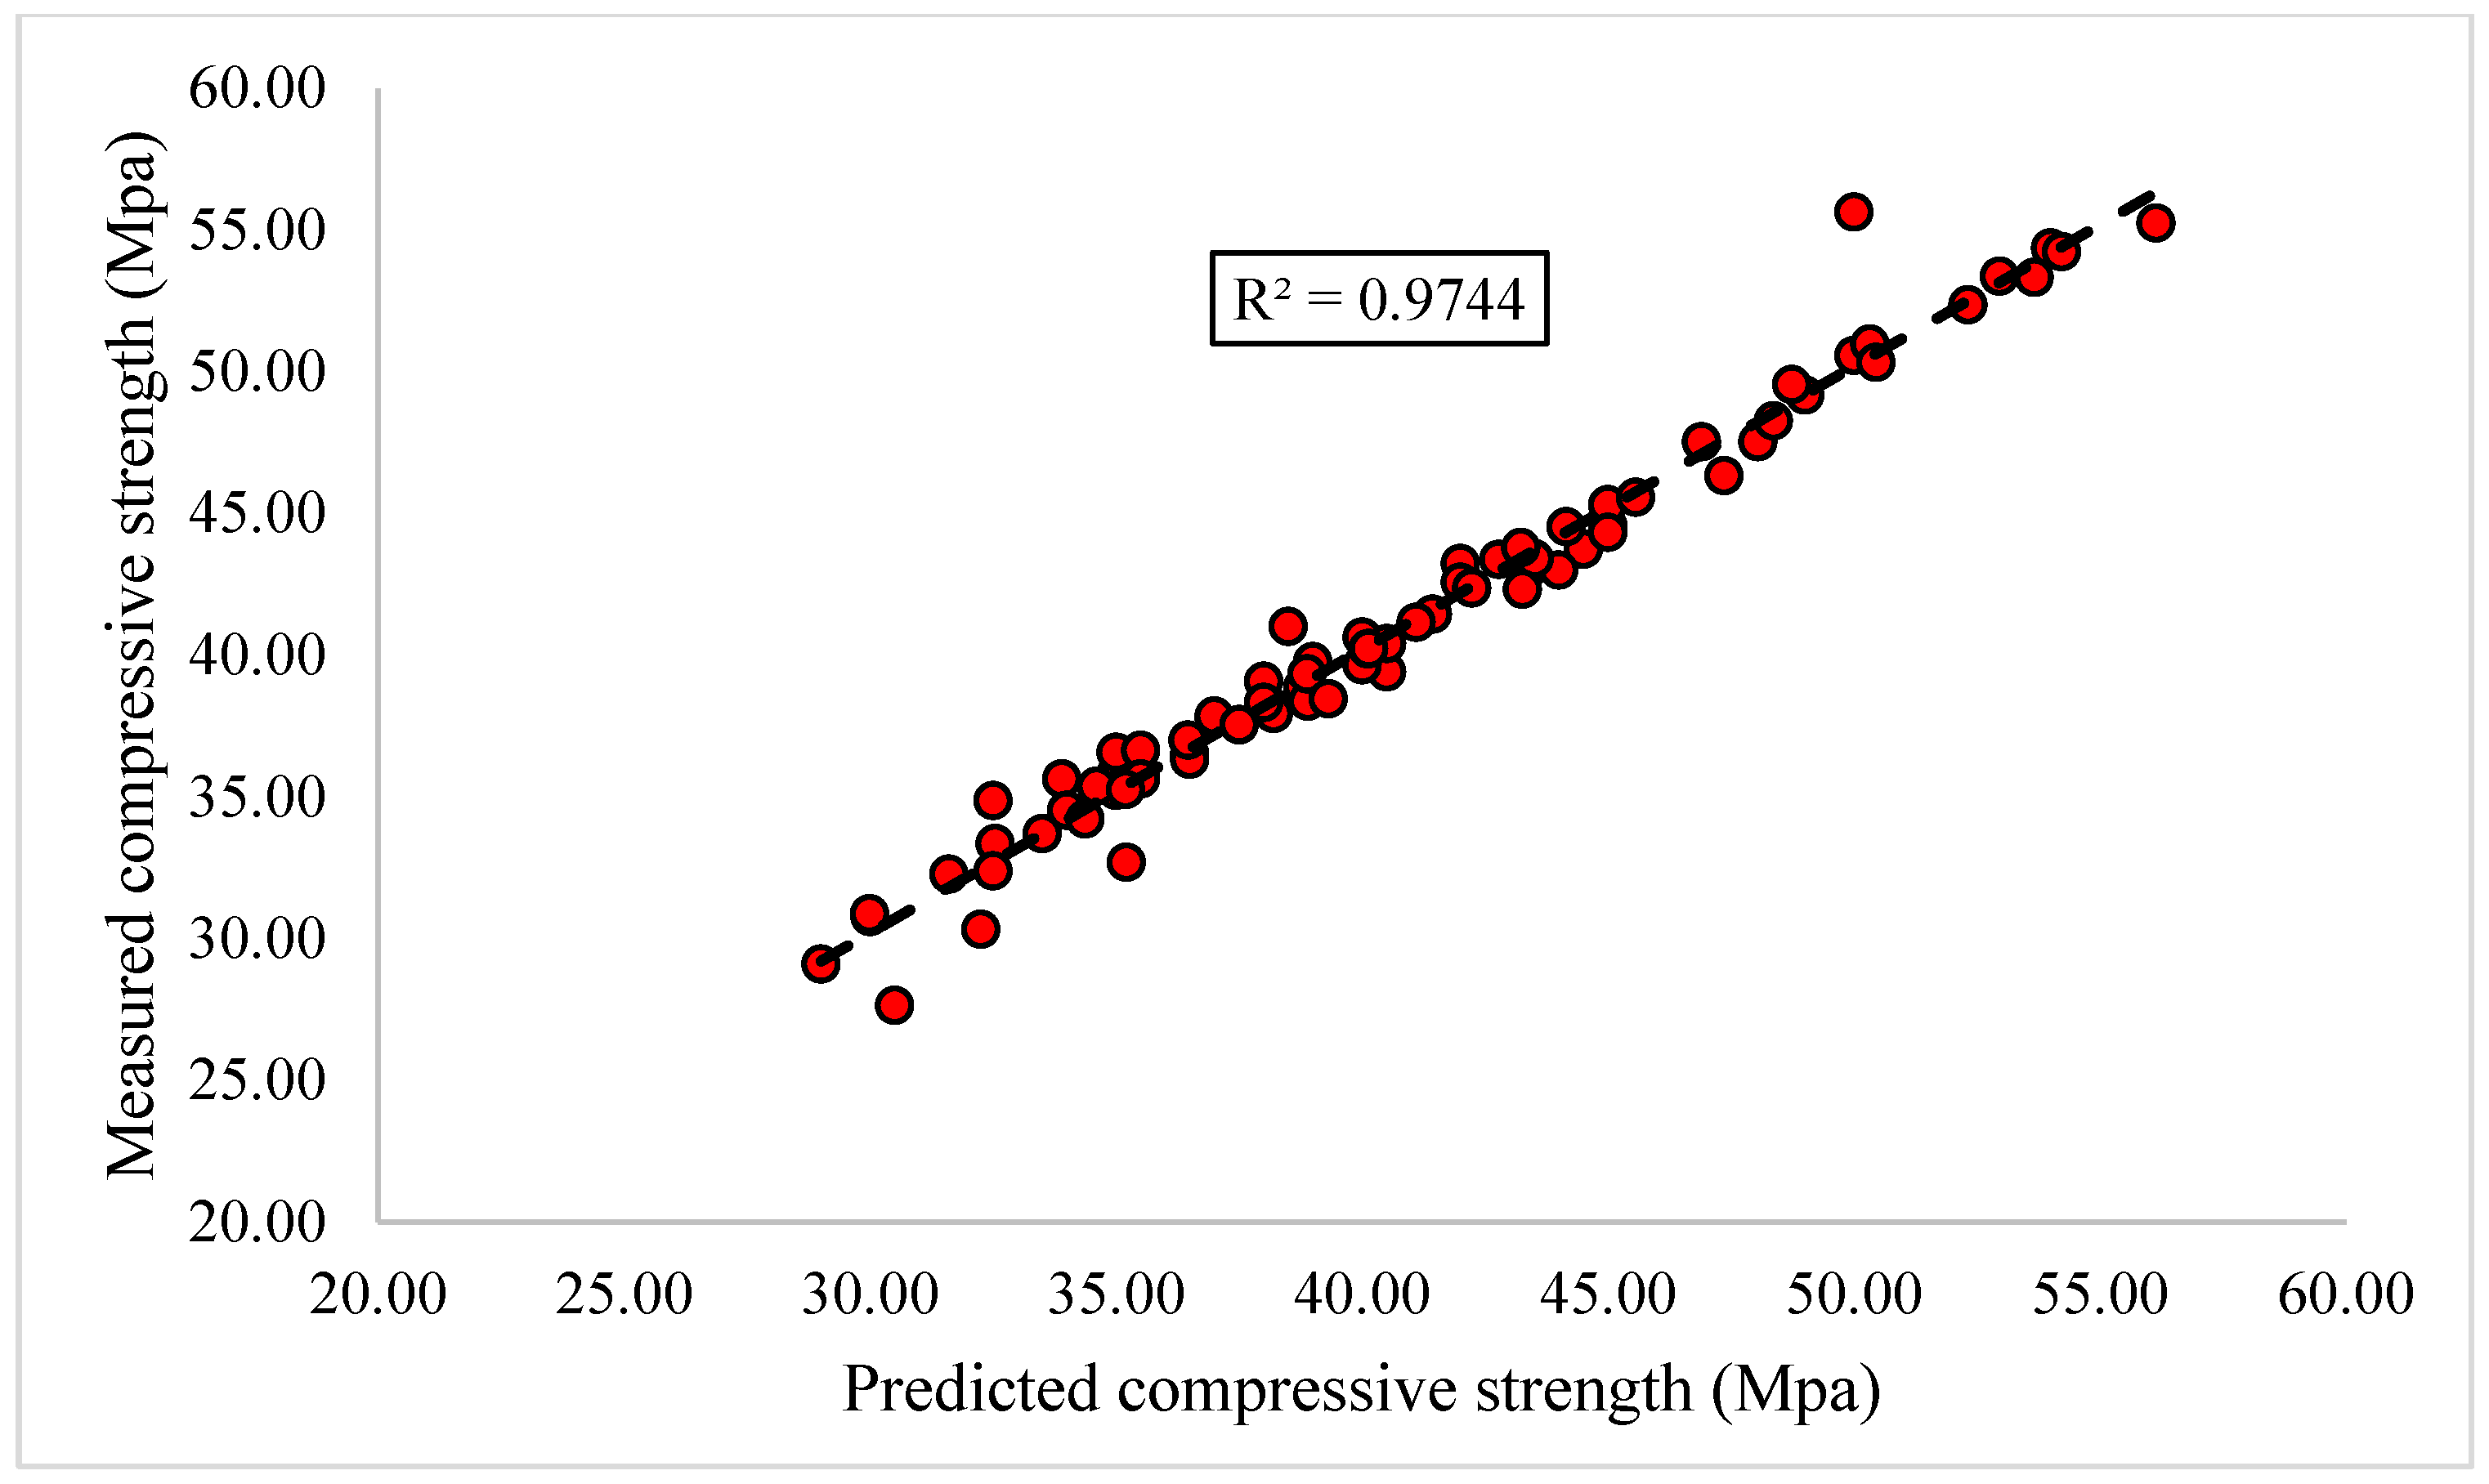
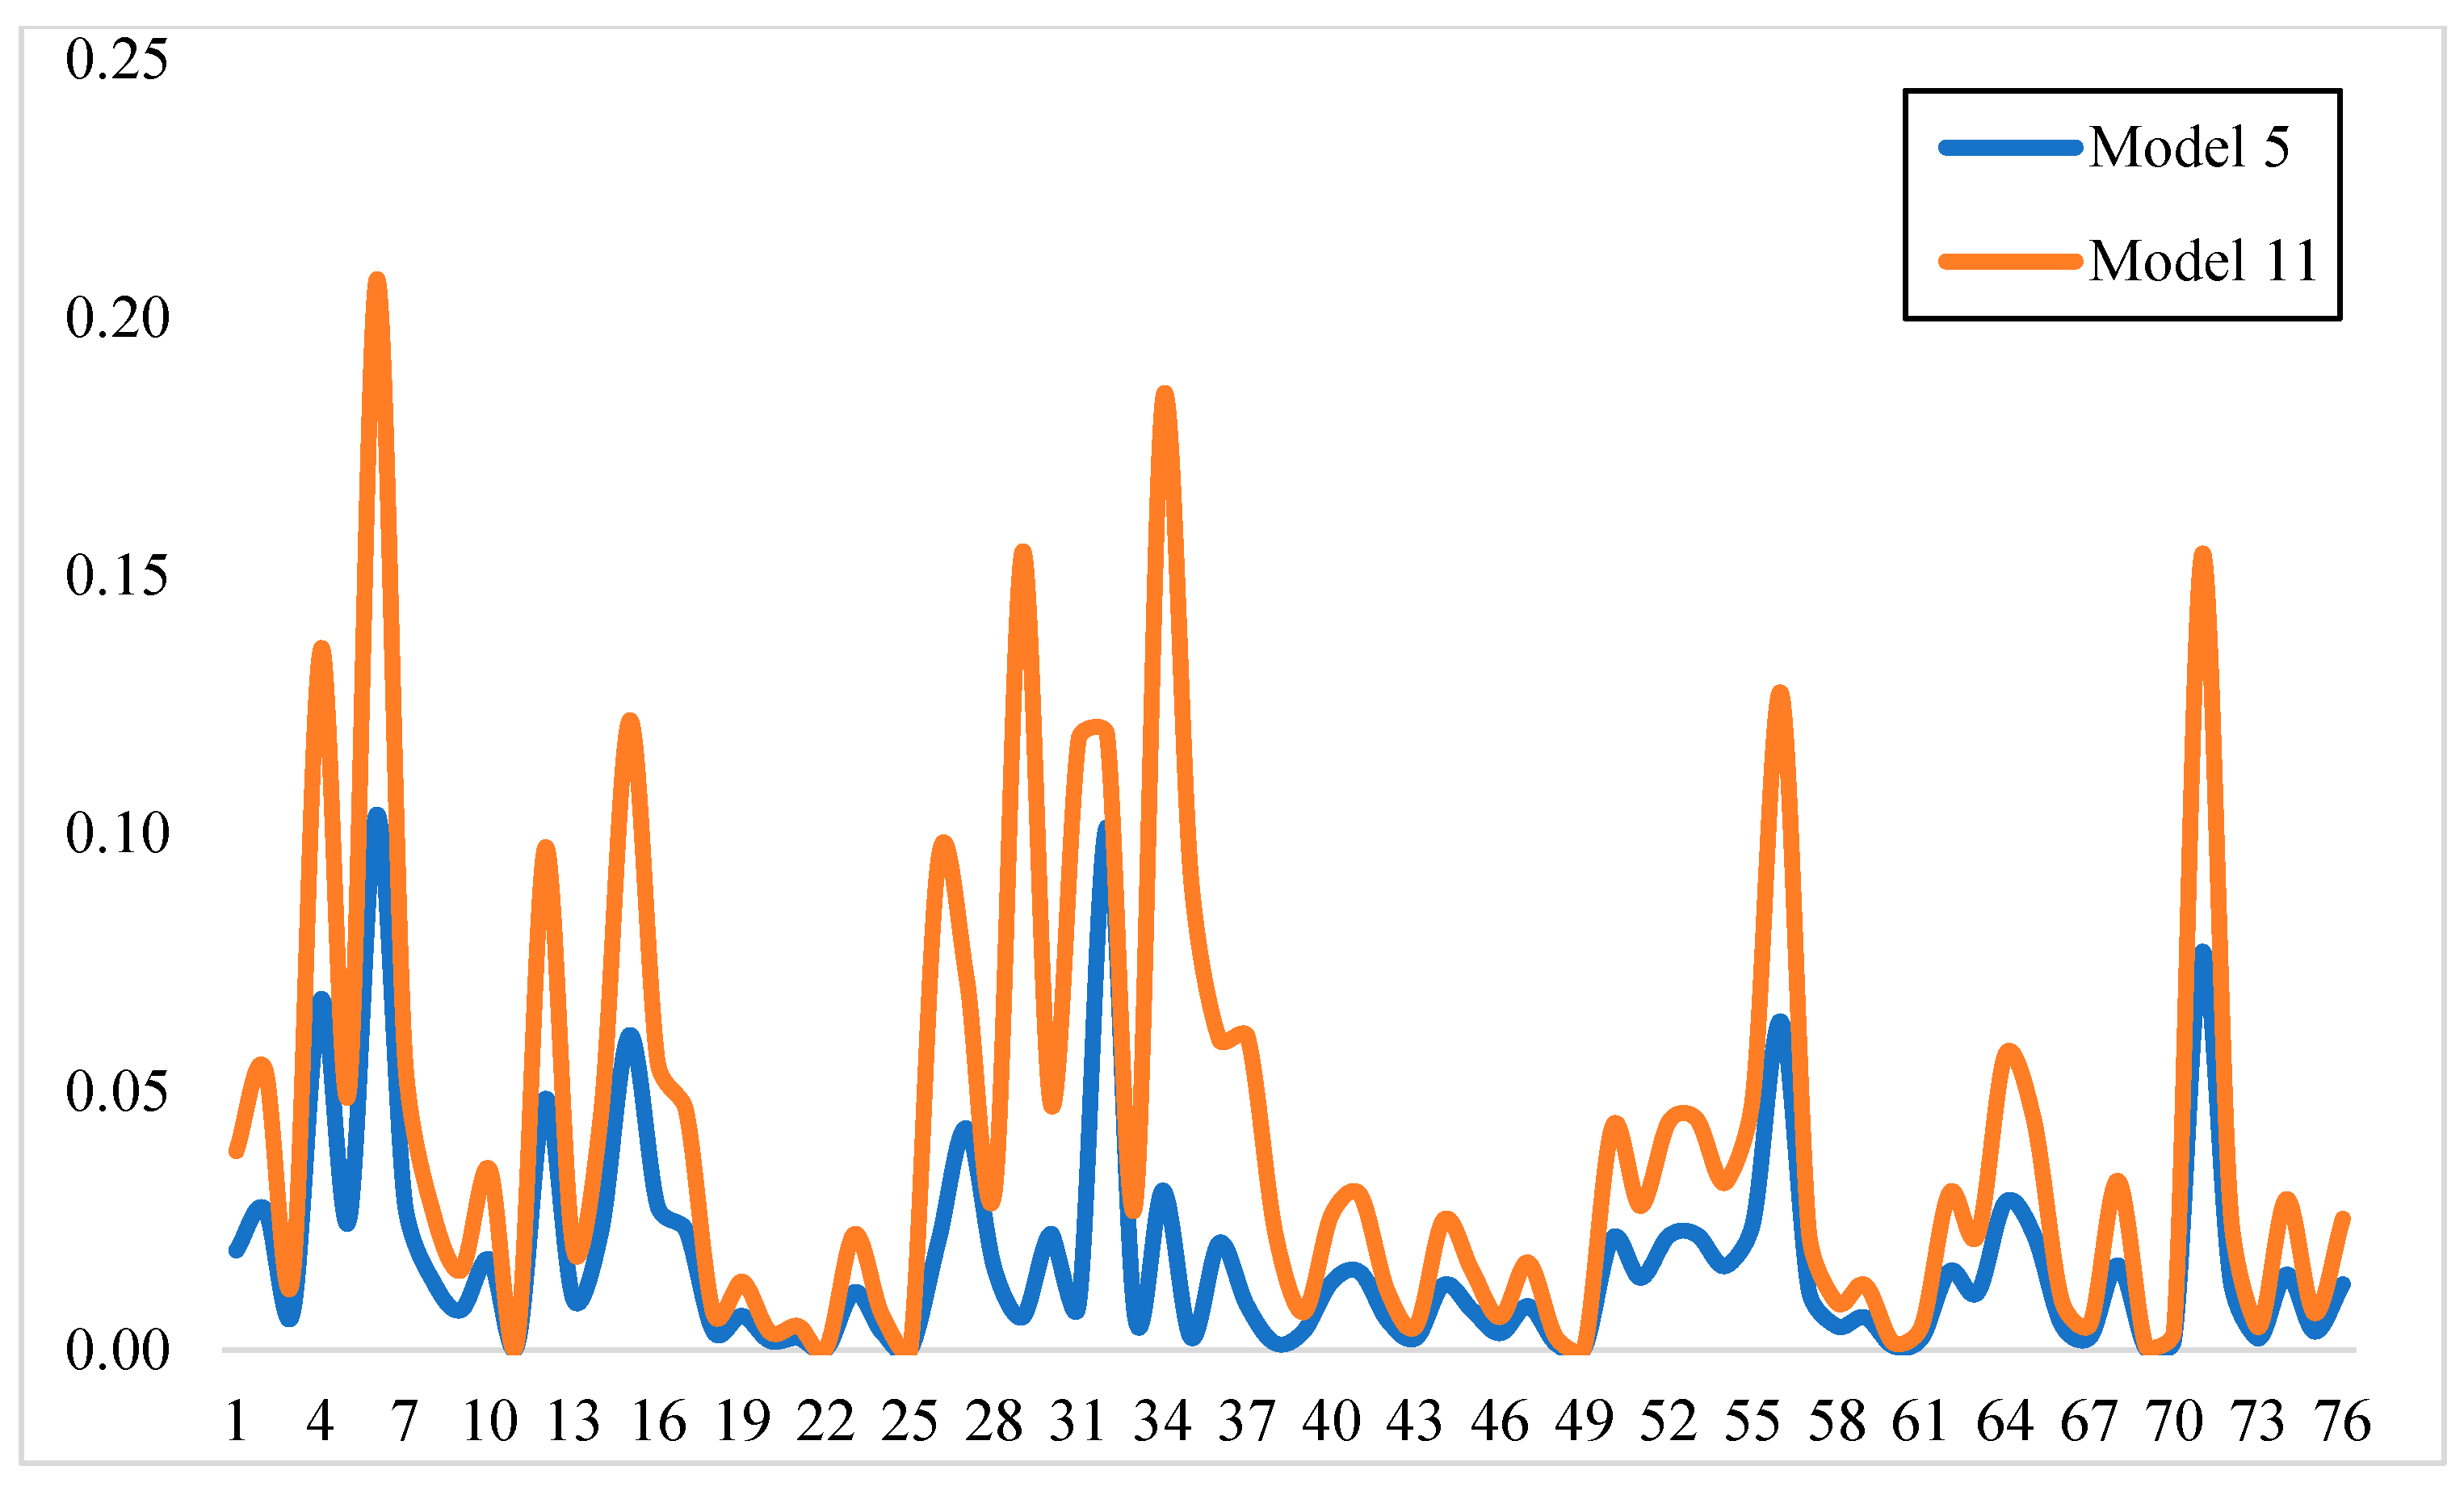
Figure 23 shows the radar design chart of RMSE values for the train and test phase prediction of models 8 to 28, where model 11 represents the lower RMSE value. Similar to Figure 21, Figure 24 demonstrates the regression chart of the training phase for model 11, where the r-squared number is 0.974, which shows a significant accuracy of prediction. In addition, Figure 25 is an analogous chart of error between models 5 and 11, where the chart verifies the slight error for both predictions and the smooth behavior along the entire prediction process.

4. Conclusions

Many advantages of self-consolidating concrete, such as high formability, excellent resistance to segregation, and consolidation without vibration, have increased its popularity for use in concrete structures. Environmental hazards and potential fluidity problems are the major issues that limit the cement consumption of concrete productions. Consequently, finding a new sustainable mix design that incorporates eco-friendly cement replacements has become a fashionable subject, encouraging researchers to investigate natural additives in SCGC. In this study, the analytical and experimental investigations on the mechanical properties of self-consolidating concrete were performed. Moreover, using binary designs compared to ternary ones has the advantage that its preparation process is less arduous, since it requires less precision. Since eco-efficiency is a priority for the concrete industry, the percentages of various alternatives were presented in the form of powders, fresh concrete testing, mechanical properties, and durability, and their optimum percentage and economic evaluation were be examined. As a novel approach, ANFIS was applied to evaluate the impact of different parameters on the compressive strength of concrete. Seven ANFIS models were assigned to investigate the effect of various parameters. In addition, 21 other ANFIS models were considered to examine the impact of combined parameters on the compressive strength of the SCGC in which cement has been partially replaced with pumice, slag, silica fume, and fly ash. The results of this paper can be summarized as follows:
  • The volcanic powder has a significant impact on maintaining SCGC slump optimal performance. However, the superplasticizer demand of VP is greater than the other two powders.
  • The compressive strength of binary designs in the replacement range of 0–30% indicates that GBFS and VP have similar results to the control specimen, which favour compressive strength compared to fly ash.
  • The electrical resistance results of the specimens showed that all three pozzolans had a better performance than the control ones. However, this effect in GBFS and VP were the highest and the lowest values, respectively.
  • Results of the first seven ANFIS models in which parameters were investigated separately showed that electrical resistivity has the most significant influence on the compressive strength of SCGC, as the lowest value of RMSE was obtained for the input corresponding to cement replacements.
  • Among the powders used in this study, ANFIS models revealed that the combination of VP with micro-silica has the highest effect on the resistance of concrete compared with other powders.
  • Results of the second 21 ANFIS models illustrated that the combined use of cement with VP had exerted a far-reaching effect on the compressive strength of the SCGC specimens by resulting in the smallest RMSE among the other coupled parameters.

Author Contributions

Conceptualization, P.M. and B.M.; methodology, E.A.N. and S.H.; software, P.M.; validation, P.M., S.H. and D.Z.; formal analysis, P.M. and B.M.; investigation, E.A.N., S.H. and D.Z.; resources, S.H., D.Z. and B.M.; data curation, B.M.; writing—original draft preparation, P.M.; writing—review and editing, M.U.K., M.S. and P.M.; visualization, E.A.N.; supervision, M.U.K. and M.S.; project administration, M.U.K. and M.S.; funding acquisition, M.U.K. and M.S.; All authors have read and agreed to the published version of the manuscript.

Funding

This research received no external funding.

Acknowledgments

The authors wants to appreciate the centre for infrastructure of Western Sydney University for the guidance and cooperation’s during preparing this paper. The authors present their appreciation to King Saud University for funding this research through the Researchers Supporting Program number (RSP2023R164), King Saud University, Riyadh, Saudi Arabia.

Conflicts of Interest

The authors declare no conflict of interest.

References

  1. Liu, J.; Mohammadi, M.; Zhan, Y.; Zheng, P.; Rashidi, M.; Mehrabi, P. Utilizing Artificial Intelligence to Predict the Superplasticizer Demand of Self-Consolidating Concrete Incorporating Pumice, Slag, and Fly Ash Powders. Materials 2021, 14, 6792. [Google Scholar] [CrossRef] [PubMed]
  2. Zeybek, Ö.; Özkılıç, Y.O.; Karalar, M.; Çelik, A.I.; Qaidi, S.; Ahmad, J.; Burduhos-Nergis, D.D.; Burduhos-Nergis, D.P. Influence of Replacing Cement with Waste Glass on Mechanical Properties of Concrete. Materials 2022, 15, 7513. [Google Scholar] [CrossRef]
  3. Karalar, M.; Özkılıç, Y.O.; Aksoylu, C.; Sabri, M.M.S.; Beskopylny, A.N.; Stel’Makh, S.A.; Shcherban’, E.M. Flexural behavior of reinforced concrete beams using waste marble powder towards application of sustainable concrete. Front. Mater. 2022, 9, 1068791. [Google Scholar] [CrossRef]
  4. Shariati, M.; Rafie, S.; Zandi, Y.; Fooladvand, R.; Gharehaghaj, B.; Mehrabi, P. Experimental investigation on the effect of cementitious materials on fresh and mechanical properties of self-consolidating concrete. Adv. Concr. Constr. 2019, 8, 225–237. [Google Scholar]
  5. Ardalan, R.B.; Joshaghani, A.; Hooton, R.D. Workability retention and compressive strength of self-compacting concrete incorporating pumice powder and silica fume. Constr. Build. Mater. 2017, 134, 116–122. [Google Scholar] [CrossRef]
  6. Karalar, M.; Bilir, T.; Çavuşlu, M.; Özkiliç, Y.O.; Sabri, M.M.S. Use of recycled coal bottom ash in reinforced concrete beams as replacement for aggregate. Front. Mater. 2022, 9, 1064604. [Google Scholar] [CrossRef]
  7. Boukendakdji, O.; Kadri, E.-H.; Kenai, S. Effects of granulated blast furnace slag and superplasticizer type on the fresh properties and compressive strength of self-compacting concrete. Cem. Concr. Compos. 2012, 34, 583–590. [Google Scholar] [CrossRef]
  8. Najaf, E.; Abbasi, H.; Zahrai, S.M. Effect of waste glass powder, microsilica and polypropylene fibers on ductility, flexural and impact strengths of lightweight concrete. Int. J. Struct. Integr. 2022, 13, 511–533. [Google Scholar] [CrossRef]
  9. Çelik, A.İ.; Özkılıç, Y.O.; Zeybek, Ö.; Karalar, M.; Qaidi, S.; Ahmad, J.; Burduhos-Nergis, D.D.; Bejinariu, C. Mechanical Behavior of Crushed Waste Glass as Replacement of Aggregates. Materials 2022, 15, 8093. [Google Scholar] [CrossRef]
  10. Sharma, N.; Sharma, P.; Parashar, A.K. Use of waste glass and demolished brick as coarse aggregate in production of sustainable concrete. Mater. Today Proc. 2022, 62, 4030–4035. [Google Scholar] [CrossRef]
  11. Basaran, B.; Kalkan, I.; Aksoylu, C.; Özkılıç, Y.O.; Sabri, M.M.S. Effects of Waste Powder, Fine and Coarse Marble Aggregates on Concrete Compressive Strength. Sustainability 2022, 14, 14388. [Google Scholar] [CrossRef]
  12. Ren, W.; Xu, J.; Su, H. Dynamic compressive behavior of basalt fiber reinforced concrete after exposure to elevated temperatures. Fire Mater. 2015, 40, 738–755. [Google Scholar] [CrossRef]
  13. Shen, M.; Zhou, L.; Chen, Z.; Shen, Y.; Huang, B.; Lv, J. Effects of basalt powder and silica fume on ultra-high-strength cementitious matrix: A comparative study. Case Stud. Constr. Mater. 2022, 17, e01397. [Google Scholar] [CrossRef]
  14. Bouguerra, A.; Amiri, O.; Aït-Mokhtar, A.; Diop, M.B. Water sorptivity and pore structure of wood–cementitious composites. Mag. Concr. Res. 2002, 54, 103–112. [Google Scholar] [CrossRef]
  15. Ali, B.; Hawreen, A.; Ben Kahla, N.; Amir, M.T.; Azab, M.; Raza, A. A critical review on the utilization of coir (coconut fiber) in cementitious materials. Constr. Build. Mater. 2022, 351, 128957. [Google Scholar] [CrossRef]
  16. Shcherban’, E.M.; Stel’Makh, S.A.; Beskopylny, A.N.; Mailyan, L.R.; Meskhi, B.; Shilov, A.A.; Chernil’Nik, A.; Özkılıç, Y.O.; Aksoylu, C. Normal-Weight Concrete with Improved Stress–Strain Characteristics Reinforced with Dispersed Coconut Fibers. Appl. Sci. 2022, 12, 11734. [Google Scholar] [CrossRef]
  17. Najm, H.M.; Nanayakkara, O.; Ahmad, M.; Sabri, M.M.S. Mechanical Properties, Crack Width, and Propagation of Waste Ceramic Concrete Subjected to Elevated Temperatures: A Comprehensive Study. Materials 2022, 15, 2371. [Google Scholar] [CrossRef]
  18. Meena, R.V.; Jain, J.K.; Chouhan, H.S.; Beniwal, A.S. Use of waste ceramics to produce sustainable concrete: A review. Clean. Mater. 2022, 4, 100085. [Google Scholar] [CrossRef]
  19. Alsaif, A.; Alharbi, Y.R. Strength, durability and shrinkage behaviours of steel fiber reinforced rubberized concrete. Constr. Build. Mater. 2022, 345, 128295. [Google Scholar] [CrossRef]
  20. Bu, C.; Zhu, D.; Lu, X.; Liu, L.; Sun, Y.; Yu, L.; Xiao, T.; Zhang, W. Modification of Rubberized Concrete: A Review. Buildings 2022, 12, 999. [Google Scholar] [CrossRef]
  21. Beskopylny, A.N.; Shcherban’, E.M.; Stel’Makh, S.A.; Meskhi, B.; Shilov, A.A.; Varavka, V.; Evtushenko, A.; Özkılıç, Y.O.; Aksoylu, C.; Karalar, M. Composition Component Influence on Concrete Properties with the Additive of Rubber Tree Seed Shells. Appl. Sci. 2022, 12, 11744. [Google Scholar] [CrossRef]
  22. Toghroli, A.; Mehrabi, P.; Shariati, M.; Trung, N.T.; Jahandari, S.; Rasekh, H. Evaluating the use of recycled concrete aggregate and pozzolanic additives in fiber-reinforced pervious concrete with industrial and recycled fibers. Constr. Build. Mater. 2020, 252, 118997. [Google Scholar] [CrossRef]
  23. Mehrabi, P.; Shariati, M.; Kabirifar, K.; Jarrah, M.; Rasekh, H.; Trung, N.T.; Shariati, A.; Jahandari, S. Effect of pumice powder and nano-clay on the strength and permeability of fiber-reinforced pervious concrete incorporating recycled concrete aggregate. Constr. Build. Mater. 2021, 287, 122652. [Google Scholar] [CrossRef]
  24. Babafemi, A.J.; Sirba, N.; Paul, S.C.; Miah, J. Mechanical and Durability Assessment of Recycled Waste Plastic (Resin8 & PET) Eco-Aggregate Concrete. Sustainability 2022, 14, 5725. [Google Scholar] [CrossRef]
  25. Zeybek, Ö.; Özkılıç, Y.O.; Çelik, A.I.; Deifalla, A.F.; Ahmad, M.; Sabri, M.M.S. Performance evaluation of fiber-reinforced concrete produced with steel fibers extracted from waste tire. Front. Mater. 2022, 9, 692. [Google Scholar] [CrossRef]
  26. Zhang, J.; Wu, Z.; Yu, H.; Ma, H.; Da, B. Mesoscopic Modeling Approach and Application for Steel Fiber Reinforced Concrete under Dynamic Loading: A Review. Engineering 2022, 16, 220–238. [Google Scholar] [CrossRef]
  27. Akhtar, T.; Ali, B.; Ben Kahla, N.; Kurda, R.; Rizwan, M.; Javed, M.M.; Raza, A. Experimental investigation of eco-friendly high strength fiber-reinforced concrete developed with combined incorporation of tyre-steel fiber and fly ash. Constr. Build. Mater. 2021, 314, 125626. [Google Scholar] [CrossRef]
  28. Çelik, A.İ.; Özkılıç, Y.O.; Zeybek, Ö.; Özdöner, N.; Tayeh, B.A. Performance Assessment of Fiber-Reinforced Concrete Produced with Waste Lathe Fibers. Sustainability 2022, 14, 11817. [Google Scholar] [CrossRef]
  29. Khayat, K.; Yahia, A.; Sayed, M. Effect of supplementary cementitious materials on rheological properties, bleeding, and strength of structural grout. ACI Mater. J. 2008, 105, 585. [Google Scholar]
  30. Hwang, K.; Noguchi, T.; Tomosawa, F. Prediction model of compressive strength development of fly-ash concrete. Cem. Concr. Res. 2004, 34, 2269–2276. [Google Scholar] [CrossRef]
  31. Hossain, K.M.A. Volcanic ash and pumice as cement additives: Pozzolanic, alkali-silica reaction and autoclave expansion characteristics. Cem. Concr. Res. 2005, 35, 1141–1144. [Google Scholar] [CrossRef]
  32. Hossain, K.M.A. Performance of volcanic ash and pumice-based blended cements in sulphate and sulphate–chloride environments. Adv. Cem. Res. 2006, 18, 71–82. [Google Scholar] [CrossRef]
  33. Aydin, A.; Gül, R. Influence of volcanic originated natural materials as additives on the setting time and some mechanical properties of concrete. Constr. Build. Mater. 2007, 21, 1277–1281. [Google Scholar] [CrossRef]
  34. Deng, E.-F.; Zhang, Z.; Zhang, C.-X.; Tang, Y.; Wang, W.; Du, Z.-J.; Gao, J.-P. Experimental study on flexural behavior of UHPC wet joint in prefabricated multi-girder bridge. Eng. Struct. 2023, 275, 115314. [Google Scholar] [CrossRef]
  35. Huang, Y.; Zhang, W.; Liu, X. Assessment of Diagonal Macrocrack-Induced Debonding Mechanisms in FRP-Strengthened RC Beams. J. Compos. Constr. 2022, 26, 04022056. [Google Scholar] [CrossRef]
  36. Xu, C. Using genetic algorithms method for the paramount design of reinforced concrete structures. Struct. Eng. Mech. Int. J. 2019, 71, 503–513. [Google Scholar]
  37. Orouji, M.; Najaf, E. Effect of GFRP rebars and polypropylene fibers on flexural strength in high-performance concrete beams with glass powder and microsilica. Case Stud. Constr. Mater. 2023, 18, e01769. [Google Scholar] [CrossRef]
  38. Zhang, Z.; Liang, G.; Niu, Q.; Wang, F.; Chen, J.; Zhao, B.; Ke, L. A Wiener degradation process with drift-based approach of determining target reliability index of concrete structures. Qual. Reliab. Eng. Int. 2022, 38, 3710–3725. [Google Scholar] [CrossRef]
  39. Feng, Y.; Mohammadi, M.; Wang, L.; Rashidi, M.; Mehrabi, P. Application of Artificial Intelligence to Evaluate the Fresh Properties of Self-Consolidating Concrete. Materials 2021, 14, 4885. [Google Scholar] [CrossRef]
  40. Mehrabi, P.; Honarbari, S.; Rafiei, S.; Jahandari, S.; Bidgoli, M.A. Seismic response prediction of FRC rectangular columns using intelligent fuzzy-based hybrid metaheuristic techniques. J. Ambient. Intell. Humaniz. Comput. 2021, 12, 10105–10123. [Google Scholar] [CrossRef]
  41. Taheri, E.; Mehrabi, P.; Rafiei, S.; Samali, B. Numerical Evaluation of the Upright Columns with Partial Reinforcement along with the Utilisation of Neural Networks with Combining Feature-Selection Method to Predict the Load and Displacement. Appl. Sci. 2021, 11, 11056. [Google Scholar] [CrossRef]
  42. Taheri, E.; Firouzianhaji, A.; Usefi, N.; Mehrabi, P.; Ronagh, H.; Samali, B. Investigation of a Method for Strengthening Perforated Cold-Formed Steel Profiles under Compression Loads. Appl. Sci. 2019, 9, 5085. [Google Scholar] [CrossRef] [Green Version]
  43. Taheri, E.; Firouzianhaji, A.; Mehrabi, P.; Hosseini, B.V.; Samali, B. Experimental and Numerical Investigation of a Method for Strengthening Cold-Formed Steel Profiles in Bending. Appl. Sci. 2020, 10, 3855. [Google Scholar] [CrossRef]
  44. Huang, H.; Li, M.; Yuan, Y.; Bai, H. Experimental Research on the Seismic Performance of Precast Concrete Frame with Replaceable Artificial Controllable Plastic Hinges. Eng. Struct. 2023, 149, 04022222. [Google Scholar] [CrossRef]
  45. Fang, B.; Hu, Z.; Shi, T.; Liu, Y.; Wang, X.; Yang, D.; Zhu, K.; Zhao, X.; Zhao, Z. Research progress on the properties and applications of magnesium phosphate cement. Ceram. Int. 2023, 49, 4001–4016. [Google Scholar] [CrossRef]
  46. Sari, P.A.; Suhatril, M.; Osman, N.; Mu’Azu, M.A.; Katebi, J.; Abavisani, A.; Ghaffari, N.; Chahnasir, E.S.; Wakil, K.; Khorami, M.; et al. Developing a hybrid adoptive neuro-fuzzy inference system in predicting safety of factors of slopes subjected to surface eco-protection techniques. Eng. Comput. 2019, 36, 1347–1354. [Google Scholar] [CrossRef]
  47. Shariati, M.; Mafipour, M.S.; Mehrabi, P.; Zandi, Y.; Dehghani, D.; Bahadori, A.; Shariati, A.; Trung, N.T.; Salih, M.N.A.; Poi-Ngian, S. Application of Extreme Learning Machine (ELM) and Genetic Programming (GP) to design steel-concrete composite floor systems at elevated temperatures. Steel Compos. Struct. 2019, 33, 319–332. [Google Scholar]
  48. Shariati, M.; Trung, N.T.; Wakil, K.; Mehrabi, P.; Safa, M.; Khorami, M. Estimation of moment and rotation of steel rack connections using extreme learning machine. Steel Compos. Struct. 2019, 31, 427–435. [Google Scholar]
  49. Shariati, M.; Mafipour, M.S.; Mehrabi, P.; Bahadori, A.; Zandi, Y.; Salih, M.N.A.; Nguyen, H.; Dou, J.; Song, X.; Poi-Ngian, S. Application of a Hybrid Artificial Neural Network-Particle Swarm Optimization (ANN-PSO) Model in Behavior Prediction of Channel Shear Connectors Embedded in Normal and High-Strength Concrete. Appl. Sci. 2019, 9, 5534. [Google Scholar] [CrossRef] [Green Version]
  50. Shariati, M.; Tahmasbi, F.; Mehrabi, P.; Bahadori, A.; Toghroli, A. Monotonic behavior of C and L shaped angle shear connectors within steel-concrete composite beams: An experimental investigation. Steel Compos. Struct. 2020, 35, 237–247. [Google Scholar]
  51. Huang, H.; Li, M.; Yuan, Y.; Bai, H. Theoretical analysis on the lateral drift of precast concrete frame with replaceable artificial controllable plastic hinges. J. Build. Eng. 2022, 62, 105386. [Google Scholar] [CrossRef]
  52. Hossain, K.M.; Lachemi, M. Development of volcanic ash concrete: Strength, durability, and microstructural investigations. ACI Mater. J. 2006, 103, 11. [Google Scholar]
  53. Bheel, N.; Keerio, M.A.; Kumar, A.; Shahzaib, J.; Ali, Z.; Ali, M.; Sohu, S. An Investigation on Fresh and Hardened Properties of Concrete Blended with Rice Husk Ash as Cementitious Ingredient and Coal Bottom Ash as Sand Replacement Material. Silicon 2021, 14, 677–688. [Google Scholar] [CrossRef]
  54. Bheel, N.; Memon, F.A.; Meghwar, S.L. Study of Fresh and Hardened Properties of Concrete Using Cement with Modified Blend of Millet Husk Ash as Secondary Cementitious Material. Silicon 2020, 13, 4641–4652. [Google Scholar] [CrossRef]
  55. Zhang, C.; Ali, A. The advancement of seismic isolation and energy dissipation mechanisms based on friction. Soil Dyn. Earthq. Eng. 2021, 146, 106746. [Google Scholar] [CrossRef]
  56. Dong, Z.; Quan, W.; Ma, X.; Li, X.; Zhou, J. Asymptotic homogenization of effective thermal-elastic properties of concrete considering its three-dimensional mesostructure. Comput. Struct. 2023, 279, 106970. [Google Scholar] [CrossRef]
  57. Cervantes, V.; Roesler, J. Ground Granulated Blast Furnace Slag; Technical Note; Center of Excellence for Airport Technology: Urbana, IL, USA, 2007; pp. 1–4. [Google Scholar]
  58. Karri, S.K.; Rao, G.R.; Raju, P.M. Strength and durability studies on GGBS concrete. SSRG Int. J. Civ. Eng. 2015, 2, 34–41. [Google Scholar] [CrossRef]
  59. Raman, J.M.; Krishnan, V. Partial Replacement of Cement with GGBS in Self Compacting Concrete for Sustainable Construction. Int. J. Civ. Eng. 2017, 4, 24–28. [Google Scholar] [CrossRef] [Green Version]
  60. Hossain, K.M. Blended cement using volcanic ash and pumice. Cem. Concr. Res. 2003, 33, 1601–1605. [Google Scholar] [CrossRef]
  61. Güneyisi, E.; Gesoglu, M.; Al-Rawi, S.; Mermerdaş, K. Effect of volcanic pumice powder on the fresh properties of self-compacting concretes with and without silica fume. Mater. Struct. 2013, 47, 1857–1865. [Google Scholar] [CrossRef]
  62. Li, W.; Luo, Z.; Tao, Z.; Duan, W.H.; Shah, S.P. Mechanical behavior of recycled aggregate concrete-filled steel tube stub columns after exposure to elevated temperatures. Constr. Build. Mater. 2017, 146, 571–581. [Google Scholar] [CrossRef]
  63. Hung, C.-C.; Chang, J.-N.; Wang, H.-Y.; Wen, F.-L. Effect of Adding Waste Polyethylene and GGBFS on the Engineering Properties of Cement Mortar. Appl. Sci. 2022, 12, 12665. [Google Scholar] [CrossRef]
  64. Vittalaiah, A.; Ravinder, R.; Kumar, C.V. Study on effect of strength and durability parameters and performance of Self Compacting Concrete replacement with GGBS at different dosages. E3S Web Conf. 2020, 184, 01106. [Google Scholar] [CrossRef]
  65. Khotbehsara, M.M.; Miyandehi, B.M.; Naseri, F.; Ozbakkaloglu, T.; Jafari, F.; Mohseni, E. Effect of SnO2, ZrO2, and CaCO3 nanoparticles on water transport and durability properties of self-compacting mortar containing fly ash: Experimental observations and ANFIS predictions. Constr. Build. Mater. 2018, 158, 823–834. [Google Scholar] [CrossRef]
  66. Cheng-Yi, H.; Feldman, R. Hydration reactions in portland cement-silica fume blends. Cem. Concr. Res. 1985, 15, 585–592. [Google Scholar] [CrossRef] [Green Version]
  67. Cohen, M. A look at silica fume and its actions in Portland cement concrete. Indian Concr. J. 1990, 64, 429–438. [Google Scholar]
  68. Mehdizadeh, B.; Jahandari, S.; Vessalas, K.; Miraki, H.; Rasekh, H.; Samali, B. Fresh, Mechanical, and Durability Properties of Self-Compacting Mortar Incorporating Alumina Nanoparticles and Rice Husk Ash. Materials 2021, 14, 6778. [Google Scholar] [CrossRef] [PubMed]
Figure 1. Grading diagrams based on passing percentage for (a) fine aggregates, (b) coarse aggregates.
Sustainability 15 04752 g001
Figure 2. Cube test specimens.
Sustainability 15 04752 g002
Figure 3. Fuzzification process in ANFIS algorithm.
Sustainability 15 04752 g003
Figure 4. ANFIS layers.
Sustainability 15 04752 g004
Figure 5. Slump spread diagrams for SCGCs contain VP.
Sustainability 15 04752 g005
Figure 6. Slump value chart for binary samples.
Sustainability 15 04752 g006
Figure 7. Slump value chart for ternary samples.
Sustainability 15 04752 g007
Figure 8. Experimental set-up.
Sustainability 15 04752 g008
Figure 9. Relative compressive strength (percent of Ctrl) of the samples at 7 days.
Sustainability 15 04752 g009
Figure 10. Relative compressive strength (percent of Ctrl) of the samples at 28 days.
Sustainability 15 04752 g010
Figure 11. Relative compressive strength (percent of Ctrl) of the samples at 90 days.
Sustainability 15 04752 g011
Figure 12. Compressive strength of ternary samples in 7, 28, and 90 days.
Sustainability 15 04752 g012
Figure 13. Water absorption of VP mixtures.
Sustainability 15 04752 g013
Figure 14. Water absorption of GGBFS mixtures.
Sustainability 15 04752 g014
Figure 15. Water absorption of FA mixtures.
Sustainability 15 04752 g015
Figure 16. Comparative column chart of 24 h water absorption of different SCMs and addition levels.
Sustainability 15 04752 g016
Figure 17. Water absorption of ternary SCC mixtures.
Sustainability 15 04752 g017
Figure 18. Electrical resistivity test set-up.
Sustainability 15 04752 g018
Figure 19. Electrical resistivity in order of SCM addition level.
Sustainability 15 04752 g019
Figure 20. Electrical resistivity of ternary mixtures.
Sustainability 15 04752 g020
Figure 21. Train and test RSMEs for separate inputs.
Sustainability 15 04752 g021
Figure 22. Model 5 train phase regression for compressive strength prediction.
Sustainability 15 04752 g022
Figure 23. Train and test RSMEs for separate inputs.
Sustainability 15 04752 g023
Figure 24. Model 11 train phase regression for compressive strength prediction.
Sustainability 15 04752 g024
Figure 25. Error stacked line charts for model 5 and model 11 predictions.
Sustainability 15 04752 g025
Table 1. Physical properties of raw materials.
IngredientsDensity (kg/m3)Fineness (m2/kg)Type
Properties
Cement3160290Portland (II)
Coarse aggregate2500-ASTM C33
Fine aggregate27003.6ASTM C33
High-range water reducing admixture (HWRA)1070-Polycarboxylate Ether
Table 2. Raw material components and oxide composition.
MaterialSiO2Al2O3Fe2O3CaOMgOSO3G *S **
Components (%)
Fly ash62.7945.890.932.591.400.4922000.26
GBFS33.0913.783.1340.708.700.6028500.445
Micro-silica86.191.430.193.071.320.34235030
Volcanic powder44.1416.701.7311.081.950.3928300.32
Cement22.414.693.6963.263.631.7431600.42
*: specific weight (kg/m3), **: specific surface area (m2·g−1).
Table 3. SCC proportions for binary binder mixtures.
SpecimenAggregate
(kg/m3)
Binder (kg/m3)
ProportionFineCoarseCementVolcanic PumiceMicro-SilicaGGBFSFly Ash
GBFS101072595450--50-
GBFS201069594400--100-
GBFS301066592350--150-
GBFS401063590300--200-
GBFS501069580250--250-
VP10107259545050---
VP201069594400100---
VP301066592350150---
VP401063590300200---
VP501060589250250---
FA101063590450---50
FA201052584400---100
FA301040578350---150
FA401029571300---200
FA501017565250---250
Table 4. SCC proportions for ternary binder mixtures.
SpecimenAggregate
(kg/m3)
Binder (kg/m3)
ProportionFineCoarseCementVolcanic PumiceMicro-Silica
VP5-MS510645764502525
VP10-MS1010475854005050
VP25-MS5103958035012525
VP30-MS10106659230015050
VP40-MS10105158425025050
VP45-MS5105758725022525
Table 5. Input and output parameters.
Inputs and OutputParameters Description
Input 1Volcanic powder (kg/m3)
Input 2Micro-silica (kg/m3)
Input 3Fly ash (kg/m3)
Input 4Furnace slag (kg/m3)
Input 5Electrical resistivity (ohm-meter)
Input 6Water absorption (%)
Input 7Cement (kg/m3)
OutputCompressive strength (MPa)
Table 6. Slump flow of SCC mixtures.
SpecimenSlump Value (cm)
3 min10 min20 min30 min40 min50 min
Ctrl-FA526462605450
FA10666463615956.5
FA204663626058.555
FA30556661595755
FA40526560575453
FA50556360575451.5
Ctrl-GBFS426559555350
GBFS10676663595653
GBFS20686662575553
GBFS30586562595754
GBFS40666463595452
GBFS50586563625957
Ctrl-VP52656361 6054
VP1066666563 61 59
VP2046646665 62 60
VP3055656666 62 60
VP4052656667 63 60
VP5055656668 65 61
Ctrl-ternary536558575453
VP5-MS5556563595449
VP10-MS10526560555043
VP25-MS5596559565653
VP30-MS10606566626056
VP40-MS10446561575549
VP45-MS5536564615452
Table 7. Compressive strength of SCC mixtures.
SpecimenCompressive Strength (MPa)
Value7 days28 days90 days
Ctrl-FA31.746.755.3
FA10%29.346.653.1
FA20%26.245.351.5
FA30%25.243.050.0
FA40%23.136.048.4
FA50%15.532.839.0
Ctrl-GBFS36.144.748.9
GBFS10%35.245.247.3
GBFS20%34.745.849.0
GBFS30%34.546.250.5
GBFS40%31.138.443.1
GBFS50%25.137.444.4
Ctrl-VP31.738.349.3
VP10%31.037.249.0
VP20%29.036.048.8
VP30%23.835.045.8
VP40%21.631.739.0
VP50%16.427.838.7
Ctrl-ternary41.346.648.0
VP5-MS530.240.246.2
VP10-MS1037.343.849.1
VP25-MS539.743.054.0
VP30-MS1040.152.459.2
VP40-MS1035.254.058.3
VP45-MS532.140.851.4
Table 8. Training and testing RMSEs of the separate input parameters.
NameCompositionRMSE
TrainTest
Model 1Input 16.92915.8419
Model 2Input 26.99135.8988
Model 3Input 35.47516.959
Model 4Input 46.56717.0164
Model 5Input 54.81025.1792
Model 6Input 6 5.6827.2819
Model 7Input 75.49286.4055
Table 9. Training and testing RMSEs of the coupled input parameters.
NameCompositionRMSE
TrainTest
Model 8Input 1 & Input 25.42124.0932
Model 9Input 1 & Input 35.94754.5269
Model 10Input 1 & Input 46.28035.7961
Model 11Input 1 & Input 52.17213.4315
Model 12Input 1 & Input 64.12145.9134
Model 13Input 1 & Input 74.14523.8691
Model 14Input 2 & Input 35.43124.8613
Model 15Input 2 & Input 45.71025.2212
Model 16Input 2 & Input 54.05103.3129
Model 17Input 2 & Input 68.98124.2554
Model 18Input 2 & Input 74.92136.99102
Model 19Input 3 & Input 45.53105.8312
Model 20Input 3 & Input 54.01275.5146
Model 21Input 3 & Input 64.66135.6517
Model 22Input 3 & Input 74.16325.2813
Model 23Input 4 & Input 54.63125.2813
Model 24Input 4 & Input 66.67475.6147
Model 25Input 4 & Input 75.48317.0815
Model 26Input 5 & Input 63.45194.1035
Model 27Input 5 & Input 73.45184.1014
Model 28Input 6 & Input 73.83154.3315
Disclaimer/Publisher’s Note: The statements, opinions and data contained in all publications are solely those of the individual author(s) and contributor(s) and not of MDPI and/or the editor(s). MDPI and/or the editor(s) disclaim responsibility for any injury to people or property resulting from any ideas, methods, instructions or products referred to in the content.