Article

Analysis of the Spatial and Temporal Variability and Factors Influencing the Ecological Resilience in the Urban Agglomeration on the Northern Slope of Tianshan Mountain

1
State Key Laboratory of Desert and Oasis Ecology, Key Laboratory of Ecological Safety and Sustainable Development in Arid Lands, Xinjiang Institute of Ecology and Geography, Chinese Academy of Sciences, Urumqi 830011, China
2
College of Resources and Environment, University of Chinese Academy of Sciences, Beijing 100049, China
3
The Institute of Geology and Geophysics, Chinese Academy of Sciences, Beijing 100029, China
*
Author to whom correspondence should be addressed.
Sustainability 2023, 15(6), 4828; https://doi.org/10.3390/su15064828
Submission received: 1 February 2023 / Revised: 7 March 2023 / Accepted: 7 March 2023 / Published: 8 March 2023

Abstract

:
Based on land-use change data, this paper constructed an ecological resilience evaluation model from the three dimensions of resistance, adaptability, and regeneration capacity. The spatial and temporal evolution characteristics of the ecological resilience of urban agglomeration on the northern slope of Tianshan Mountain (UANST) from 1990 to 2020 were studied. The key factors affecting the spatial distribution of ecological resilience were detected. The results showed that (1) from 1990 to 2020, the mean ecological resilience values of the UANST were 0.3371, 0.3326, 0.3330, and 0.3240, showing an overall decreasing trend. The regions with low and medium values of ecological resilience contributed the most to these values. (2) The spatial distribution of the ecological resilience of the UANST was uneven, showing a “sandwich”-type distribution with low values in the south and north of the study area and high values in the middle of the study area. During the study period, the ecological resilience in the north part of the study area declined overall, while the ecological resilience in the south part of the study area increased continuously. (3) The results of the Geodetector model showed that natural and human factors jointly influenced the spatial distribution of the ecological resilience of the UANST, with natural factors dominating and temperature changes being the most sensitive. Finally, the impact of intense human activities on the ecological resilience of the UANST is increasing.

1. Introduction

Resilience is the capacity of a system, whether an individual, forest, city, or economy, to deal with change and continue to develop [1]. In the late 1960s, Canadian ecologist Holling proposed the terms ecosystem resilience and stability [2]. Ecological resilience describes the persistence or plasticity of natural systems in response to disturbances such as external natural elements and anthropogenic factors [3,4]. It is mainly used to indicate the response of regional ecosystems to environmental disturbances and measure the ability of ecosystems to reorganize spontaneously after experiencing a disturbance [5,6]. With global climate change and the rapid expansion of urbanization, ecosystems are facing increased uncertainties and unknown risks [7]. Resilience has a positive impact on diversity and sustainability and plays a key role in determining the ecology of an area [8]. The United Nations Office for Disaster Risk Reduction’s “Ten Indicators for More Resilient Cities” includes “protecting urban ecosystems and natural barriers”, reflecting the important effect of resilience on urban ecosystems [9]. Currently, the world is in a stage of rapid urbanization, and urban agglomerations have the important role of developing the economic center of gravity, with their statuses and roles becoming increasingly prominent [10]. However, during the development of urban agglomerations, human activities, such as population growth, a surge in the urban expansion rate, an increase in resource demand, and increased emissions of sewage, harmful gas, and solid waste may accelerate the overexploitation of natural resources, environmental pollution, and ecological deficits [11,12]. Kalnay and Cai discussed the expansion of urban agglomerations due to urbanization and its impact on climate change [13]. McMichael pointed out that “urbanization will endanger human habitat and health in a significant form. The expansion of urban agglomerations, the growth of industries and the increase in their populations have put many pressures on local water resources and ecosystems” [14]. Grimm et al. stated that global large-scale urbanization areas (i.e., urban agglomerations) had become the focus of ecological and environmental problems [15]. The formation and development of urban agglomerations are posing great challenges in terms of regional resource consumption and ecosystem stability [16,17].
China is focused on green development in regions and urban agglomerations under the concept of ecological priority and green development. China has actively promoted the development of urban agglomerations since 2015, and it regards them as the main areas of new national urbanization and as strategic core areas of economic development. Moreover, the development of urban agglomerations plays an irreplaceable and important role in improving the construction of urbanization in China [18]. The urban agglomeration on the northern slope of Tianshan Mountain is hereafter referred to as the UANST. The UANST is located in the northern Xinjiang region and is one of the 19 key urban agglomerations in China [19]. However, as a typical oasis urban agglomeration, the UANST faces problems in terms of its ecological environment, such as water resource scarcity, a fragile ecological environment, and sensitivity to land-use changes [19]. Compared with urban agglomerations in China’s inland and coastal areas, the UANST lacks competitiveness in terms of urbanization and its resource and ecological carrying capacities. Additionally, it will face great challenges in terms of these carrying capacities in the future, which will restrict sustainable socioeconomic development [20,21]. Since the 20th century, many scholars have carried out studies related to the UANST, initially focusing on the regional spatial structure, economic linkages, and the urban ecological niche [22,23,24]. In the past three years, the ecological environment of the UANST has received increased attention, and relevant scholars have explored the path of sustainable development of the UANST from the perspectives of atmospheric environmental change, land use transfer, habitat quality evolution, ecosystem service value (ESV) identification, and the water resource carrying capacity. For the future development of the UANST, the sensitivity and carrying capacity of the fragile ecological environment need to be considered [19,25,26,27].
Summarizing the existing studies, we note that these studies have focused on analyzing the evolution of the ecological environment of the urban agglomeration and its influencing factors from a single perspective and factor. However, in the face of a changing external environment, research on ecological and environmental changes under a single perspective and factors can no longer meet the purpose of identifying ways to mitigate losses in the face of unknown ecological risks. There has been a lack of exploration of the ecological and environmental evolution of urban agglomerations from systematic and multifactor perspectives. Studies that integrate multiple factors and consider the spatial variation and factors influencing the ecological resilience level in urban agglomerations from a resilience perspective are even rarer. Ecological resilience evaluations can provide a new perspective for urban agglomerations, allowing loss mitigation methods to be identified in the face of unknown future ecological risks. Most of the existing urban resilience studies have considered economic resilience [28] and social resilience [29] as the entry perspectives, while less focus has been paid to ecological resilience. The use of an urban ecological resilience evaluation could theoretically provide an improvement over the urban resilience evaluation. Ecological resilience can reflect the effects of changes in natural conditions and intensive human behaviors on the ecosystem. This includes effects on multiple aspects of resistance, adaptability, and recovery. Furthermore, after clarifying the state of regional ecological resilience and identifying the influencing factors, it may be possible to resolve risks in advance and improve the development potential of urban agglomerations.
However, with respect to previous evaluation studies on ecological resilience, it is easy to conceptualize ecological resilience but difficult to operationalize [30]. Most researchers would agree that resilience cannot be captured by a single number [31] and that multiple metrics should be used to provide a composite assessment [32]. However, it is unclear which metrics should be used. Therefore, we investigated the approaches used by a large number of scholars to assess urban resilience and urban ecological resilience. We aim to further enhance the scientific feasibility of urban ecological resilience assessment based on these studies. Scholars have tried to assess urban resilience with different scales, perspectives, and indicator systems [33,34,35,36,37,38]. It is generally accepted that urban resilience refers to the ability of cities to resist, absorb, adapt, and respond effectively to hazards in a timely manner [34,36]. This is a further elaboration of urban resilience based on the definition of resilience. Previous research has compared the urban environment to a complete system. It has subdivided the process by which an urban system copes with change into three stages: resist, absorb, and adapt. Through this process, the goals of coping with change and sustainable development can be achieved in an urban system. Therefore, “resistance, adaptability, and recovery” are the three key components used to assess urban resilience [33,38,39]. A study by Xia et al. pointed out that the three aspects of urban ecological resilience must be characterized by different indicators to reflect the comprehensive nature of ecological resilience. They assessed the changes in ecological resilience in Hangzhou, a coastal city in China, over the past 20 years in terms of its resistance, adaptability, and recovery [39]. This paper mainly refers to the method used by Xia et al. to assess urban ecological resilience and further optimizes the assessment method by introducing habitat quality into the ecological resilience evaluation system. The habitat quality index can be used to characterize the quality of the ecological environment and evaluate the level of biodiversity in the study area, reflecting the genetic variation and potential of species in the reproduction process [40,41]. It can reflect the sustainability of the environment and species and allow a more comprehensive assessment of ecological resilience. Through an empirical study of an arid region, the generalizability of this assessment method is verified. This study evaluates the ecological resilience level of the UANST from 1990 to 2020 based on land-use data and reveals the spatial and temporal variation patterns and influencing factors. The results provide reference suggestions for the construction and ecological protection of the UANST as well as a reference for the urban ecological protection and sustainable development of other urban agglomerations in arid zones.

2. Study Area, Data Sources, and Methods

2.1. Study Area

The UANST is located in the hinterland of Asia and Europe at the northern foot of the Tianshan Mountains and at the southern edge of the Junggar Basin. It is a developing urban agglomeration in the inland arid region of northwestern China, and it has a total area of 215,400 km², accounting for 13% of the total area of Xinjiang. The region’s spatial scope includes three prefecture-level cities, six county-level cities, nine counties, and other regions (Figure 1).
As an inland urban agglomeration in Northwest China, the urbanization process of the UANST was late to start. Still, the area has developed fast, and the UANST is now the core area of economic development for future urbanization in Xinjiang [19]. Here, the urbanization rate is expressed as the proportion of the urban population to the total population, and data were obtained from the Xinjiang Statistical Yearbook (1991–2021). During the study period (Figure 2), the urbanization rate of the UANST increased from 37.88% in 1990 to 68.63% in 2020. This increase shows that the UANST was in the mid-urbanization accelerated development stage, in which significant outward expansion of construction land and the occupation of a large number of ecological lands, such as grassland and woodland, occurred. Such processes can easily trigger many problems, such as degradation of the habitat quality and ecological environment [19]. However, vulnerability is the most obvious characteristic of the ecological environment in arid regions [26], and to achieve the sustainable development of urban agglomerations in the future, it will be necessary to resolve various ecological risks and challenges in advance and enhance the ecological resilience of cities. Therefore, studying the spatial and temporal changes of ecological resilience and the factors influencing the UANST as a case study has great significance. The number and size of grids in a study area influence the study results. Within a fixed study area, the more grids there are, the smaller the grids are, and the richer the information obtained is. However, once the number of grids exceeds a certain range, the visualization effect is poor, and the data are not suitable for further analysis. Therefore, to characterize the spatial distribution of ecological resilience reasonably in the study area, we divided the study area into 3 km, 5 km, 6 km, and 10 km grids for a trial and found that the 6 km grid scale was most suitable for the analysis and demonstration. Thus, we divided the study area into 6 km × 6 km grid cells.

2.2. Data Collection and Preprocessing

In this study, the land-use data were used to calculate the ecological resilience of the UANST. Topographic data, temperature and precipitation data, GDP data, traffic data, population density data, and nighttime light data were used to evaluate the influence of ecological resilience. The data sources are shown in Table 1.

2.3. Method

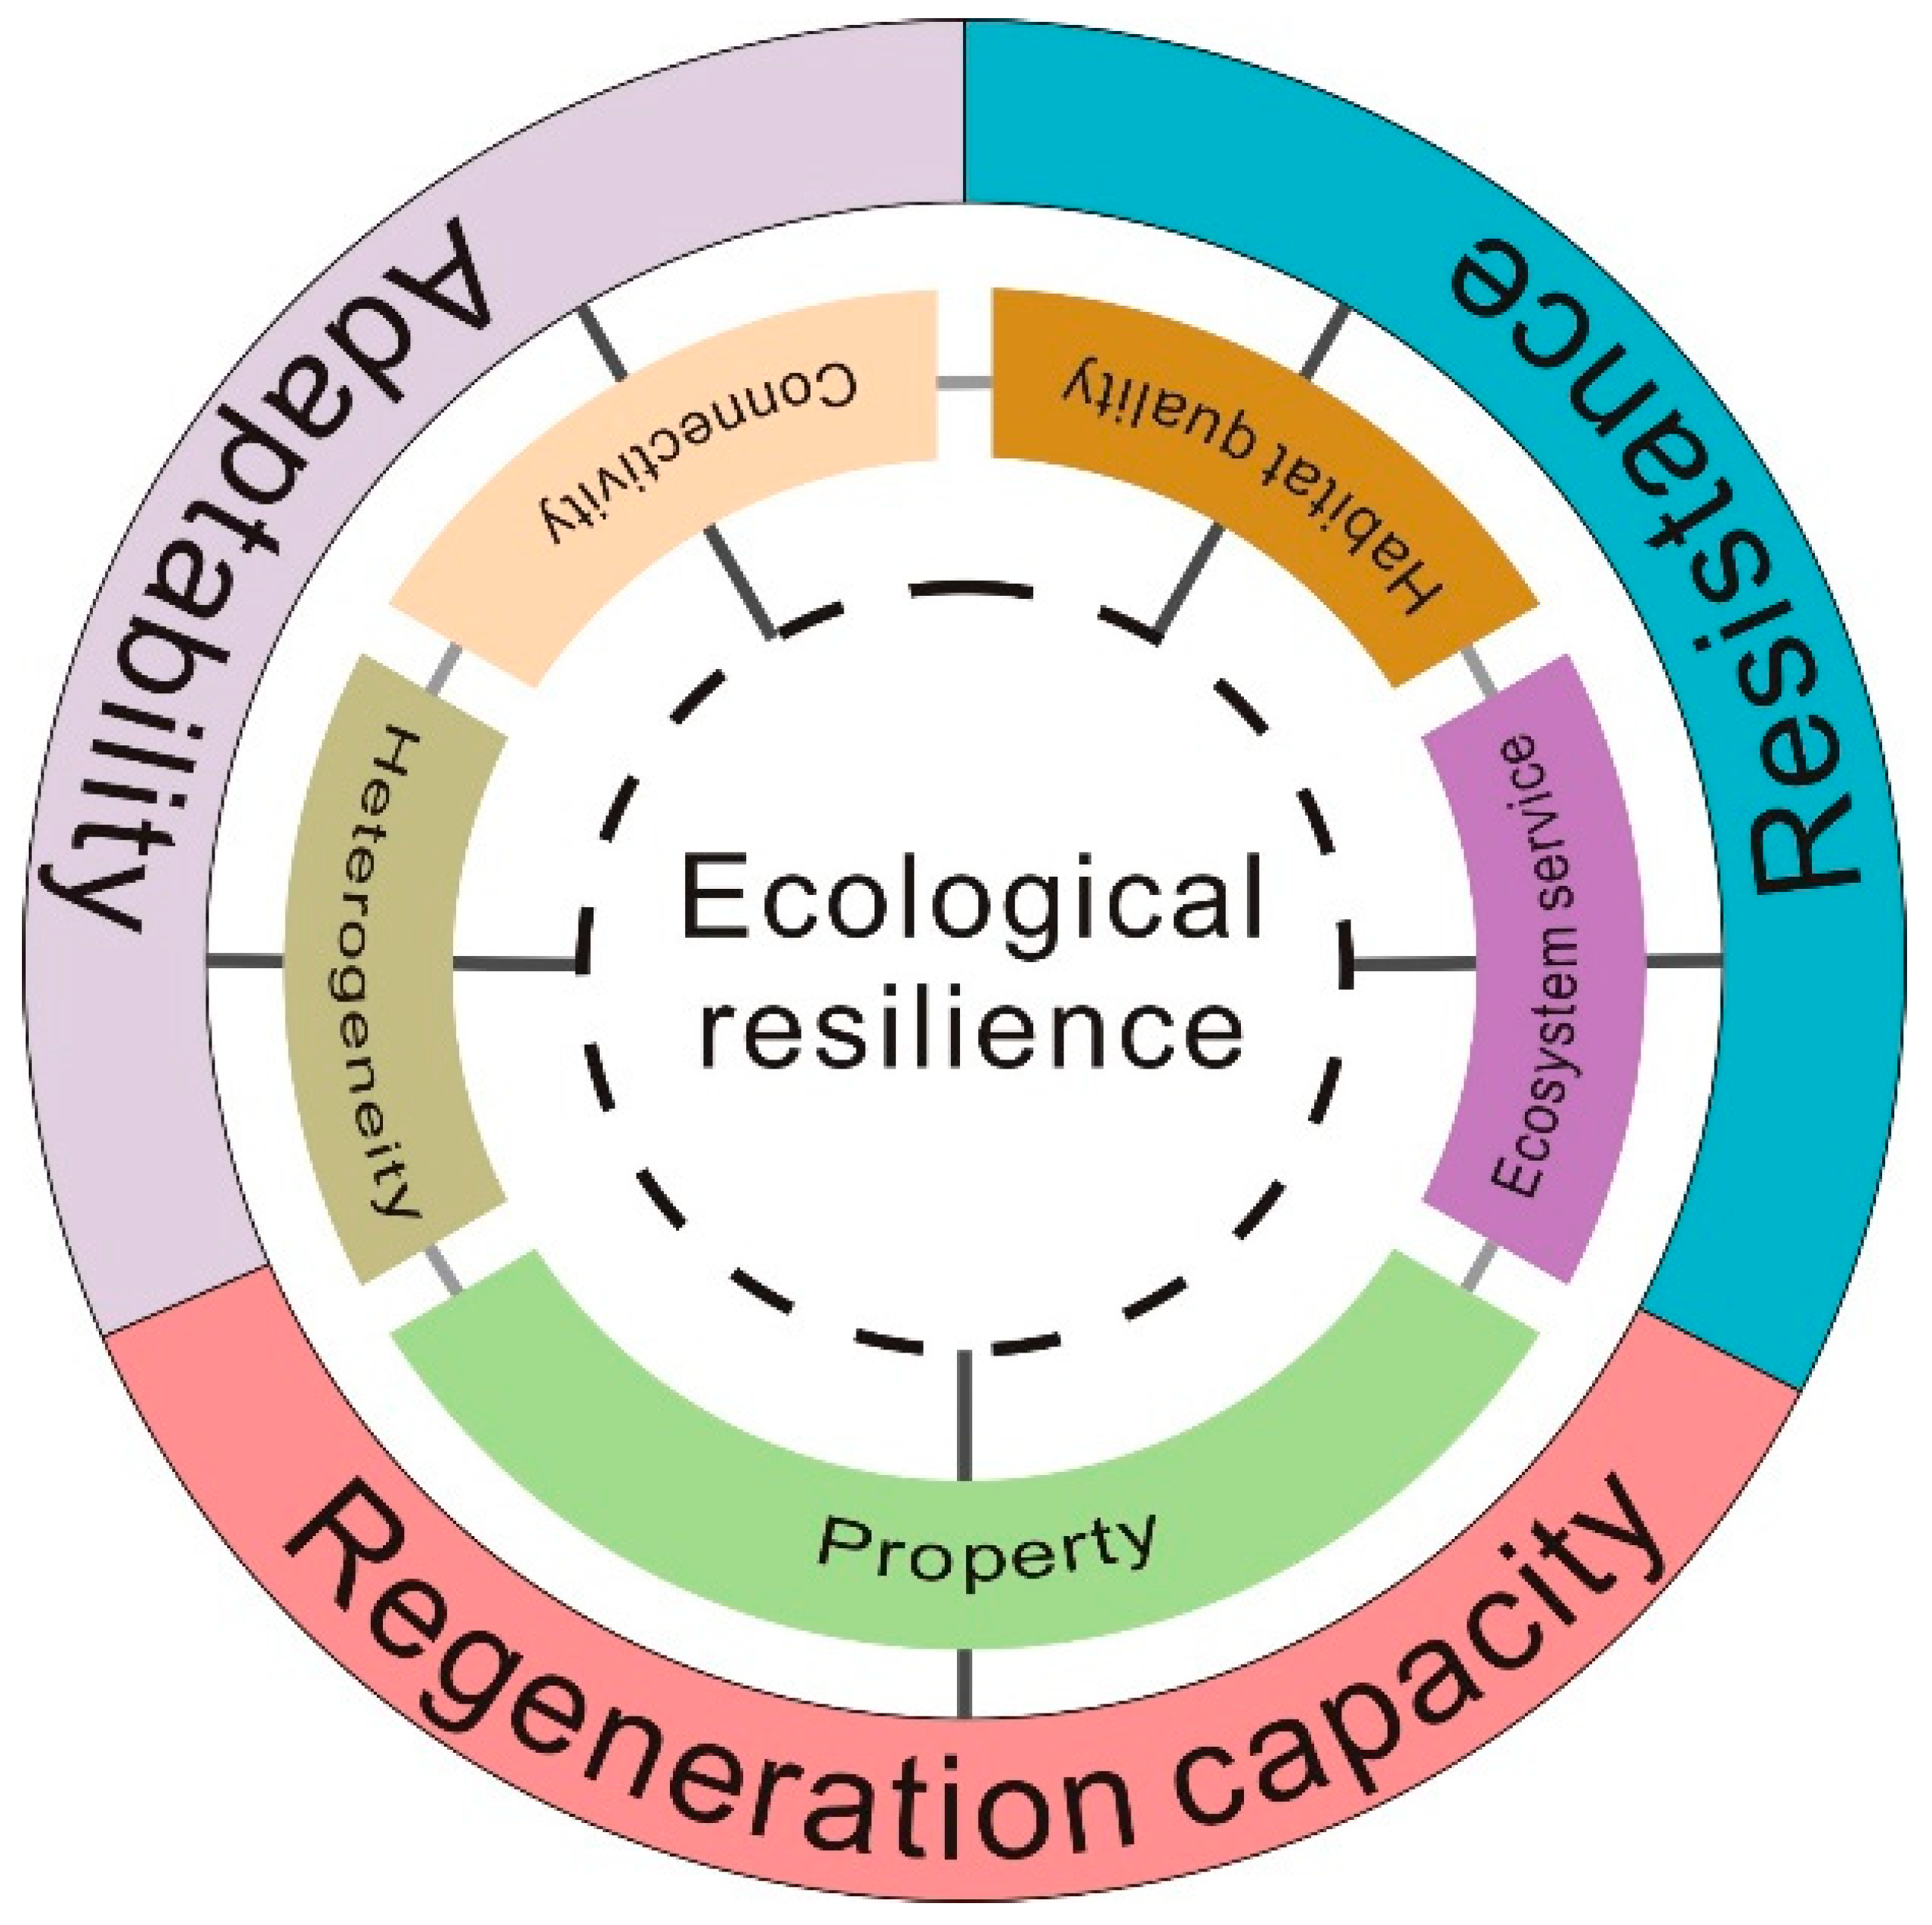
2.3.1. Ecological Resilience Measurement Model

Based on the definitions of resilience and ecological resilience presented by the Stockholm Resilience Centre and Holling, combined with information contained in empirical studies on urban resilience and urban ecological resilience, we consider urban resilience to reflect the ability of cities to resist, absorb, adapt quickly, and respond effectively to interference in a timely manner. Urban ecological resilience is an aspect of urban resilience research, and “resistance, adaptability, and recoverability” are the three key components used to assess urban ecological resilience [39]. The UANST is a typical oasis of urban agglomeration with scarce water resources, a fragile ecological environment, and high sensitivity to land-use changes. Under the pressure of rapid socioeconomic development, ecological resilience is influenced by both natural background conditions and human activities. Based on land-use change data, in this study, we constructed an ecological resilience assessment model for urban agglomerations considering the influences of multiple factors from three aspects of ecological resilience: resistance, adaptability, and regeneration capacity (Figure 3).
Resistance is the basic component of ecological resilience. It emphasizes the ability of the existing ecological background to resist unexpected disasters and events. That is, the good or bad condition of the ecological background determines the level of resistance of the ecological resilience system. In this study, resistance consists of two evaluation indicators: habitat quality and the ESV.
The Integrated Valuation of Ecosystem Services and Tradeoffs (InVEST) model is a mature model that is used to evaluate habitat quality. It depends on the distance between the habitat and the threat source and the intensity of land use and declines as the distance decreases and the intensity of land use increases [40,41]. Based on the land use of the UANST, arable land, urban land, rural land, other construction lands, and unused land, which are more affected by human activities, were selected as threat sources, and the parameters were set by combining the relevant literature [41] and regional characteristics (Table 2).
Each land-use type has a different level of sensitivity to threat sources. The UANST is located in the arid zone where there is little precipitation and high temperatures, and the vegetation has a higher demand for surface runoff and groundwater, so the woodland and grassland areas with higher coverage are more sensitive to threat sources. Thus, the weight value was set higher. Meanwhile, due to the large area of unused land in the arid zone, it was necessary to divide the unused land into categories such as sand, bare ground, and saline soil to set the sensitivity level. Therefore, according to the actual situation of the study area and information contained in relevant studies [43], the sensitivity values were set in the range from 0 to 1 (Table 3).
By substituting the above threat sources, sensitivity parameters, and 4-period land use raster data into the InVEST model, a habitat quality score was calculated for each raster in the study area from 1990 to 2020.
Although the habitat quality model can reflect the state of the ecological background, the drawback of this method is that it cannot reflect quantitative changes. The ESV, proposed by Costanza and used worldwide, refers to the goods and services that sustain life and are gained either directly or indirectly from the ecosystem structure, processes, and functions. Decisions about ecological and environmental protection, ecological function zoning, environmental economic accounting, and ecological compensation are all based on this value assessment [44,45,46,47,48]. The value of ecosystem services can better compensate for the deficiencies of the habitat quality model in terms of the “quantity” by calculating the value of the contribution per square foot of human-occupied land. However, there are various methods for calculating ESVs, and there are differences in the calculation standards adopted by different countries and regions. In this study, we adopted the equivalent factor method of the unit area value proposed by Xie et al. [49]. Based on the evaluation model proposed by Costanza, Xie et al. collected and sorted out relevant research results and constructed an ESV evaluation system consistent with China’s national conditions. This system has been used to evaluate the ESV at different geographical scales [50,51] and is more consistent with the actual situation in the study area. The ESV unit price table for the UANST was obtained based on the equivalent exchange value method with reference to the equivalent factor table proposed by Xie et al. (Table 4).
The values of the different land-use types and land-use raster data from 1990 to 2020 were substituted into ArcGIS software to calculate the ESV for each raster.
The following formula was used to determine the resistance:
S = R e s i s t a n c e = 0.5 H a b i t a t   Q u a l i t y + 0.5 E c o s y s t e m   S e r v i c e   V a l u e
Adaptability is an important component of ecologically resilient systems, and the level of adaptability determines the stability of an ecosystem. Therefore, this study used indicators related to the stability of the ecosystem landscape structure to express its resilience. Referring to the ecological resilience formula developed by Xia et al. [39], the landscape index was used to evaluate the landscape stability in terms of landscape heterogeneity and landscape connectivity. The formula used was as follows:
A = A d a p t a b i l i t y = 0.4 H e t e r o g e n e i t y + 0.6 C o n n e c t i v i t y
Landscape heterogeneity includes the Shannon diversity index of patches (SHDI) and the area-weighted average patch fractal dimension (AWMPFD). The SHDI characterizes the richness of different land-use types within a unit grid, and the AWMPFD characterizes the complexity of patch shapes within a unit grid. The higher the SHDI and AWMPFD are, the more land-use types there are within the patch, the more complex the patch shape is, and the greater the landscape heterogeneity. Both indices can characterize landscape heterogeneity, but the advantage of the SHDI is that the size of the index value can be determined directly from the land-use types. For the AWMPFD, which requires highly precise land-use data, the complexity of the patch shape reflected by 1 km of land-use raster data is limited. Therefore, the weight of SHDI was set to 0.25, and the AWMPFD was set to 0.15. Given that the whole landscape, woodlands, and grassland areas serve the most crucial biological roles in the landscape of a dry zone, the landscape connectivity is determined by the connectivity within the landscape. Each of the three connection indicators can be measured by indicators such as patch fragmentation and patch spreading. The greater the value of patch fragmentation, the greater the degree of landscape disturbance and the poorer the landscape connectivity. The greater the value of patch spreading, the lower the degree of landscape disturbance and the better the landscape connectivity. Therefore, the patch fragmentation index (LN) and spreading index (LCONTAG) were used to measure the connectivity of the landscape as a whole. Additionally, the fragmentation index of the woodland area (WN), the fragmentation index of the grassland area (GN), the patch aggregation of the woodland area (WCOHESION), and the patch aggregation of the grassland area (GCOHESION) were used to describe the connectivity of the woodland and grassland areas, with each being assigned a weight of 0.1. Thus, the final adaptability equation used was as follows:
A = A d a p t a b i l i t y = 0.4 H e t e r o g e n e i t y + 0.6 C o n n e c t i v i t y = ( 0.25 S H D I + 0.15 A W M P F D ) + ( 0.1 L N + 0.1 L C O N T A G + 0.1 W N + 0.1 W C O H E S I O N + 0.1 G N + 0.1 G C O H E S I O N )
The regeneration capacity is a manifestation of the basic capacity of a resilient ecological system. It refers to the potential of an ecosystem to recover to its original state after experiencing a disturbance. Land-use types that are similar to the natural attributes are more likely to recover from external disturbances, while human-dominated land-use types, such as construction land, have lower regeneration capacities in the face of external pressures. The measurement formula used for the regeneration capacity is based on the ecological resilience model and coefficient proposed by Peng et al. [52]. The formula is as follows:
R = R e g e n e r a t i o n   c a p a c i t y = i = 1 n A i × R C i
where R is the ecosystem regeneration capacity; A i is the area ratio of land-use type i, R C i is the regeneration capacity coefficient of land-use type i, with the coefficient referring to the study by Peng et al. [52], and n is the total number of land-use types.
Because the component indicators of the resistance, adaptability, and regeneration capacity have different quantities, data standardization is required in the calculation process. In this study, these three indicators were standardized to the interval [0, 1], and the final formula for the ecological resilience level is as follows:
R e s i l i e n c e = S × A × R 3

2.3.2. Center of Gravity-Standard Deviation Ellipse

Lefever [53] first proposed the standard deviation ellipse in 1926. This method is a type of geographical data statistical analysis with the advantage of demonstrating the geographic distribution and the multidirectional characteristics of the study object. In this paper, we analyzed the main spatial locations and dynamic development trends of the mean ecological resilience of the UANST during the study period with the help of four basic parameters, including the center of gravity, azimuth, macroaxis, and brachyaxis of the standard deviation ellipse. The exact formula used for the calculation is as follows:
X ¯ = i = 1 n W i X i i = 1 n W i ,   Y ¯ = i = 1 n W i Y i i = 1 n W i
S = π σ X σ Y
where n is the number of cities; ( X ¯ ,   Y ¯ ) denotes the center of gravity coordinates of the ecological resilience of the UANST; ( X i , Y i ) are the geographical coordinates of each city; Wi denotes the weight; and σ X , σ Y denote the standard deviations along the X and Y axes.

2.3.3. Detecting the Factors Driving Ecological Resilience

Geodetector is a set of statistical methods proposed by Wang et al. [54] to detect spatial heterogeneity and reveal the underlying influences. It is used to detect the explanatory strength of the spatial heterogeneity of each influencing factor X on the dependent variable Y.
q x , y = 1 N δ 2 i = 1 m X i δ i 2
Here, q x , y is the influencing factor detection power index, X i is the number of samples in the subregion, N is the number of samples in the whole region, m is the number of subregions, δ 2 is the variance of all sample values in the study area, and δ i 2 is the variance of samples in the subregion. q x , y takes values in the range of [0, 1], where the larger the value of q x , y the greater the influence of X.

3. Results

3.1. Temporal Change Characteristics of the Ecological Resilience of the UANST

The mean ecosystem resilience levels for the urban agglomeration in 1990, 2000, 2010, and 2020 were 0.3371, 0.3326, 0.3330, and 0.3240, respectively, indicating an overall fluctuating downward trend in the ecological resilience level. To facilitate a comparison of trends in ecological resilience levels, the ecological resilience scores were classified into five levels based on the changes in ecological resilience scores over thirty years (Table 5): very low (1), low (2), medium (3), high (4), and very high (5).
During the study period, the area of very low-level resilience showed a fluctuating upwards trend, with the area increasing and then decreasing from 1900 to 2010. The proportion remained at approximately 20.5%. From 2010 to 2020, the area of very low-level resilience increased significantly to 47,923.22 km², accounting for 24.71% of the total area, and it became the dominant type of regional ecological resilience. Low-level resilience showed a fluctuating decreasing trend, with the area and proportion being the highest in the 1990–2010 period, accounting for more than 25% of the total. Additionally, in the 2010–2020 period, the area and proportion decreased by 9.27% and 2.5%, respectively, and low-level resilience became the second-most-dominant element. The sum of the proportions of very-low-level and low-level resilience exceeded 45% in 1990, 2000, 2010, and 2020, showing that these levels of resilience play decisive roles in the overall resilience level. The area and proportion of medium-level resilience showed a gradually increasing trend during the study period, with a significant increase during the 2000–2020 period. The areas of both high-level and very-high-level resilience showed downward trends, with a considerable drop between 2000 and 2020. Additionally, the proportion of both levels was approximately 17%, showing that these levels of resilience had limited contributions to the overall resilience level. Overall, the area of very-low and low-level resilience was dominant for a long time, while the overall proportion of very-high and high-level resilience was relatively low, indicating that the overall ecosystem resilience level of the UANST has historically been at a relatively low level. In terms of the changing trend, although the area of low-level resilience continued to decrease and the area of medium-level resilience increased, the area of very-high-level and high-level resilience gradually decreased, and the area of very-low-level resilience significantly increased. These findings indicate that the regional ecological resilience level has undergone a continuous decreasing trend. Overall, the ecological resilience of the UANST was dominated by low-level and medium-level resilience during the study period, and the level of ecological resilience decreased continuously.

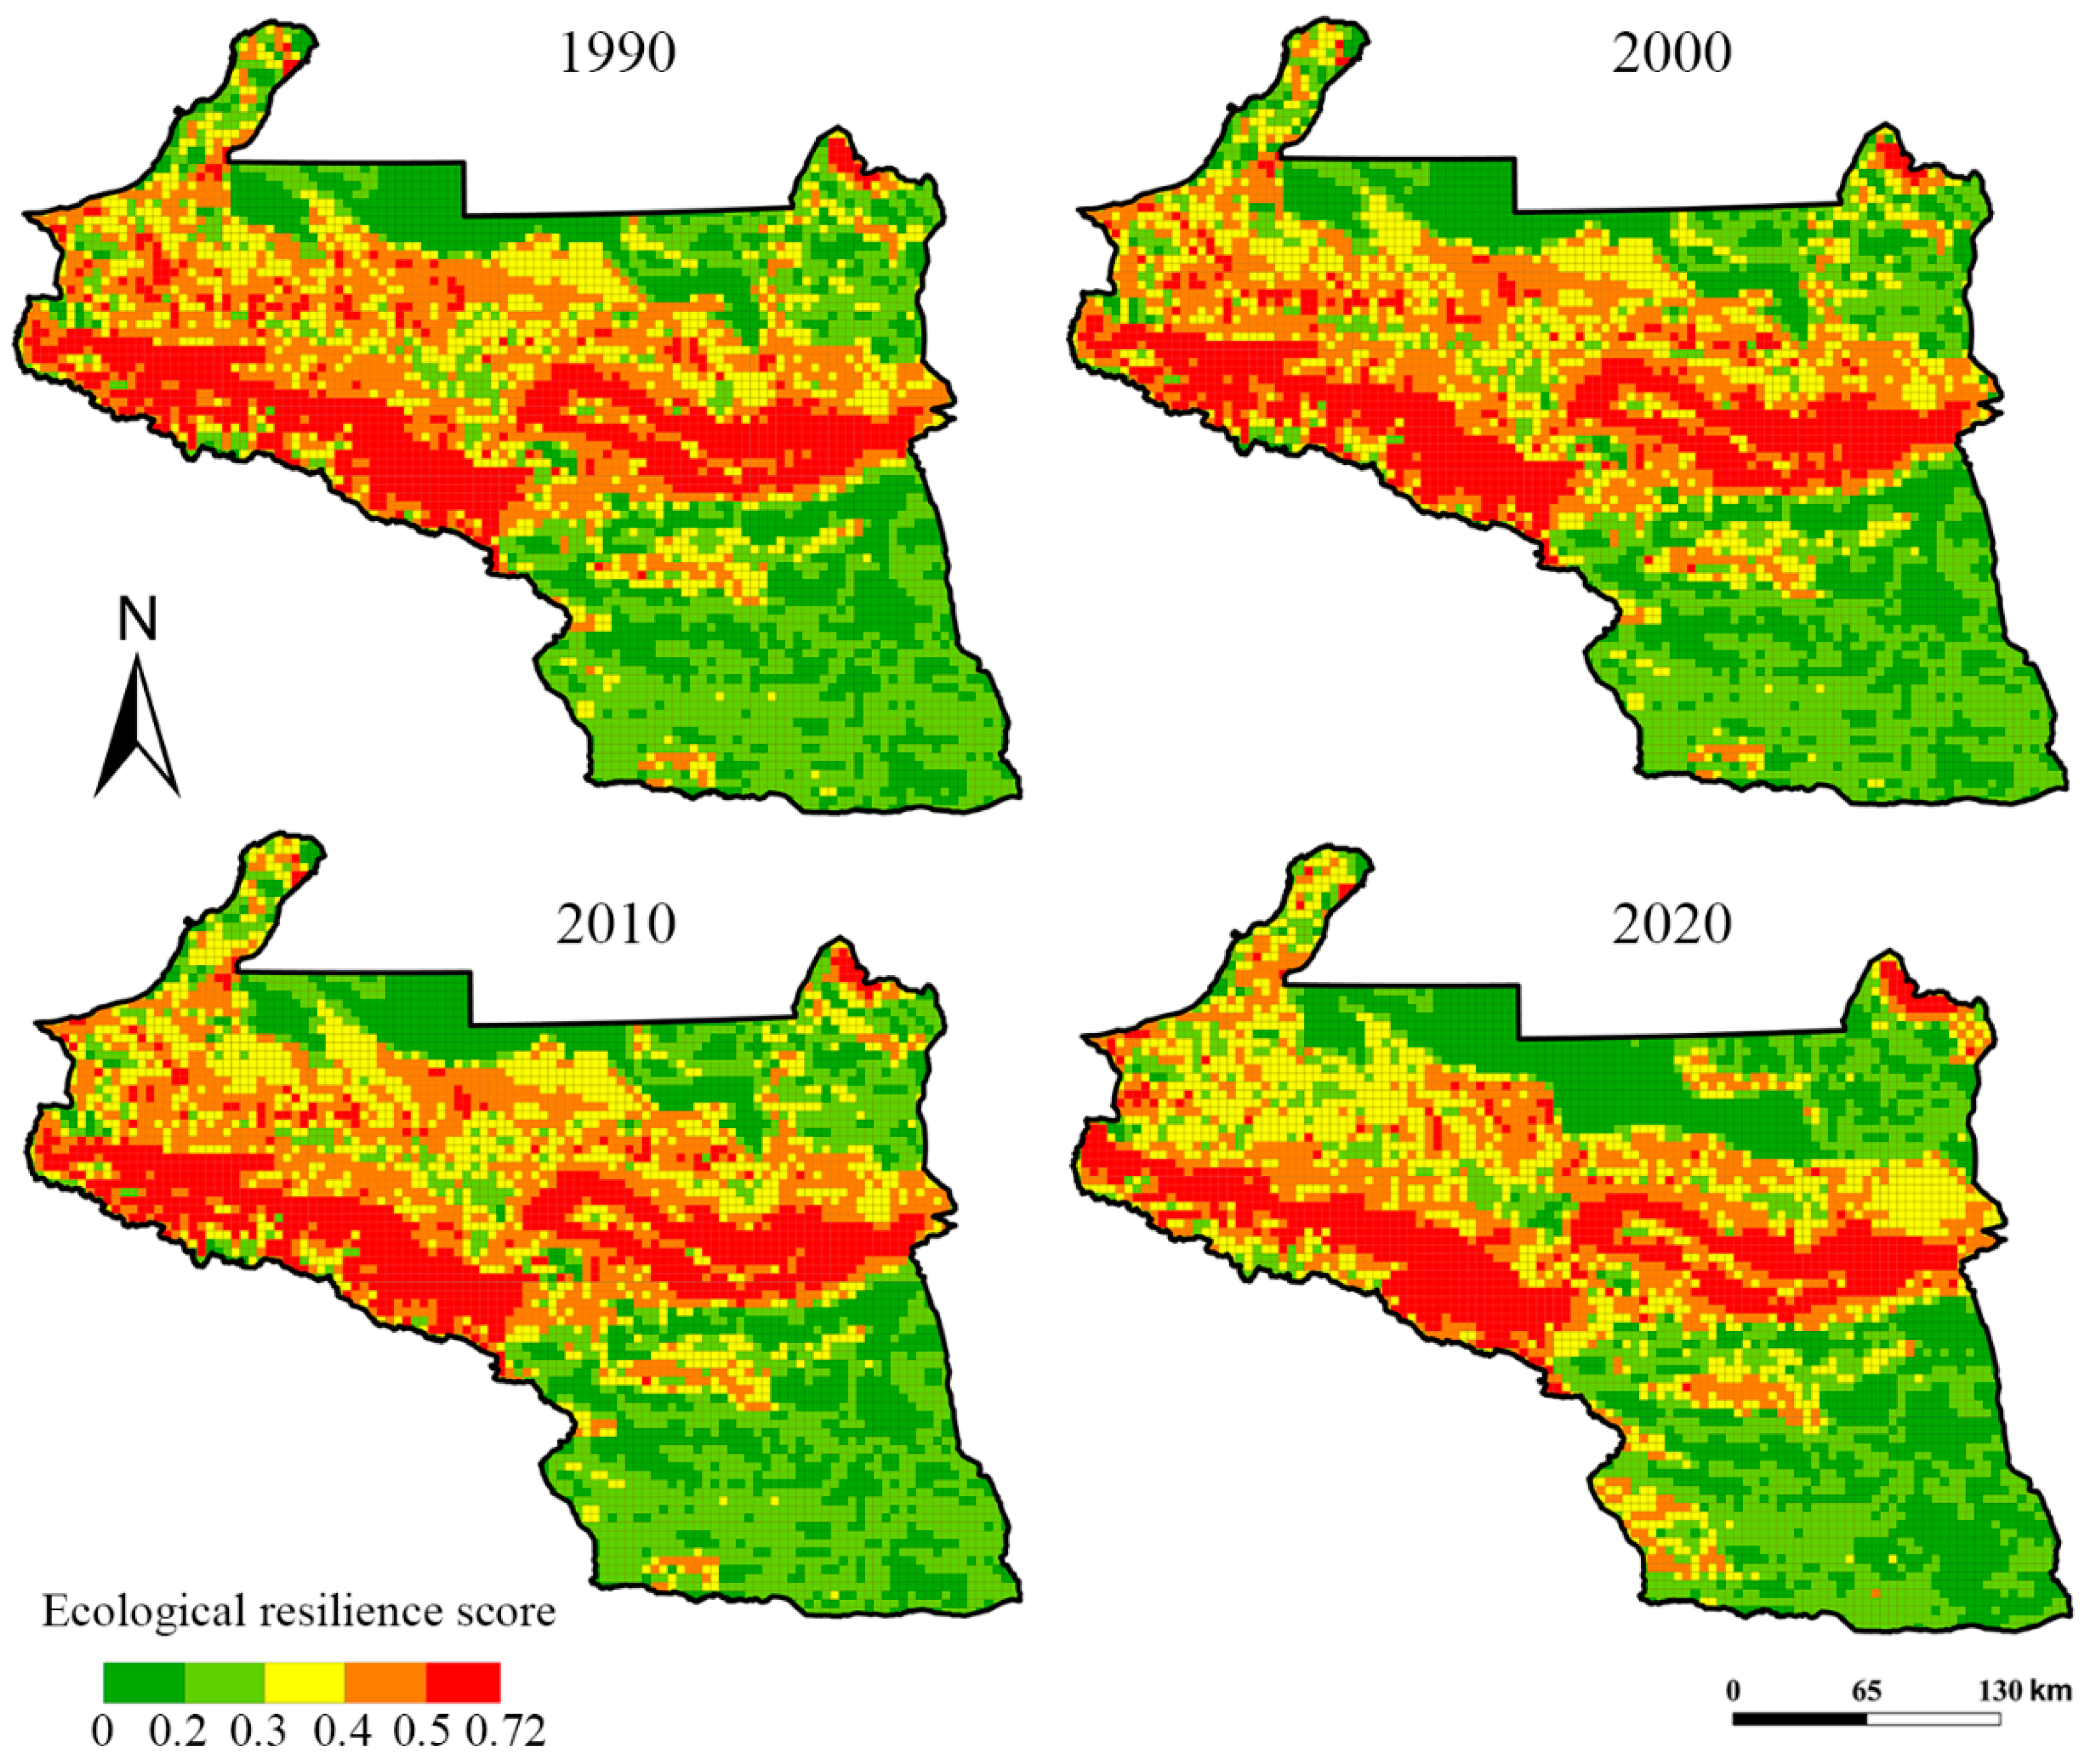
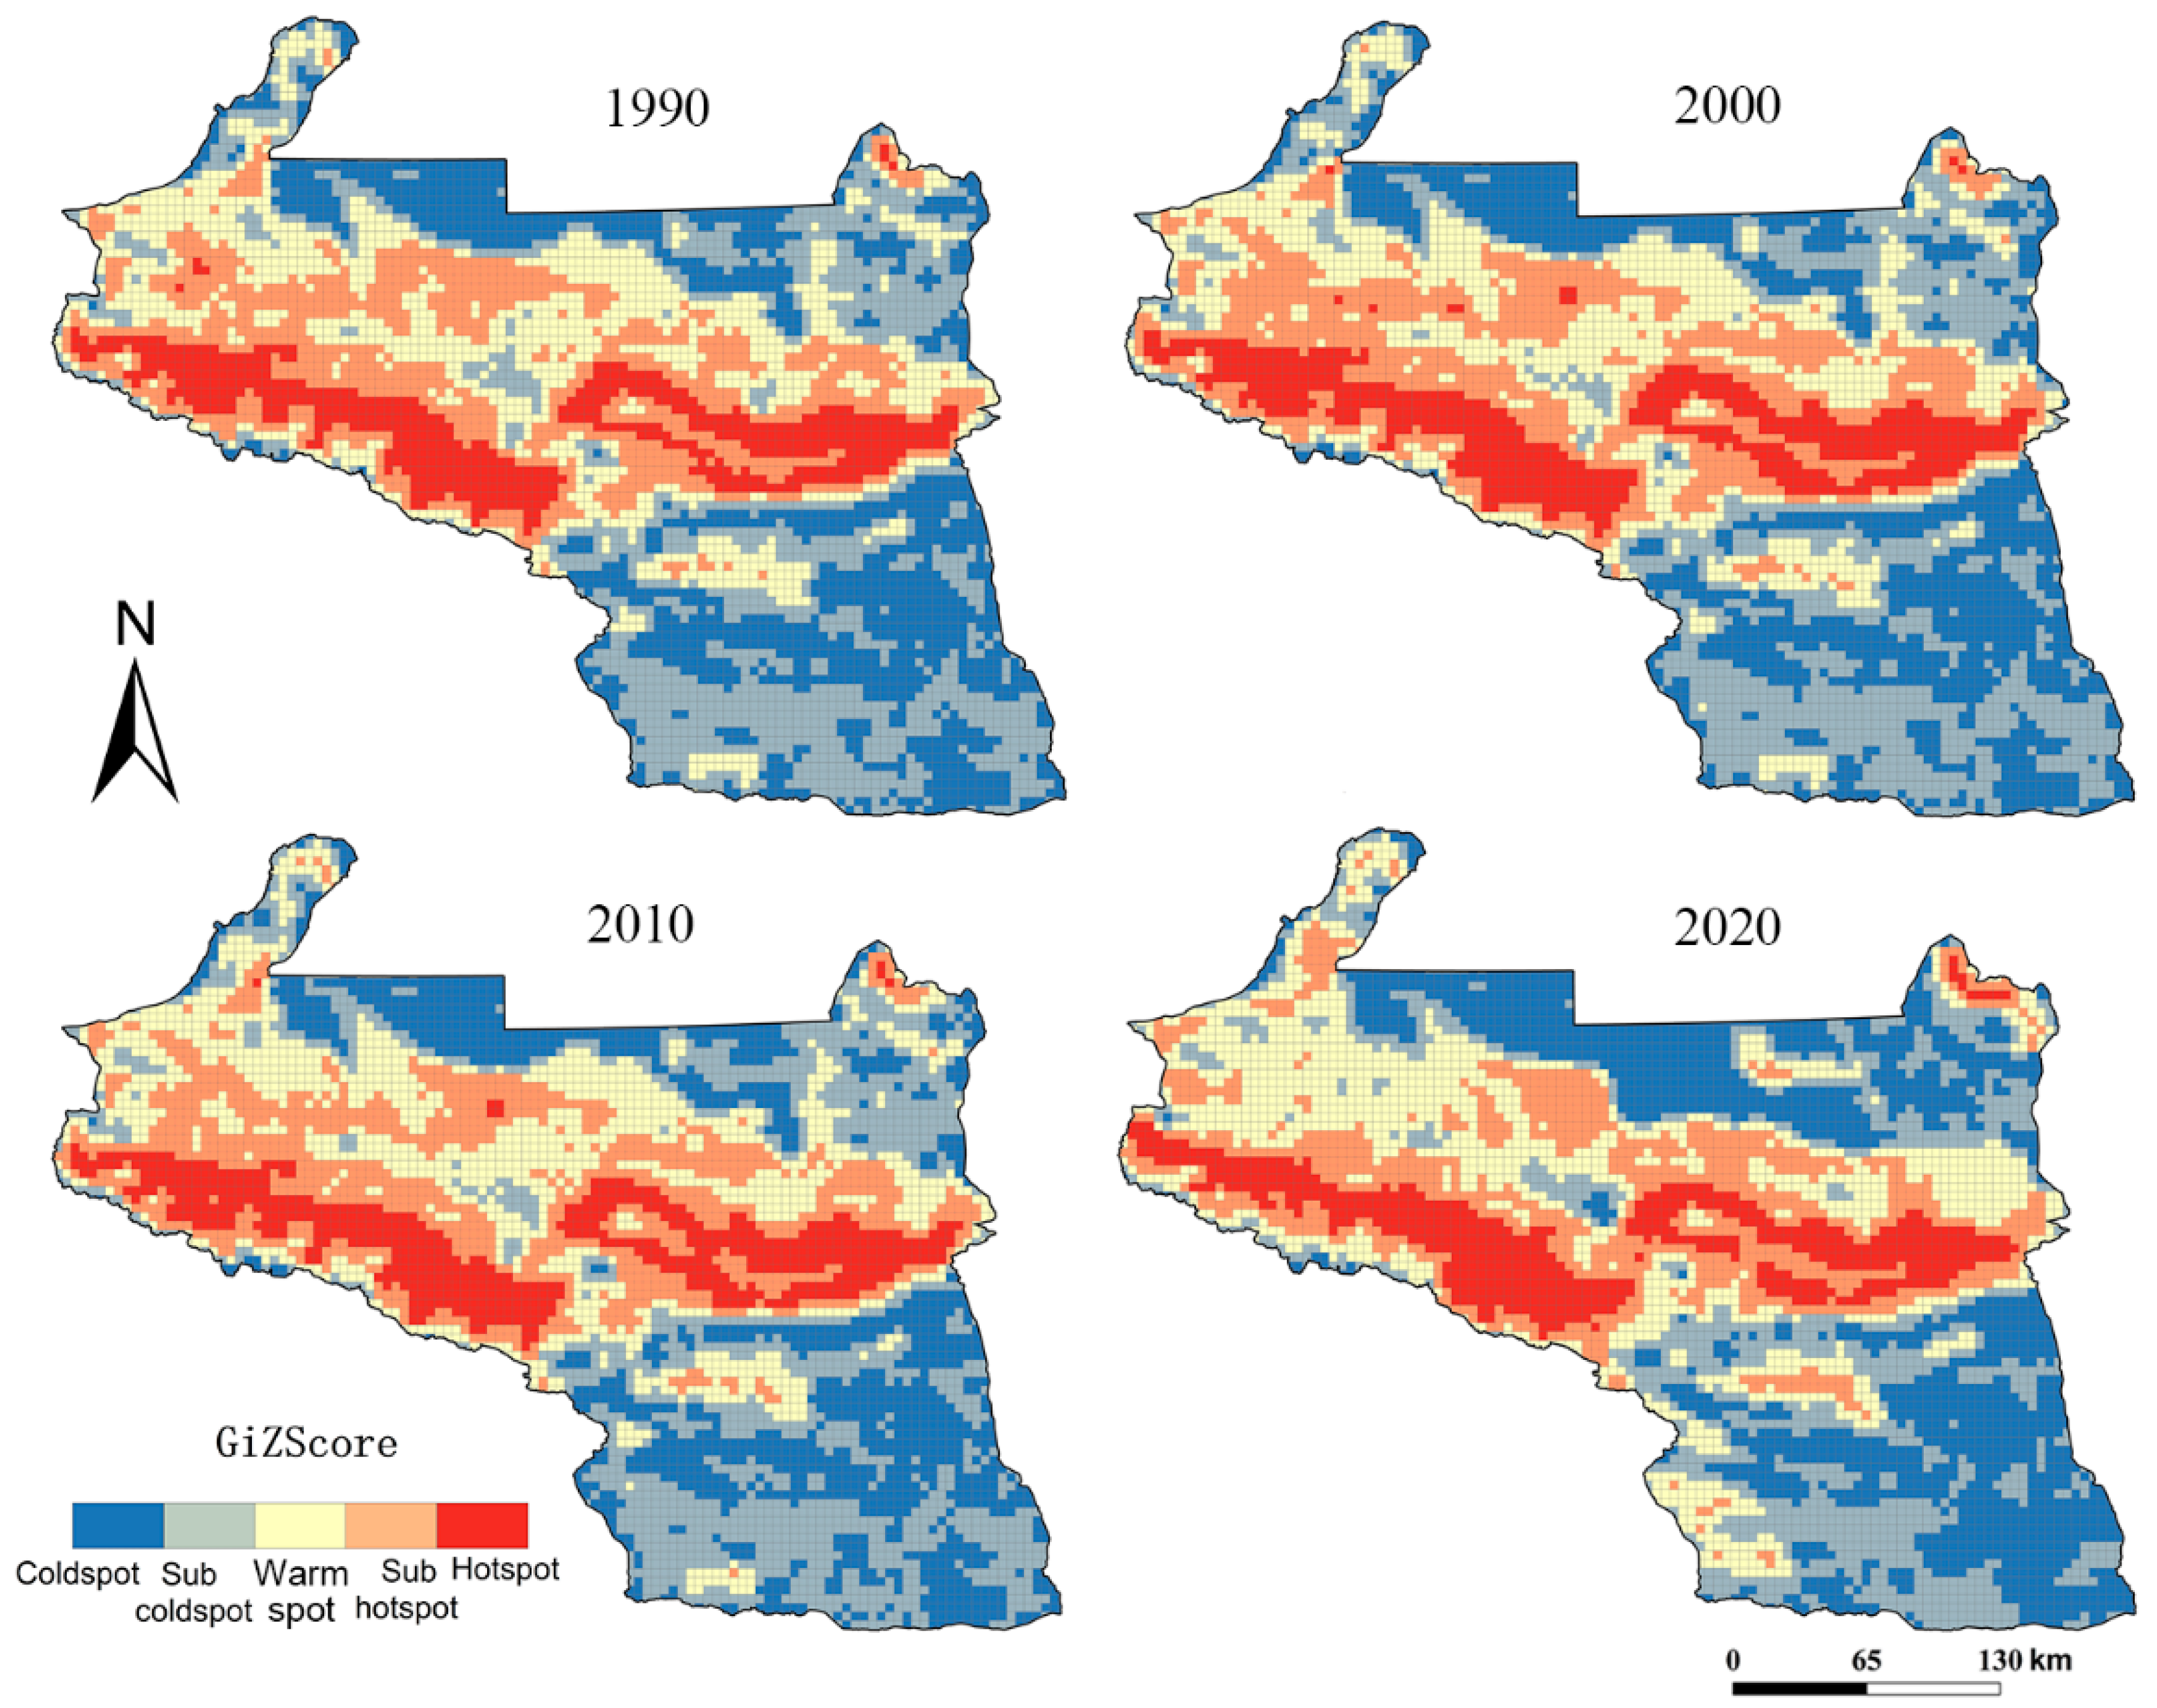
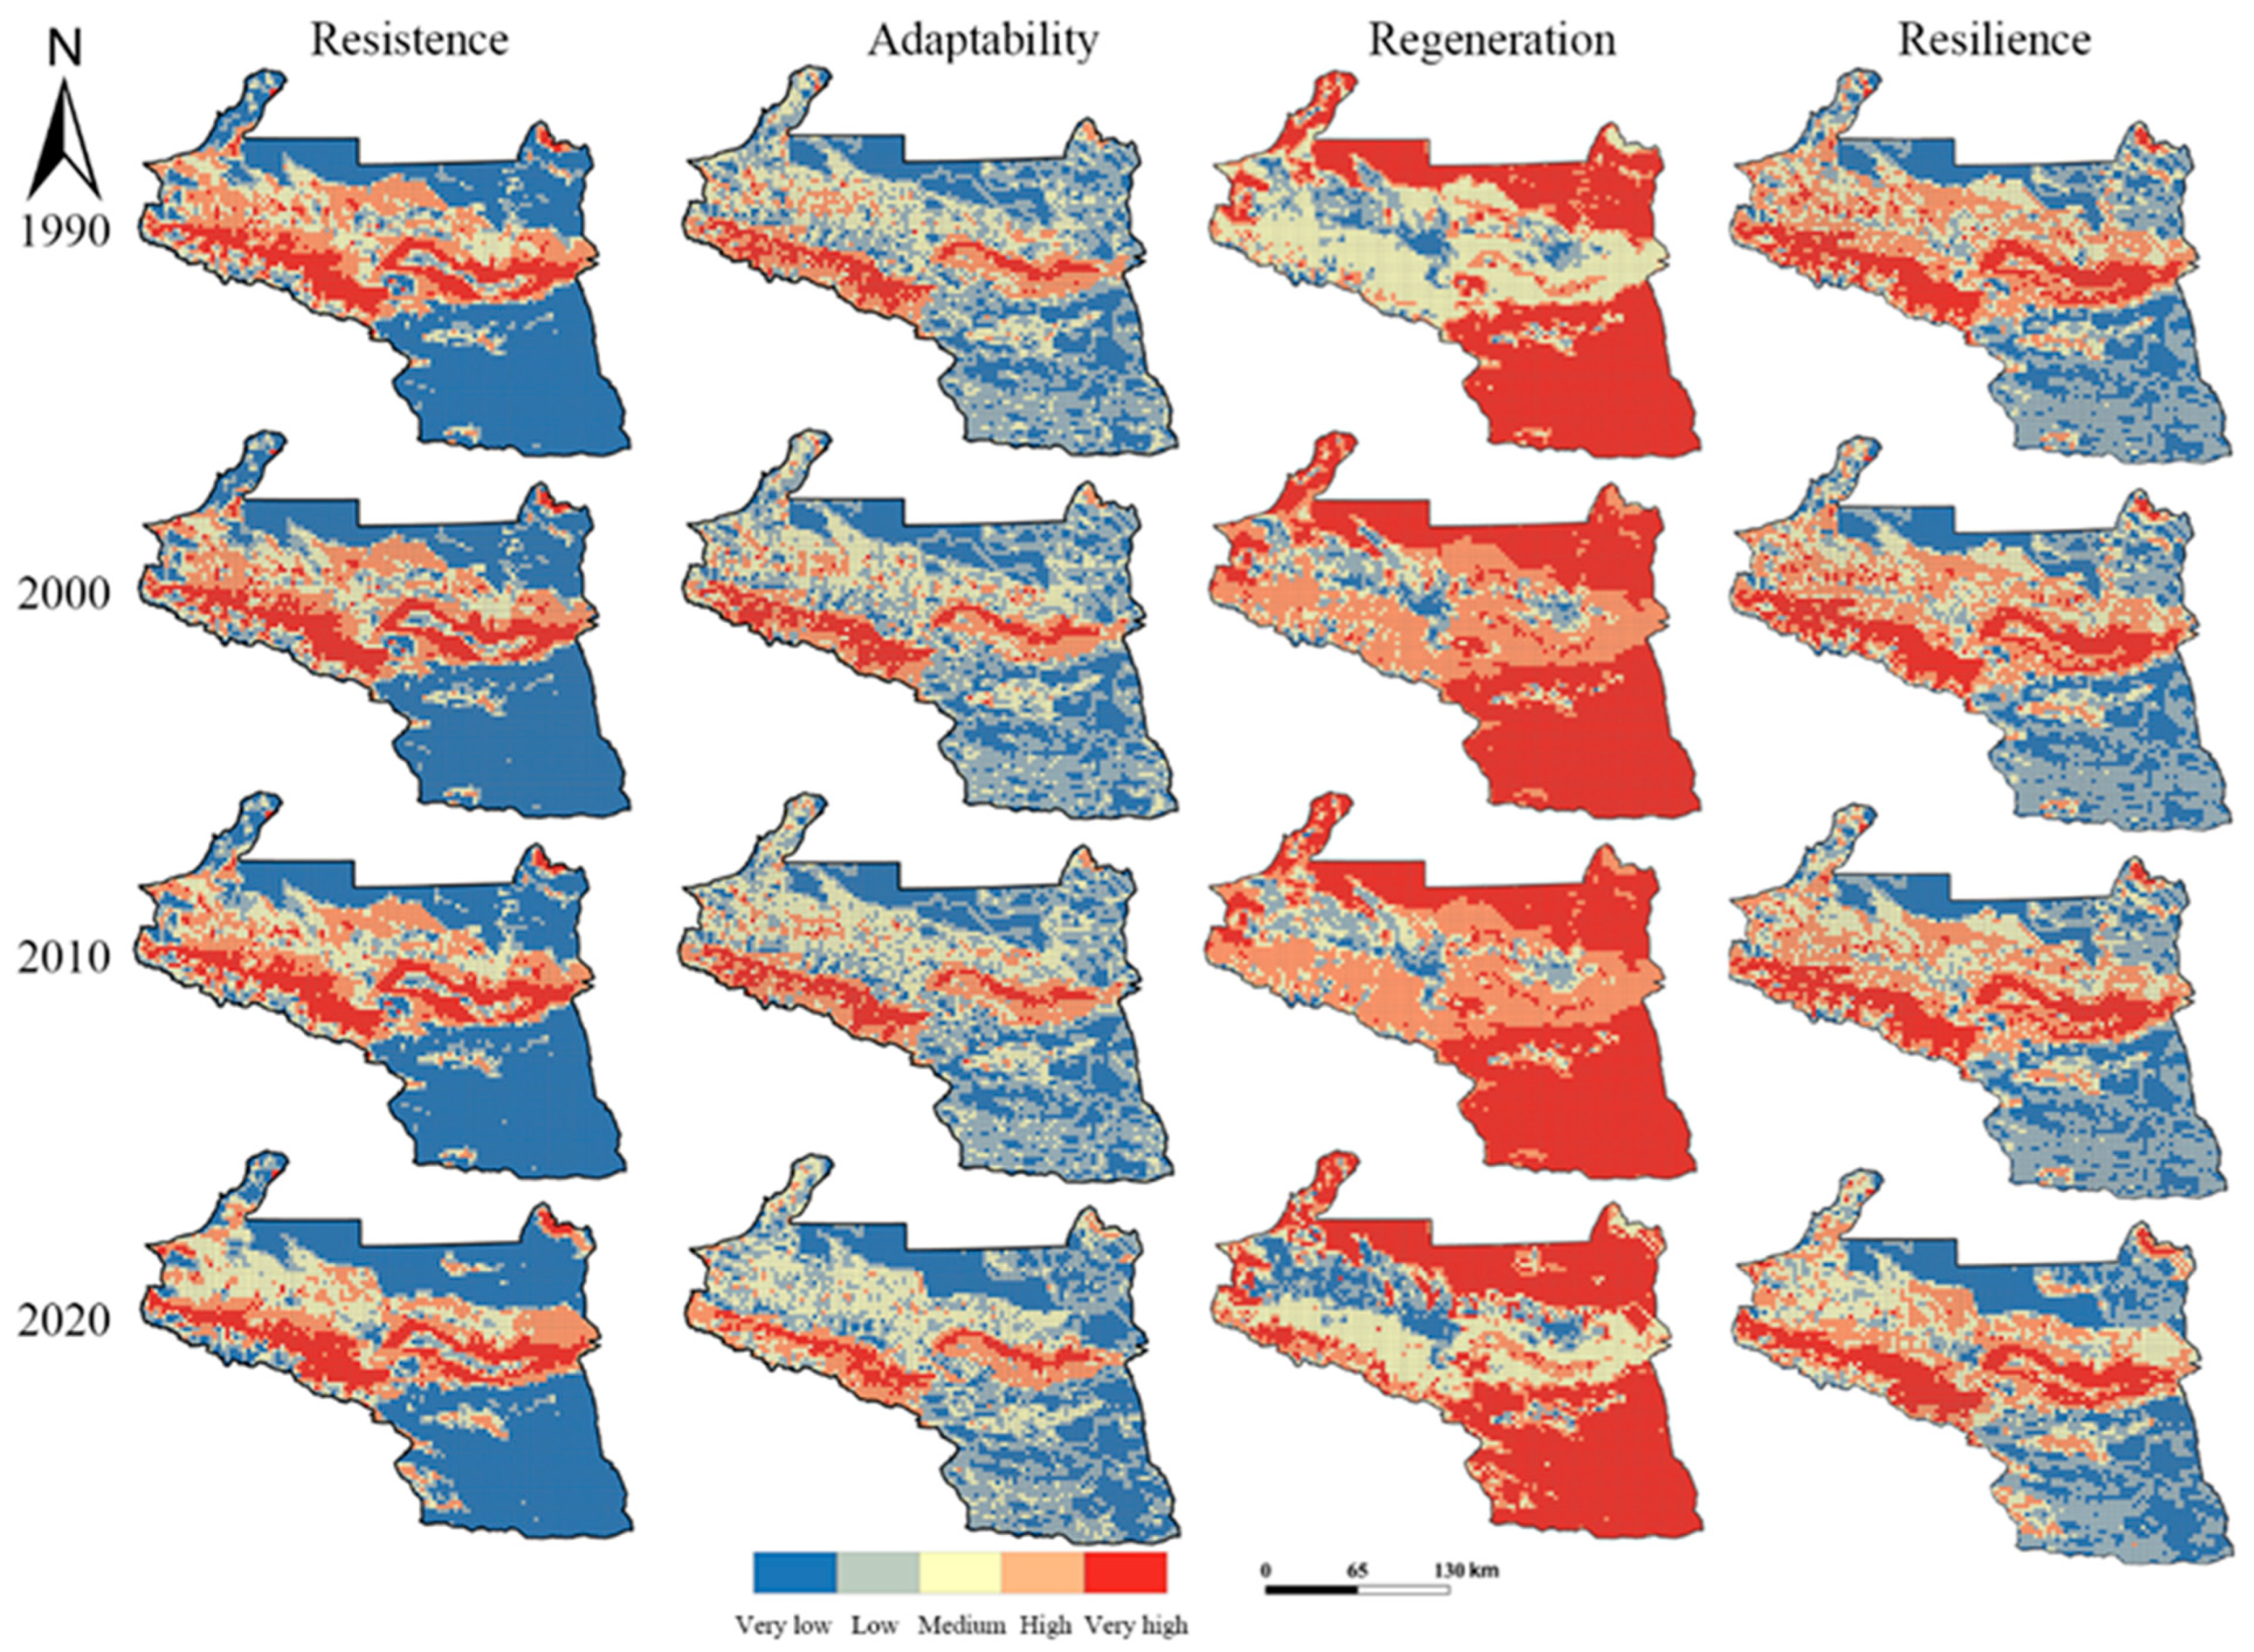
3.2. Spatial Evolutionary Characteristics of the Ecological Resilience of the UANST

Based on the above analysis, the ecological resilience of the UANST is under significant nonequilibrium; by calculating the ecological resilience of the UANST, which consisted of 5656 6 km × 6 km grids, the ecosystem resilience was classified into five levels with 0.2, 0.3, 0.4, and 0.5 used as breakpoints. The spatial variation characteristics were compared.
The spatial distribution of the resilience levels indicates that from 1990 to 2020, the overall ecological resilience showed a stable spatial distribution pattern of “low in the south and north and high in the middle”, with obvious spatial differentiation characteristics (Figure 4). Low-level resilience areas occupied a large proportion of the UANST, especially in the southeast and north-central regions. The distribution and spatial variation of low-level resilience areas were mainly affected by the natural environments present, such as deserts and bare land. The high-level resilience areas were mainly concentrated in the northwestern and central-eastern Tianshan Mountains and the surrounding plains, where the ecosystem resilience was at a relatively high level due to the extensive coverage of woodlands and grasslands, high landscape connectivity, low impact from human activities, better habitat and ecosystem protection integrity, higher stability and self-organization ability, and better ecosystem resilience than those of other areas.
To further explore the spatial dynamic evolutionary process of the ecological resilience of the UANST, a diagram of the spatial dynamic evolution of the ecological resilience of the UANST from 1990 to 2020 was drawn based on the ArcGIS10.6 spatial statistics module using the center of gravity-standard deviation ellipse (Table 6, Figure 5).
During the study period, the standard deviation ellipse of the ecological resilience of the UANST showed a northwest–southeast pattern. By analyzing the change in the azimuth angle, this study found that from 1990 to 2010, the azimuth angle decreased from 112.14 to 112.09 and then increased to 112.10. Additionally, from 2010 to 2020, the azimuth angle increased from 112.10 to 112.48, indicating that the ecological resilience of the UANST shifted clockwise and was more obvious from 2010 to 2020. From 1990 to 2020, the trajectory of the center of gravity of the ecological resilience of the UANST showed a trend in which the center of gravity moved southward overall. In 2000, the center of gravity moved to the southeast relative to its position in 1990, migrating at a distance of 0.64 km. The center of gravity moved 0.48 km to the northeast between 2000 and 2010. In the 2010–2020 period, the center of gravity continued to migrate to the southeast, and the migration distance increased to 2.85 km. From 1990 to 2020, the macroaxis standard deviation of the ellipse of the standard deviation revealed a minor growth tendency. In addition, the macroaxis standard deviation fluctuated and increased from 262.81 km to 263.45 km during the study period, indicating that the ecological resilience of the UANST expanded slightly in the northwest–southeast direction during the study period. In the brachyaxis direction, the standard deviation of the brachyaxis increased more, from 128.92 km to 131.18 km during the study period. This finding indicates that the ecological resilience of the UANST obviously expanded in the northeast–southwest direction during this period.
The continuous southwards shift of the center of gravity trajectory and the southwards expansion of the macroaxis and brachyaxis of the standard deviation ellipse further indicate that the ecological resilience of the UANST becomes increasingly superior in the south compared with the north. The main reason for this finding is the transformation of grassland into the desert in the north-central part of the UANST. At the same time, in the northwest part of the study area, a large amount of ecological land was converted into construction land, while the conversion of construction land into ecological land was small [19]. This phenomenon led to the shrinkage of ecological land and a series of ecological problems, such as ecological degradation, causing an overall decline in the level of ecological resilience in the north. In contrast, through land management measures, the ecological resilience in the south increased.
The spatial autocorrelation analysis was used to conduct an in-depth analysis of the spatial differentiation of the ecological resilience of the UANST. The Moran’s I value for 1990, 2000, 2010, and 2020 were 0.79, 0.78, 0.78, and 0.80 (p < 0.00), respectively, indicating the stable spatial clustering of ecological resilience in the UANST. The values of Moran’s I showed a fluctuating upwards trend, and the spatial clustering of high and low values of ecological resilience in the urban agglomeration gradually strengthened. To further characterize the spatial distribution and correlation of ecological resilience in the UANST, the cold and hot spots analysis tool of the ArcGIS 10.6 was used to determine the spatial distribution of ecological resilience “cold and hot spots” in the study area from 1990 to 2020 (Figure 6).
During the study period, the ecological resilience of the UANST generally maintained a stable spatial pattern, showing a “sandwich”-type distribution of cold in the south and north and hot in the middle. The “hot spot area” was distributed from northwest to southeast, showing a “\” shape, the central-eastern part showed an “∞” shape, and the northeast part showed a “C” shape. The “sub-hot spots” were mainly distributed around the “hot spots” and the north-central area. The “hot spot area” plays an important role in the ecological resilience of the UANST, serving as an ecological barrier in the middle of the UANST and as an important water-supporting area of the urban agglomeration, which has long focused on protection and reasonable development. Additionally, it was shown that the integrity and stability of the ecosystem had been well maintained. The “warm spot area” was primarily dispersed in the study area’s center and replaced the “sub-hot spot area” in the built-up area of the central and western UANST, showing a trend of continuous expansion. The “sub-cold spot area” was scattered around the UANST, and the “sub-cold spot area” gradually shifted to a “cold spot area” in the central built-up area. In the central part of the UANST, the two main land-use types were found to be arable land and construction land. Human habitation and production are frequent in this area and have caused serious damage to the natural ecosystem, reducing its ability to prevent risks and resolve disasters. The expansion of the built-up area has occurred in high-quality habitat areas, lowering the overall quality of the ecosystem and reducing the landscape connectivity. The degree of ecological resilience has been reduced, resulting in the replacement of “sub-hot spots” with warm spots and the expansion of “sub-cold spots” to “cold spots.” The “cold spot area” is mainly located in the desert area in the south of the Junggar Basin in north-central UANST and the desert area in the Kulutag Mountains in the south. This result was mainly affected by the natural desert environment.

3.3. Analysis of Factors Influencing the Ecological Resilience of the UANST

The factors influencing the ecological resilience of urban agglomerations are complex and variable. Each factor includes natural and human factors, which present different characteristics in different periods and stages, influencing land-use changes and thus affecting the level of ecological resilience. Natural factors are the basis for the distribution of the spatial and temporal patterns of ecological resilience. The topography determines the geographical distribution of land-use types [55], which affects the regeneration capacity of ecological resilience. The extreme weather events and greenhouse effect triggered by global climate change will significantly affect the growth of vegetation [56]. In turn, this directly increases the risk of the impacts of disasters on the ecological resilience of urban agglomerations, altering the level of resistance and the adaptability of ecological resilience. In the UANST, which is the fastest urbanizing region in Xinjiang, the ecological environment has been significantly impacted by human activities. Topography and climate change can reflect the extent to which ecological resilience is influenced by natural factors, and there are many indicators that characterize the topography and climate, including the elevation (digital elevation model (DEM)), slope, slope direction, precipitation, temperature, PM2.5, and other indicators. The urbanization process can reflect the degree of ecological resilience influenced by human factors, which can be expressed by four indicators: population, economy, space, and society. Considering the accessibility of raster data, the elevation, slope, temperature, and precipitation were selected as the natural influencing factors. Population size is the basic indicator of regional human activities. The GDP output value can reflect the intensity of regional economic activities. Road construction has various negative impacts on natural landscapes and ecosystems, such as fragmentation, disturbance, destruction, and pollution [57]. Nighttime light data from the Defense Meteorological Satellite Program (DMSP)/Operational Linescan System (OLS) are valuable for identifying the intensity of human activities [58]. Therefore, the population density, gross GDP, the distance from the road network, and the nighttime light index were selected as the anthropogenic impact factors. The Geodetector tool was used to measure the impact of natural conditions and human activities on the ecological resilience of the UANST in 2000, 2010, and 2020 (due to the lack of available data on human factors before 1995, the influencing factors were not measured in 1990).
As shown in Table 7, natural factors dominated the spatial distribution of the ecological resilience of the UANST during the 2000–2020 period. The mean values for the determinants of the spatial distribution of the ecological resilience in the UANST were, in descending order, temperature (0.454) > precipitation (0.434) > elevation (0.350) > slope (0.290) > road network (0.151) > GDP (0.128) > population (0.122) > nighttime lighting (0.007). The coefficient of determination of the influences of elevation and slope on ecological resilience remained stable during the study period, while the coefficient of determination of the influences of temperature and precipitation on ecological resilience was always high and increased during the study period. This finding confirms that, in the context of global warming, the effects of climate change on ecological resilience are becoming more intense. In terms of human factors, the explanatory power of the population density showed a decreasing trend during the study period and was not statistically significant in 2020. These results indicate that the effect of population density on regional ecological resilience has diminished over time. In contrast, the nighttime lighting data were not statistically significant in 2000 and 2010 but were statistically significant in 2020. These results indicate that the association between the intensity of human activities and the ecological resilience of the UANST is increasing. Although road network construction was the most influential human factor on the ecological resilience of the UANST during the study period, its explanatory power decreased yearly, and the fact that road network construction in the UANST has continued to improve indicates that humans are consciously reducing the impact of their activities on the ecological environment [59].
The formation of many geographic phenomena is the outcome of various interacting factors [54]. Likewise, the ecological resilience of urban agglomerations represents an integrated and complex natural–social system resulting from the joint actions of various factors. Factor interaction detection can be used to further explore the explanatory power of the interactions between different influencing factors with regard to the ecological resilience of the UANST. As shown in Table 8, from 2000 to 2020, the explanatory power of two-factor interactions with regard to the ecological resilience of the UANST was generally higher than that of a single factor. Additionally, different levels of two-factor enhancement and nonlinear enhancement can be seen in the factor interactions, confirming that the ecological resilience of urban agglomerations is a complex, multifactor interaction system. In 2000, the temperature–population density interaction was the most powerful determinant of ecological resilience. In 2010 and 2020, the temperature and GDP were the greatest determinants of the ecological resilience of the UANST. While confirming the change in single-factor determinants, these results show that the impact of human activities on the ecological resilience of the UANST in the context of climate change is also changing. The impacts of resource and energy consumption and ecological damage resulting from population growth on the ecological resilience of the UANST have changed due to the energy and resource demand resulting from economic development.

4. Discussion and Conclusions

The ecological resilience of urban agglomerations can be understood as a complex, adaptive social–ecological system. Resilience is a set of system properties composed of resistance, adaptability, and regeneration capacity, with differences in the direction, intensity, and impact of each force. This paper attempted to characterize resistance using the habitat quality and the ESV, adaptability using the landscape connectivity and heterogeneity, and regeneration capacity using the land-use type recovery ability. This was done in an attempt to characterize the ecological resilience of an urban agglomeration located in an arid area from multiple perspectives and through multiple indicators. This type of characterization is necessary for evaluating ecological resilience, which is difficult to quantify, and it helps to enrich the knowledge on urban ecological resilience research and enhance the method used for urban ecological resilience assessments. At the same time, by comparing the research methods used by other experts and scholars in which a single indicator is used to characterize the regional ecological resilience level [60], this paper presents the following questions: What is the difference in the measured regional ecological resilience level based on a single indicator versus that based on multiple indicators? Is the ecological resilience evaluation method [39] applicable to both humid and arid regions? After calculating the overall ecological resilience level of a region, what should be done to improve and strengthen the ecological resilience of urban agglomerations? It is necessary to analyze the contributions of resistance, adaptability, and regeneration capacity to regional ecological resilience and the change trend to clarify the direction of future research.
The levels of resistance, adaptability, regeneration capacity and ecological resilience in the UANST from 1990 to 2020 were divided into five levels, from high to low, based on the natural breaks method (Figure 7). It can be seen that, in different years, the elements with higher spatial distributions, when matched with the ecological resilience levels, were as follows: resistance = adaptability > regeneration capacity. The level of resistance was basically consistent with the spatial distribution of the ecological resilience level in high-value regions, and the level of adaptability was basically consistent with the spatial distribution of the ecological resilience levels in the low- and medium-value regions. The spatial distributions of the regeneration capacity and the ecological resilience level showed more variation. These findings indicate that, although the regeneration capacity is an integral part of the regional ecological resilience research framework, as a single indicator, it is not comprehensive enough to determine the level of regional ecological resilience. A multifactor indicator evaluation system is needed to quantify and refine regional ecological resilience. In terms of differences in land-use types, in arid areas, especially in Xinjiang, where unused land occupies most of the regional area, areas with high regeneration capacity value can be widely distributed, causing variation in the distribution of ecological resilience. This also suggests that the assessment of the regeneration capacity in ecological resilience evaluation indexes may be more applicable to coastal wet areas [39]. Because the percentage of unused land is smaller in these environments, the various land-use types are distributed more evenly, and the regeneration capacity evaluation results are more justified. Therefore, the applicability of this index for use in ecological resilience assessments in arid areas is limited. Thus, in this study, the priority should be to improve the ecological resilience of urban agglomerations in terms of their resistance and adaptability. From the perspective of human activities, controlling the scope of human activities and improving the quality of regional habitats to enhance the resistance of the system and giving full play to human initiatives to increase areas of regional green space to enhance the adaptability of the system can improve the ecological resilience of the region. These two points correspond to the reasonable expansion of construction land in urban agglomerations and the scientific construction of ecological corridors, respectively. As the UANST is a growing urban agglomeration, we provide the following suggestions to control the intensity of human activities and reduce their negative impacts on ecological resilience.
First, based on the current situation of the study area, the periphery of the urban built-up area is dominated by grassland, arable land, and unused land. Therefore, the ecological protection red line should be strictly delineated to protect the regional ecological space. While observing the ecological protection red line, the urban expansion boundary should be delineated scientifically and reasonably based on the development orientation of each city in the UANST. The expansion of the built-up urban area should aim to avoid high-quality habitats, such as grassland and woodland, where possible. Policies such as returning farmland to forest and grassland should be continuously implemented to expand the range of high-quality habitats. Second, the expansion of built-up areas should adopt an edge-type expansion pattern where possible. Enclave-type urban expansion has a large impact on the native landscape pattern of a region [61], and edge-type expansion can reduce the damage done to landscape heterogeneity and connectivity. The vegetation cover around roads should be strengthened and continuously protected during road construction to minimize the damage done to landscape connectivity due to road construction. Finally, ecological restoration is needed for areas in which ecological resilience is sensitive. In the oasis–desert transition areas, ecological restoration and remediation projects are needed. During the expansion of built-up urban areas, we should also strengthen the construction of regional ecological corridors, cultivate high-quality habitats, enhance landscape connectivity, and improve the value of regional ecosystem services. The planning and construction of ecological corridors should follow the principles of scientificity and rationality. Construction should occur in areas where ecological resilience is declining rapidly, and socioeconomic activities are intensive. Additionally, the corridor width and corridor nodes should be considered to give full play to the functions of ecological corridors and to continuously enhance the ecological resilience of the UANST.
This study also has certain limitations. Although the ecological resilience assessment index system for urban agglomerations involves three perspectives, i.e., resistance, adaptability and the regeneration capacity, habitat quality, the ESV, landscape heterogeneity, landscape connectivity, and land regeneration are constructed by the model with the land-use type as the core. Additionally, the response of the system to the ecological resilience level of urban agglomerations is based on the influence of land-use change. The ecological resilience level of a region cannot be reflected by the changes in land elements alone, especially om extremely-water-scarce arid zones. Determining how to reasonably assess the ecological resilience of cities under the influence of changes in water resources, the atmosphere, and biological resources is the next issue that needs further consideration. In an analysis of the factors influencing ecological resilience, there are some important factors, such as the normalized difference vegetation index (NDVI), evapotranspiration, and impervious surface, which were not included in our analysis due to limitations in data availability. Furthermore, the number of impact factors selected was limited, making it impossible to comprehensively characterize the factors influencing the ecological resilience of the UANST. The next step should be to select more scientific and comprehensive influencing factors to better analyze the changes in the ecological resilience of the UANST.

Author Contributions

Conceptualization, Y.T.; methodology, Y.T. and J.L.; software, Y.T. and S.Z.; writing—original draft preparation, Y.T.; writing—review and editing, Y.T., X.Z. and J.L.; visualization, Y.T. and T.R.; supervision, L.F. and Z.D.; funding acquisition, J.L. All authors have read and agreed to the published version of the manuscript.

Funding

This research was funded by The Third Xinjiang Scientific Expedition Program, No. 2021xjkk0905.

Institutional Review Board Statement

Not applicable.

Informed Consent Statement

Not applicable.

Data Availability Statement

The data used to support the findings of this study are available from the authors upon request.

Conflicts of Interest

The authors declare no conflict of interest.

References

  1. Chandler, D.; Grove, K.; Wakefield, S. Resilience in the Anthropocene; Routledge: London, UK, 2020; pp. 22–23. [Google Scholar]
  2. Holling, C.S. Resilience and Stability of Ecological Systems. Annu. Rev. Ecol. Syst. 1973, 4, 1–23. [Google Scholar] [CrossRef] [Green Version]
  3. Pimm, S.L. The complexity and stability of ecosystems. Nature 1984, 307, 321–326. [Google Scholar] [CrossRef]
  4. Gunderson, L.H. Ecological Resilience—In Theory and Application. Annu. Rev. Ecol. Syst. 2000, 31, 425–439. [Google Scholar] [CrossRef] [Green Version]
  5. Holling, C.S. Engineering resilience versus ecological resilience. Eng. Ecol. Constraints 1996, 31, 32. [Google Scholar]
  6. Holling, C.S. Understanding the Complexity of Economic, Ecological, and Social Systems. Ecosystems 2001, 4, 390–405. [Google Scholar] [CrossRef]
  7. Yuan, Q.; Meng, F.; Li, F.; Liu, G.; Yang, Z. A Conceptual Framework for Enhancing Urban Resilience with Green and Blue Infrastructure from the Perspective of Food-Energy-Water Nexus. Urban Dev. Stud. 2022, 29, 20–27. [Google Scholar]
  8. Xu, Y.; Li, G.; Cui, S.; Xu, Y.; Pan, J.; Tong, N.; Xu, J.; Zhu, Y. Review and Perspective on Resilience Science: From Ecological Theory to Urban Practice. Acta Ecol. Sin. 2018, 38, 5297–5304. [Google Scholar]
  9. Shen, Q. Research on Resilient Thinking and Urban Ecological Planning. Shanghai Urban Plan. Rev. 2018, 3, 1–7. [Google Scholar]
  10. Fang, C. Important progress and future direction of studies on China’s urban agglomerations. J. Geogr. Sci. 2015, 25, 1003–1024. [Google Scholar] [CrossRef] [Green Version]
  11. Feng, D.; Li, J.; Li, X.; Zhang, Z. The Effects of Urban Sprawl and Industrial Agglomeration on Environmental Efficiency: Evidence from the Beijing–Tianjin–Hebei Urban Agglomeration. Sustainability 2019, 11, 3042. [Google Scholar] [CrossRef] [Green Version]
  12. Zhao, Y.; Wang, S.; Zhou, C. Understanding the relation between urbanization and the eco-environment in China’s Yangtze River Delta using an improved EKC model and coupling analysis. Sci. Total Environ. 2016, 571, 862–875. [Google Scholar] [CrossRef]
  13. Kalnay, E.; Cai, M. Impact of urbanization and land-use change on climate. Nature 2003, 423, 528–531, Erratum in Nature 2003, 425, 102. [Google Scholar] [CrossRef]
  14. McMichael, A.J.; Woodruff, R.E.; Hales, S. Climate change and human health: Present and future risks. Lancet 2006, 367, 859–869. [Google Scholar] [CrossRef] [PubMed]
  15. Grimm, N.B.; Faeth, S.H.; Golubiewski, N.E.; Redman, C.L.; Wu, J.; Bai, X.; Briggs, J.M. Global Change and the Ecology of Cities. Science 2008, 319, 756–760. [Google Scholar] [CrossRef] [Green Version]
  16. Berdugo, M.; Delgado-Baquerizo, M.; Soliveres, S.; Hernández-Clemente, R.; Zhao, Y.; Gaitán, J.J.; Gross, N.; Saiz, H.; Maire, V.; Lehmann, A.; et al. Global ecosystem thresholds driven by aridity. Science 2020, 367, 787–790. [Google Scholar] [CrossRef] [PubMed] [Green Version]
  17. Fang, C.; Bao, C.; Ma, H. China’s Urban Agglomeration Development Report 2016; Science Press: Beijing, China, 2016; pp. 12–17. [Google Scholar]
  18. Fang, C.; Song, J.; Lin, X. Theory and Practice on the Sustainable Development of China’s Urban Agglomeration; Science Press: Beijing, China, 2010; pp. 35–43. [Google Scholar]
  19. Fang, C.; Gao, Q.; Zhang, X.; Cheng, W. Spatiotemporal characteristics of the expansion of an urban agglomeration and its effect on the eco-environment: Case study on the northern slope of the Tianshan Mountains. Sci. China Earth Sci. 2019, 62, 1461–1472. [Google Scholar] [CrossRef]
  20. Li, C.; Wang, R.; Cui, X.; Fang, W.; Yu, Y.; Qing, P.; Zhong, H.; Yang, X. Responses of vegetation spring phenology to climatic factors in Xinjiang, China. Ecol. Indic 2021, 124, 107286. [Google Scholar] [CrossRef]
  21. Zhang, Y.; Yang, D.; Zhang, X.; Deng, H. Regional structure and spatial morphology characteristics of oasis urban agglomer-ation in arid area -A case of urban agglomeration in northern slope of Tianshan Mountains, Northwest China. Chin. Geogr. Sci 2009, 19, 341. [Google Scholar] [CrossRef]
  22. Gao, C.; Lei, J. Economic contacts of urban agglomerations at northern slope of Tianshan Mountains. J. Arid Land Resour. Environ. 2011, 25, 24–30. [Google Scholar]
  23. Duan, Z.; Zhang, X.; Lei, J.; Wang, J. Study on urban multidimensional niche of urban agglomeration on northern slope of Tianshan Mountains. J. Univ. Chin. Acad. Sci. 2014, 31, 506–516. [Google Scholar]
  24. Ma, W.; Ding, J.; Wang, R.; Wang, J. Drivers of PM2.5 in the urban agglomeration on the northern slope of the Tianshan Mountains, China. Environ. Pollut. 2022, 309, 119777. [Google Scholar] [CrossRef]
  25. Yan, Y.; Chai, Z.; Yang, X.; Zibibula, S.; Yang, S. The temporal and spatial changes of the ecological environment quality of the urban agglomeration on the northern slope of Tianshan Mountain and the influencing factors. Ecol. Indic. 2021, 133, 108380. [Google Scholar]
  26. Zhang, L.; Fang, C.; Zhu, C.; Gao, Q. Ecosystem service trade-offs and identification of eco-optimal regions in urban agglom-erations in arid regions of China. J. Clean. Prod. 2022, 373, 133823. [Google Scholar] [CrossRef]
  27. Zhi, X.; Anfuding, G.; Yang, G.; Gong, P.; Wang, C.; Li, Y.; Li, X.; Li, P.; Liu, C.; Qiao, C.; et al. Evaluation of the Water Resource Carrying Capacity on the North Slope of the Tianshan Mountains, Northwest China. Sustainability 2022, 14, 1905. [Google Scholar] [CrossRef]
  28. Feng, Y.; Lee, C.-C.; Peng, D. Does regional integration improve economic resilience? Evidence from urban agglomerations in China. Sustain. Cities Soc. 2023, 88, 104273. [Google Scholar] [CrossRef]
  29. Zebardast, E. The Hybrid Factor Analysis and Analytic Network Process (F’ANP) model modified: Assessing community social resilience in Tehran metropolis. Sustain. Cities Soc. 2022, 86, 104127. [Google Scholar] [CrossRef]
  30. Vasilis, D.; Sonia, K. Ecological resilience: What to measure and how. Environ. Res. Lett 2022, 17, 043003. [Google Scholar]
  31. Carpenter, S.; Walker, B.; Anderies, J.; Abel, N. From metaphor to measurement: Resilience of what to what? Ecosystems 2001, 4, 765–781. [Google Scholar] [CrossRef]
  32. Grafton, R.Q.; Doyen, L.; Béné, C.; Borgomeo, E.; Brooks, K.; Chu, L.; Cumming, G.S.; Dixon, J.; Dovers, S.; Garrick, D.; et al. Realizing resilience for decision-making. Nat. Sustain. 2019, 2, 907–913. [Google Scholar] [CrossRef] [Green Version]
  33. Ren, X. A Comparative Study on Urban Ecological Resilience in the Pearl River Delta Region. J. Landsc. Res. 2019, 11, 54–58. [Google Scholar]
  34. Feng, X.; Xiu, C.; Bai, L.; Zhong, Y.; Wei, Y. Comprehensive evaluation of urban resilience based on the perspective of landscape pattern: A case study of Shenyang city. Cities 2020, 104, 102722. [Google Scholar] [CrossRef]
  35. Huang, L.; Wang, J.; Cheng, H. Spatiotemporal changes in ecological network resilience in the Shandong Peninsula urban agglomeration. J. Clean. Prod. 2022, 339, 130681. [Google Scholar] [CrossRef]
  36. Yuan, Y.; Bai, Z.; Zhang, J.; Xu, C. Increasing urban ecological resilience based on ecological security pattern: A case study in a resource-based city. Ecol. Eng. 2021, 175, 106486. [Google Scholar] [CrossRef]
  37. Zhang, Y.; Yang, Y.; Chen, Z.; Zhang, S. Multi-criteria assessment of the resilience of ecological function areas in China with a focus on ecological restoration. Ecol. Indic. 2020, 119, 106862. [Google Scholar] [CrossRef]
  38. Chang, C.; Li, X.; Dong, Z.; Tong, X.; Peng, L. A new model for describing the urban resilience considering adaptability, resistance and recovery. Saf. Sci. 2020, 128, 104756. [Google Scholar]
  39. Xia, C.; Dong, Z.; Chen, B. Spatiotemporal analysis and simulation of urban ecological resilience: A case study of Hangzhou. Acta Ecol. Sin. 2022, 42, 116–126. [Google Scholar]
  40. Mckinney, M. Urbanization, biodiversity, and conservation. BioScience 2002, 52, 883–890. [Google Scholar] [CrossRef]
  41. Forman, R.; Sperling, D.; Bissonette, J. Road Ecology: Science and Solutions; Island Press: New York, NY, USA, 2003. [Google Scholar]
  42. Zhong, X.; Yan, Q.; Li, G. Long time series night light data set of China (2000-2020). Glob. Chang. Data Repos. 2022, 1. [Google Scholar] [CrossRef]
  43. Wu, L.; Sun, C.; Fan, F. Estimating the Characteristic Spatiotemporal Variation in Habitat Quality Using the InVEST Model—A Case Study from Guangdong–Hong Kong–Macao Greater Bay Area. Remote. Sens. 2021, 13, 1008. [Google Scholar] [CrossRef]
  44. Costanza, R.; d’Arge, R.; de Groot, R.; Farber, S.; Grasso, M.; Hannon, B.; Limburg, K.; Naeem, S.; O’Neill, R.V.; Paruelo, J.; et al. The value of the world’s ecosystem services and natural capital. Nature 1997, 387, 253–260. [Google Scholar] [CrossRef]
  45. Daily, G. The value of nature and the nature of value. Science 2000, 289, 395–396. [Google Scholar] [CrossRef] [Green Version]
  46. Egoh, B.; Rouget, M.; Reyers, B.; Knight, A.; Cowling, R.M.; van Jaarsveld, A.S.; Welz, A. Integrating ecosystem services into conservation assessments: A review. Ecol. Econ. 2007, 63, 714–721. [Google Scholar] [CrossRef]
  47. Lautenbach, S.; Kugel, C.; Lausch, A.; Seppelt, R. Analysis of historic changes in regional ecosystem service provisioning using land use data. Ecol. Indic. 2011, 11, 676–687. [Google Scholar] [CrossRef]
  48. Wainger, L.; King, D.; Mack, R.; Price, E.; Maslin, T. Can the concept of ecosystem services be practically applied to improve natural resource management decisions? Ecol. Econ. 2010, 69, 978–987. [Google Scholar] [CrossRef]
  49. Xie, G.; Zhang, C.; Zhang, L.; Chen, W.; Li, S. Improvement of the Evaluation Method for Ecosystem Service Value Based on Per Unit Area. J. Nat. Resour. 2015, 30, 1243–1254. [Google Scholar]
  50. Song, W.; Deng, X. Land-use/land-cover change and ecosystem service provision in China. Sci. Total. Environ. 2017, 576, 705–719. [Google Scholar] [CrossRef]
  51. Liu, Y.; Yuan, X.; Li, J.; Qian, K.; Yan, W.; Yang, X.; Ma, X. Trade-offs and synergistic relationships of ecosystem services under land use change in Xinjiang from 1990 to 2020: A Bayesian network analysis. Sci. Total. Environ. 2023, 858, 160015. [Google Scholar] [CrossRef]
  52. Peng, J.; Liu, Y.; Wu, J.; Lv, H.; Hu, X. Linking ecosystem services and landscape patterns to assess urban ecosystem health: A case study in Shenzhen City, China. Landsc. Urban Plan. 2015, 143, 56–68. [Google Scholar] [CrossRef]
  53. Lefever, D.W. Measuring Geographic Concentration by Means of the Standard Deviational Ellipse. Am. J. Sociol. 1926, 32, 88–94. [Google Scholar] [CrossRef]
  54. Wang, J.; Xu, C. Geodetector: Principle and prospective. Acta Geogr. Sin. 2017, 72, 116–134. [Google Scholar]
  55. Li, J.; Lü, Z.; Shi, X.; Li, Z. Spatiotemporal variations analysis for land use in Fen River Basin based on terrain gradient. Trans. Chin. Soc. Agric. Eng. 2016, 7, 230–236. [Google Scholar]
  56. ORDÓ, E.; DUINKER, P. Climate Change Vulnerability Assessment of the Urban Forest in Three Canadian Cities. Clim. Chang. 2015, 131, 531–543. [Google Scholar]
  57. Yin, Z.; Li, Y.; Gu, Z.; Zhao, F.; Zhao, T.; Zhou, X. On the Environmental Impacts of Road Construction and Ecological Road Construction. Res. Soil Water Conserv. 2006, 13, 161–164. [Google Scholar]
  58. Elvidge, C.; Cinzano, P.; Pettit, D. The Nightsat mission concept. Int. J. Remote Sens. 2007, 28, 2645–2670. [Google Scholar] [CrossRef]
  59. Chen, H.; Liang, L.; Yang, C. Ecological view of sustainable development highway construction. J. Chang′Univ. 2004, 24, 69–72. [Google Scholar]
  60. Shi, C.; Zhu, X.; Wu, H.; Li, Z. Assessment of Urban Ecological Resilience and Its Influencing Factors: A Case Study of the Beijing-Tianjin-Hebei Urban Agglomeration of China. Land 2022, 11, 921. [Google Scholar] [CrossRef]
  61. Zhang, L.; Fang, C.; Gao, Q. Spatial and temporal expansion of urban landscape and multi-scene simulation of urban ag-glomeration in northern slope of Tianshan Mountains. Acta Ecol. Sin. 2021, 41, 1267–1279. [Google Scholar]
Figure 1. Overview of the study area. Note: The map source is the standard map service website of the Ministry of Natural Resources of China, GS (2019) 1652. No modifications to the base map boundary were made.
Sustainability 15 04828 g001
Figure 2. Urbanization rate of the UANST.
Sustainability 15 04828 g002
Figure 3. Ecological resilience measurement framework.
Sustainability 15 04828 g003
Figure 4. Spatial distribution pattern of ecological resilience in the UANST.
Sustainability 15 04828 g004
Figure 5. The standard deviation ellipsis spatial distribution showing the ecosystem resilience of the UANST.
Sustainability 15 04828 g005
Figure 6. Spatial distribution of cold and hot spots of ecological resilience in the UANST.
Sustainability 15 04828 g006
Figure 7. Spatial distribution of resistance, resilience, regeneration capacity, and ecological resilience levels from 1990 to 2020.
Sustainability 15 04828 g007
Table 1. Sources of data on the study area.
Data NameTimeResolution RatioSource
Land-use1990, 2000, 2010, 20201 kmwww.resdc.cn
(accessed on 3 July 2022)
The digital elevation model (DEM), Slope2000, 2010, 20201 kmwww.gscloud.cn
(accessed on 13 September 2022)
Temperature, Precipitation2000, 2010, 20201 kmwww.geodata.cn
(accessed on 13 September 2022)
Highway, Railway2000, 2010, 2020\www.openstreetmap.org
(accessed on 13 September 2022)
Nighttime lights [42]2000, 2010, 20201 kmwww.geodoi.ac.cn
(accessed on 25 September 2022)
Population density, GDP2000, 2010, 20201 kmwww.resdc.cn
(accessed on 13 September 2022)
Table 2. Threat source weights and the maximum impact distance.
Threat SourceMaximum Impact Distance/kmWeightDecay
Arable land60.6Linear
Urban land100.9Exponential
Rural land80.7Exponential
Other construction lands 60.6Exponential
Unused land40.4Exponential
Table 3. Sensitivity of land-use types to threat sources.
Land-Use TypeHabitat LevelCropUrbanRuralOthersUnused
Crop0.500.80.60.70.3
Woodland10.80.90.80.80.5
Shrub land0.90.70.80.70.70.4
Sparse woodland0.80.60.70.70.60.5
Other woodlands0.80.60.70.60.60.5
High cover grassland0.90.60.70.70.70.6
Medium cover grassland0.80.60.60.50.60.5
Low cover grassland0.70.50.50.50.60.5
Rivers and lakes10.60.90.70.50.4
Reservoirs and beaches0.80.70.80.60.40.4
Glaciers and permanent snowfields0.10.20.10.10.10.1
Urban000000
Rural000000
Others000000
Sand, Gobi and Bare ground0.10.10000
Saline soil0.10.20.20.100
Marshland0.40.60.60.50.40.3
Table 4. ESV unit prices for various land-use types in the UANST (yuan hm−2 a−1).
Ecosystem Services Function Land-Use Types
Cultivated LandWood
Land
Grass
Land
Water
Area
Permanent Snow FieldsConstruction LandUnused Land
Food production2554.47701.23701.231968.440.000.0030.05
Raw materials1202.101612.821031.801096.920.000.0090.16
Water conservation60.11831.45571.0016,348.606491.350.0060.11
Gas regulation2013.525289.253626.344012.02540.950.00330.58
Climate regulation1081.8915,827.699586.778850.481622.840.00300.53
Purify the environment300.534708.243165.5413,749.05480.840.00931.63
Hydrological regulation811.4211,450.037022.28190,037.4221,427.480.00631.10
Soil formation and protection3095.416441.274417.734868.520.000.00390.68
Maintain nutrient circulation360.63490.86340.60375.660.000.0030.05
Biodiversity protection390.685870.274017.0315,657.3930.050.00360.63
Recreational culture180.322574.501773.109947.40270.470.00150.26
Table 5. Area and proportion of each level of ecological resilience from 1990 to 2020.
LevelValue Range1990200020102020
AreaProportionAreaProportionAreaProportionAreaProportion
10–0.239,707.0320.47%40,248.7120.75%39,521.6220.37%47,923.2224.71%
20.2–0.350,836.2926.21%50,909.6126.24%50,555.6826.06%45,871.0123.65%
30.3–0.433,228.9317.13%34,644.0517.86%36,913.2619.03%40,176.3820.71%
40.4–0.539,733.1120.48%37,876.7619.53%37,788.4919.48%33,372.517.20%
50.5–130,476.1415.71%30,302.3715.62%29,202.4515.05%26,638.3913.73%
Table 6. Standard deviation ellipse-related parameters of the ecosystem resilience of the UANST.
YearsGravity Center Coordinates (°E, °N)Brachyaxis (km)Macroaxis (km)Azimuth (°)
199087.97, 43.77128.92262.81112.14
200087.98, 43.77128.83262.24112.09
201087.98, 43.77129.36263.03112.10
202087.99, 43.75131.18263.45112.48
Table 7. Detection results for each influencing factor from 2000 to 2020.
Years Influencing Factors
ElevationSlopeTempPrecipitationPopulationGDPRoad NetworkNighttime Lighting
2000q0.3330.2750.430.4330.2490.1550.1730.002
p0.0000.0000.0000.0000.0000.0000.0000.798
2010q0.3330.2740.4420.4190.1140.1670.1680.005
p0.0000.0000.0000.0000.0000.0000.0000.344
2020q0.3840.3210.4900.4500.0030.0620.1130.015
p0.0000.0000.0000.0000.2680.0000.0000.000
Note: p < 0.01 passed the significance test.
Table 8. Interaction detection results for each influencing factor from 2000 to 2020.
2000 Influencing
Factors
ElevationSlopeTempPrecipitationPopulationGDPRoad NetNighttime Lighting
Elevation0.333
Slope0.4070.275
Temp0.5200.4670.431
Precipitation0.5660.5150.5380.433
Population0.5620.4930.6010.5350.249
GDP0.4960.4310.5480.4930.2780.155
Road network0.4630.3720.5350.5240.3310.2480.173
Nighttime lighting0.3470.2850.4380.4420.2780.1740.1770.002
2010 Influencing factors
Elevation0.333
Slope0.4060.274
Temp0.5200.4850.442
Precipitation0.5600.5140.5360.419
Population0.5060.4250.5650.4820.114
GDP0.5160.4420.5660.4650.2040.167
Road network0.4610.3960.5210.4870.2450.2770.168
Nighttime lighting0.3600.2930.4570.4340.1310.1830.1700.005
2020 Influencing factors
Elevation0.384
Slope0.4610.321
Temp0.5310.5270.490
Precipitation0.5730.5250.5740.450
Population0.3970.3340.5020.4660.003
GDP0.5160.4220.5750.4910.0710.062
Road network0.5110.4270.5600.4950.1180.1500.113
Nighttime lighting0.4470.3700.5290.4710.0190.0820.1230.015
Disclaimer/Publisher’s Note: The statements, opinions and data contained in all publications are solely those of the individual author(s) and contributor(s) and not of MDPI and/or the editor(s). MDPI and/or the editor(s) disclaim responsibility for any injury to people or property resulting from any ideas, methods, instructions or products referred to in the content.

