Article

Quantifying the Impact of Cascade Reservoirs on Streamflow, Drought, and Flood in the Jinsha River Basin

1
Institute of International Rivers and Eco-Security, Yunnan University, Kunming 650500, China
2
Yunnan Key Laboratory of International Rivers and Transboundary Eco-Security, Kunming 650091, China
*
Author to whom correspondence should be addressed.
Sustainability 2023, 15(6), 4989; https://doi.org/10.3390/su15064989
Submission received: 8 February 2023 / Revised: 4 March 2023 / Accepted: 9 March 2023 / Published: 10 March 2023
(This article belongs to the Special Issue Water Availability under Climate Change)

Abstract

:
The Jinsha River Basin (JRB) is the largest hydropower base in China, serving as the main source of the Western Route of China’s South-to-North Water Diversion Project. Under the influence of the reservoirs operation and climate change, the general hydrological regime in the JRB has been altered. Although the change process can be determined through a runoff time-series analysis and hydrological simulation, the individual impacts of the reservoirs have not been quantified. This study aimed to clarify the impact of the reservoirs in the JRB on the runoff, flood, and drought processes using a framework coupling long short-term memory (LSTM) and flood drought assessment techniques. The results are as follows: (1) From 1998 to 2020, reservoirs in the JRB changed the average daily runoff at Pingshan Station by −5.64%, +10.95%, and −10.93% at the annual and seasonal (dry and rainy) scales, respectively. (2) The operation of dams reduces the risk of flood disasters effectively. Compared with the natural river flow, the flood frequency decreased by 7.69%, and the total flow over the threshold was reduced by 37.86%. (3) The operation of dams has changed the duration and severity of drought, reducing extreme drought and increasing moderate and severe drought. In conclusion, the reservoirs in the JRB have positive effects on water resource regulation, and their mitigation of floods and extreme drought provides security for the middle and lower reaches of the Yangtze River. This study provides a reference for the LSTM modeling of reservoir basins, quantifying the impact of reservoirs on runoff, flood, and drought in the JRB.

1. Introduction

The hydrological regime of a river refers to changes in various hydrological elements of the river over time, including the annual and inter-annual change characteristics of streamflow, flood, and drought, and the change of the hydrological regime will further affect the water environment and water ecology [1,2]. In recent years, with changes in the global climate and human activity, the runoff situation of many basins has been changing [3,4].
The Jinsha River Basin (JRB) is the largest hydropower base in China [5], with 49 planned hydropower stations. Of the 17 completed hydropower stations, the Udongde, Baihetan, Xiluodu, and Xiangjia Dams are among the top 10 in the world in terms of installed capacity [6]. The construction and regulation of cascade reservoirs often interact in a complex rather than additive manner. In particular, as the upper reaches of China’s largest river, the Yangtze River, the Jinsha River is an important supplier and determinant of water resources in the downstream urban agglomeration, which lies in the lower reaches of the Yangtze River [7]. Furthermore, the Jinsha River has implications for the economic stability and regional security of southern China. The Jinsha River is also the main water source of the Western Route of China’s South-to-North Water Diversion Project [8], and the rational allocation of water resources from the Jinsha River is important for the successful implementation of this project. Therefore, changes in the hydrological regime of the JRB caused by the construction of hydropower stations have received extensive attention, and a method is urgently needed to quantify these changes.
To quantify the influence of reservoirs on runoff in the JRB, two methods are often used: historical time-series analysis and model simulation. With the use of historical time-series analysis, changes in hydrological indices before and after dam construction are compared, but this method is not ideal because it cannot ignore the influence of other factors such as climate change on runoff [9,10]. The impact of climate change and the cascade power stations on runoff can be determined using a model simulation by controlling the input variables [11,12]. Hydrological models are often represented by process-driven models and data-driven models. Process-driven models have been widely used over the past few decades. Chai [13] used the Mike 11-HD model for the Yangtze River, and showed that the Three Gorges Dam had different effects on runoff between the rainy and dry seasons in 2011. Wang [14] applied the SWAT-habitat model and reported that the streamflow of the Yalong River, the largest tributary of the Jinsha River, will increase from 2020 to 2100 and the hydropower stations will improve the living environment of fish. The process-driven model usually has a fixed structure, requires a large amount of measurement data, and is complex to model and calibrate for large watersheds [15,16,17]. Consequently, the construction and performance of process-driven models are limited for the JRB. In contrast, data-driven models often use open-source data and usually achieve higher performance for large watersheds [12]. Specifically, the long short-term memory (LSTM) model has a strong learning ability for time-series data and has achieved good performance for many watersheds [5,18]. In this study, the LSTM model was used to simulate streamflow. Subsequently, the effect of dams on the hydrological regime of the JRB was evaluated by building an assessment framework coupling the LSTM model with flood–drought assessment techniques.
The objectives of this study were to: (i) build a hydrological model suitable for the JRB based on neural networks; (ii) quantify the influence of cascade reservoirs on streamflow in the JRB; and (iii) analyze the effect of reservoirs on streamflow, flood, and drought events in the JRB. The innovation point is that this paper analyzes the influence of power stations at different times by constructing two scenarios: power station and power-station-free. The results of our study could provide technical support for the construction of hydrological models in regions with cascade reservoirs, a reference for the construction and operation of hydropower stations in the JRB, data for the Western Route of the South-to-North Water Diversion project, and research directions for water security in the Yangtze River basin.

2. Materials and Methods
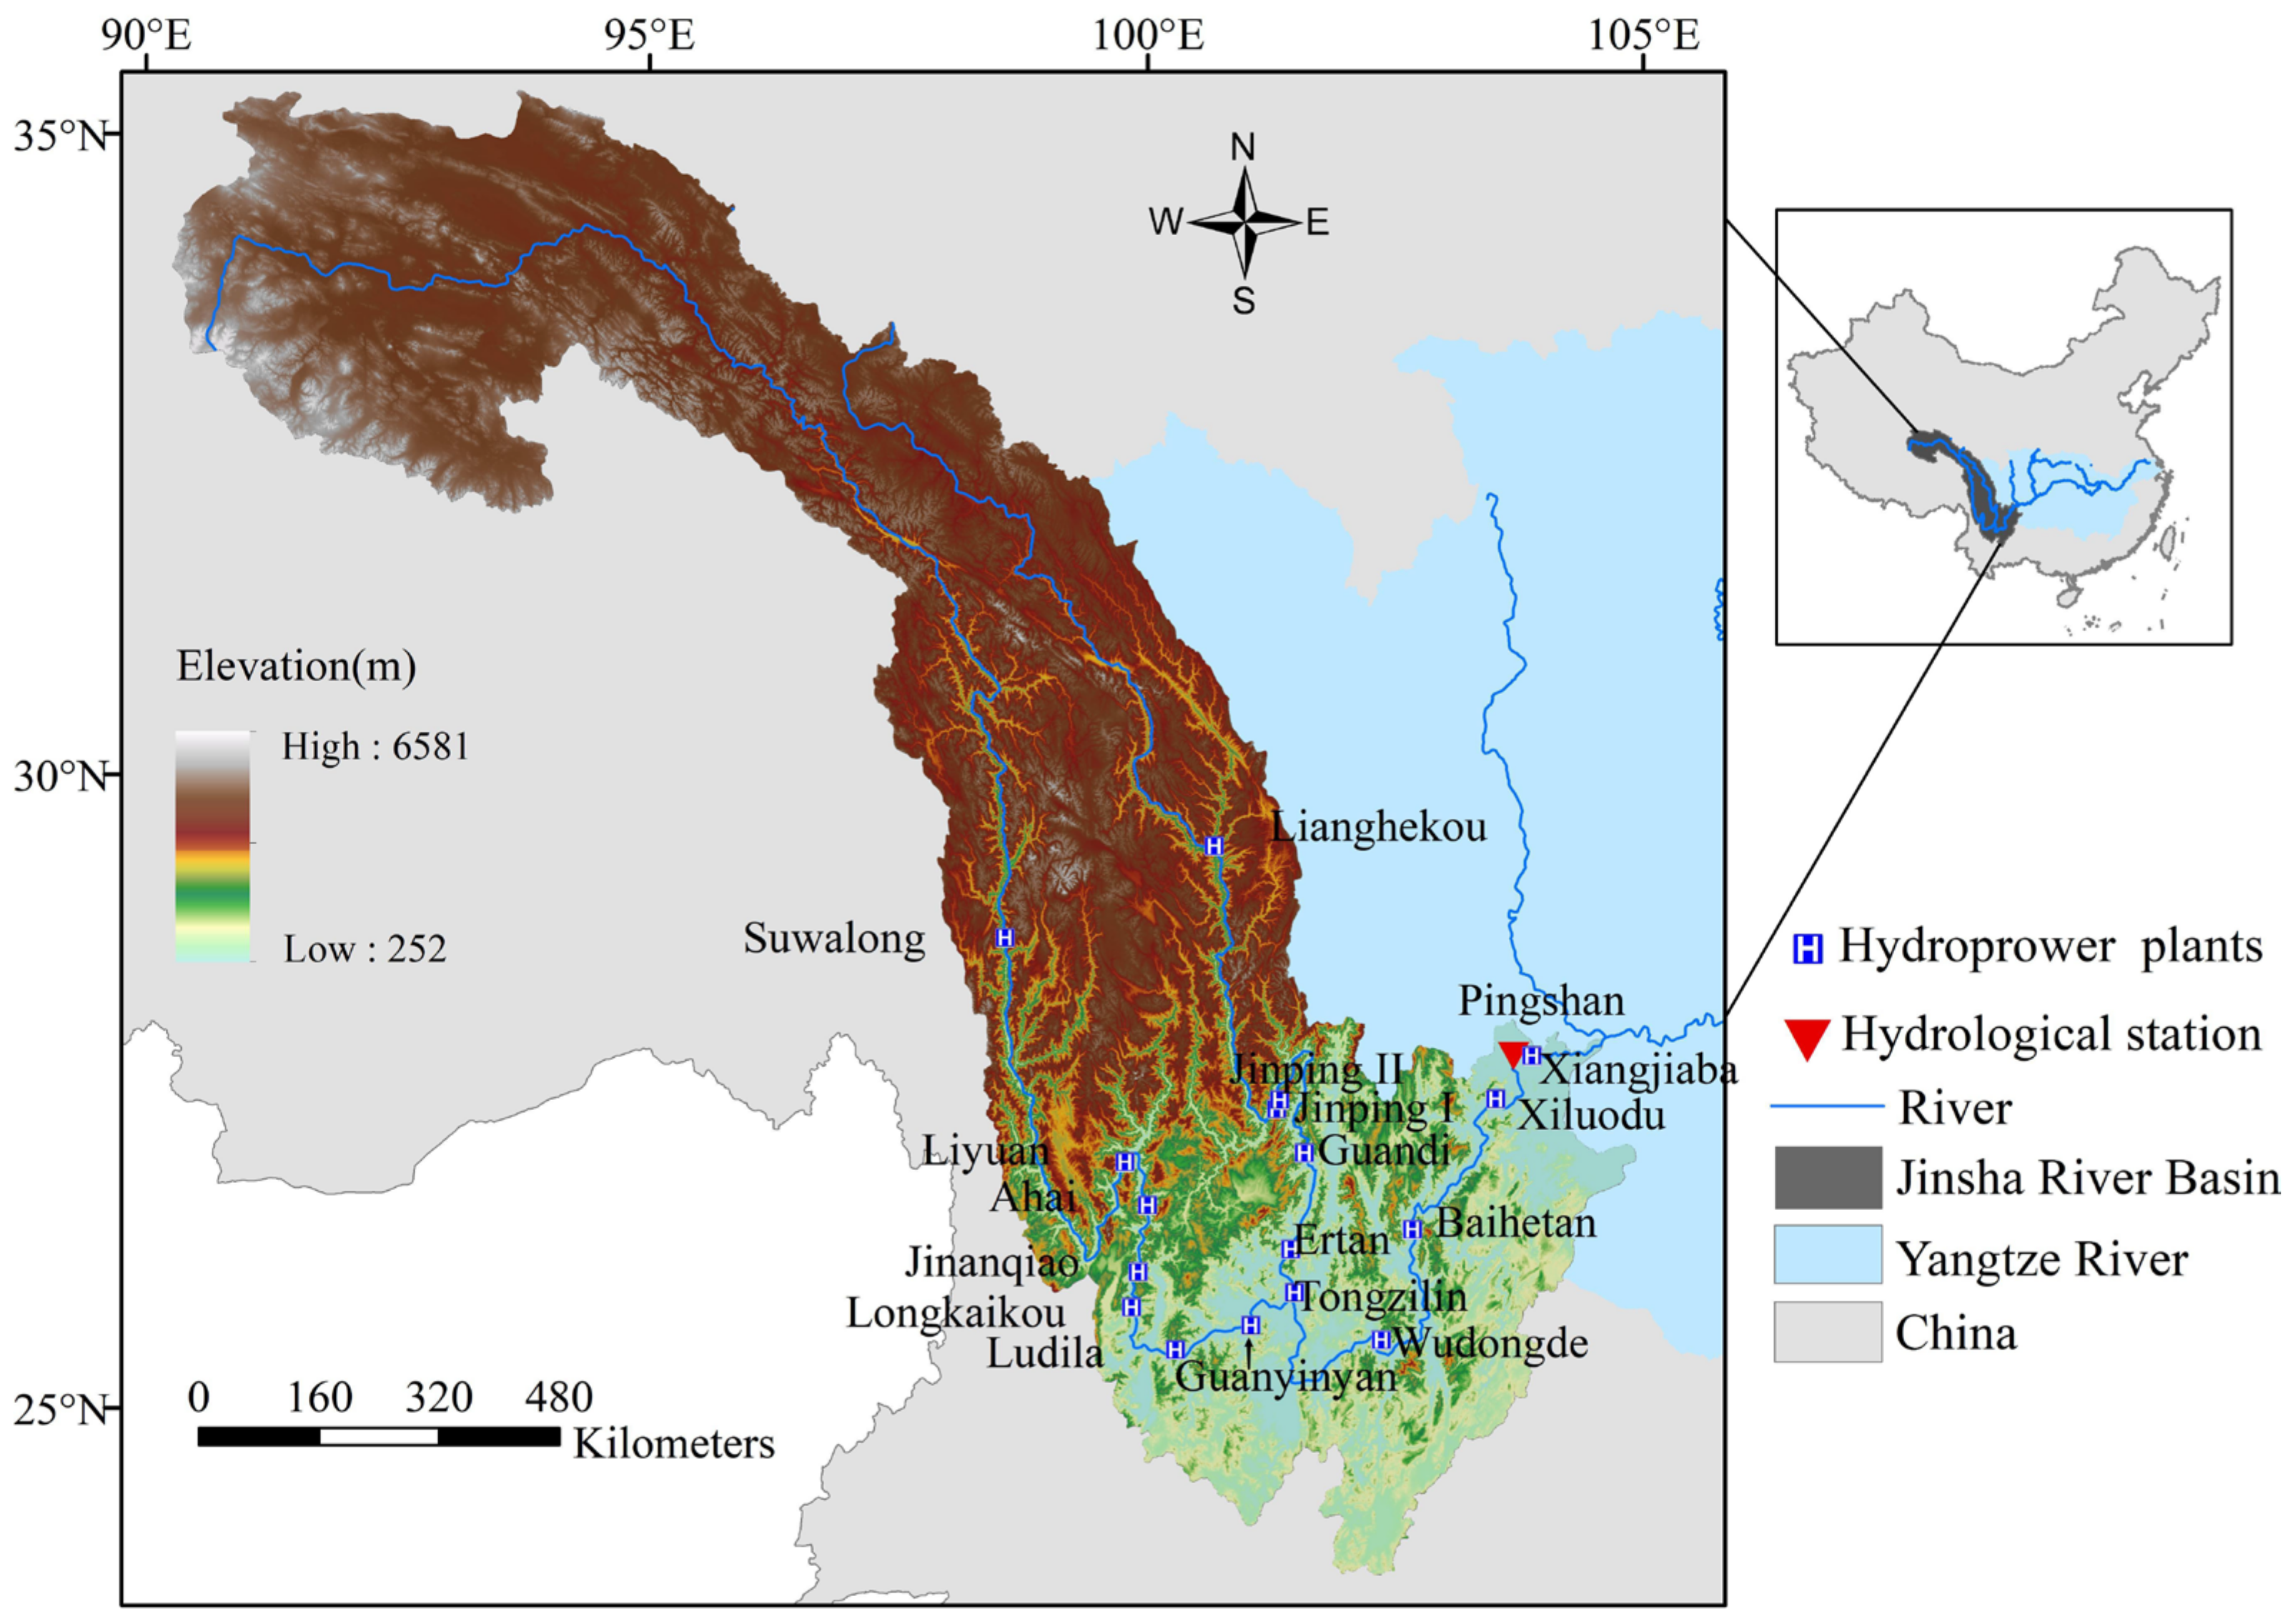
2.1. Study Area

The Jinsha River constitutes the upper reaches of the Yangtze River above the Pingshan hydrological station with a length of 3481 km. The JRB is located at 90–105° E, 24–36° N, with a drainage area of 47 × 104 km2 (Figure 1). In the JRB, precipitation and temperature present a heterogeneous distribution [19], with precipitation ranging from 300 mm to more than 1300 mm and the annual minimum temperature ranging from −5.6 °C to 21.9 °C [20]. The average annual runoff of the JRB is 145 billion m3, mainly governed by precipitation and melting snow (ice).
The Jinsha River originates from the Tibetan Plateau, and spans the Yunnan–Guizhou Plateau and the western edge of the Sichuan Basin with a complex and variable topography. The altitude difference between upstream and downstream can reach 6329 m. The JRB has abundant water resources, and it is the largest water and electricity energy base in China, with a potential capacity of approximately 100 million kW. A series of cascade reservoirs have been constructed in the basin. In this study, 15 reservoirs, with a total storage capacity of 57.2 billion m3, were considered, and their major parameters are shown in Table 1.

2.2. Acquisition and Processing of Data

The main data in this study include geographic information data, surface data, meteorological and hydrological data, and data of hydropower stations in the JRB. SRTM-DEM with a spatial resolution of 30 m (https://lpdaac.usgs.gov/, accessed on 23 September 2021) was used to extract the drainage network and virtual meteorological sites in the JRB. Streamflow time series were obtained from the Pingshan and Xiangjiaba hydrological stations. The Pingshan Hydrological Station is located in the reservoir area of Xiangjiaba hydropower station. After the impoundment of Xiangjiaba Reservoir, the operation of the Pingshan Hydrological Station was stopped. Flow data from the Pingshan Hydrological Station covering 1998–2012 and the Xiangjiaba Hydrological Station covering 2013–2020 were used. For convenience, these stations are collectively referred to as the Pingshan Hydrological Station. The input data included precipitation, snowmelt, evaporation, temperature, and soil moisture (Table 2) from 1985 to 2020 at virtual meteorological sites and they were unified into a daily scale of 0.5° × 0.5° spatial resolution. The input and output data were then standardized and normalized before modeling. Information on hydropower station parameters is detailed in Table 2.

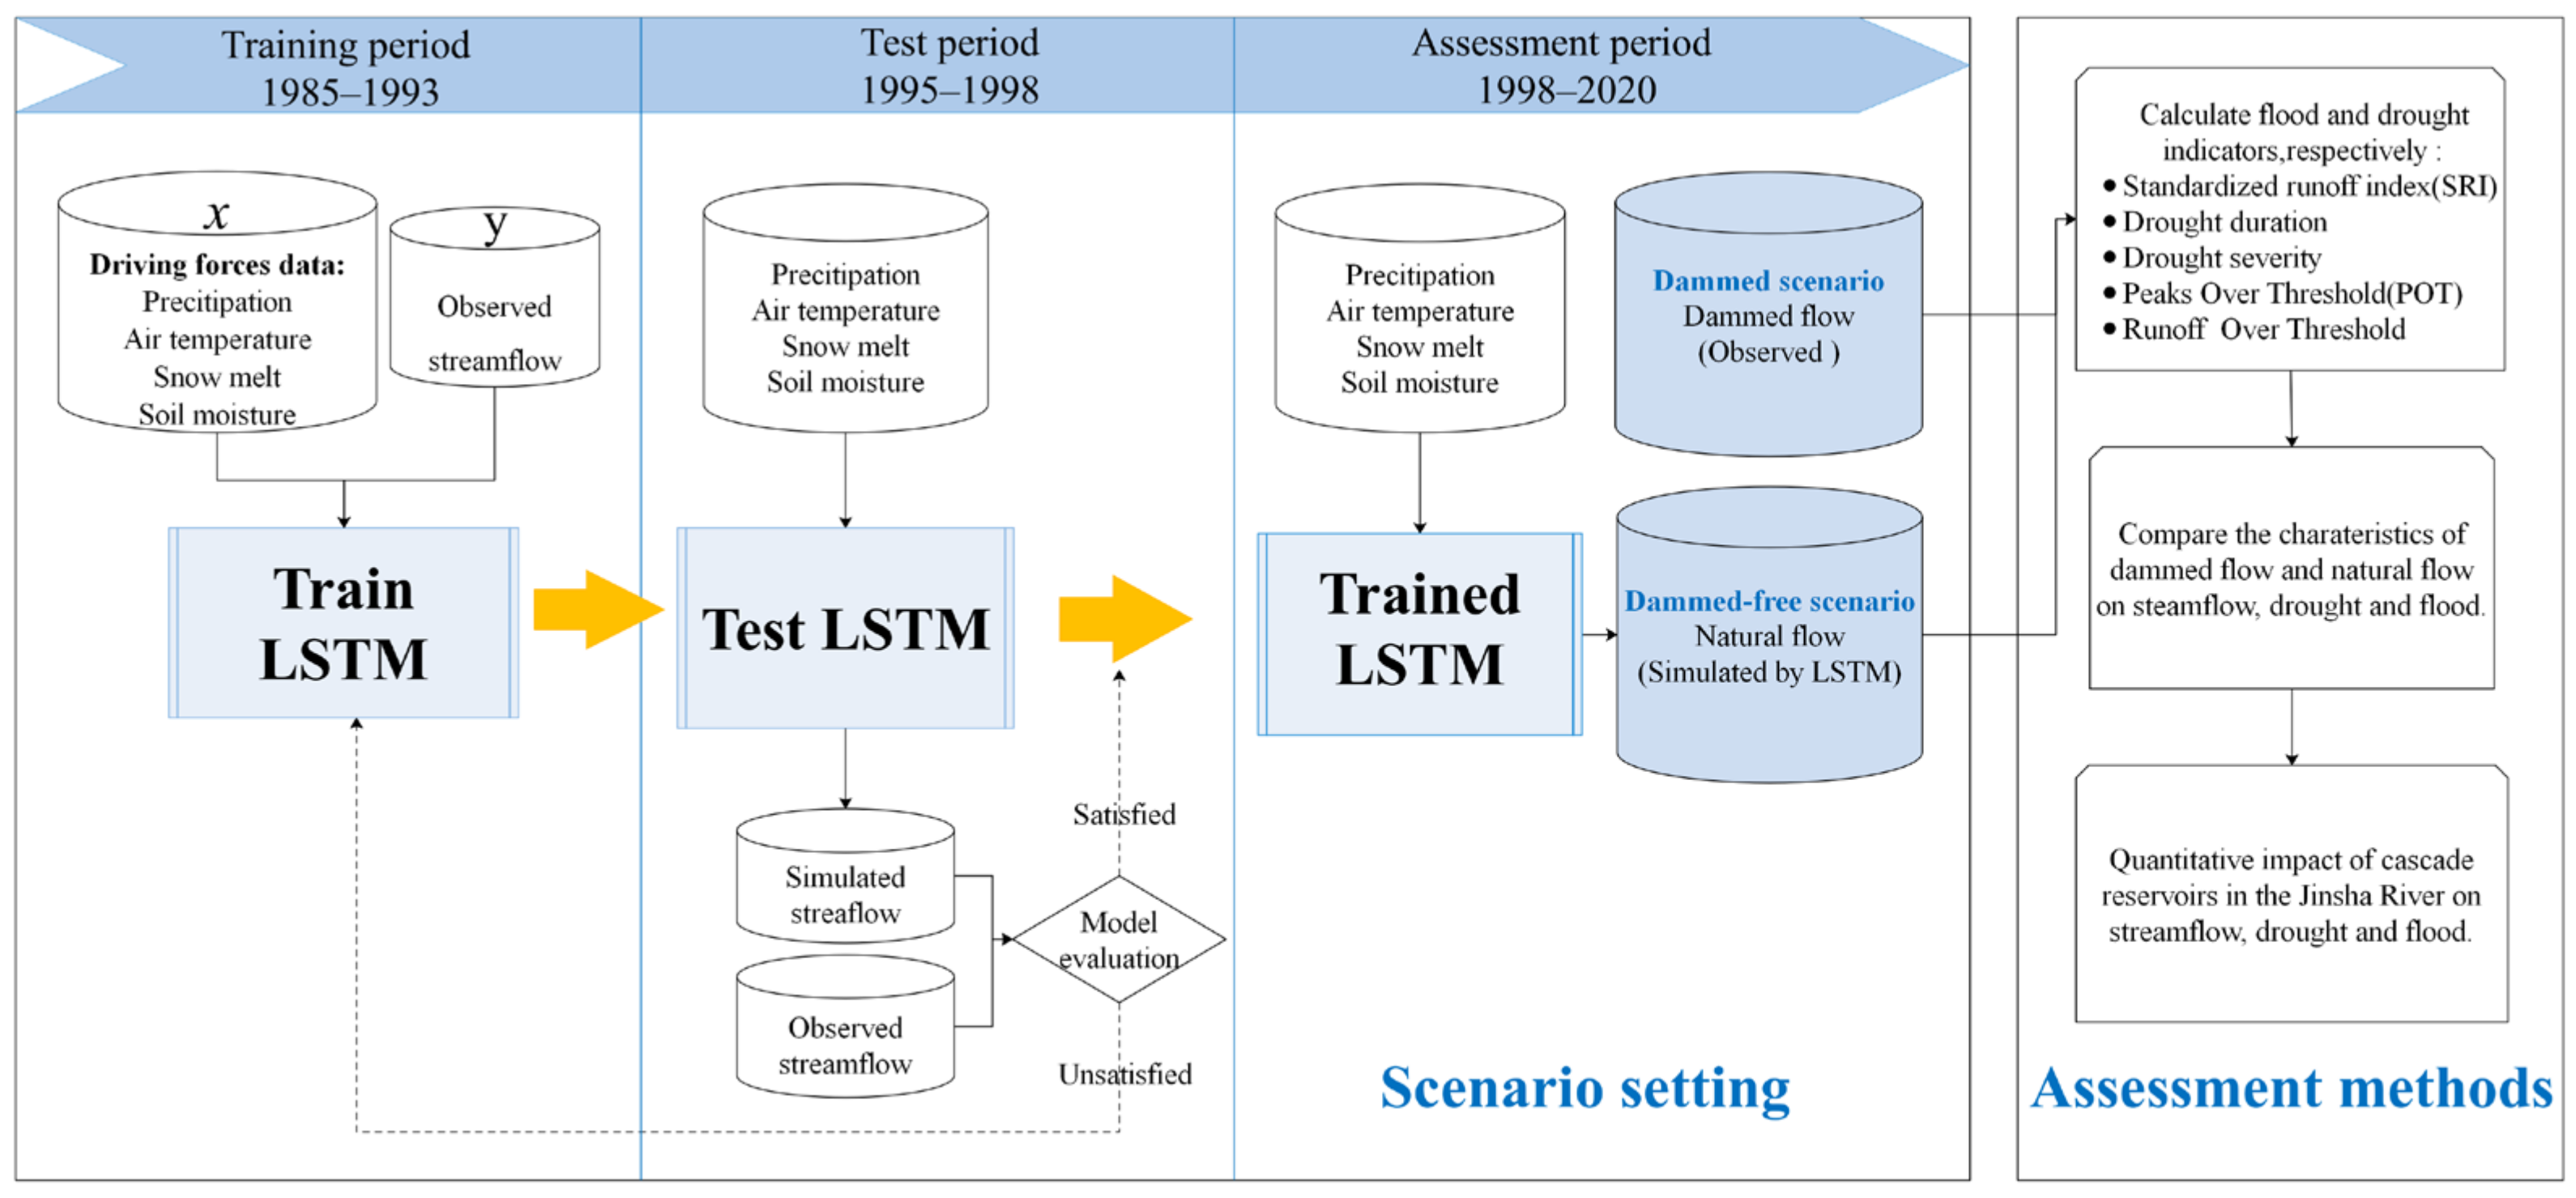
2.3. Assessment Framework and Scenario Setting

An assessment framework was constructed to evaluate the impact of reservoirs in the JRB on runoff, flood, and drought (Figure 2). Under this framework, two scenarios and a set of assessment methods for droughts and floods were built. One was the actual scenario of cascade reservoir construction, for which the actual observation streamflow time series from Pingshan Station (dammed flow) was used. The other was the virtual dam-free scenario, under which the streamflow time series of Pingshan station without dams was obtained using the LSTM model (natural flow). By comparing natural flow and dammed flow, the influence of reservoir construction on streamflow was obtained. Under the two scenarios, based on the flood and drought assessment method (the peaks-over-threshold method and the standardized runoff index), the characteristics of drought and flood situations were analyzed, and the impact of dams on flood and drought were then quantified by comparing the characteristics.
In particular, the concept of baseline period and assessment period was introduced. The baseline period refers to the period of 1985–1997 when no dam was built on the Jinsha River, while the assessment period refers to the period of 1998–2020 when plenty of dams were built. Firstly, the LSTM model was built and trained with baseline period data, and the model parameters were then determined. Next, meteorological and subsurface data of the assessment period were input into the above model, through which the natural flow without dams during the assessment period can be output. In detail, the entire study period can be divided into the training period (1985–1993), testing period (1994–1997), and assessment period (1998–2020).
In order to determine the influence of the construction of power stations on runoff in different periods, the assessment period was divided into four periods according to the accumulated storage capacity and the number of power stations constructed (Figure 3): 1998–2010(P1), 2011–2012(P2), 2013–2019(P3), and 2020(P4).

2.4. Hydrological Model of the JRB Based on LSTM

2.4.1. LSTM Model

The LSTM model is a variant of the circulating neural network. It includes storage units and door structures that control internal information flow [21]. The LSTM model is often used to simulate long time-series data. It consists of an input layer, several hidden layers, and an output layer, and each layer consists of several neurons [22]. Data of driving forces are input to the model through the input layer, after which weighted operations are performed in the hidden layer. Finally, the data are transmitted to the output layer after the transformation of the activation function. LSTM is trained on the basis of the truncated backpropagation through time, which uses a reverse propagation network to update the parameters in iterations [23]. The performance of the model is mainly influenced by parameters such as number of network layers, number of neurons, maximum epoch number, initial learning rate, learn rate drop period, learn rate drop factor, and the length of the time lag. LSTM neurons have input gate, forget gate, output gate, and memory unit. The input gate specifies what information is added to the cell state, and it is responsible for controlling the information added to the cell state. The forget gate determines what information is preserved and what is abandoned by the logistic sigmoid function [24]. The output gate drives the output flow activated by the cell. The expressions of the functions involved in LSTM are given in Equations (1)–(6).
i [ t ] = s ( W i x [ t ] + U i h [ t 1 ] + b i )
f [ t ] = σ ( W f x [ t ] + U f h [ t 1 ] + b f )
g [ t ] = t a n h ( W g x [ t ] + U g h [ t 1 ] + b g )
o [ t ] = σ ( W o x [ t ] + U o h [ t 1 ] + b o )
c [ t ] = f [ t ] c [ t 1 ] + i [ t ] g [ t ]
h [ t ] = o [ t ] t a n h ( c [ t ] )
where i [ t ] , o [ t ] , and f [ t ] represent the input, output, and forget gates, respectively; g [ t ] is the updated cell state; x [ t ] and h [ t ] are the input data and output data for t time; h [ t 1 ] is the output of the t 1 time neuron; W , U , and b are learning parameters; σ is the logistic sigmoid function; t a n h denotes the hyperbolic tangent function; and represents the scalar product of two vectors.
In our study, input data for the LSTM model included precipitation, temperature, snowmelt, evaporation, and soil moisture, and the target vector of the fit was set as streamflow. The change of precipitation and temperature in the basin will take a certain amount of time to cause changes in the flow of the drainage section. Therefore, a time lag was introduced during the construction of the LSTM model. Preliminary tests showed that the model performed best for the JRB with a time lag of 4 days. Accordingly, temperature and precipitation data of the past 4 days were also input to the model.

2.4.2. Model Evaluation Indicators

To estimate the overall performance of the model, various standard statistical indicators were used in this study. Several studies show the coefficient of determination (R2), Nash–Sutcliffe Efficiency (NSE), RMSE-observations standard deviation ratio (RSR), and Percentage bias (PBIAS) are excellent indicators for evaluating hydrological models [25,26,27]. Therefore, these indicators were used in this study. The mathematical expressions of these indicators are as follows:
(1)
R2:
R 2 = i = 1 n Q o b s , i Q ¯ o b s Q s i m , i Q ¯ s i m 2 i = 1 n Q o b s , i Q ¯ o b s 2 i = 1 n Q s i m , i Q ¯ s i m 2
(2)
NSE:
N S E = 1 i = 1 n ( Q o b s , i Q s i m , i ) 2 i = 1 n ( Q o b s , i Q ¯ o b s ) 2
(3)
RSR:
R S R = R M S E S T D E V o b s = i = 1 n Q o b s , i Q s i m , i 2 i = 1 n Q o b s , i Q ¯ o b s 2
(4)
PBIAS:
P B I A S = i = 1 n Q o b s , i Q s i m , i × 100 i = 1 n Q o b s , i
where Q o b s , i indicates observed streamflow of the i th day. Q ¯ o b s is the average observed streamflow. Q s i m , i indicates simulated streamflow of the i th day. Q ¯ s i m is the average simulated streamflow. n represents the total number of days.

2.5. Flood Characteristics Index

To quantify the impact of reservoirs on floods, the frequency and magnitude of floods should be taken into account. The Peaks Over Threshold (POT) [28,29,30] is a commonly used index for quantifying the frequency of flood events. POT is the number of flood events that exceed a specified threshold. According to this threshold, there are 2–3 flood events exceeding it every year on average during the base period. Then, the threshold is used during the assessment period to detect flood events. In particular, in the 15-day window, only one peak was considered, to avoid double counting of the same flood [30]. By comparing the POT of natural flow and dammed flow, the influence of reservoirs in the JRB on flood frequency can be determined. The magnitude of the flood was mainly evaluated by calculating the total runoff exceeding the flood threshold. By comparing this value between natural flow and dammed flow, the impact of reservoirs on flood magnitude can be obtained.

2.6. Drought Characteristics Index

Hydrological drought usually reflects the decrease of river runoff, surface water, and reservoir storage. The standardized runoff index (SRI) is a common indicator in the assessment of hydrological drought [31,32,33]. Therefore, it was selected to measure the effect of reservoir construction on drought. The calculation of SRI is based on the historical runoff data of long time series, which is as follows: Firstly, we fit the streamflow record to Pearson III distribution, and then convert it to normal distribution through an equal-probability function. Different timescales of the SRI reflect different dry conditions, with short timescales of the SRI being more representative of the characteristics of a short-term drought, and long timescales being more representative of long-term dry conditions [34]. In this study, the SRI of four timescales were considered: 1- (SRI1), 3- (SRI3), 6- (SRI6), and 12- (SRI12) month scales. The relationship between drought grade and SRI is as follows: mild, moderate, severe, and extreme drought corresponding to (−1, −0.5], (−1, −1.5], (−1.5, −2], and (−∞, −2] [32]. To quantify the impact of reservoirs on drought, drought duration and severity should be taken into consideration. According to the run theory and the truncation level [35,36], the sequence of SRI is truncated at a truncation level, and the duration of a drought event is the length of the time period in which the SRI is continuously below the truncation level. The severity of a drought was defined by the accumulated SRI during the drought period (Figure 4). The drought severity reflects the drought from the degree of drought water shortage. The smaller the drought severity value, the higher the disaster risk. The greater the drought severity value, the lower the risk of disasters.

3. Results

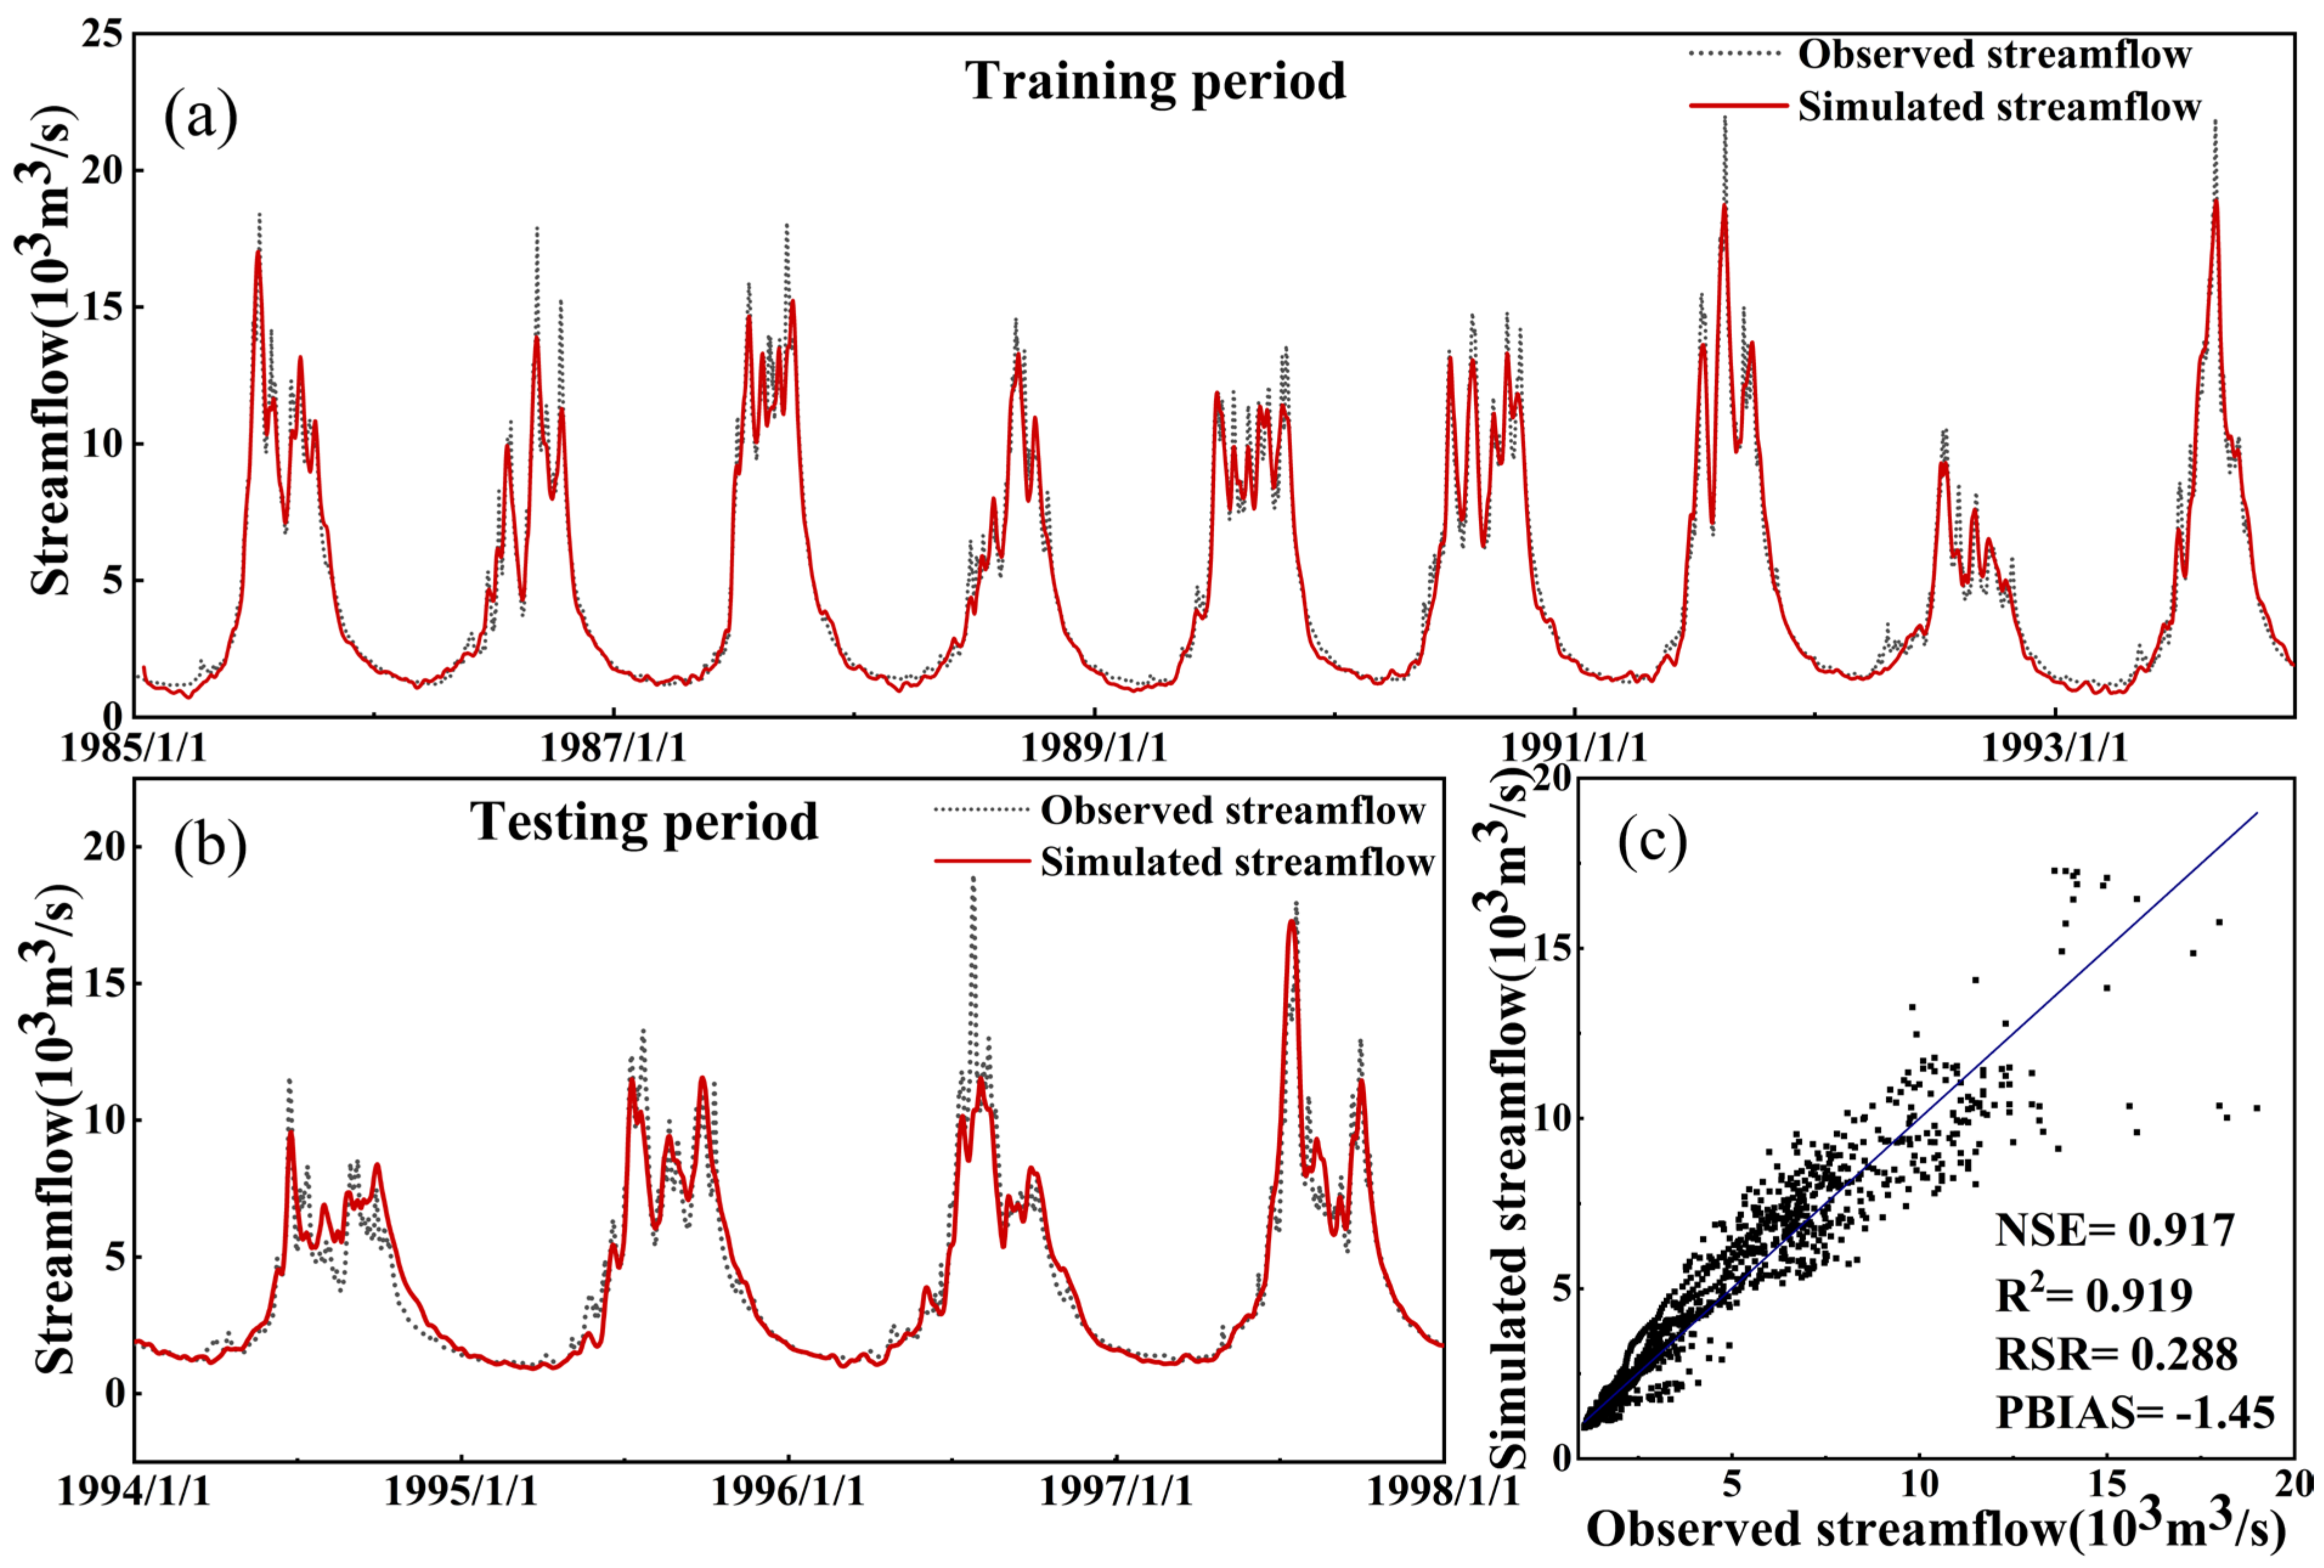
3.1. Results of Calibration and Validation

The LSTM model was evaluated by graphical fitting and quantitative statistical indicators. As shown in Figure 5a,b, the simulated streamflow was consistent with the observed streamflow trend, the low-value simulation was good, and part of the high-value simulation was underestimated slightly. The scatter diagram (Figure 5c), in which data points are concentrated near y = x, also intuitively suggests that the LSTM model is suitable for the JRB. In terms of the quantitative statistical indicators, the NSE was 0.917, R2 was 0.919, RSR was 0.288, and PBIAS was −1.45 in the testing period, all of which indicate good performance. In addition, during the test period, the LSTM simulated an average flow of 4072.02 m3/s, which is close to the observed 4013.85 m3/s. Specifically, the average streamflow in the wet season simulated by the LSTM was 7164.44 m3/s, and the observed streamflow was 7032.86 m3/s, presenting a difference of 1.87%. The average streamflow in the dry season simulated by the LSTM was 1830.92 m3/s, and the observed streamflow was 1826.09 m3/s, presenting a difference of only 4.83 m3/s. On the whole, the LSTM model showed good performance for the JRB, and the accuracy could satisfy the requirements of this study.

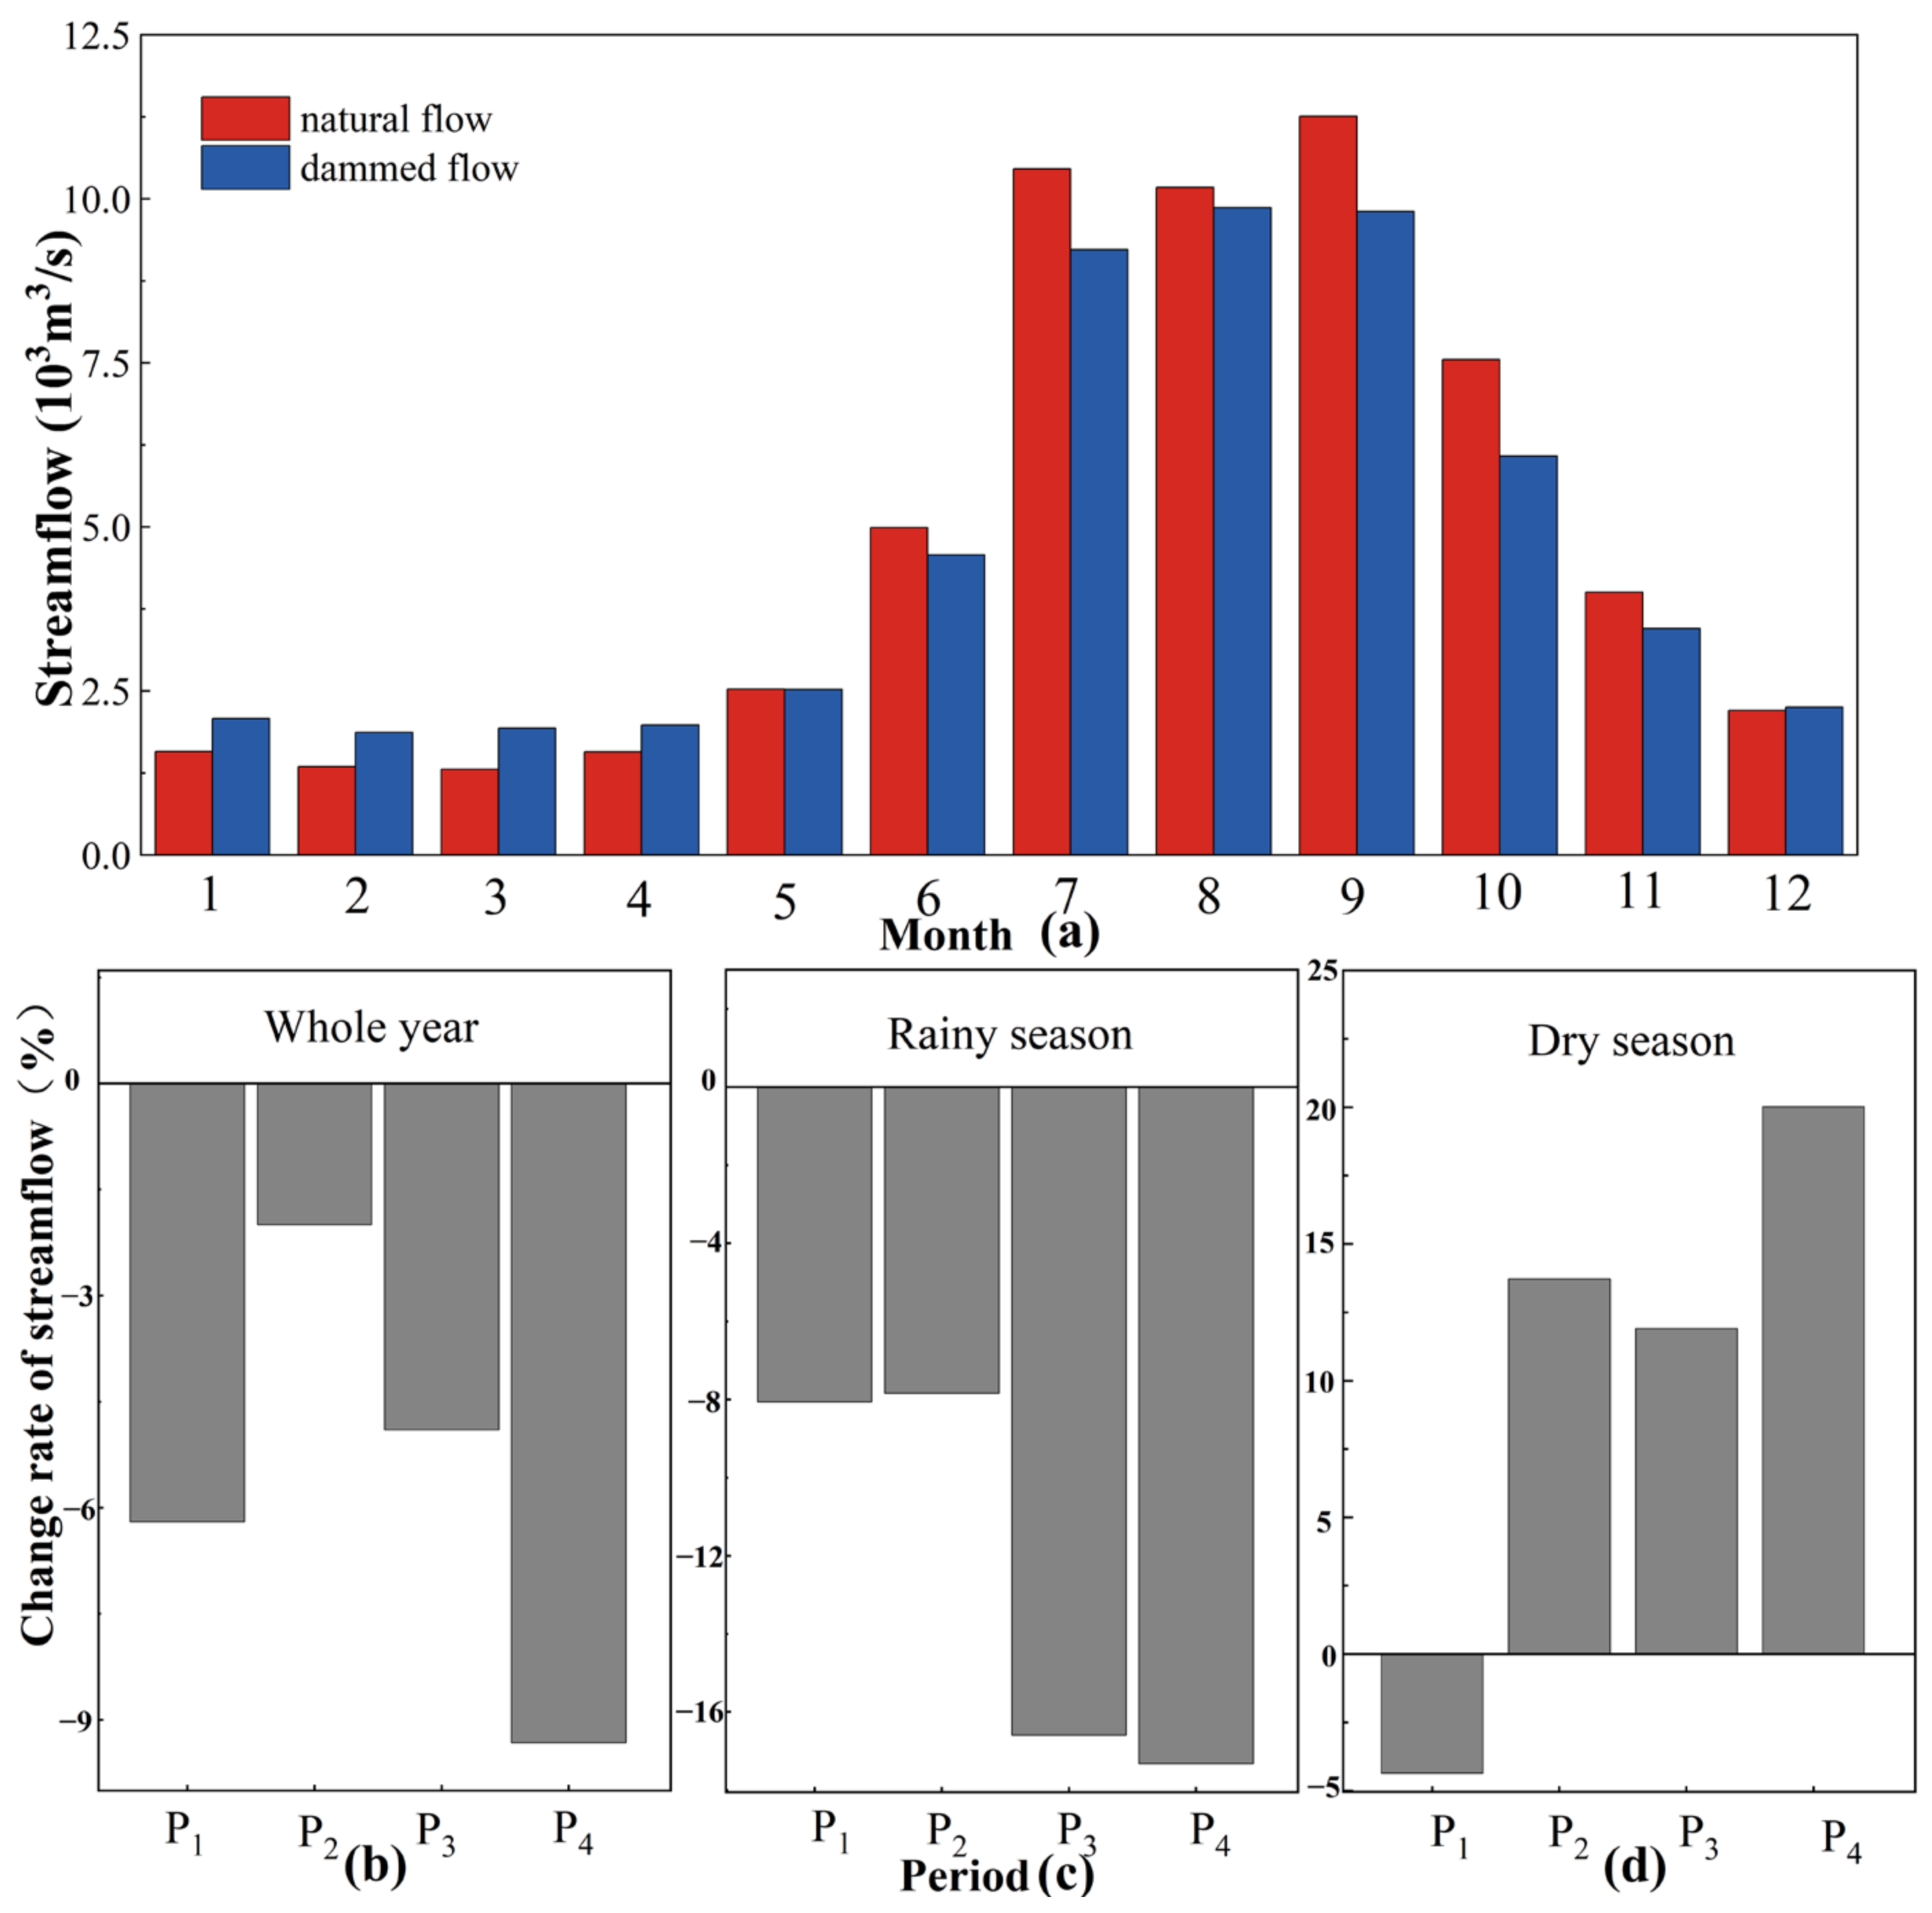
3.2. Quantitative Influence of Reservoirs on Runoff in the JRB

In general, from 1998 to 2020, the cumulative influence of the operation of 15 reservoirs in the JRB are as follows: at the annual scale, the average daily runoff at Pingshan Station decreased from 4937.97 m3/s to 4657.10 m3/s, a decrease of 5.69%; during the rainy season, it decreased by −10.93% from 8794.44 m3/s to 7832.83 m3/s; during the dry season, it increased by 10.95% from 2064.20 m3/s to 2290.24 m3/s.
The streamflow in the JRB showed a typical summer flood pattern. As shown in Figure 6a, the distribution of natural flow (dam-free) and dammed flow in January–December were different. The construction of the reservoirs reduced the streamflow of Pingshan Station from June to November, with significant reductions in July, September, and October. In contrast, the construction increased the streamflow from December to May (the following year), with prominent increases in January, February, March, and April. Further, the construction of reservoirs in the JRB changed the annual variance coefficient from 0.76 to 0.67. In general, the cascade reservoirs in the JRB have reduced the differences in the annual distribution of the streamflow at Pingshan Station, with clear effects of peak weakening and valley replenishing.
The impact of reservoirs on the streamflow at Pingshan Station during different time periods is shown in Figure 6. At the annual scale, the construction of reservoirs reduced the streamflow at Pingshan Station (Figure 6b). During the first period (P1: 1998–2010), the construction of the Ertan and Jinanqiao dams reduced the average daily streamflow at Pingshan Station by 6.20%. During the second period (P2: 2011–2012), the Ahai, Guandi, Xiangjiaba, Jinping I, Longkaikou, and Jinping II reservoirs were completed, decreasing the average daily streamflow by 2.00%. During the third period (P3: 2013–2019), the Xiluodu, Ludila, Guanyinyan, Liyuan, and Tongzilin reservoirs were completed, and the cumulative storage capacity reached 36.1 billion m3, decreasing the average daily streamflow by 4.9%. In the fourth period (P4: 2020), the Wudongde and Lianghekou reservoirs were built to store water, and the average daily streamflow decreased by 9.32%. Overall, the runoff change is related to the cascade reservoirs and the total reservoir capacity. The larger the total reservoir capacity, the stronger the impact. However, the impact of the reservoirs on the hydrological regime does not show a linear trend because it is also related to the inflow and reservoir operation modes.
The impact of the reservoirs in the JRB on runoff showed significant seasonality in each time period. In terms of the wet season (June to October), the average daily streamflow at Pingshan Station was reduced to varying degrees in different time periods under the influence of the reservoirs (Figure 6c). During the wet season in P1 and P2, the construction of reservoirs decreased the average daily streamflow at Pingshan Station by 8.06% and 7.84%, respectively. During the wet season in P3 and P4, the effect of the reservoirs on runoff was significantly enhanced, with the average daily streamflow decreasing by 16.59% and 17.32%, respectively. In terms of the dry season (November to May of the following year), the average daily streamflow at Pingshan Station was increased to varying degrees, except for P1, under the influence of the reservoirs (Figure 6d). During P1, the Ertan and Jinanqiao reservoirs reduced the dry seasonal streamflow at Pingshan Station by −4.36%; during P2, the reservoirs increased the dry seasonal streamflow significantly by 13.73%; during P3, the dry seasonal streamflow increased by 11.90%; and during P4, it increased by 20.01%. In short, the dams generally reduced the streamflow in the rainy season and increased the flow in the dry season, especially after the construction of large dams such as Xiluodu and Wudongde.

3.3. Changes in Flood Situation

Regarding flood events at Pingshan Station during 1998–2020, under the dam-free scenario, a total of 60 flood events exceeding the threshold occurred, with an average annual frequency of 2.6. Under the dammed scenario, a total of 56 flood events exceeding the threshold occurred, with an average annual frequency of 2.4. These results indicate that the operation of reservoirs in the JRB reduced the frequency of flood events by 7.69%. In terms of the flood magnitude, under the natural-flow scenario, runoff exceeding the threshold at Pingshan Station during 1998–2020 was 1.21 × 10⁷ m3, with an average annual value of 5.25 × 10⁵ m3, while that under the dammed scenario was 7.51 × 10⁶ m3, with an average annual value of 3.26 × 10⁵ m3. These results show that the operation of reservoirs in the JRB reduced the flood magnitude by 37.86%. In other words, the cascade reservoirs in the JRB reduce the frequency and magnitude of flood events.

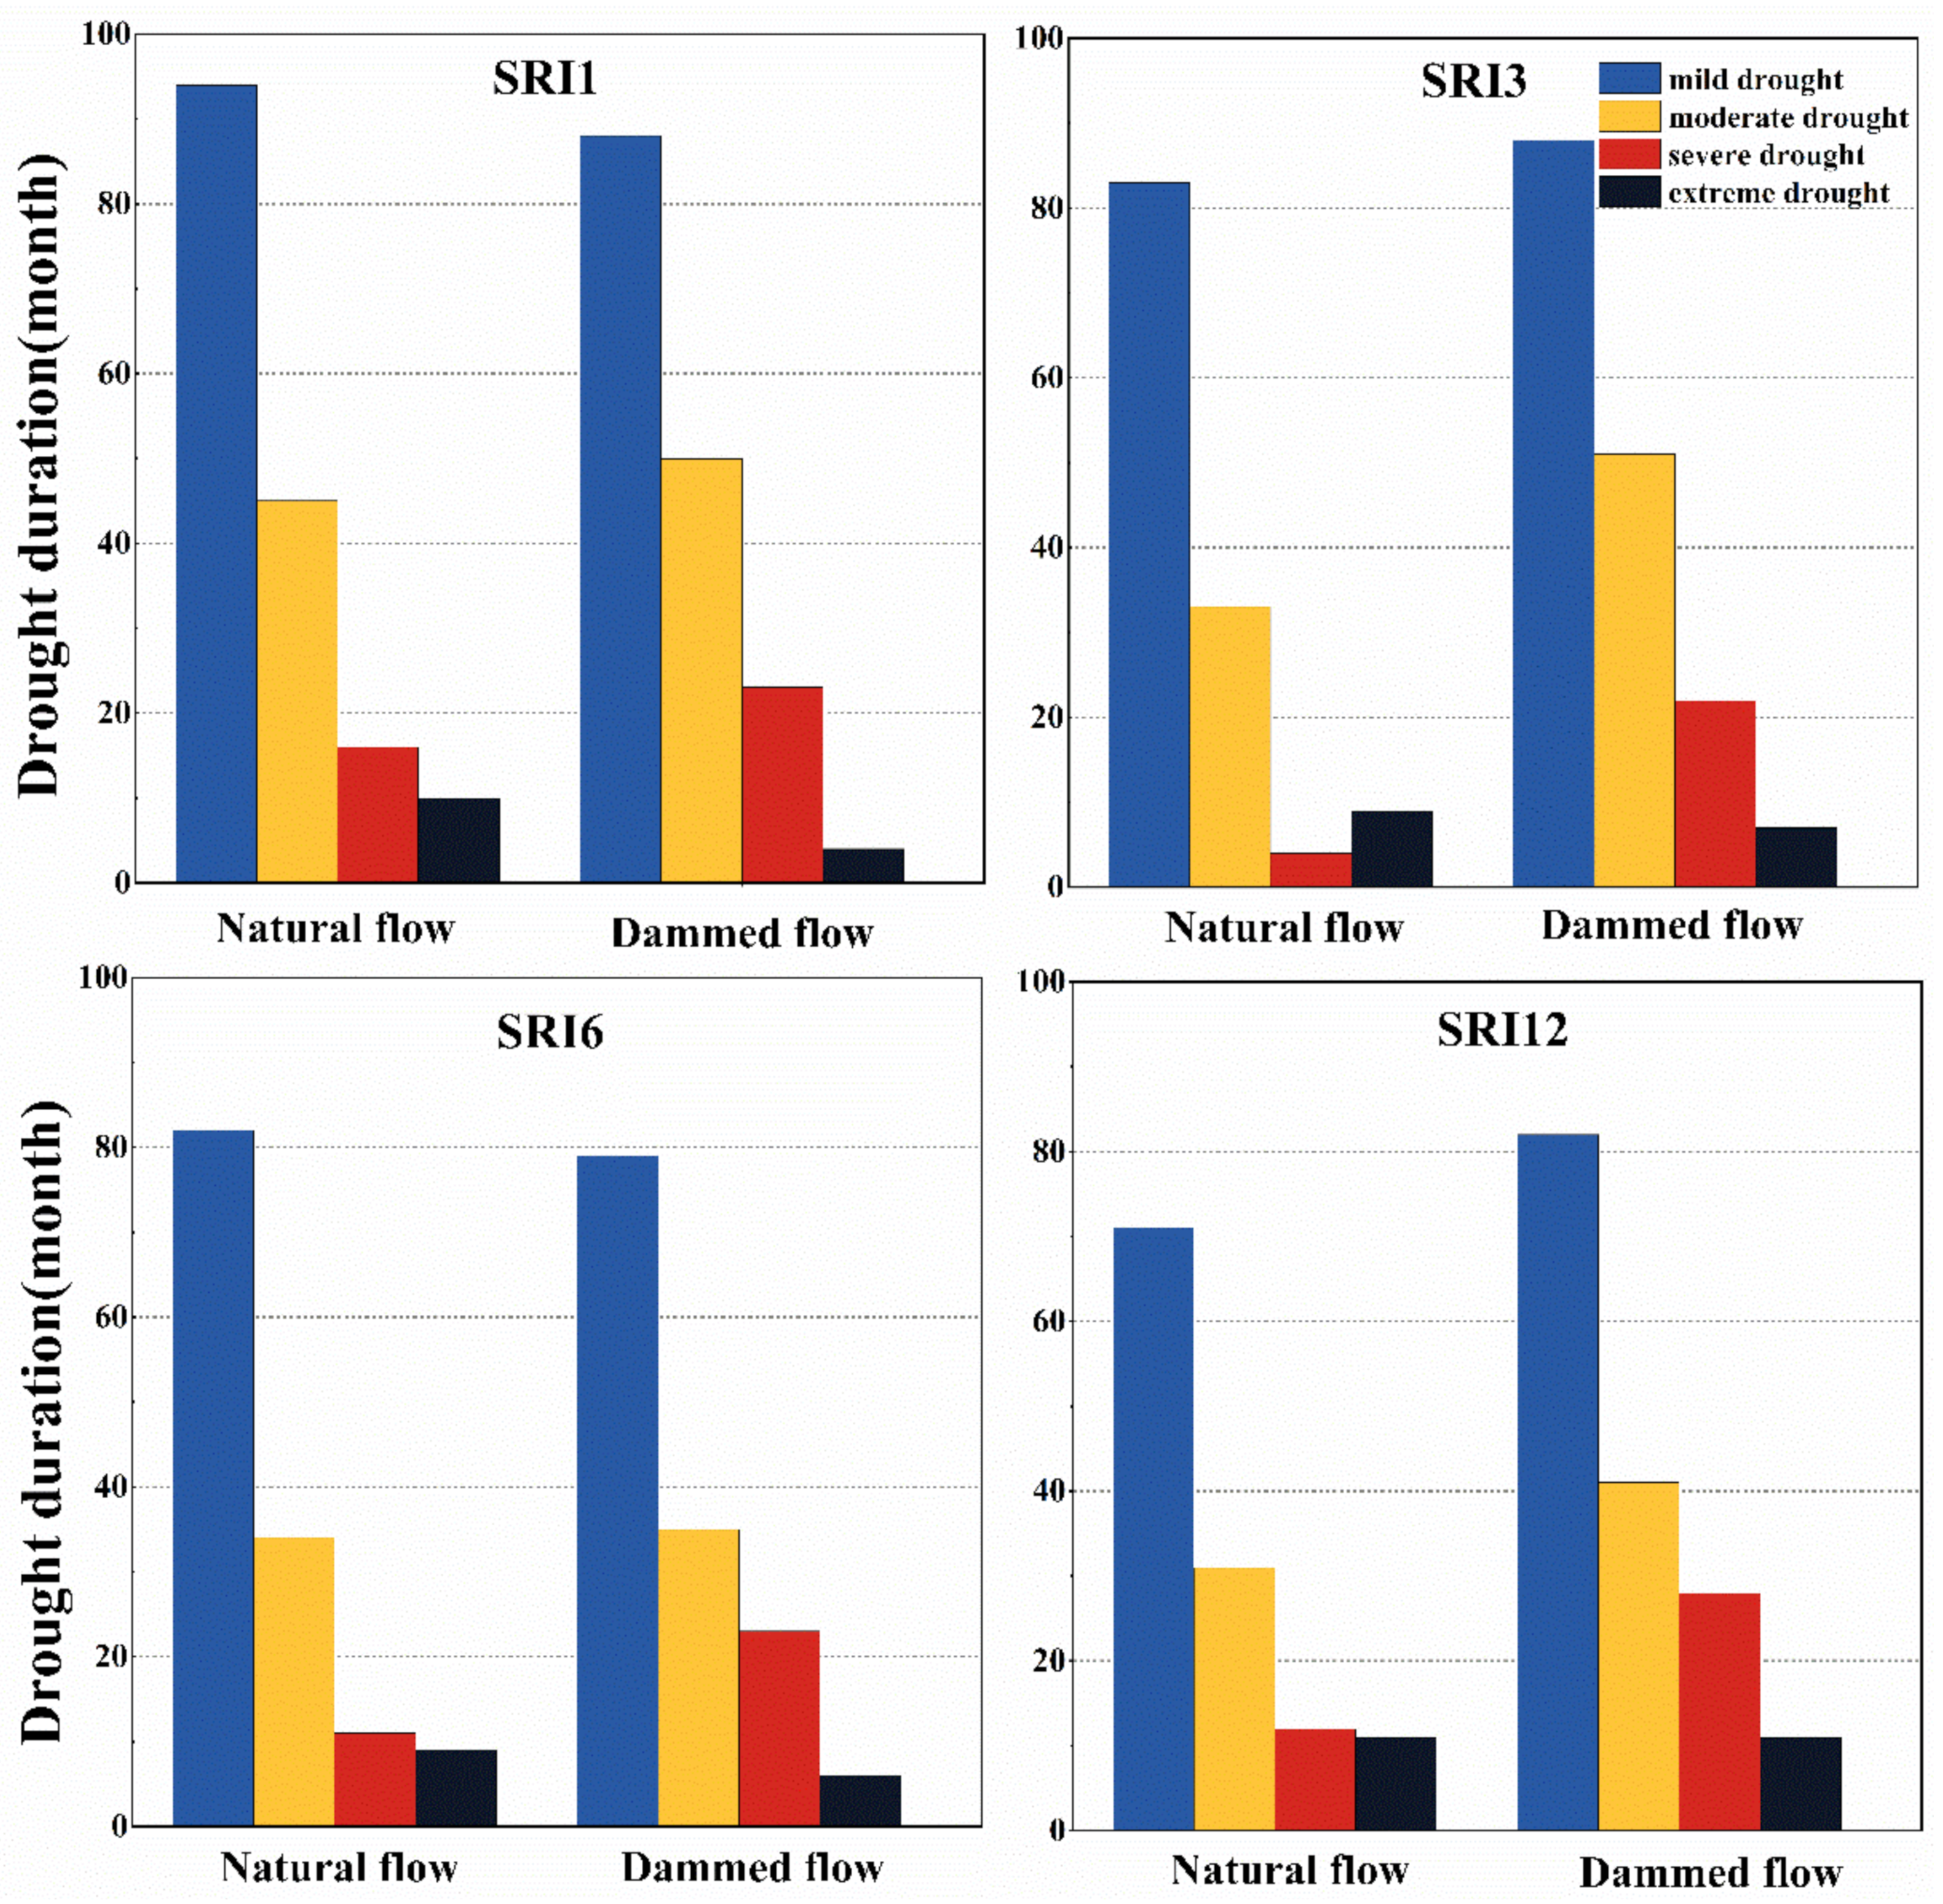
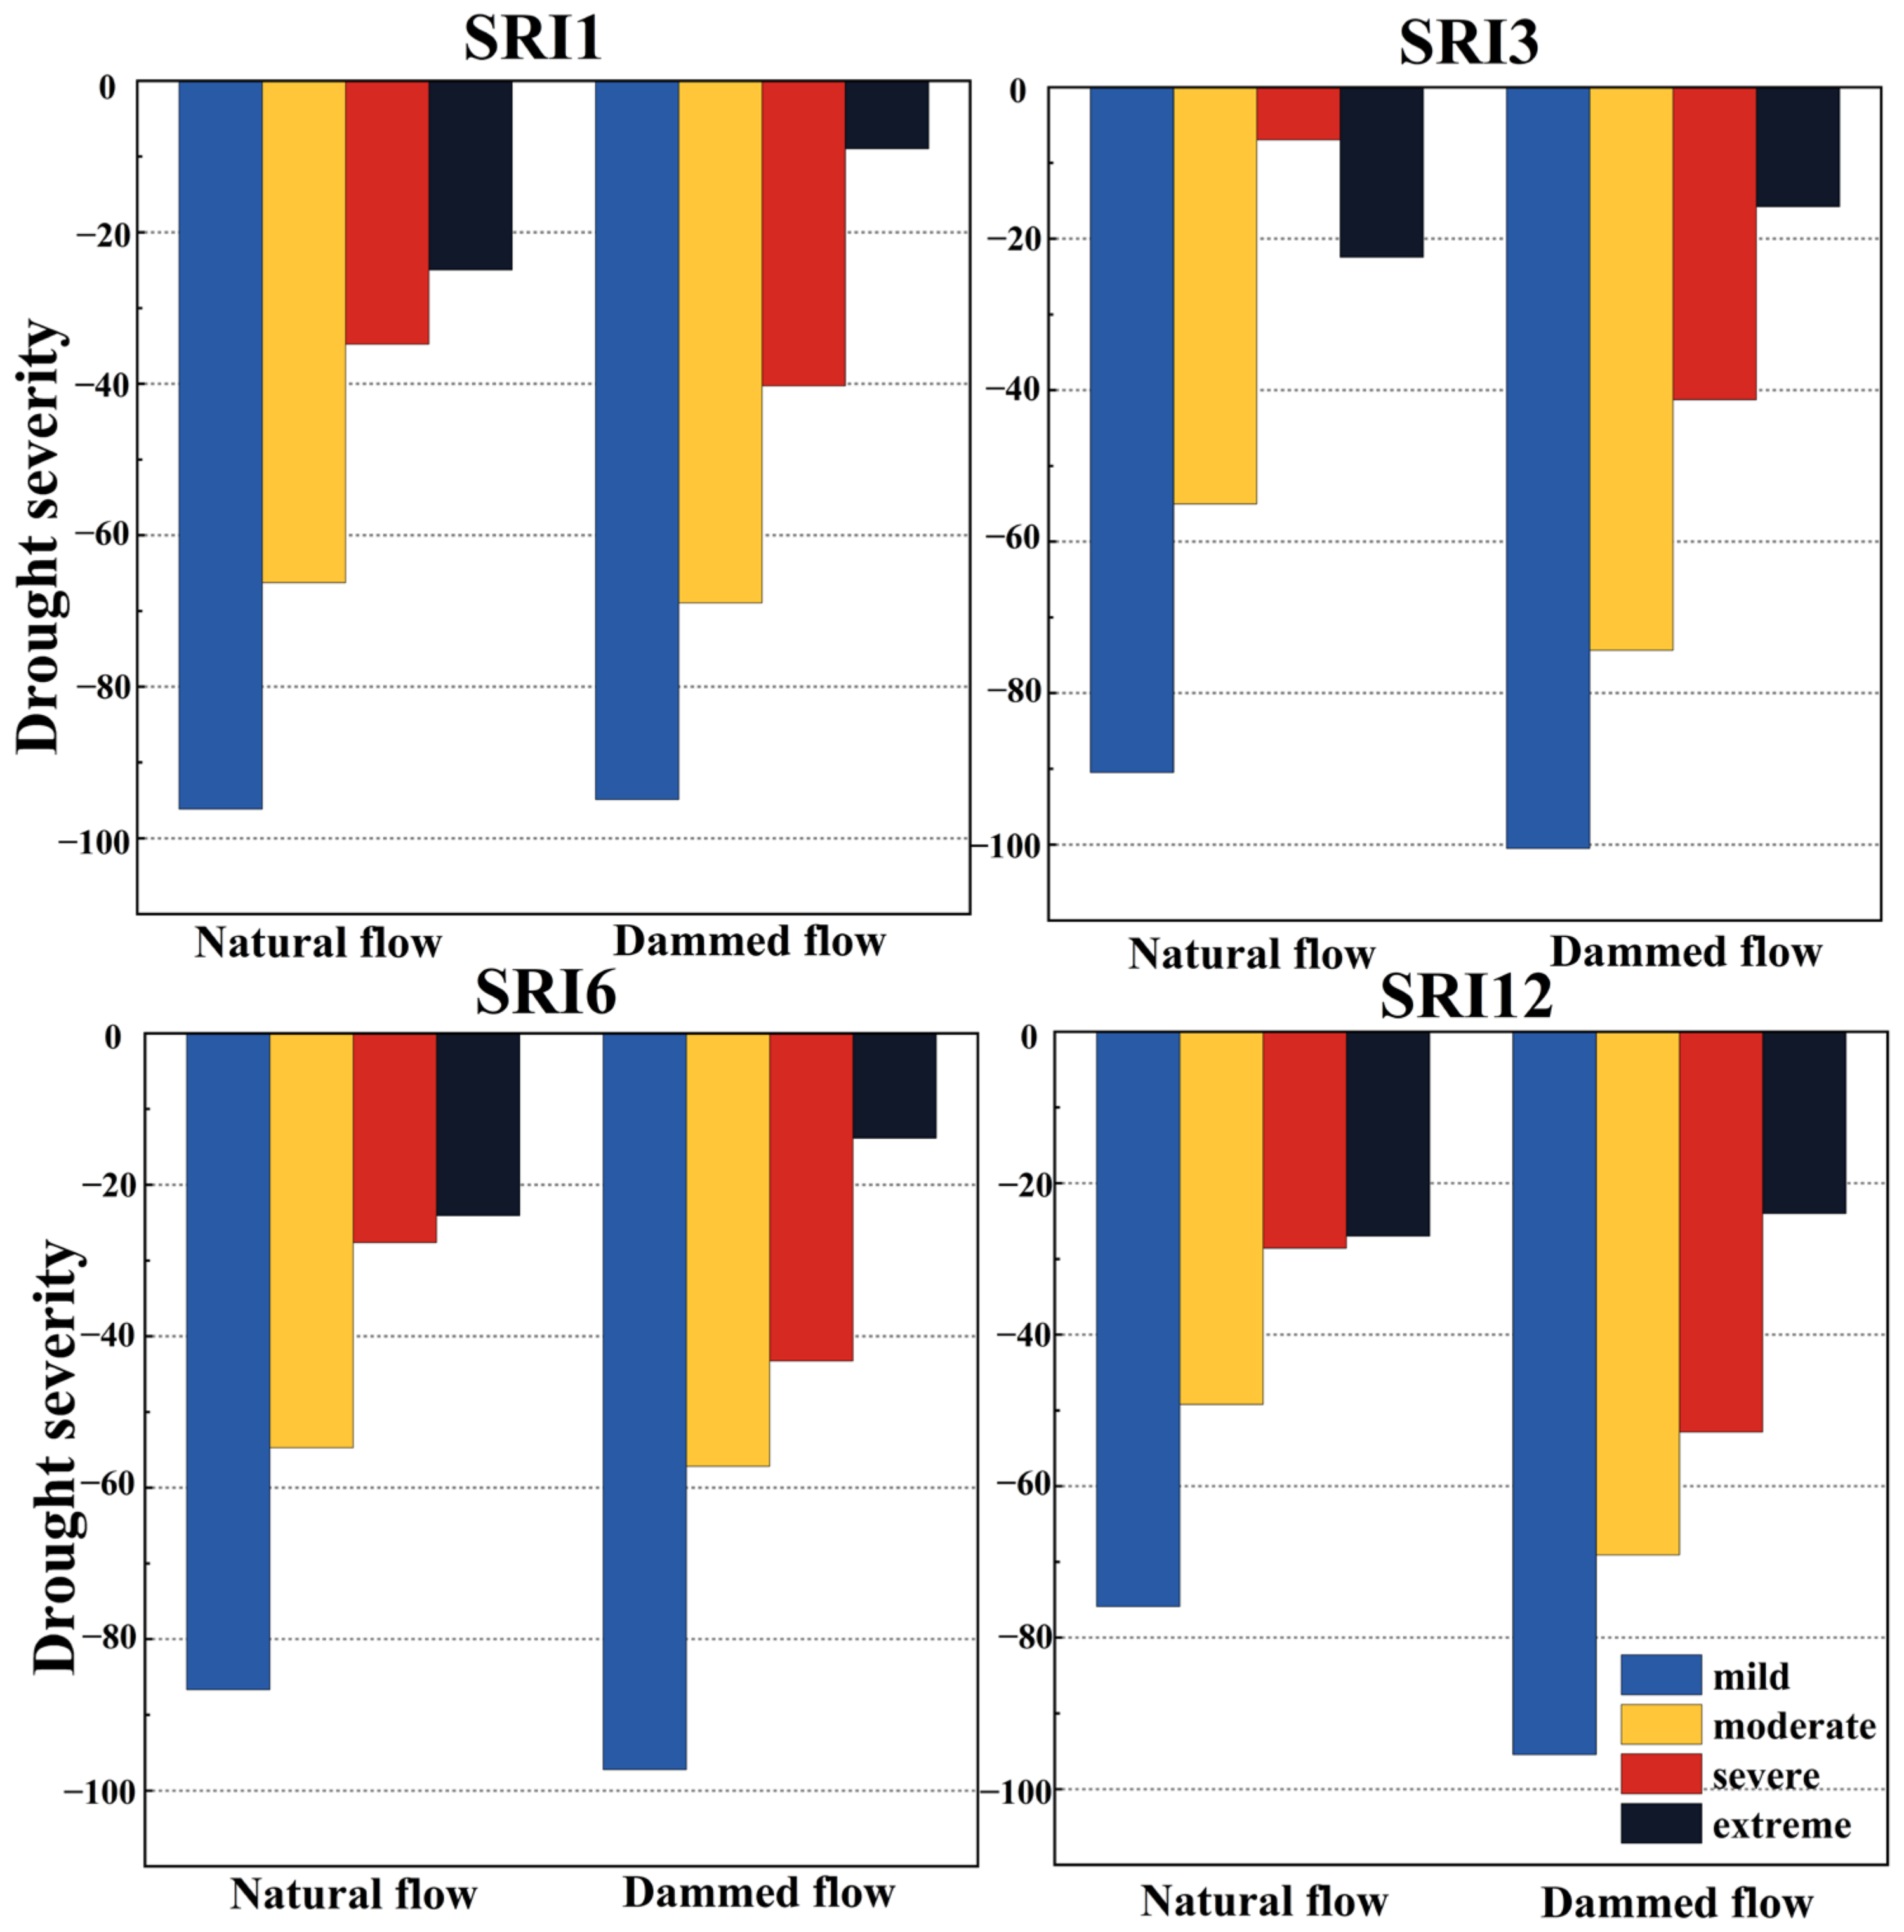
3.4. Changes in Drought Situation

The SRI index at the four timescales during the assessment period was calculated under the dam-free and dammed scenarios at Pingshan Station.
On the SRI-1 timescale, the duration of mild and extreme drought events was shorter under the dammed scenario compared with the dam-free scenario (Figure 7). However, the duration of moderate and severe drought events was longer under the dammed scenario compared with the dam-free scenario. This shows that on the SRI-1 scale, the operation of reservoirs in the JRB alleviated the duration of mild and extreme drought events, but increased the duration of moderate and severe droughts. On the SRI-3 timescale, the duration of extreme drought events under the dammed scenario was shorter compared with the dam-free scenario, but the duration of mild, moderate, and severe drought events was longer, with moderate and severe drought events showing distinct changes. In other words, on the SRI-3 timescale, the reservoirs in the JRB reduced the duration of extreme drought events and increased the duration of mild, moderate, and severe drought events. On the SRI-6 timescale, the duration of mild and extreme drought events under the dammed scenario was shorter than that under the dam-free scenario, the duration of severe drought was longer, and the duration of moderate drought did not significantly vary between the two scenarios. In other words, on the SRI-6 scale, the reservoirs in the JRB reduced the duration of mild and extreme drought events and increased the duration of severe drought, while the duration of moderate drought did not change significantly. On the SRI-12 timescale, the duration of mild, moderate, and severe drought events under the dammed scenario was longer than that under the dam-free scenario, and the duration of extreme drought did not significantly vary between the two scenarios. In other words, on the SRI-12 timescale, the dams in the JRB increased the duration of mild, moderate, and severe drought events, and the duration of extreme drought did not change significantly. In short, the construction of reservoirs in the JRB reduced the duration of extreme drought and increased the duration of moderate and severe drought events.
On the SRI-1 timescale, the severity of mild and extreme drought under the dammed scenario was greater than that under the dam-free scenario, while the severity of moderate and severe drought was smaller (Figure 8). This shows that the reservoirs in the JRB have a mitigating effect on the severity of mild and extreme drought, with a stronger mitigating effect on extreme drought. However, the severity of moderate and severe drought was slightly aggravated. On the SRI-3 timescale, the drought severity value of extreme drought under the dammed scenario was larger than that under the dam-free scenario, but the value of mild, moderate, and severe droughts was smaller. In other words, on the SRI-3 timescale, the cascade reservoirs in the JRB have eased the drought severity of extreme drought and increased the severity of mild, moderate and severe drought. On the SRI-6 timescale, the results were similar to those on the SRI-3 timescale. The cascade power stations in the JRB have eased the drought severity of extreme drought and aggravated the drought severity of mild, moderate, and severe droughts. Nevertheless, unlike that in SRI-3, the intensification of the severity of moderate drought by the power station construction was very small and less pronounced. On the SRI-12 timescale, the results were similar to those on the SRI-3 and SRI-6 timescales. The power stations in the JRB alleviated the severity of extreme drought, aggravated the severity of the mild, moderate, and severe drought, and the aggravation was stronger and more prominent. Nevertheless, unlike SRI-3 and SRI-6, the severity of extreme drought was less mitigated and less pronounced. In short, similar to the drought duration, the construction of the power stations in the JRB have eased the severity of extreme drought and aggravated the severity of moderate and severe drought.

4. Discussion

In this study, the performance of the LSTM model is compared with that of other physical process models in the daily scale flow simulation of the Jinsha River basin. As shown in Table 3, the performance of the LSTM model is higher than that of the physical process models [6,20,37,38,39]. The performance improvement can be attributed to the capability of the LSTM model to control input-data flexibility based on watershed characteristics [4]. For example, the JRB originates from the Qinghai Tibet Plateau, where snowmelt affects runoff generation. Accordingly, snowmelt data can be incorporated into the input matrix. As the main principle of the LSTM model is to establish an optimal mapping of the driving forces and runoff instead of the causation, more diverse data can be introduced, and the construction and calibration of the model are relatively simple [40]. Meanwhile, physical process models generalize the process of precipitation-runoff through mathematical and physical methods [41]. Consequently, physical process models have a fixed form, with high data requirements [42]. Moreover, the construction and calibration of physical process models are complex, and the flexibility of these models requires extensive verification. However, in the current hydrological model research, the poor simulation effect of the high values is a common problem. On one hand, due to the small number of high values in the training samples, it is difficult for the neural network to find an accurate high-value mapping relationship; on the other hand, in the process of simulation, we choose the best-fitting effect between over-fitting and under-fitting. Compared with other models, the LSTM model is improved in the high-values simulation.
The LSTM model has the advantages of accommodating a wide range of data and simple calibration. However, there are a few shortcomings. As the modeling principle is to build mapping relationships, the LSTM model cannot produce the process variables of precipitation-runoff events that are required in some studies [43]. As a result, physical process models may be more appropriate when small watersheds are involved, sufficient data are available, and large amounts of process data are required [44]. For large study areas with scarce data and no requirement for process data, the LSTM model is more appropriate, as it can provide more accurate results with easier calculations.
The results of this study are based on the comparison of the dammed flow and natural flow in the JRB. According to the results, the construction of reservoirs on the JRB reduced the average daily runoff by 280.87 m3/s (5.69%) at the annual scale. The reasons for the decrease of the average daily runoff at Pingshan Station may be as follows: firstly, the reservoirs impounded part of the runoff at the initial stage of their construction [30,45]; secondly, the water area increased due to the impoundment of the reservoirs, thereby increasing evaporation, which induced runoff loss through evaporation [46]; and finally, water diversion activities in the JRB may also reduce runoff. However, as adequate data are not available for small water diversion projects, and there was no large water diversion project in the basin before 2020, the effects of water diversion activities were not taken into account in this study. Regarding drought, the increase of moderate and severe drought may be related to the reservoir storage in the rainy season. However, the risk of drought in the dry season is higher than that in the rainy season [4].
Water transfer activities of a larger scale are expected to be conducted in the JRB in the future, such as the Central Yunnan Water Diversion Project and the Western Route of the South-to-North China Water Diversion Project [47]. The Central Yunnan Diversion Project, which began construction in 2017 and is expected to be completed by 2030, aims to bring water from the Jinsha River to six cities in Yunnan Province [48], drawing 3.40 billion m3 of water annually. The Western Route of South-to-North China Water Diversion Project is still in the validation stage. If implemented in the future, 17 billion m3 of water will be transferred annually from the Jinsha River to provinces such as Qinghai, Gansu, Shanxi, Shandong, and Neimenggu in China. At present, the total storage capacity of the JRB is 78.43 billion m3 and the adjusted storage capacity is 37.42 billion m3. Thus, hydropower stations along the Jinsha River can be speculated to continue playing a huge role in regulating runoff.

5. Conclusions

To quantify the effects of cascade reservoirs in the JRB on streamflow, flooding, and drought in the Jinsha River Basin, this study established an assessment framework including the construction of two scenarios and the assessment of flood and drought. For the dam-free scenario, streamflow was simulated using the LSTM model and then compared with the observed streamflow under the dammed scenario. The conclusions of this study are as follows:
(1)
The construction of cascade reservoirs on the JRB reduced the average daily streamflow by 5.69% from 4937.97 m3/s to 4657.10 m3/s. During the rainy and dry seasons, the average daily streamflow decreased by 10.93% and 10.95%, respectively. The cumulative storage capacity and quantity of the reservoirs affect the change degree of the runoff. On the whole, with the increase of the cumulative storage capacity, the effect of the reservoirs on runoff increases, with a non-linear relationship.
(2)
The cascade reservoirs on the JRB reduced the flood POT from an average of 2.6 to 2.4 per year, reducing the frequency of floods along the Jinsha River by 7.69%. In terms of the flood magnitude, the construction of reservoirs reduced the average annual runoff exceeding the threshold from 5.25 × 10⁵ m3 to 3.26 × 10⁵ m3, reduced by 37.86%. In other words, cascade reservoirs in the JRB reduce the frequency and magnitude of flood events.
(3)
The effect of reservoir construction on drought duration is mainly reflected in the decreasing effect on the duration of extreme drought and the increasing effect on the duration of moderate and severe drought on all timescales. The effect of reservoirs on drought severity is mainly reflected in the mitigation of the severity of extreme drought and the aggravation of the severity of moderate and severe drought. The reservoirs have a mitigating effect on the severity of mild drought on the SRI-1 and SRI-6 timescales and an intensifying effect on the SRI-3 and SRI-6 timescales.
(4)
It is suggested that, in the JRB, when the Central Yunnan Water Diversion Project and the South-to-North Water Transfer West Line Project are completed, the water transfer volume and time should be fully considered to co-ordinate with the storage and operation of the cascade reservoirs.

Author Contributions

Conceptualization, K.Z. and Y.L.; methodology, K.Z. and X.Y.; software, K.Z.; validation, K.Z. and J.W.; formal analysis, K.Z.; investigation, K.Z. and H.L.; resources, K.Z.; data curation, K.Z. and Z.G.; writing—original draft preparation, K.Z.; writing—review and editing, K.Z., Y.L. and X.Y.; visualization, K.Z.; supervision, Y.L. and X.Y.; project administration, Y.L.; funding acquisition, Y.L. All authors have read and agreed to the published version of the manuscript.

Funding

This study was jointly funded by the National Key Research and Development Program of China (No. 2022YFF1302405), the Youth Support Program of Yunnan (YNWRQNBJ2018166), and the National Science Fund of China (No. 32060831).

Institutional Review Board Statement

Not applicable.

Informed Consent Statement

Not applicable.

Data Availability Statement

Publicly available datasets were analyzed in this study. These data can be found in the cited documents in this article.

Acknowledgments

We would like to thank the editors and the anonymous reviewers for their constructive suggestions.

Conflicts of Interest

The authors declare no conflict of interest.

References

  1. Kuriqi, A.; Pinheiro, A.N.; Sordo-Ward, A.; Garrote, L. Water-energy-ecosystem nexus: Balancing competing interests at a run-of-river hydropower plant coupling a hydrologic-ecohydraulic approach. Energy Convers. Manag. 2020, 223, 113267. [Google Scholar] [CrossRef]
  2. Talukdar, S.; Pal, S. Effects of damming on the hydrological regime of Punarbhaba river basin wetlands. Ecol. Eng. 2019, 135, 61–74. [Google Scholar] [CrossRef]
  3. Kelsie, T.; David, K. The changing hydrology of a dammed Amazon. Sci. Adv. 2017, 3, e1700611. [Google Scholar] [CrossRef] [Green Version]
  4. Yuan, X.; Wang, J.; He, D.; Lu, Y.; Sun, J.; Li, Y.; Li, F. Influence of cascade reservoir operation in the Upper Mekong River on the general hydrological regime: A combined data-driven modeling approach. J. Environ. Manag. 2022, 324, 116339. [Google Scholar] [CrossRef]
  5. Hu, Y.; Cheng, H. The urgency of assessing the greenhouse gas budgets of hydroelectric reservoirs in China. Nat. Clim. Chang. 2013, 3, 708–712. [Google Scholar] [CrossRef]
  6. Feng, Y.; Zhou, J.; Mo, L.; Yuan, Z.; Zhang, P.; Wu, J.; Wang, Y. Long-term hydropower generation of cascade reservoirs under future climate changes in Jinsha River in Southwest China. Water 2018, 10, 235. [Google Scholar] [CrossRef] [Green Version]
  7. Tayyab, M.; Zhou, J.; Zeng, X.; Adnan, R. Discharge forecasting by applying artificial neural networks at the Jinsha River Basin, China. Eur. Sci. J. 2016, 12, 108–127. [Google Scholar] [CrossRef] [Green Version]
  8. Huang, X.R.; Zhao, J.W.; Yang, P.P. Wet-dry runoff correlation in Western Route of South-to-North Water Diversion Project, China. J. Mt. Sci. 2015, 12, 592–603. [Google Scholar] [CrossRef]
  9. Lu, X.X.; Ashmore, P.; Wang, J.F. Seasonal water discharge and sediment load changes in the Upper Yangtze, China. Mt. Res. Dev. 2003, 23, 56–64. [Google Scholar] [CrossRef] [Green Version]
  10. Yu, M.; Li, Q.; Lu, G.; Cai, T.; Xie, W.; Bai, X. Investigation into the Impacts of the Gezhouba and the Three Gorges Reservoirs on the Flow Regime of the Yangtze River. J. Hydrol. Eng. 2013, 18, 1098–1106. [Google Scholar] [CrossRef]
  11. Long, S.; Gao, J.; Shao, H.; Kang, Y.; Gao, Z.; Guo, Z.; Wang, L. Evaluation of the impact of the Gully Land Consolidation Project on runoff under extreme rainfall. Land Degrad. Dev. 2022, 33, 2663–2676. [Google Scholar] [CrossRef]
  12. Yuan, X.; Lu, Y.; Jiang, L.; Liang, S.; Jiang, Y.; Xiao, F. Runoff responses to climate change in China’s Buyuan River Basin. River Res. Appl. 2021, 37, 1134–1144. [Google Scholar] [CrossRef]
  13. Chai, Y.; Li, Y.; Yang, Y.; Zhu, B.; Li, S.; Xu, C.; Liu, C. Influence of climate variability and reservoir operation on streamflow in the Yangtze River. Sci. Rep. 2019, 9, 5060. [Google Scholar] [CrossRef] [PubMed] [Green Version]
  14. Wang, Y.; Lei, X.; Wen, X.; Fang, G.; Tan, Q.; Tian, Y.; Wang, H. Effects of damming and climatic change on the eco-hydrological system: A case study in the Yalong River, southwest China. Ecol. Indic. 2019, 105, 663–674. [Google Scholar] [CrossRef]
  15. Bao, A.M.; Liu, H.L.; Chen, X.; Pan, X.L. The effect of estimating areal rainfall using self-similarity topography method on the simulation accuracy of runoff prediction. Hydrol. Process. 2011, 25, 3506–3512. [Google Scholar] [CrossRef]
  16. McMillan, H.; Freer, J.; Pappenberger, F.; Krueger, T.; Clark, M. Impacts of uncertain river flow data on rainfall-runoff model calibration and discharge predictions. Hydrol. Process. Int. J. 2010, 24, 1270–1284. [Google Scholar] [CrossRef]
  17. Zhai, M.Y.; Lin, Q.G.; Huang, G.H.; Zhu, L.; An, K.; Li, G.C.; Huang, Y.F. Adaptation of cascade hydropower station scheduling on a headwater stream of the Yangtze River under changing climate conditions. Water 2017, 9, 293. [Google Scholar] [CrossRef] [Green Version]
  18. Ayzel, G.; Kurochkina, L.; Abramov, D.; Zhuravlev, S. Development of a regional gridded runoff dataset using long short-term memory (LSTM) networks. Hydrology 2021, 8, 6. [Google Scholar] [CrossRef]
  19. Li, D.; Lu, X.; Yang, X.; Chen, L.; Lin, L. Sediment load responses to climate variation and cascade reservoirs in the Yangtze River: A case study of the Jinsha River. Geomorphology 2018, 322, 41–52. [Google Scholar] [CrossRef]
  20. Wu, Y.; Fang, H.; Huang, L.; Ouyang, W. Changing runoff due to temperature and precipitation variations in the dammed Jinsha River. J. Hydrol. 2020, 582, 124500. [Google Scholar] [CrossRef]
  21. Li, W.; Kiaghadi, A.; Dawson, C. High temporal resolution rainfall–runoff modeling using long-short-term-memory (LSTM) networks. Neural Comput. Appl. 2021, 33, 1261–1278. [Google Scholar] [CrossRef]
  22. Liu, Q.; Zhang, R.; Wang, Y.; Yan, H.; Hong, M. Daily prediction of the arctic sea ice concentration using reanalysis data based on a convolutional lstm network. J. Mar. Sci. Eng. 2021, 9, 330. [Google Scholar] [CrossRef]
  23. Werbos, P.J. Backpropagation through time: What it does and how to do it. Proc. IEEE 1990, 78, 1550–1560. [Google Scholar] [CrossRef] [Green Version]
  24. Kratzert, F.; Klotz, D.; Brenner, C.; Schulz, K.; Herrnegger, M. Rainfall–runof modelling using Long Short-Term Memory (LSTM) networks. Hydrol. Earth Syst. Sci. 2018, 22, 6005–6022. [Google Scholar] [CrossRef] [Green Version]
  25. Krause, P.; Boyle, D.P.; Bäse, F. Comparison of different efficiency criteria for hydrological model assessment. Adv. Geosci. 2005, 5, 89–97. [Google Scholar] [CrossRef] [Green Version]
  26. Chadalawada, J.; Babovic, V. Review and comparison of performance indices for automatic model induction. J. Hydroinform. 2019, 21, 13–31. [Google Scholar] [CrossRef] [Green Version]
  27. Moriasi, D.N.; Arnold, J.G.; Van Liew, M.W.; Bingner, R.L.; Harmel, R.D.; Veith, T.L. Model evaluation guidelines for systematic quantification of accuracy in watershed simulations. Trans. ASABE 2007, 50, 885–900. [Google Scholar] [CrossRef]
  28. Durocher, M.; Mostofi Zadeh, S.; Burn, D.H.; Ashkar, F. Comparison of automatic procedures for selecting flood peaks over threshold based on goodness-of-fit tests. Hydrol. Process. 2018, 32, 2874–2887. [Google Scholar] [CrossRef]
  29. Hirsch, R.M.; Archfield, S.A. Flood trends: Not higher but more often. Nat. Clim. Chang. 2015, 5, 198–199. [Google Scholar] [CrossRef]
  30. Yun, X.; Tang, Q.; Wang, J.; Liu, X.; Zhang, Y.; Lu, H.; Chen, D. Impacts of climate change and reservoir operation on streamflow and flood characteristics in the Lancang-Mekong River Basin. J. Hydrol. 2020, 590, 125472. [Google Scholar] [CrossRef]
  31. McKee, T.B.; Doesken, N.J.; Kleist, J. The relationship of drought frequency and duration to time scales. In Proceedings of the 8th Conference on Applied Climatology, Anaheim, CA, USA, 17–22 January 1993; Volume 17, pp. 179–183. [Google Scholar]
  32. Sun, Z.; Zhu, X.; Pan, Y.; Zhang, J.; Liu, X. Drought evaluation using the GRACE terrestrial water storage deficit over the Yangtze River Basin, China. Sci. Total Environ. 2018, 634, 727–738. [Google Scholar] [CrossRef] [PubMed]
  33. Yu, M.; Liu, X.; Li, Q. Impacts of the Three Gorges Reservoir on its immediate downstream hydrological drought regime during 1950–2016. Nat. Hazards 2019, 96, 413–430. [Google Scholar] [CrossRef]
  34. Wu, J.; Liu, Z.; Yao, H.; Chen, X.; Chen, X.; Zheng, Y.; He, Y. Impacts of reservoir operations on multi-scale correlations between hydrological drought and meteorological drought. J. Hydrol. 2018, 563, 726–736. [Google Scholar] [CrossRef]
  35. Tu, X.; Du, Y.; Singh, V.P.; Chen, X.; Zhao, Y.; Ma, M.; Wu, H. Bivariate design of hydrological droughts and their alterations under a changing environment. J. Hydrol. Eng. 2019, 24, 4019015. [Google Scholar] [CrossRef]
  36. Yevjevich, V.M. Objective Approach to Definitions and Investigations of Continental Hydrologic Droughts. Ph.D. Thesis, Colorado State University, Libraries, CO, USA, 1967. [Google Scholar]
  37. Aredo, M.R.; Hatiye, S.D.; Pingale, S.M. Modeling the rainfall-runoff using MIKE 11 NAM model in Shaya catchment, Ethiopia. Model. Earth Syst. Environ. 2021, 7, 2545–2551. [Google Scholar] [CrossRef]
  38. Chen, Q.; Chen, H.; Zhang, J.; Hou, Y.; Shen, M.; Chen, J.; Xu, C. Impacts of climate change and LULC change on runoff in the Jinsha River Basin. J. Geogr. Sci. 2020, 30, 85–102. [Google Scholar] [CrossRef] [Green Version]
  39. Maza, M.; Srivastava, A.; Bisht, D.S.; Raghuwanshi, N.S.; Bandyopadhyay, A.; Chatterjee, C.; Bhadra, A. Simulating hydrological response of a monsoon dominated reservoir catchment and command with heterogeneous cropping pattern using VIC model. J. Earth Syst. Sci. 2020, 129, 200. [Google Scholar] [CrossRef]
  40. Chen, Y.C.; Gao, J.J.; Bin, Z.H.; Qian, J.Z.; Pei, R.L.; Zhu, H. Application study of IFAS and LSTM models on runoff simulation and flood prediction in the Tokachi River basin. J. Hydroinform. 2021, 23, 1098–1111. [Google Scholar] [CrossRef]
  41. El Hassan, A.A.; Sharif, H.O.; Jackson, T.; Chintalapudi, S. Performance of a conceptual and physically based model in simulating the response of a semi-urbanized watershed in San Antonio, Texas. Hydrol. Process. 2013, 27, 3394–3408. [Google Scholar] [CrossRef]
  42. Cho, K.; Kim, Y. Improving streamflow prediction in the WRF-Hydro model with LSTM networks. J. Hydrol. 2022, 605, 127297. [Google Scholar] [CrossRef]
  43. Zhou, J.; Wang, X.; Yang, C.; Xiong, W. A novel soft sensor modeling approach based on difference-LSTM for complex industrial process. IEEE Trans. Ind. Inform. 2021, 18, 2955–2964. [Google Scholar] [CrossRef]
  44. Sitterson, J.; Knightes, C.; Parmar, R.; Wolfe, K.; Avant, B.; Muche, M. An Overview of Rainfall-Runoff Model Types; Environmental Protection Agency: Washington, DC, USA, 2018.
  45. Tian, S.; Xu, M.; Jiang, E.; Wang, G.; Hu, H.; Liu, X. Temporal variations of runoff and sediment load in the upper Yellow River, China. J. Hydrol. 2019, 568, 46–56. [Google Scholar] [CrossRef]
  46. Lu, Y.; He, D.M.; He, K.W.; Yuan, X. Analysis and calculation of water consumption of hydropower plants in Lancang-Mekong River basin. Adv. Water Sci. 2018, 29, 415–423. [Google Scholar] [CrossRef]
  47. Guo, C.; Chen, Y.; Xia, W.; Qu, X.; Yuan, H.; Xie, S.; Lin, L.S. Eutrophication and heavy metal pollution patterns in the water suppling lakes of China’s south-to-north water diversion project. Sci. Total Environ. 2020, 711, 134543. [Google Scholar] [CrossRef] [PubMed]
  48. Xiang, C.; Huang, W.; Zhou, H.; Xue, L.; Wang, Z.; Ma, W. Flow reduction effect on fish habitat below water diversion—A case study of the Central Yunnan Water Diversion Project. Ecol. Eng. 2022, 175, 106499. [Google Scholar] [CrossRef]
Figure 1. Hydropower plants and Pingshan hydrological station in the Jinsha River Basin.
Sustainability 15 04989 g001
Figure 2. Framework diagram for assessment of the impact of power stations operation on runoff, flood, and drought.
Sustainability 15 04989 g002
Figure 3. Number and cumulative storage capacity of power station reservoirs in the Jinsha River Basin during 1998–2020.
Sustainability 15 04989 g003
Figure 4. Drought duration and drought severity (D1 and D2 are drought events).
Sustainability 15 04989 g004
Figure 5. Plots of simulated and observed flow in the training period (a), testing period (b), and point distributions in the testing period (c).
Sustainability 15 04989 g005
Figure 6. Runoff change rate with and without dams. (a): Distribution of natural and dammed flow from January to December; (b): annual runoff change rate during all time periods; (c): rainy seasonal runoff change rate during all time periods; and (d): dry seasonal runoff change rate during all time periods).
Sustainability 15 04989 g006
Figure 7. Drought duration under natural flow and dammed flow on the SRI-1, -3, -6, -and 12 month timescales.
Sustainability 15 04989 g007
Figure 8. Drought severity under natural flow and dammed flow on the SRI-1, -3, -6, and -12 month timescales.
Sustainability 15 04989 g008
Table 1. Information on reservoirs in the Jinsha River.
DamInstalled
Capacity
Total
Storage
Regulated
Storage
Capacity
Regulation TypeReservoir
Filling
(MWh)(106 m3)(106 m3)
Liyuan2400727173Weekly2014
Ahai2000806238Daily2011
Jinanqiao2400847346Weekly2010
Longkaikou1800558113Daily2012
Ludila21601718376Weekly2013
Guanyinyan30002072383Weekly2014
Wudongde10,20074083020Seasonal2020
Xiluodu12,60012,6706460Incomplete year regulation2013
Xiangjiaba60005163903Incomplete year regulation2012
Lianghekou300010,8006560Multi-year2020
Jinping I360077604910Annual2012
Jinping II480014.284.96Daily2012
Guandi240076028.4Annual2012
Ertan330058003370Annual1998
Tongzilin60091.223.1Daily2015
Table 2. Modeling data features and sources.
Data TypeData FeatureTime StepProductsData Source
StreamflowHydrological
station
dailyObservedPingshan and Xiangjiaba Hydrological Stations
Precipitation0.25° × 0.25°dailyCHIRPS-2.0https://data.chc.ucsb.edu/ (accessed on 25 September 2021)
Air temperature0.1° × 0.1°hourlyERA5-LANDhttps://cds.climate.copernicus.eu/
(accessed on 15 September 2021)
Snow melt0.1° × 0.1°hourlyERA5-LANDhttps://cds.climate.copernicus.eu/
(accessed on 15 September 2021)
Evaporation0.1° × 0.1°hourlyERA5-LANDhttps://cds.climate.copernicus.eu/
(accessed on 15 September 2021)
Soil moisture0.25° × 0.25°dailyGLDAShttps://disc.gsfc.nasa.gov/ (accessed on 31 October 2021)
Table 3. Performances of the LSTM and physical process models reported in the literature on daily streamflow forecasting.
ModelTesting PeriodNSESource
LSTM1994–19980.92This study
SWAT (Semi-distributed Model)2000–20160.90Chen et al. (2020) [38]
SWAT (Semi-distributed Model)2012–20120.71Wu et al. (2020) [20]
Xinanjiang model (Distributed model)1986–20000.84Feng et al. (2018) [6]
VIC model (Distributed model)2004–20060.72Maza et al. (2020) [39]
MIKE 11 NAM model (Distributed model)2009–20150.83Aredo et al. (2021) [37]
Disclaimer/Publisher’s Note: The statements, opinions and data contained in all publications are solely those of the individual author(s) and contributor(s) and not of MDPI and/or the editor(s). MDPI and/or the editor(s) disclaim responsibility for any injury to people or property resulting from any ideas, methods, instructions or products referred to in the content.

