Abstract
The structures of industrial linkages form an essential basis for the economy and have an important impact on urban economic resilience. By analyzing the impact of COVID-19 on China’s urban economy in 2020, this study uses China’s national input–output table to measure the centrality and diversity of industrial linkage structures. Extracted data from 298 cities in China are used to explore the impact of centrality and diversity on urban economic resilience. The results show that the cities in East China, Central China, and the Chengdu–Chongqing area in western China have a high centrality with respect to industrial linkage structures. Cities in the Yangtze River Delta, Pearl River Delta, the middle reaches of the Yangtze River city cluster, and the Chengdu–Chongqing city cluster have a high diversity of industrial linkages structures. During the shock of the COVID-19 pandemic, most cities in China have shown high economic resilience. For cities across the country, diversity shows a significant and positive correlation with economic resilience, and centrality shows a significant and positive correlation with economic resilience. The latter displays an inverted U-shaped relationship between centrality and economic resilience. For cities with different population sizes, there are differences in the impacts of centrality and diversity on urban economic resilience. Different industrial policies can be developed to adjust the centrality and diversity of the cities to enhance urban economic resilience.
1. Introduction
Cities can experience significant negative shocks due to natural disasters, epidemics, economic crises, etc. Urban economic systems may be extremely vulnerable to these risks due to their complexity [1,2,3]. At the same time, as global production networks deepen, factors of production are flowing freely at an unprecedented speed and scale. This has created increasing linkages of regional industries, and the deeper integration of local economies with global industrial chains [4,5]. However, the uncertainties associated with urban economics are also transmitted and amplified with the development of industrial linkages. In November 2020, the Chinese government emphasized that “urban development should not only consider the economic benefits of scale, but also put ecology and safety in a more prominent position and build resilient cities” and “build a new system of higher level open economy while improving economic resilience and competitiveness” [6]. Therefore, improving the economic resilience of cities has become a major measure for reducing economic risk and achieving high-quality economic development in China [7].
With the continuous development of and improvements in the conceptualization of resilience, scholars have widely recognized the theory of resilience from the perspective of evolution [8,9,10,11,12]. From this perspective, economic resilience is considered as the inherent attributes held by an economic system, including the ability to resist, recover, restructure, and renew the system’s path forward when responding to external shocks [13,14]. In studies of economic resilience, scholars have increasingly focused on the influence of regional industry, technology, networks, and institutional structure on economic resilience [13,15]. Network analysis methods have emerged as a new approach for measuring regional resilience; for example, regional knowledge networks are used to analyze the evolution of regional industrial structure, and the correlation characteristics among network nodes have become important indicators reflecting regional resilience. Resilient regional knowledge networks generally have a tightly connected core and a moderately loose edge structure, resulting in a balance between “adaptation” and “adaptability” (Adaptability means to develop a new path, while adaptation means to reproduce structures in preconceived paths. Regions with adaptability typically do not have historical path dependence, and their internal economic factors are loosely related. In contrast, regions with adaptation typically have historical path dependence, and their internal economic factors are strongly related) [13,16].
Scholars have increased their studies on urban economic resilience. Most qualitatively explore resilience theory [17,18], or measure resilience based on certain core indicators (such as gross domestic product (GDP) and unemployment rate) or a comprehensive indicator system [14,19,20,21]. These resilience evaluations are mainly based on an analysis of results caused by shocks to the economy, but few studies have considered the characteristics of industrial linkage structures. As an important regional economic network, the industrial linkage network is an important intrinsic attribute of a regional economic system, and directly determines the development of the local economy. Therefore, this study starts by considering the intrinsic factors affecting economic resilience, and analyzes the economic resilience of cities when impacted by COVID-19 in 2020. This is achieved by analyzing the characteristics of industrial linkage structures, using data form 298 cities in China. Based on China’s national 42-sector input–output table, this study uses complex network analysis to measure the impact of industrial linkages on economic resilience by selecting the centrality and diversity of industry linkage structures. This study further analyzes the industrial linkage structures and economic resilience characteristics of cities with different population sizes. The goal is to provide a theoretical basis and practical reference for optimizing China’s industrial structure, enhancing urban economic resilience, and promoting high-quality economic development.
2. Data and Methods
2.1. Study Area
China’s economy and population are highly concentrated in cities. As such, based on data availability, this study focuses on the scale of the municipal area, using a total of 298 Chinese cities, including in 294 prefecture-level cities (data of Sansha, Zunyi, Linzhi, and Zhongwei are missing) and 4 municipalities directly under the central government. The goal is to measure the impact of industrial linkage structures on China’s urban economic resilience.
2.2. Methods
2.2.1. The Characteristics of Industrial Linkage Structures Based on Complex Network Theory
Scholars increasingly agree that industrial linkages impact economic resilience, and studies have found that industrial linkages can effectively drive the urban economy through diffusion effects. As such, these linkages also impact urban economic resilience [22]. Industrial diversity also enables regions to show stronger resilience in the face of shocks [13]. Correlations between industries are generally expressed in the form of the input–output exchange of products and services, and different industries have forward or backward linkages with other industries due to their different supply chain complexities [23]. As such, this study uses input–output tables to analyze the characteristics of industrial linkage structures. The input–output table depicts interindustry relationships within an economy and shows how the output from one industrial sector may be an input to another industrial sector. The table can therefore be viewed as a network of industrial linkage (see Table 1). In China’s input–output table, row entries record the destination of products or services produced by each industrial sector, i.e., the demand-side. The column entries record the input sources from product sectors in the production process, i.e., the supply-side. The transactions between sectors are represented by network nodes and weighted edges. Based on research in the fields of complex network theory, network resilience, and industry-related diversity [13,24,25], this study selects centrality and diversity as important attributes characterizing the industrial linkage structures. The measurement methods are as follows.

Table 1.
A generic input–output table.
- (1)
- Centrality
Centrality refers to the degree of centrality of network nodes. A higher centrality value of nodes indicates a more robust and resistant network [26]. However, if the core nodes experience a targeted attack, it may intensify the vulnerability of the network. Therefore, the centrality has a double effect on a network’s robustness and vulnerability [27,28]. In the industrial linkage network, industries with high centrality significantly influence other industries, but are insensitive to the impact of other industries’ decline. At the same time, industries with high centrality may face a targeted shock, which can increase the vulnerability of the industrial network. In this study, the degree centrality is used to measure the centrality of the industrial linkage network. Since the input–output table is an asymmetric network that records both supply-side and demand-side correlations, the centrality Cj of sector j is measured jointly by supply centrality Cjsupply and demand centrality Cjdemand, which is calculated as in Equation (1):
In Equation (1), xjk is the transaction data of the supply-side where industry j provides products or services to industry k, and xkj is the transaction data of the demand-side where industry j buys products or services from industry k in the input–output table, and n is the number of industries. A high level of centrality Cj indicates that industry j has a higher degree of centrality, and it has a greater influence on the economy.
- (2)
- Diversity
Industrial diversity emphasizes the composition of different related industries [29]. In the face of shocks, the diversity of industrial linkages helps spread risk and speed up economic recovery. In this study, industrial entropy is used to measure the diversity of industrial linkages. Based on the measurement of “uncertainty” associated with entropy in the information field, economists introduced the concept of entropy into the field of economics and proposed using industrial entropy (IE) to reflect the diversity of connections or transactions in industrial networks [30,31]. A higher level of uncertainty is associated with a higher entropy value. This indicates that the probability of an industry being dependent on other industries is more even, and the diversity of industrial correlation is stronger. As such, the industry is not expected to be significantly affected and may show higher resilience when other industries experience problems. Let IEj be the industrial entropy of the industry j, and it can be measured by both the supply-side IE and the demand-side IE. IEj is calculated as in Equation (2):
In Equation (2), a higher demand-side IE indicates that the industry buys products or services from other industries in more even proportions, and a higher supply-side IE indicates that the industry sells products or services to a large variety of industries, also in more even proportions. Therefore, a higher IE value means that the industry’s suppliers and buyers are more diversified or more evenly distributed. This is similar to a risk-spreading production approach that makes the industry more resilient in the face of shocks.
2.2.2. Centrality and Diversity at City Level
The above two attributes are measured using input–output tables and are calculated at the industry level. However, these tables are only compiled based on national and regional industrial linkage data, and do not exist at the city level. Therefore, to convert the characteristics of industrial linkage structures into the city level measures, this study applies the research of Han et al. [30] and uses city employment data for each industry to reflect the local importance of each industry, calculates the weights using the city employment data in each industry, and then measures the centrality and industrial entropy of industrial linkage structure of each city. Let CCi and CIEi be the centrality and industrial entropy of the industrial linkage network of city i., respectively, which can be calculated using Equations (3) and (4):
where EPij is the number of employees in industry j in city i. A higher CCi indicates a more robust industry linkage network and higher economic efficiency in city i, but long-term path dependence can also increase urban economic vulnerability. A higher CIEi indicates a high diversity of industry linkages in city i, which can easily form new development paths in the face of economic shocks.
2.2.3. Urban Economic Resilience
Many quantitative methods are used to measure economic resilience. They are mainly divided into indicator system measures and core indicator measures [32,33]. The indicator system method can measure economic resilience from multiple perspectives, but the construction is highly subjective, and the indicators are generally static for a specific year. As such, the method does not reflect the core idea of resilience theory, which is the ability of the system to resist and recover in response to shocks. Therefore, this study adopts a core indicator measure method, proposed by Martin et al. [34], to assess resilience by measuring the difference between the actual and expected values of the core indicator after a shock [34,35]. This method mainly involves using GDP or unemployment rate as the core indicator; however, because the statistical caliber of the unemployment rate indicator is not consistent across Chinese cities, this study uses GDP as the core indicator to measure urban economic resilience.
Drawing on Martin’s [14] research results, this study measures urban economic resilience in two dimensions: resistance and recoverability. These correspond to the recession period (resistance) and recovery period (recoverability) associated with GDP when China’s urban economic system experienced the impact of COVID-19 in 2020. A stronger level of resistance in the recession period and a stronger level of recoverability in the recovery period are associated with the city having a higher the economic resilience. After the shock of the COVID-19 pandemic in January 2020, China experienced a total shut-down, followed by a gradual economic recovery. China’s GDP also decreased in the first quarter and experienced a rebound phase in the second, third, and fourth quarters (Figure 1). GDP trends were similar at the city and national levels. Therefore, we use the change in GDP for each city in the first quarter of 2020 to calculate the resistance of the urban economy, and the change in GDP of each city in the second, third, and fourth quarters of 2020 to calculate its recoverability.
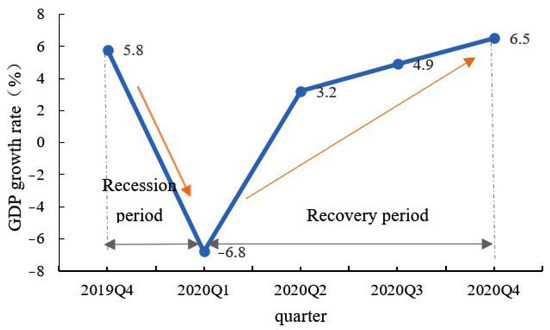
Figure 1.
China’s GDP growth rate in 2020 (a year-on-year ratio).
Following the work by R. Martin et al. [14], we first calculate the expected GDP change for each city. As urban economics is greatly affected by nation-level conditions, we expect that each city’s GDP changes in the recession and recovery period at the same rate as the national rate does. Let be the GDP in city i at time t, the base time. Let be the actual change in GDP of city i in k period. Then the expected change in GDP of city i in k period ()expected can be expressed as follows:
where is the growth rate of national GDP in k period. Then, we measure the Resistancei and Recoverabilityi of city i in terms of the ratio of the difference between the actual and expected changes to the expected change in GDP of city i. Resistancei and Recoverabilityi can be estimated as follows:
where Falling represents the period of China’s economic decline after the outbreak of COVID-19, i.e., Q1 2019 is the base time, Q1 2020 is the period of recession, is the actual change in GDP of city i in the Falling period, ()expected is the expected change in GDP of city i in the Falling period. Growing represents China’s economic recovery period, i.e., Q2 to Q4 2019 is the base time, Q2 to Q4 2020 is the period of recovery, is the actual change in GDP of city i in the Growing period. ()expected is the expected change in GDP of city i in the Growing period. According to Equations (6) and (7), the values of Resistance and Recoverability are distributed with a zero center, and a positive value indicates a stronger resistance or recoverability of the city’s economy, while a negative value vice versa (To illustrate this approach, the city of Zhengzhou is an effective case study example. Resistancei and Recoverabilityi are calculated as follows: CNY 267.58 billion, is the GDP of Zhengzhou in Q1 2019; CNY 246.98 billion, is the GDP of Zhengzhou in Q1 2020; = −6.8%, is the national GDP rate of change in Q1 2020, with Q1, 2019 as the base time. The actual GPD change for Zhengzhou in Q1 2020 is calculated as = 246.98–267.58 = CNY −20.6 billion. The expected GDP change for Zhengzhou in Q1 2020 is calculated as −6.8% × 267.58 = CNY −18.19 billion. The Resistance of Zhengzhou is then calculated as 0.132. The Recoverabilityi of Zhengzhou is calculated the same way: ).
2.2.4. The Impact of the Industrial Linkage Structures on Economic Resilience
Finally, a multiple regression model is applied to explore the effects of the industrial linkage structures (centrality and diversity) on economic resilience. Meanwhile, the proportion of tertiary industry in GDP, the proportion of urban construction land in the urban area, and the ratio of local fiscal revenue to expenditure are selected as control variables to represent the effects of industrial structure (IND), urban construction degree (URB), and governance capability (GOV) on urban economic resilience. The regression model reads as follows:
where α0 is a constant term, and μi is a random disturbance term.
2.3. Data Sources
In this study, the data of the latest national 42-sector input–output table are used to measure the characteristics of industrial linkage structures (five industries: public administration, social security and social organizations; health and social work; education; water conservancy; environment and public facilities management, residential services and repair are excluded, because these government service industries are almost unaffected by the market economy). The city employment data for each industry and city economic data are obtained from the 2020 China Urban Construction Statistical Yearbook and China Urban Statistical Yearbook. Quarterly GDP data in 2020 for each city are obtained from the social and economic development reports of each city government.
3. Results
3.1. Characteristics of Industrial Linkage Structure
3.1.1. Characteristics of Industrial Linkage Structure: By Industry
According to Equations (1) and (2), the centrality and diversity of industrial linkage structures (by industry) are calculated using data from the national 42-sector input–output table (except for industries provided by the government), and the results are shown in Figure 2.
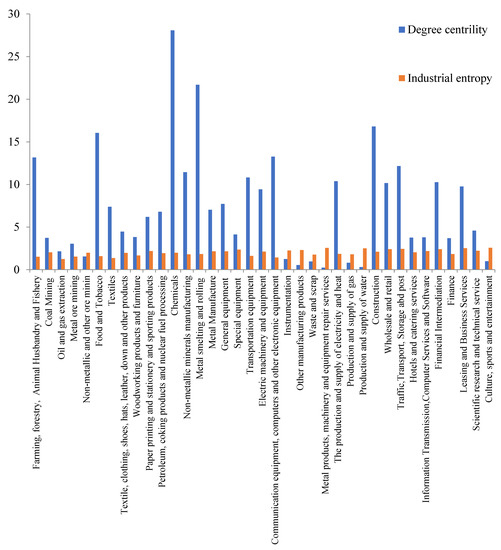
Figure 2.
Degree centrality and industrial entropy of industrial linkage structures in China (by industry).
Industries with high levels of centrality (Cj) are chemicals, metal smelting and rolling processing, construction, food and tobacco, agriculture, forestry, animal husbandry and fishery, communication equipment, computer and other electronic equipment, wholesale and retail trades, finance, etc. The high centrality indicates that these industries are highly correlated with other industries and are at the core of the industrial linkage network. This makes the network more robust, but if the industries with high centrality suffer targeted attack, it could increase the network’s vulnerability. Industries with low levels of centrality are gas production and supply, water production and supply, culture, sports and entertainment, mining, instrumentation and other manufacturing, etc. The low centrality indicates that these industries have a low degree of correlation with other industries and are not the core of the industrial linkage network.
Industries with high industrial entropy (IEj) include culture, sports and entertainment, metal products, machinery and equipment repair services, leasing and business services, transportation, storage and postal services, finance, wholesale and retail trades, etc. These industries generally provide goods or services to a large variety of consumers and are less affected by upstream and downstream fluctuations in the industrial chain, making it easier to diversify risks. Industries with lower industrial entropy are oil and gas extraction, metal mining, textiles, agriculture, forestry, animal husbandry and fishery, food and tobacco, and communication equipment, computer and other electronic equipment manufacturing, etc. Some of these industries are not correlated with many other industries, so they are less able to diversify risks. Others require more specialized industries upstream and downstream in the chain. As such, if a link in the chain is disrupted, the industry may be severely affected. For example, during the US–China trade war, the U.S. terminated its supply of chips for Huawei (a leading company in China’s telecommunications industry), significantly impacting Huawei’s business. This occurred because the industrial chain associated with high-end electronic equipment manufacturing is highly specialized. As such, a monopoly in a certain part of the supply chain may lead to increased industrial vulnerability.
3.1.2. Characteristics of Industrial Linkage Structures: By City
- (1)
- Centrality
Equation (3) indicates that the centrality of the industrial linkage structures can be converted to measures at the city level, allowing the cities’ industrial linkage structures to be quantified (Figure 3). The results show that the cities with high centrality are located in East China, Central China, and in the Chengdu–Chongqing city cluster in western China. In addition, other cities having leading industries with high centrality also have high centrality. For example, high centrality levels are seen for Liuzhou, where the leading industry is manufacturing; Yichun, where the leading industry is agriculture and forestry; and Luzhou, where the leading industry is construction and wholesale and retail. A city with high centrality indicates that the industrial linkage structures are strongly robust and are highly efficient. However, that can also lead to path dependence in urban industrial development. When suffering external economic shocks, these cities are affected by both robustness and vulnerability. The cities with low centrality are located in places such as northwest China, southern Southwest China, and northwest North China. The cities in these regions are less developed and have few industries with high centrality and low economic efficiency. Even if some industries experience problems, the impact on the overall economy is limited.
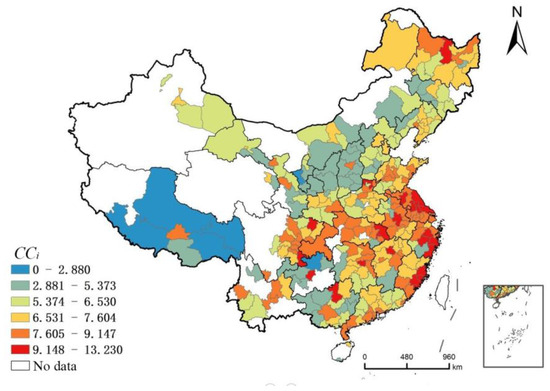
Figure 3.
The centrality of China’s urban industrial linkage structures.
- (2)
- Diversity
Equation (4) indicates that industrial entropy can also be converted to city-level measures, allowing the diversity of industrial linkage structures be calculated (Figure 4). Cities with high levels of industrial entropy are generally located in the Yangtze River Delta city cluster, Pearl River Delta city cluster, Western Taiwan Straits city cluster in the coastal region of China, the middle reaches of the Yangtze River city cluster, and the Chengdu–Chongqing city cluster in the central and western regions of China. These areas have a more developed tertiary industry, with a higher representation of industries with high IE level. As a result, the cities have a high diversity in their industrial linkage structures and are less likely to fall into path dependence. The cities with lower IE are located in Northwest China, North China, and Southwest China. In these areas, the leading industries in most cities include agricultural or traditional industries, such as mining, textiles, agriculture, forestry, animal husbandry and fishery, food and tobacco, and transportation equipment manufacturing. Due to the low IE of these industries, the diversity of the industrial linkage structures of these cities is low. Therefore, when experiencing external shocks, these cities are less able to diversify risks and easily fall into path dependence. Exceptions to this general finding include a few regional central cities, such as Kunming, Nanning, Nanchang, Xi’an, and Taiyuan.
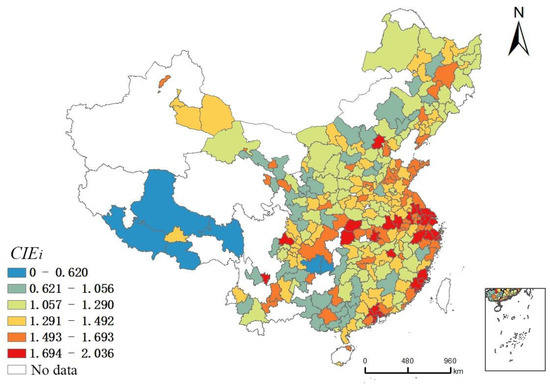
Figure 4.
The diversity of China’s urban industrial linkage structures.
3.2. Urban Economic Resilience
The quarterly GDP data for cities in 2020 were then entered into Equations (6) and (7) to calculate the Resistance of each city using the data for the first quarter, and to calculate the Recoverability of each city using data for the second, third, and fourth quarters. Figure 5 shows the results of the economic resilience of cities in China. In the four quadrants of figure, the first quadrant indicates the cities for which both Resistance and Recoverability are positive; these cities have high levels of economic resilience. The second and fourth quadrants represent the set of cites with high Recoverability but low Resistance, and high Resistance but low Recoverability, respectively. These cities are considered to have medium economic resilience. The third quadrant indicates cities for which both Resistance and Recoverability are negative; these cities have low levels of economic resilience. Overall, most cities in China have high economic resilience. There are 149 cities in the first quadrant with high economic resilience, and only 33 cities in the third quadrant with low economic resilience. This indicates that China’s urban economy showed relatively strong resilience under the impact of the COVID-19 pandemic.
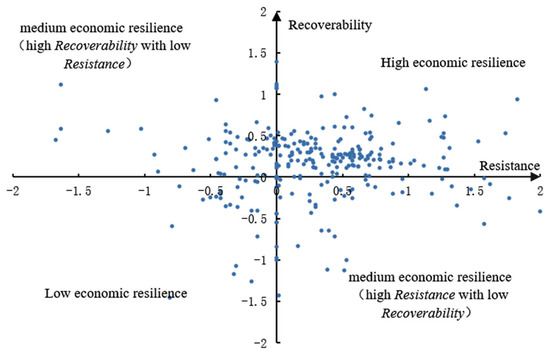
Figure 5.
Quadrant chart of China’s urban economic resilience in 2020. Note: due to the lack of city quarterly GDP data for 2019–2020 in Hubei Province, Jilin Province and Tibet, the provincial data are used instead of city data to measure the economic resilience for each city.
3.3. Analysis of the Impact of the Industrial Linkage Structure on Economic Resilience
3.3.1. Regression Analysis: By Cities across the Country
Using Equations (8) and (9) and SPSS23 software, we conduct multiple linear regressions to assess the Resistance and Recoverability of the study cities, as well as the characteristics of the industrial linkage structures (CCi and CIEi). The square of CCi is introduced in regression 2. Table 2 shows the regression results. The values of the determination coefficient R2 and F-values are significant, indicating that the independent variables selected for this study effectively explain the dependent variables, and the regression model is adequate. Table 2 shows the CCi has a significant and positive correlation with both Resistance and Recoverability. This means that for cities across the country, an increase in centrality is associated with an increase in urban economic resilience. After introducing the square of CCi in regression 2, the square of CCi has a significant and negative correlation with Resistance and Recoverability. This indicates that if centrality exceeds the critical value, an excessively high centrality value may increase the vulnerability of the economic system. Thus, there is an inverted U-shaped nonlinear relationship between centrality and the economic resilience of cities. The CIEi has a significant and positive correlation with both Resistance and Recoverability. This indicates that a high level of diversity of industrial linkage structures helps cities effectively reduce risks and enhance economic resilience. Among the control variables, the proportion of tertiary industry in GDP and the proportion of urban construction land in urban area are not significantly correlated with economic resilience. However, the ratio of local fiscal revenue to expenditure is significantly correlated with economic resilience.
Table 2.
Regression results of centrality, diversity, and economic resilience in cities across the country.
3.3.2. Regression Analysis: By Cities with Different Population Sizes
In China’s urban system, cities with different hierarchies and population sizes exhibit significant differences in industrial structures and economic development modes. This study divides the 298 studied cities in China into three types, according to permanent resident population: population greater than 6 million, 3 million to 6 million, and less than 3 million. This enabled an analysis of the different effects of centrality and diversity on urban economic resilience with different population sizes. Table 3 shows the results, and indicates that among cities of different population sizes, the CCi and CIEi have a positive and significant correlation with the economic resilience of most cities. In particular, the CIEi has a strong positive and significant correlation with the Resistance of all cities. This indicates that cities can improve the economic resilience by increasing the diversity of industrial linkage structures.
Table 3.
Regression results of centrality, diversity, and economic resilience in cities with different population sizes.
For cities with a population exceeding 6 million, CCi has a positive and significant correlation with the Resistance and a negative and significant correlation with the Recoverability. The CIEi has a positive and significant correlation with both Resistance and Recoverability. These megacities are mainly provincial capitals, municipalities directly under the central government, and cities with large populations on the eastern coast. These megacities can enhance urban economic resilience by increasing the diversity of the industrial linkage structures; however, too much centrality can impair the resilience of the urban economy. Many economic development resources are concentrated in large cities; as such, a higher level of diversity in industrial linkage structures is associated with a stronger level of interindustry integration and permeability. This can disperse the economic system risk and improve economic resilience. However, too much centrality can also increase the vulnerability of the economic system.
For cities with a population of 3 to 6 million, both CCi and CIEi have positive and significant correlations with Resistance and have a nonsignificant correlation with Recoverability. These cities are mainly nonprovincial capital cities and regional subcenter cities; examples include Yuncheng, Baoji, Yangzhou, and Deyang. These cities have prominent industrial characteristics, and the leading industries account for a large proportion of the local economy. As such, increasing the centrality of the industrial linkage structure may help to expand advantageous local industries and improve economic resilience.
For cities with a population less than 3 million, CCi has a significant and positive correlation with Resistance and a significant and negative correlation with Recoverability. The CIEi has a significant and positive correlation with Resistance. These cities are mainly located in the northwest, southwest, and northeast of China; and most are located in the less developed regions of China. Examples include Baotou, Fushun, Beihai, Yuxi, and Shangluo. The CCi of these cities shows different effects with respect to Resistance (positive) and Recoverability (negative). This is because the economic development of these cities relies more on resources and a single leading industry development mode. In the face of the pandemic, if the leading industries are not affected, the city generally shows strong economic resilience. However, in the recovery period, excessive centrality leads the local economy to fall into path dependence, resulting in the excessive concentration of limited resources in certain industries. This restricts the development of other industries, adversely affecting improvements in Recoverability.
3.3.3. Countermeasures to Enhance the Economic Resilience of China’s Cities
The COVID-19 pandemic has continued its global spread, with significant impacts on economic systems. These impacts are now coupled with China’s long-standing problems of unbalanced regional development and uncoordinated industrial development. Therefore, based on this study’s results, the following recommendations are proposed to enhance China’s urban economic resilience. These are offered from the perspective of the impact of centrality and diversity on resilience.
- (1)
- Enhancing the diversity of industrial linkage structures can effectively improve urban economic resilience. Individual cities should focus on advantageous industries, actively introduce related industries, encourage the interpenetration and reorganization among factors of production in the industrial network, and advance the development of interindustrial integration. Improving the diversity of urban industrial linkage structures can enhance the economic resilience of cities. Therefore, local governments should accelerate the cultivation or introduction of workers and firms with interdisciplinary talents. At the same time, they should promote interindustry linkage development through preferential policies, such as fiscal, financial, and taxation incentives. This could help provide a talent base and policy support for improving the diversity of industrial linkage structures.
- (2)
- Megacities with populations exceeding 6 million should also focus on enhancing the diversity of industrial linkage structures, but in slightly different ways. These cities should leverage positive externalities and knowledge spillover effects created by the diversity of the industrial linkage structures to enhance the innovation capacity and core competitiveness of related industries. Local governments should encourage and guide multinational corporations to further develop into additional industries related to their main business and promote the diversification of products and trade. These should further enhance the economic resilience of cities. At the same time, if centrality is too high, it may indicate that an industry is overdeveloped. This may increase competition within the industry and inhibit the flow and sharing of information and technology. Therefore, local governments should control the growth boundary of centrality and support the development of small and medium enterprises, in to prevent excessive centrality from increasing the vulnerability of the economic system.
- (3)
- In larger cities, with a population of 3–6 million, urban industries should both enhance diversity and improve centrality. Based on the industries giving the cities the most advantages, cities should expand and strengthen leading industries, encourage the development of advantageous industrial clusters, balance the relationship between industrial centrality and diversity, and create more high-end industrial chains with competitive advantages. Local governments should also establish multidirectional and networked trade, encourage an increase in the division of labor and the implementation of supply chain systems for industries, optimize the allocation of production factors, and diversify the positioning of industries in regional, domestic, and international markets.
- (4)
- For small and medium-sized cities with a population of less than 3 million, particularly those in the northwest, southwest and northeast of China, centrality is mainly caused by the local economy’s reliance on a single leading industry development mode. Therefore, urban industrial development should focus on coordinating the double effect of centrality, developing related supporting industries around leading industries, actively exploring the development direction of industrial transformation and upgrades, and expanding new development paths for the cities. Local governments can introduce relevant preferential finance and taxation policies to drive enterprises to invest in technological innovation and promote the transformation and upgrading of traditional or resource-based industries.
4. Conclusions and Discussion
4.1. Conclusions
- (1)
- Chemicals, metal smelting and rolling processing, construction, food and tobacco, agriculture, forestry, animal husbandry and fishery, communication equipment, computer and other electronic equipment, wholesale and retail, and finance industries have higher centrality of industrial linkage structure. Cities with high centrality are located in East China, Central China, and the Chengdu–Chongqing city cluster in western China.
- (2)
- Culture, sports and entertainment, water production and supply, leasing and business services, transportation, storage and postal services, finance, wholesale, and retail industries have higher diversity of industrial linkage structure. Cities with high diversity are located in the Yangtze River Delta city cluster, Pearl River Delta city cluster, Western Taiwan Straits city cluster, the middle reaches of the Yangtze River city cluster, and the Chengdu–Chongqing city cluster.
- (3)
- Most cities in China have high economic resilience. The regression analysis results show that the centrality has a significant and positive correlation with both Resistance and Recoverability for cities across the country. The square of centrality has a negative correlation with Resistance and Recoverability, indicating an inverted U-shaped nonlinear relationship between centrality and urban economic resilience. The diversity has a significant and positive correlation with both Resistance and Recoverability.
- (4)
- For cities with different population sizes, the centrality and diversity of industrial linkage structures have different effects on urban economic resilience. The economic resilience of cities can be improved by enhancing the diversity of industrial linkage structures. Excessive centrality may have a negative impact on Recoverability for cities with populations of more than 600 million and less than 3 million. Therefore, cities should adjust the centrality and diversity of industrial linkage structure by developing different industrial policies to enhance economic resilience.
4.2. Discussion
As research work on resilience theory has developed, approaches to measuring urban economic resilience have advanced. Compared with the previous resilience studies, which have generally analyzed resilience using an ex-post, static indicator system, this study captures the intrinsic factors affecting economic resilience: these are the characteristics of the industrial linkage structures (centrality and diversity). The study evaluated the economic data before and after the COVID-19 pandemic to assess the resistance and recoverability of the urban economic system. This method has important methodological significance, because its application of resilience theory from the perspective of evolutionary theory provides a dynamic and processual approach, as well as empirical evidence.
The inverted U-shaped relationship between centrality and urban economic resilience reflects the double effect of centrality on robustness and vulnerability. This demonstrates the suitability of applying network structure theory to study urban economic resilience. Cities with different population sizes should optimize their industrial structures based on local conditions and balance the relationship between centrality and diversity to promote urban economic resilience. In addition, the industrial linkage structure is complex, and many factors affect economic resilience. Therefore, future research should focus on exploring the correlations between other characteristics associated with industrial linkage structures and urban economic resilience. Also, additional comparative studies would be useful for assessing the impact of industrial linkage structures on economic resilience in different countries, economic zones, and city clusters.
Author Contributions
Conceptualization, S.Y. and M.C.; methodology, S.Y.; software, S.Y.; validation, S.Y. and M.C.; formal analysis, S.Y.; investigation, S.Y.; resources, M.C.; data curation, S.Y.; writing—original draft preparation, S.Y.; writing—review and editing, S.Y.; visualization, S.Y.; supervision, S.Y.; project administration, M.C. All authors have read and agreed to the published version of the manuscript.
Funding
This research was supported by “the Innovative Capability Support Fund of Shaanxi Province under grant 2022KRM197”.
Institutional Review Board Statement
Not applicable.
Informed Consent Statement
Not applicable.
Data Availability Statement
Not applicable.
Conflicts of Interest
The authors declare no conflict of interest.
References
- Godschalk, D.R. Urban Hazard Mitigation: Creating Resilient Cities. Nat. Hazards Rev. 2003, 4, 136–143. [Google Scholar] [CrossRef]
- Atun, F. Understanding Effects of Complexity in Cities During Disasters. In Understanding Complex Urban Systems: Multidisciplinary Approaches to Modeling; Understanding Complex Systems; Walloth, C., Gurr, J.M., Schmidt, J.A., Eds.; Springer International Publishing: Cham, Switzerland, 2014; pp. 51–65. ISBN 978-3-319-02996-2. [Google Scholar]
- Pretorius, O.; Drewes, E.; Aswegen, M.V. Fostering a Resilient Regional Economy in the SADC through Regional Integration. Reg. Sci. Policy Pract. 2017, 9, 217–228. [Google Scholar] [CrossRef]
- Hess, M.; Yeung, H.W.-C. Whither Global Production Networks in Economic Geography? Past, Present, and Future. Environ. Plan. Econ. Space 2006, 38, 1193–1204. [Google Scholar] [CrossRef]
- Pavlínek, P. Global Production Networks, Foreign Direct Investment, and Supplier Linkages in the Integrated Peripheries of the Automotive Industry. Econ. Geogr. 2018, 94, 141–165. [Google Scholar] [CrossRef]
- Xi, J. Major Issues Concerning China’s Strategies for Mid-to-Long-Term Economic and Social Development. Seek. Knowl. 2020, 21, 4–7. [Google Scholar]
- Zhai, G.; Li, S.; Chen, J. Reducing Urban Disaster Risk by Improving Resilience in China from a Planning Perspective. Hum. Ecol. Risk Assess. Int. J. 2015, 21, 1206–1217. [Google Scholar] [CrossRef]
- Davoudi, S.; Brooks, E.; Mehmood, A. Evolutionary Resilience and Strategies for Climate Adaptation. Plan. Pract. Res. 2013, 28, 307–322. [Google Scholar] [CrossRef]
- MacKinnon, D.; Derickson, K.D. From Resilience to Resourcefulness: A Critique of Resilience Policy and Activism. Prog. Hum. Geogr. 2013, 37, 253–270. [Google Scholar] [CrossRef]
- Simmie, J.; Martin, R. The Economic Resilience of Regions: Towards an Evolutionary Approach. Camb. J. Reg. Econ. Soc. 2010, 3, 27–43. [Google Scholar] [CrossRef]
- Amirzadeh, M.; Sobhaninia, S.; Sharifi, A. Urban Resilience: A Vague or an Evolutionary Concept? Sustain. Cities Soc. 2022, 81, 103853. [Google Scholar] [CrossRef]
- Doran, J.; Fingleton, B. US Metropolitan Area Resilience: Insights from Dynamic Spatial Panel Estimation. Environ. Plan. Econ. Space 2018, 50, 111–132. [Google Scholar] [CrossRef]
- Boschma, R. Towards an Evolutionary Perspective on Regional Resilience. Reg. Stud. 2015, 49, 733–751. [Google Scholar] [CrossRef]
- Martin, R.; Sunley, P.; Gardiner, B.; Tyler, P. How Regions React to Recessions: Resilience and the Role of Economic Structure. Reg. Stud. 2016, 50, 561–585. [Google Scholar] [CrossRef]
- Balland, P.-A.; Rigby, D.; Boschma, R. The Technological Resilience of US Cities. Camb. J. Reg. Econ. Soc. 2015, 8, 167–184. [Google Scholar] [CrossRef]
- Suire, R.; Vicente, J. Clusters for Life or Life Cycles of Clusters: In Search of the Critical Factors of Clusters’ Resilience. Entrep. Reg. Dev. 2014, 26, 142–164. [Google Scholar] [CrossRef]
- Rose, A.; Krausmann, E. An Economic Framework for the Development of a Resilience Index for Business Recovery. Int. J. Disaster Risk Reduct. 2013, 5, 73–83. [Google Scholar] [CrossRef]
- Marana, P.; Labaka, L.; Sarriegi, J.M. A Framework for Public-Private-People Partnerships in the City Resilience-Building Process. Saf. Sci. 2018, 110, 39–50. [Google Scholar] [CrossRef]
- Cutter, S.L.; Barnes, L.; Berry, M.; Burton, C.; Evans, E.; Tate, E.; Webb, J. A Place-Based Model for Understanding Community Resilience to Natural Disasters. Glob. Environ. Change 2008, 18, 598–606. [Google Scholar] [CrossRef]
- Graziano, P.; Rizzi, P. Vulnerability and Resilience in the Local Systems: The Case of Italian Provinces. Sci. Total Environ. 2016, 553, 211–222. [Google Scholar] [CrossRef]
- Giannakis, E.; Bruggeman, A. Regional Disparities in Economic Resilience in the European Union across the Urban–Rural Divide. Reg. Stud. 2020, 54, 1200–1213. [Google Scholar] [CrossRef]
- Cainelli, G.; Ganau, R.; Modica, M. Does Related Variety Affect Regional Resilience? New Evidence from Italy. Ann. Reg. Sci. 2019, 62, 657–680. [Google Scholar] [CrossRef]
- Lian, C.; Haimes, Y. Managing the Risk of Terrorism to Interdependent Infrastructure Systems through the Dynamic Inoperability Input-Output Model. Syst. Eng. 2006, 9, 241–258. [Google Scholar] [CrossRef]
- Newman, M.E.J. Assortative Mixing in Networks. Phys. Rev. Lett. 2002, 89, 208701. [Google Scholar] [CrossRef]
- Chopra, S.S. Graph Theoretic Approaches to Understand Resilience of Complex Systems. Available online: http://d-scholarship.pitt.edu/25797/ (accessed on 23 November 2020).
- Niu, Q.; Zeng, A.; Fan, Y.; Di, Z. Robustness of Centrality Measures against Network Manipulation. Phys. Stat. Mech. Its Appl. 2015, 438, 124–131. [Google Scholar] [CrossRef]
- Albert, R.; Jeong, H.; Barabási, A.-L. Error and Attack Tolerance of Complex Networks. Nature 2000, 406, 378–382. [Google Scholar] [CrossRef] [PubMed]
- Sun, S.; Wu, Y.; Ma, Y.; Wang, L.; Gao, Z.; Xia, C. Impact of Degree Heterogeneity on Attack Vulnerability of Interdependent Networks. Sci. Rep. 2016, 6, 32983. [Google Scholar] [CrossRef]
- Frenken, K.; Oort, F.V.; Verburg, T. Related Variety, Unrelated Variety and Regional Economic Growth. Reg. Stud. 2007, 41, 685–697. [Google Scholar] [CrossRef]
- Han, Y.; Goetz, S.J. Predicting US County Economic Resilience from Industry Input-Output Accounts. Appl. Econ. 2019, 51, 2019–2028. [Google Scholar] [CrossRef]
- Eagle, N.; Macy, M.; Claxton, R. Network Diversity and Economic Development. Science 2010, 328, 1029–1031. [Google Scholar] [CrossRef]
- Cellini, R.; Torrisi, G. Regional Resilience in Italy: A Very Long-Run Analysis. Reg. Stud. 2014, 48, 1779–1796. [Google Scholar] [CrossRef]
- Lapuh, L. Socio-Economic Characteristics of Resilient Localities—Experiences from Slovenia. Reg. Stud. Reg. Sci. 2018, 5, 149–156. [Google Scholar] [CrossRef]
- Martin, R. Regional Economic Resilience, Hysteresis and Recessionary Shocks. J. Econ. Geogr. 2012, 12, 1–32. [Google Scholar] [CrossRef]
- van Bergeijk, P.A.G.; Brakman, S.; van Marrewijk, C. Heterogeneous economic resilience and the great recession’s world trade collapse. Pap. Reg. Sci. 2017, 96, 3–12. [Google Scholar] [CrossRef]


Disclaimer/Publisher’s Note: The statements, opinions and data contained in all publications are solely those of the individual author(s) and contributor(s) and not of MDPI and/or the editor(s). MDPI and/or the editor(s) disclaim responsibility for any injury to people or property resulting from any ideas, methods, instructions or products referred to in the content. |
© 2023 by the authors. Licensee MDPI, Basel, Switzerland. This article is an open access article distributed under the terms and conditions of the Creative Commons Attribution (CC BY) license (https://creativecommons.org/licenses/by/4.0/).