Article

Evolution of Hydrogeochemistry in the Haolebaojinao Watershed of the Ordos Basin, China

1
Institute of Geophysical and Geochemical Exploration, Chinese Academy of Geological Sciences, Langfang 065000, China
2
China Institute of Geo-Environmental Monitoring, Beijing 100081, China
3
Key Laboratory of Groundwater Conservation of Ministry of Water Resources, China University of Geosciences, Beijing 100083, China
4
Ministry of Education, Key Laboratory of Groundwater Circulation and Environmental Evolution, China University of Geosciences, Beijing 100083, China
5
School of Water Resources & Environment, China University of Geosciences, Beijing 100083, China
6
Yellow River Engineering Consulting Co., Ltd. (YREC), Zhengzhou 450003, China
7
Key Laboratory of Water Management and Water Security for Yellow River Basin, Ministry of Water Resources (under Construction), Zhengzhou 450003, China
*
Author to whom correspondence should be addressed.
Sustainability 2023, 15(6), 5091; https://doi.org/10.3390/su15065091
Submission received: 6 January 2023 / Revised: 27 February 2023 / Accepted: 9 March 2023 / Published: 13 March 2023

Abstract

:
The exploitation of groundwater in arid and semi-arid areas, especially in basins where groundwater is intensively exploited, is likely to have adverse effects on the originally fragile ecological environment, which also greatly alter the hydrogeochemical evolution process. Over-abstraction of groundwater in the Haolebaoji watershed of the Ordos Basin located in the semi-arid regions has led to a series of changes in the groundwater system, which has attracted considerable attention from environmental protection organizations. However, the origin and geochemical evolution of groundwater in the Haolebaoji watershed have not been revealed. In this study, the Haolebaoji watershed is selected as the typical study area to investigate hydrogeochemical evolution under the intensive groundwater exploitation. Groundwater samples were collected and tested for major ions and stable isotopes (δ18O, δD). Various approaches including the ion proportional relationship diagram, chlor-alkali index, saturation index, Gibbs diagram, and principal factor analysis were used to reveal the hydrogeochemical processes regulating the groundwater geochemistry. The groundwater in the study area is divided into five hydrochemical types according to the Piper diagram. It was found that the chemical composition of groundwater in the study area is mainly controlled by the dissolution of calcite, dolomite, gypsum, and halite. The cation exchange intensity gradually increased with the flow of groundwater from the recharge to the discharge area. Rock weathering plays a controlling role in the formation of groundwater geochemistry, but it is also controlled by evaporative crystallization in some runoff and discharge areas. Groundwater is predominantly recharged by modern local atmospheric precipitation, and deep wells receive water supply during cold periods. The study findings provide important information for the development of sustainable groundwater management strategies for the Ordos Energy Base.

1. Introduction

The natural ecological environment and human socioeconomic development in arid and semiarid regions are strongly dependent on groundwater resources [1,2,3,4,5,6,7]. Changes in the groundwater environment play a pivotal role in the economic and ecological stability in these areas [8,9,10]. It is important to examine the interaction mechanisms between groundwater and the environment by studying the characteristics and evolution of groundwater chemistry. This is highly important in maintaining ecosystem stability in semiarid and arid regions.
Hydrogeologists have conducted much research on the groundwater chemical characters and evolution. Bruce et al. analyzed the groundwater chemical characters in the northern area of Volta using the q and R factor analysis method. The results showed that this area mainly predominantly experienced the dissolution of carbonate minerals and the weathering and dissolution of silicate minerals [11]. Liu et al. analyzed the results of stable isotopes of groundwater in the Ashikaga region in central Japan, indicating that the surface rivers contributed greatly to the recharge of groundwater [12]. Abel O. et al. analyzed the hydrochemical and stable isotope characters of the shallow groundwater in the Ekiti area in southwestern Nigeria. The results showed that the recharge area is mainly supplied by atmospheric precipitation, while the groundwater with low TDS is mainly experienced the water–rock interaction [13]. Reza et al. applied principal component analysis and hierarchical cluster analysis to study the chemical characters and hydrogeochemical process of groundwater in the Urmia Salt Lake and verified that the multivariate statistical analysis method can effectively analyze the natural and non-natural affect of groundwater characters [14]. Ayla et al. analyzed the hydrochemical characteristics of groundwater in the Cumra Plain using multivariate statistical analysis method and concluded that the main hydrogeochemical processes in the area include cation exchange, evaporation and concentration, dissolution of carbonate, gypsum and soil salts, and weathering dissolution of silicate [15]. Argamasilla et al. used the Na+and Cl relationship diagram and the chlor-alkali index (CAI) to determine that there is cation exchange in the groundwater quality evolution process of the coastal aquifer in southern Spain [16]. Bouteraa et al. used the combination of principal component analysis and cluster analysis to study the groundwater evolution in Boumerzoug-El area in northeastern Algeria. The results showed that the hydrochemical characters were affected by water–rock interaction and agricultural irrigation [17]. However, little research on the hydrochemical evolution under over-abstraction in arid and semi-arid basins has been conducted.
As a typical arid and semiarid area, the Ordos Basin plays a key role in China’s economic development and ecological environment protection. The China Geological Survey has carried out a regional survey of groundwater storage conditions and migration laws in the Ordos Basin seventeen years ago [1,18]. Researchers have also used hydrochemical and isotopic methods to study the spatiotemporal evolution mechanisms of groundwater systems in the Cretaceous strata and other strata in the whole basin [19,20,21]. Researchers have mainly studied the hydrochemical evolution of the specific aquifer, rather than the hydrochemical evolution of the complete basin. However, the evolution of hydrogeochemistry in the Haolebaojinao watershed of the Ordos Basin has not been revealed in detail. As a typical small salt lake watershed, the Haolebaojinao watershed is located in the central Ordos Basin and has a fragile ecological environment. The Haolebaoji watershed is an important well field in the Ordos Basin, and it is also the core hinterland of China’s national strategy of “ecological protection and high-quality development of the Yellow River basin” [22]. From 2010, the Haolebaoji watershed as a typical large well field has exploited 6.0 × 10⁴~7.3 × 10⁴ m3/d, resulting in ecological environment problems [23]. During the intensive groundwater exploitation, the surrounding ecology has changed significantly, which has attracted the attention of environmental protection organizations. According to the investigation of Greenpeace, the exploitation of groundwater in this area has led to the death of vegetation [24]. Large-scale and intensive groundwater exploitation will also have a significant impact on the hydrochemical field of the groundwater system in the study area. No research has been conducted on the hydrochemical evolution under intensive groundwater exploitation in this area. It is urgent to know the origin and geochemical evolution of groundwater in the Haolebaojinao Basin under intensive groundwater exploitation, to identify the factors controlling the chemical composition of groundwater and to conduct research on its related mechanisms. Studying the hydrochemical evolution caused by overexploitation is of great significance for the protection and restoration of the natural ecosystem in the Haolebaoji watershed. This can provide decision-makers with important information on water quality status and groundwater geochemical evolution. Furthermore, the research method can be used to provide a key reference for other similar intensive groundwater exploitation watersheds for undertaking relevant research.

2. Overview of the Study Area

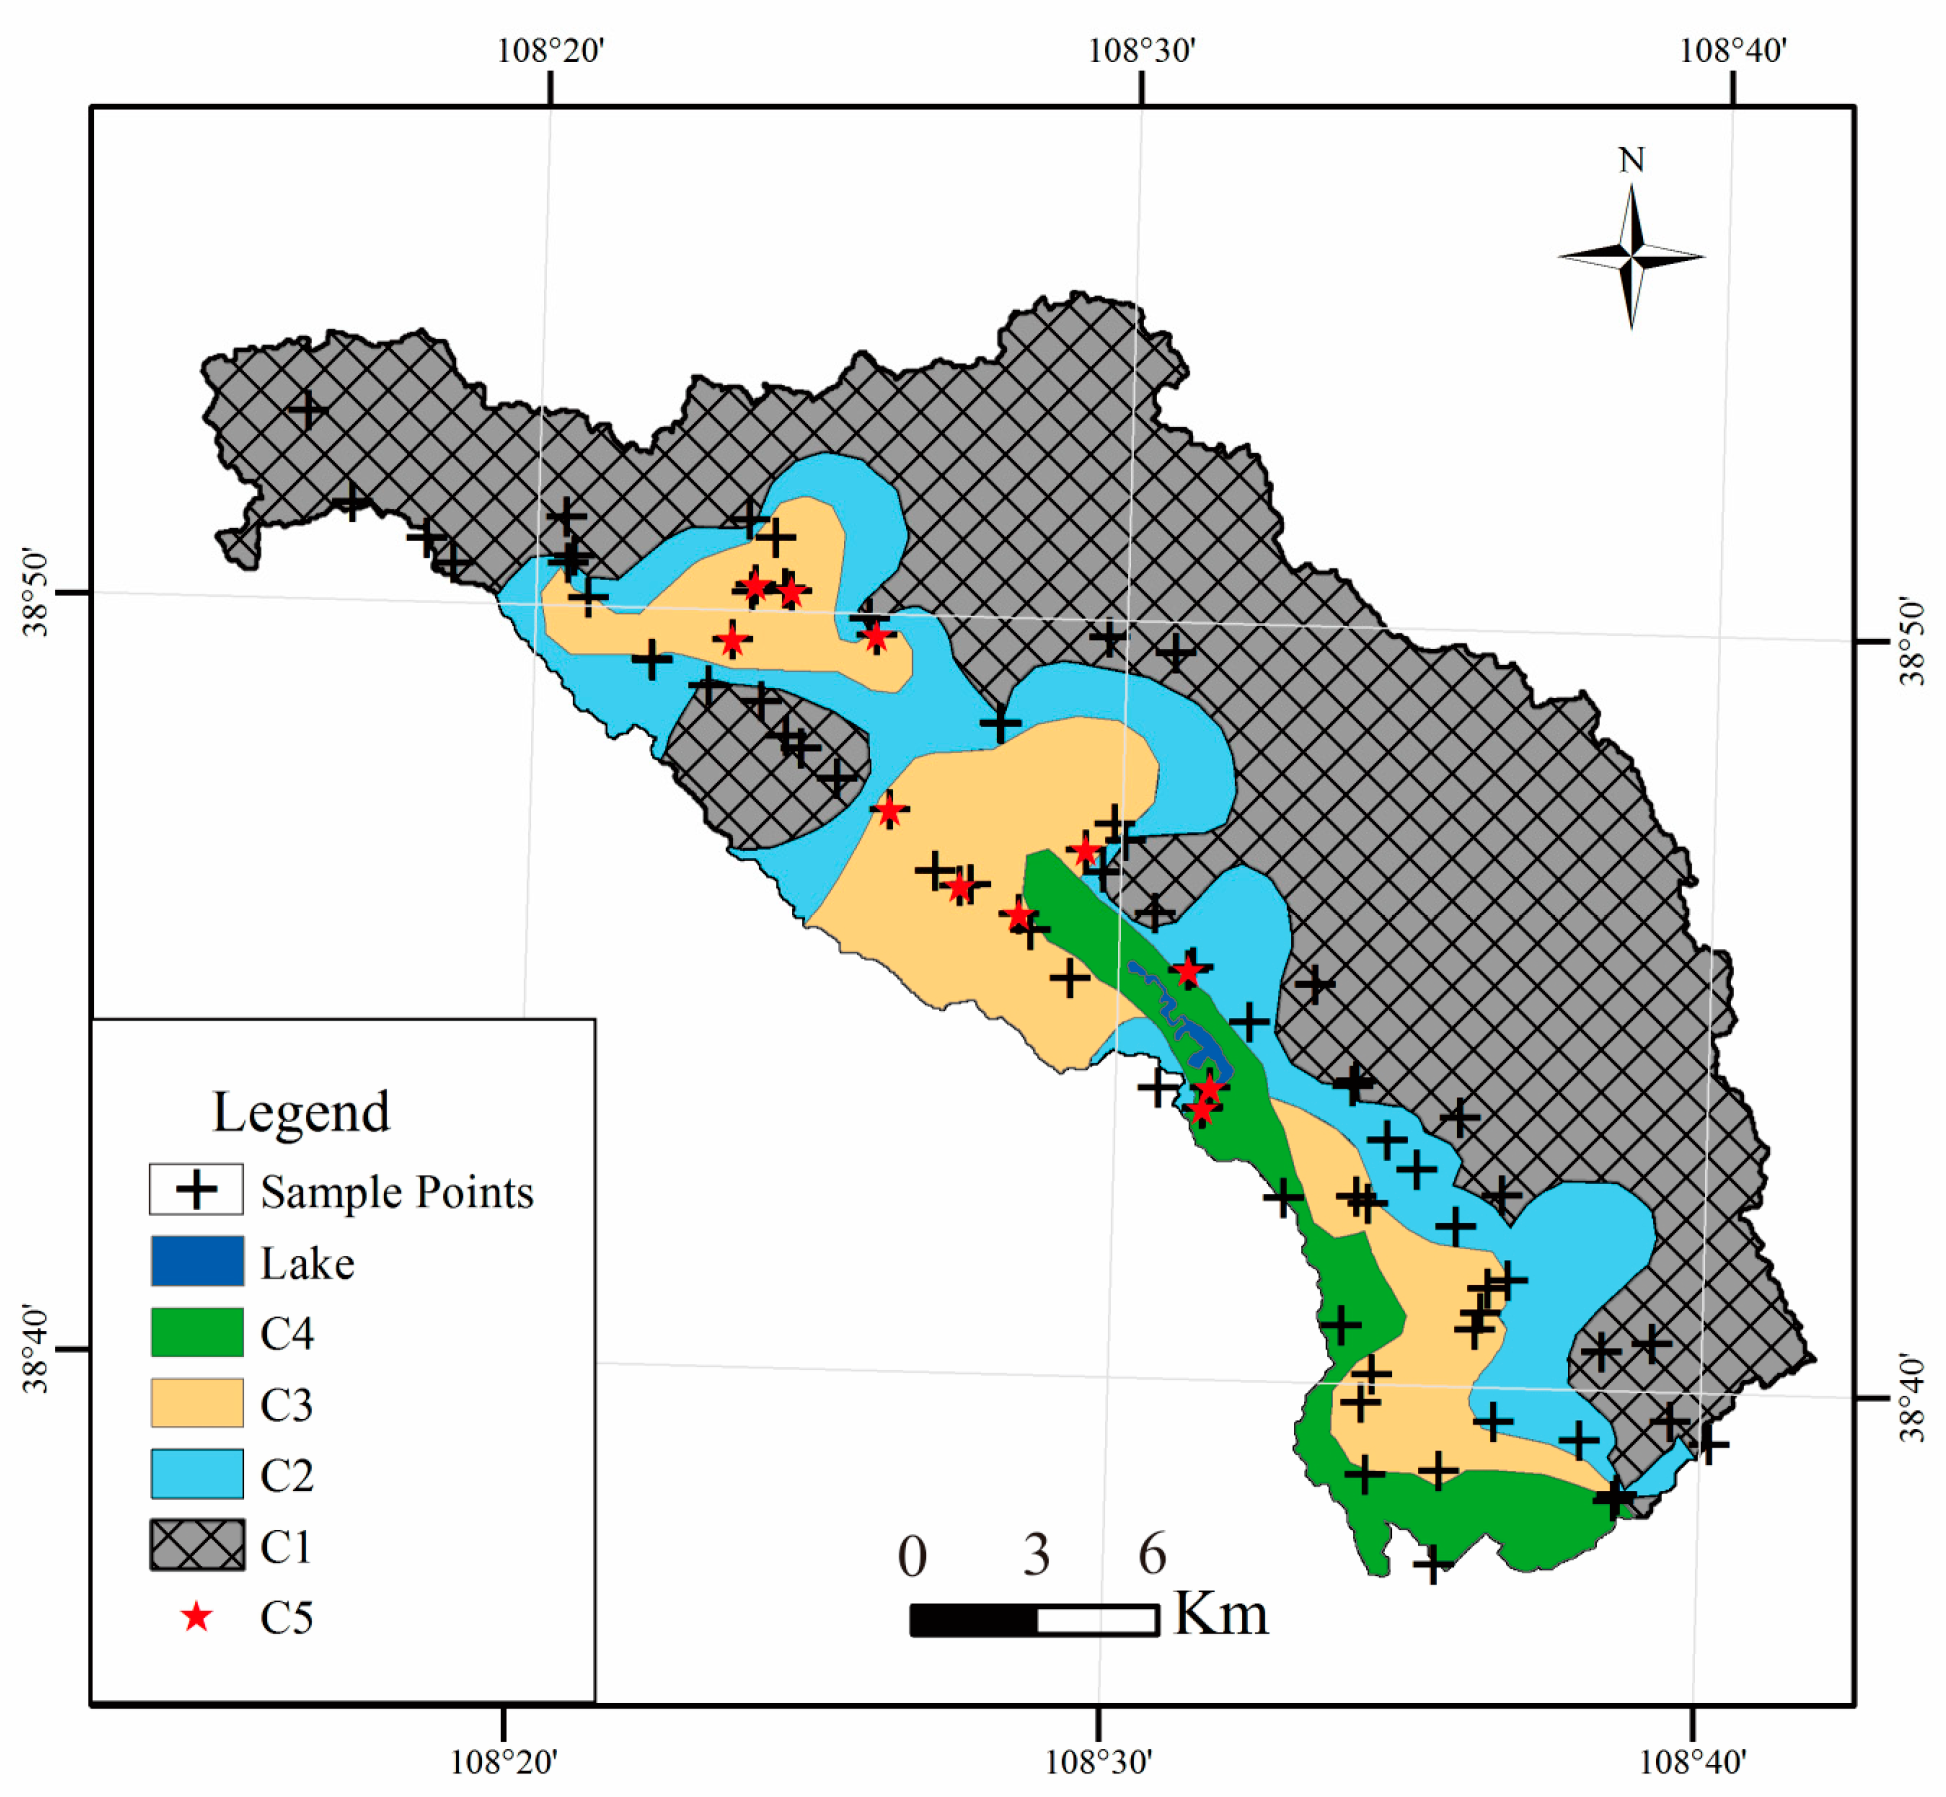
The Haolebaojinao watershed is located in the central Ordos Basin, on the northern edge of the Mu Us Sandy Land, and close to Dongshengliang–Shililiang, the first-class watershed of the Ordos Plateau. The geographical coordinates are 108°13′–108°42′ east longitude and 38°36′–38°56′ north latitude. It is 1304–1542 m above sea level, and the area is approximately 510 km2. The terrain is high in the northeast and southwest and low in the center and is generally flat (Figure 1).
The Haolebaojinao watershed is an arid–semiarid area with little precipitation and strong evaporation. Statistics from 1955 to 2014 from the meteorological station in Otuoke Banner near the study area have shown that the annual average temperature is 7.0 °C. The monthly average maximum temperature occurs in July, and the multiyear average temperature difference is 32.9 °C. The average annual precipitation is in the range 125–611 mm, and the average is 265 mm. The precipitation varies considerably throughout the year, falling mainly during summer, with the highest precipitation occurring from July to September. The average annual evaporation is 1369 mm, with the strongest evaporation occurring from May to July [25]. Haolebaojinao is the only surface water body in the study area, and the area of Haolebaojinao is approximately 4.7 km2. Due to drought, low levels of rainfall and high levels of evaporation, Haolebaojinao is a salt (alkali) lake with high salinity and poor water quality, which is not suitable for consumption by people and livestock.
There is a no-fault structure in the study area, the folds and other structures are not developed, the rock formation is nearly horizontal, and the rock structure is single. Cretaceous Baoan Group Huanhe Formation sandstone and Quaternary loose deposits are exposed in the study area. The Quaternary loose deposits are predominantly aeolian sand and relatively thin. Cretaceous sandstone is the main formation that occurs in the study area. The sandstones of the Cretaceous Baoan Formation are approximately 200–950 m thick, and from top to bottom are the Huanhe Formation and the Luohe Formation. Cretaceous sandstone is dominated by quartz, albite, and feldspar and contains gypsum, rock salt, calcite, and dolomite [26].
Atmospheric precipitation is the main source of groundwater recharge in the study area. The topography on both sides of the study area is high, the middle is low-lying, and the degree of cutting is relatively small. The surface is covered with a layer of aeolian sand with strong permeability. It is difficult for runoff to form on the surface, and atmospheric precipitation directly infiltrates to replenish the groundwater. Strongly influenced by topographical factors, groundwater is recharged on the highlands on both sides and discharged near Haolebaojinao, showing a trend of flowing from both sides to the middle. Haolebaojinao is the only surface water body in the area, and it is also the discharge area for groundwater. Most of the groundwater in the study area is discharged through evaporation of Haolebaojinao.

3. Methods

3.1. Water Sample Collection

A total of 81 groundwater samples were collected in the study area in August 2021 (Figure 1). The water samples were collected from domestic and agricultural wells at depths ranging from 5 to 700 m. They were collected after prerinsing 100 and 50 mL polyethylene bottles with the water samples three times. Cation and anion analyses were performed after filtration of the samples with 0.45-μm cellulose membrane filters. All the samples were sealed with sealant to prevent evaporation.

3.2. Analysis and Testing

In situ water chemistry parameters were monitored using calibrated instruments. The electrical conductivity (EC), temperature total dissolved solids (TDS), and pH of the water samples were measured in situ. The values measured were taken to reach a steady state as the stopping criterion.
We tested the main ionic composition of each sample, including K+, Na+, Ca2+, Mg2+, Cl, SO42−, HCO3, CO32−, and NO3. The cations K+, Na+, Ca2+, and Mg2+ were analyzed using inductively coupled plasma (ICP-900, Thermo, Waltham, MA, USA). The anions Cl, SO42−, and NO3 were analyzed using ion chromatography (ICS-900, Dionex, Sunnyvale, CA, USA), and the anions HCO3 and CO32− were analyzed using in situ titration. The charge balance errors for all the samples were within 10%. The stable isotopes of δD and δ18O were determined by using an isotope water liquid-vapor analyzer (L2120-I, Picarro, Santa Clara, CA, USA), which were expressed as δ‰ relative to the Vienna standard mean seawater value.

4. Results

4.1. Water Chemistry

The in situ water quality parameters such as pH, EC, temperature, and TDS of groundwater and lake water samples, as well as analysis data of major ion compositions, are shown in Table 1. The pH value of groundwater samples in the Haolebaojinao watershed ranges from 7.49 to 9.53. The median value is 7.94, and the average pH is 7.99. The water samples are neutral and slightly alkaline. The range of values for TDS is 90 mg/L–1038 mg/L, the median value is 305.4 mg/L, and the average value is 366.2 mg/L. The salinity of the groundwater is relatively low, which is fresh water. The water temperature ranges from 9.5 °C to 22.2 °C and increases with depth. The EC values varied from 150 to 1730 μS/cm, and the trend for EC was similar to that of TDS.
The overall distribution of the chemical types of groundwater in the study area is shown by the average values of ion contents. The bicarbonate content is much higher than that of other ions, and bicarbonate water is the main type. The calcium ion content is substantially larger than that of other cations, and calcium ions have a pronounced advantage. Sodium and magnesium ions also have relatively high contents, indicating that the water chemistry type in this area may contain other water types in addition to calcium-type water.
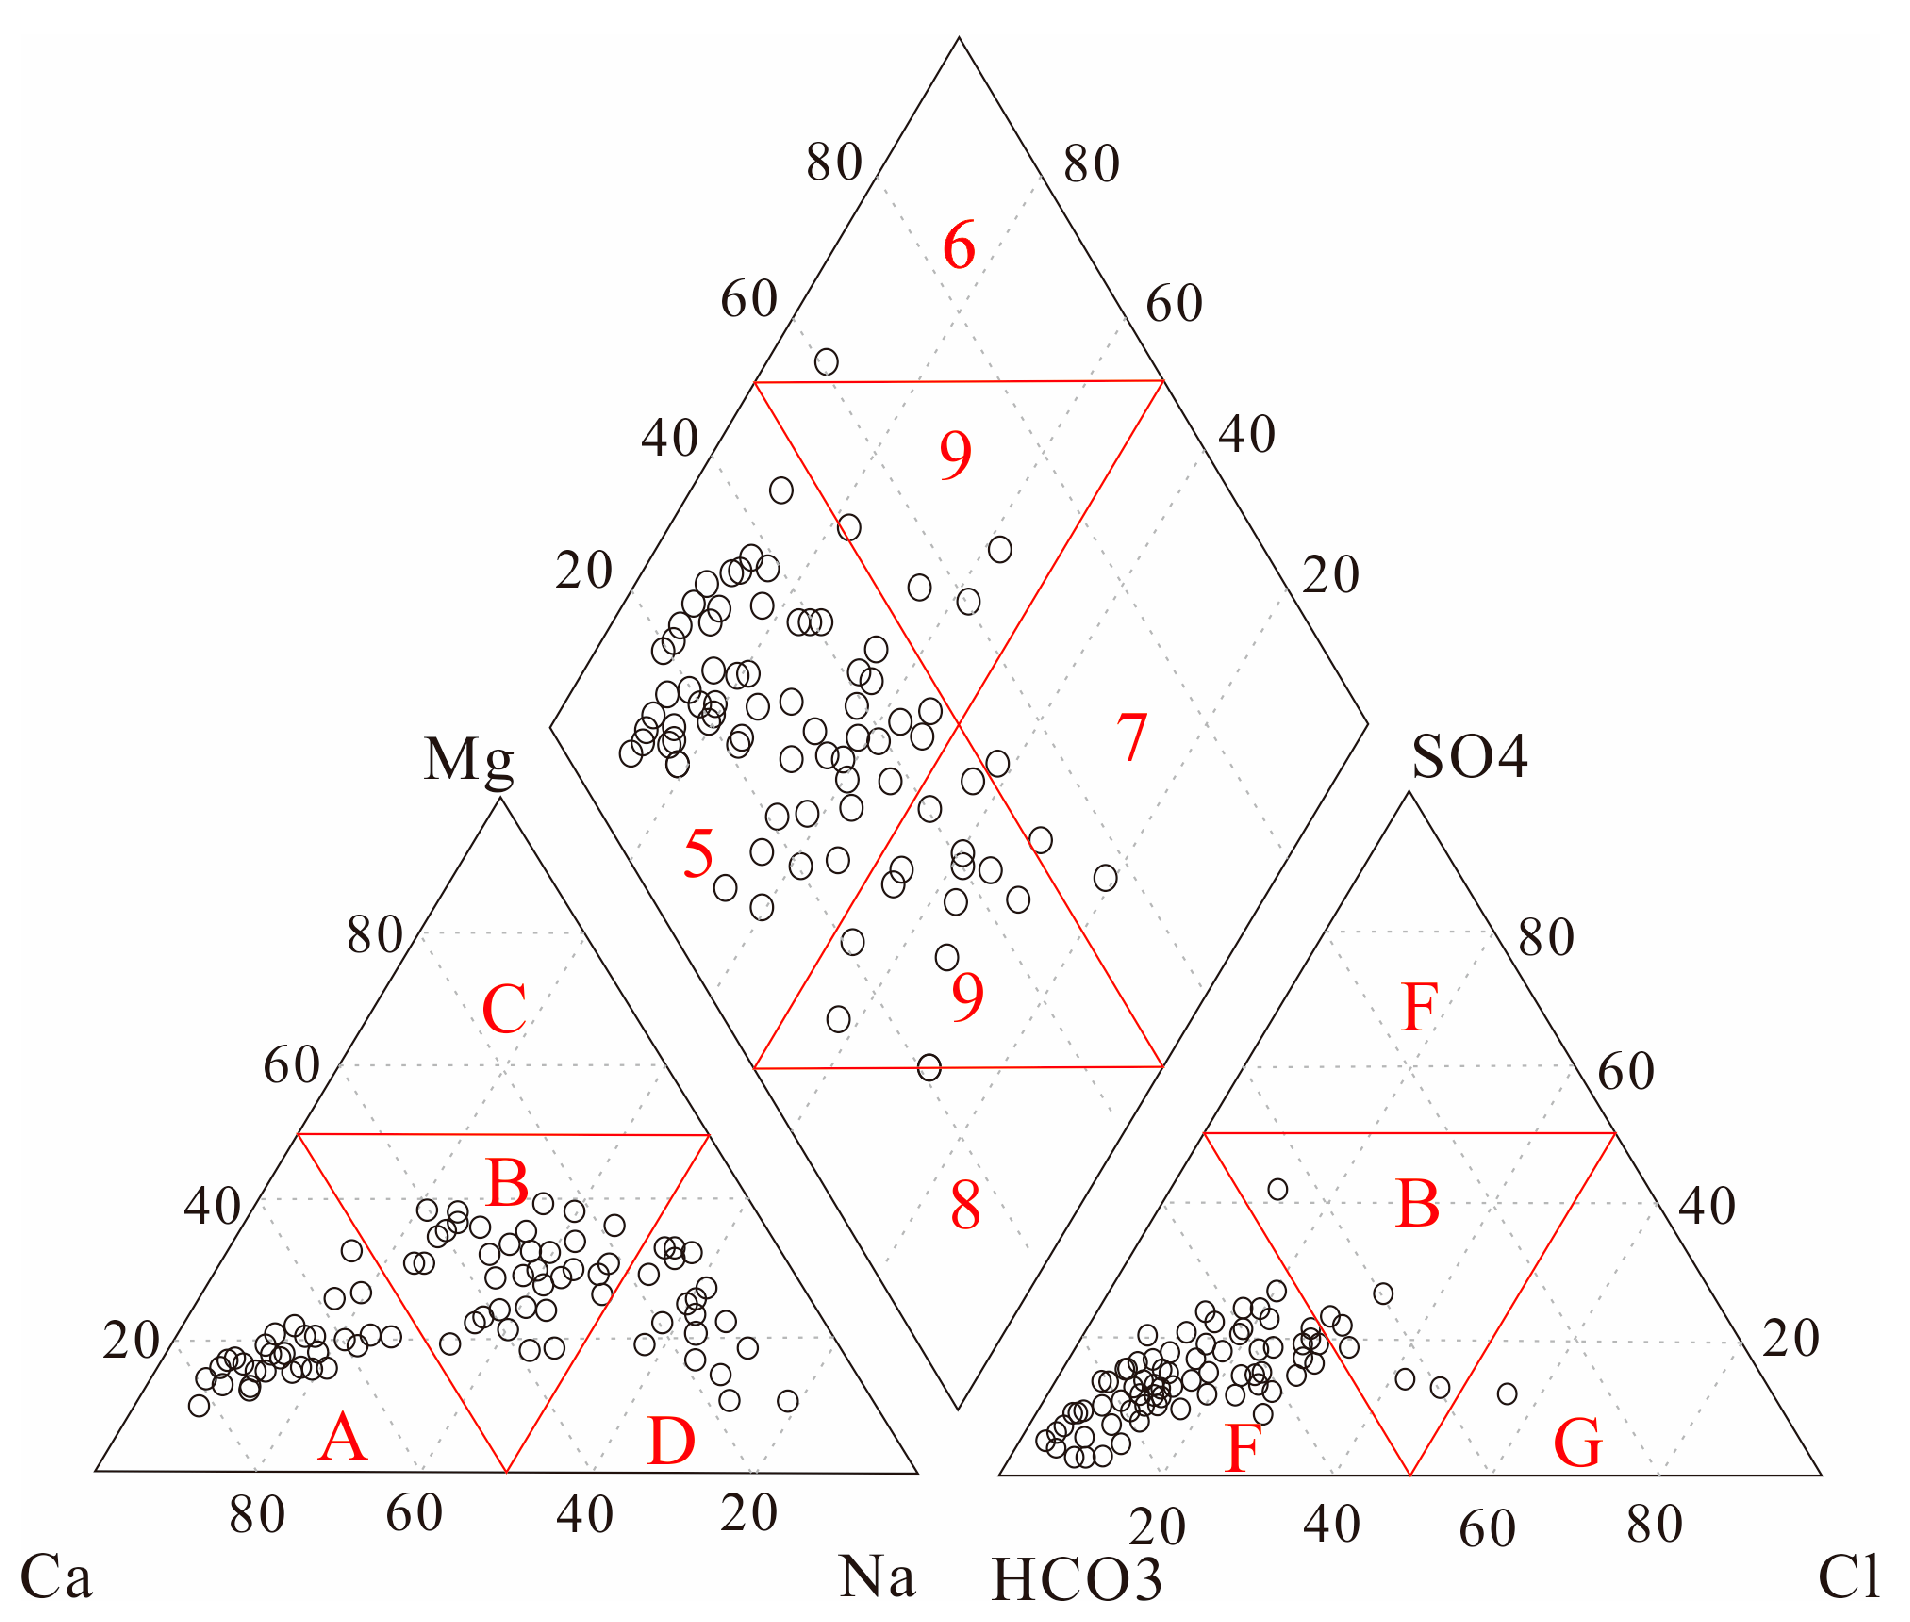
The Piper diagram has not been disturbed by human subjective factors [27], and the distribution of water samples is shown in the diagram. This is a common method for identifying the main ion composition of water chemistry [28,29]. Piper plots are made using the main ion data for groundwater in the study area (Figure 2). The cations from the water sample points are predominantly distributed in the three areas of A, B, and D in the graph. This indicates that the water chemical types in the study area are calcium-type, sodium-type, and calcium–sodium–magnesium mixed-type water, showing a change from calcium-type water to calcium-type water. This shows the key trends in terms of from calcate-form water to sodium-form water transition. The anions of the water sample points are predominantly distributed in Area E, indicating that the study area is dominated by bicarbonate water. Meanwhile, a small number of water sample points are distributed in Area B and Area G, representing mixed water and chlorine water, respectively. The five wells corresponding to the water sample points in Area B and Area G are shallow wells near Haolebaojinao Lake. The water chemical types are the Ca-HCO3, Ca-Mg-HCO3, Na-Ca-HCO3, Na-HCO3, and Na-Cl-HCO3 mixed types. The groundwater hydrochemistry has a pronounced transition in the distribution of cations, which is clearly divided into four regions from left to right. The anions are predominantly bicarbonate, but there is a small amount of mixed water. We plotted the four water chemistry types of the study area in a figure, including calcium-type water, calcium–magnesium type water, sodium–magnesium type water, and sodium-type water (Figure 3). The results show that the four hydrochemical types are distributed in banded strips from northeast to southwest, and calcium-type water regularly transitions to sodium-type water. We divided the water samples in the study area into four categories, namely, C1 calcium water, C2 calcium magnesium water, C3 sodium calcium water, and C4 sodium water. The four types correspond to three stages of the groundwater flow system, including recharge (C1 calcium-type water), runoff (C2 calcium magnesium type water and C3 sodium calcium-type water), and discharge (C4 sodium-type water).

4.2. Isotopes

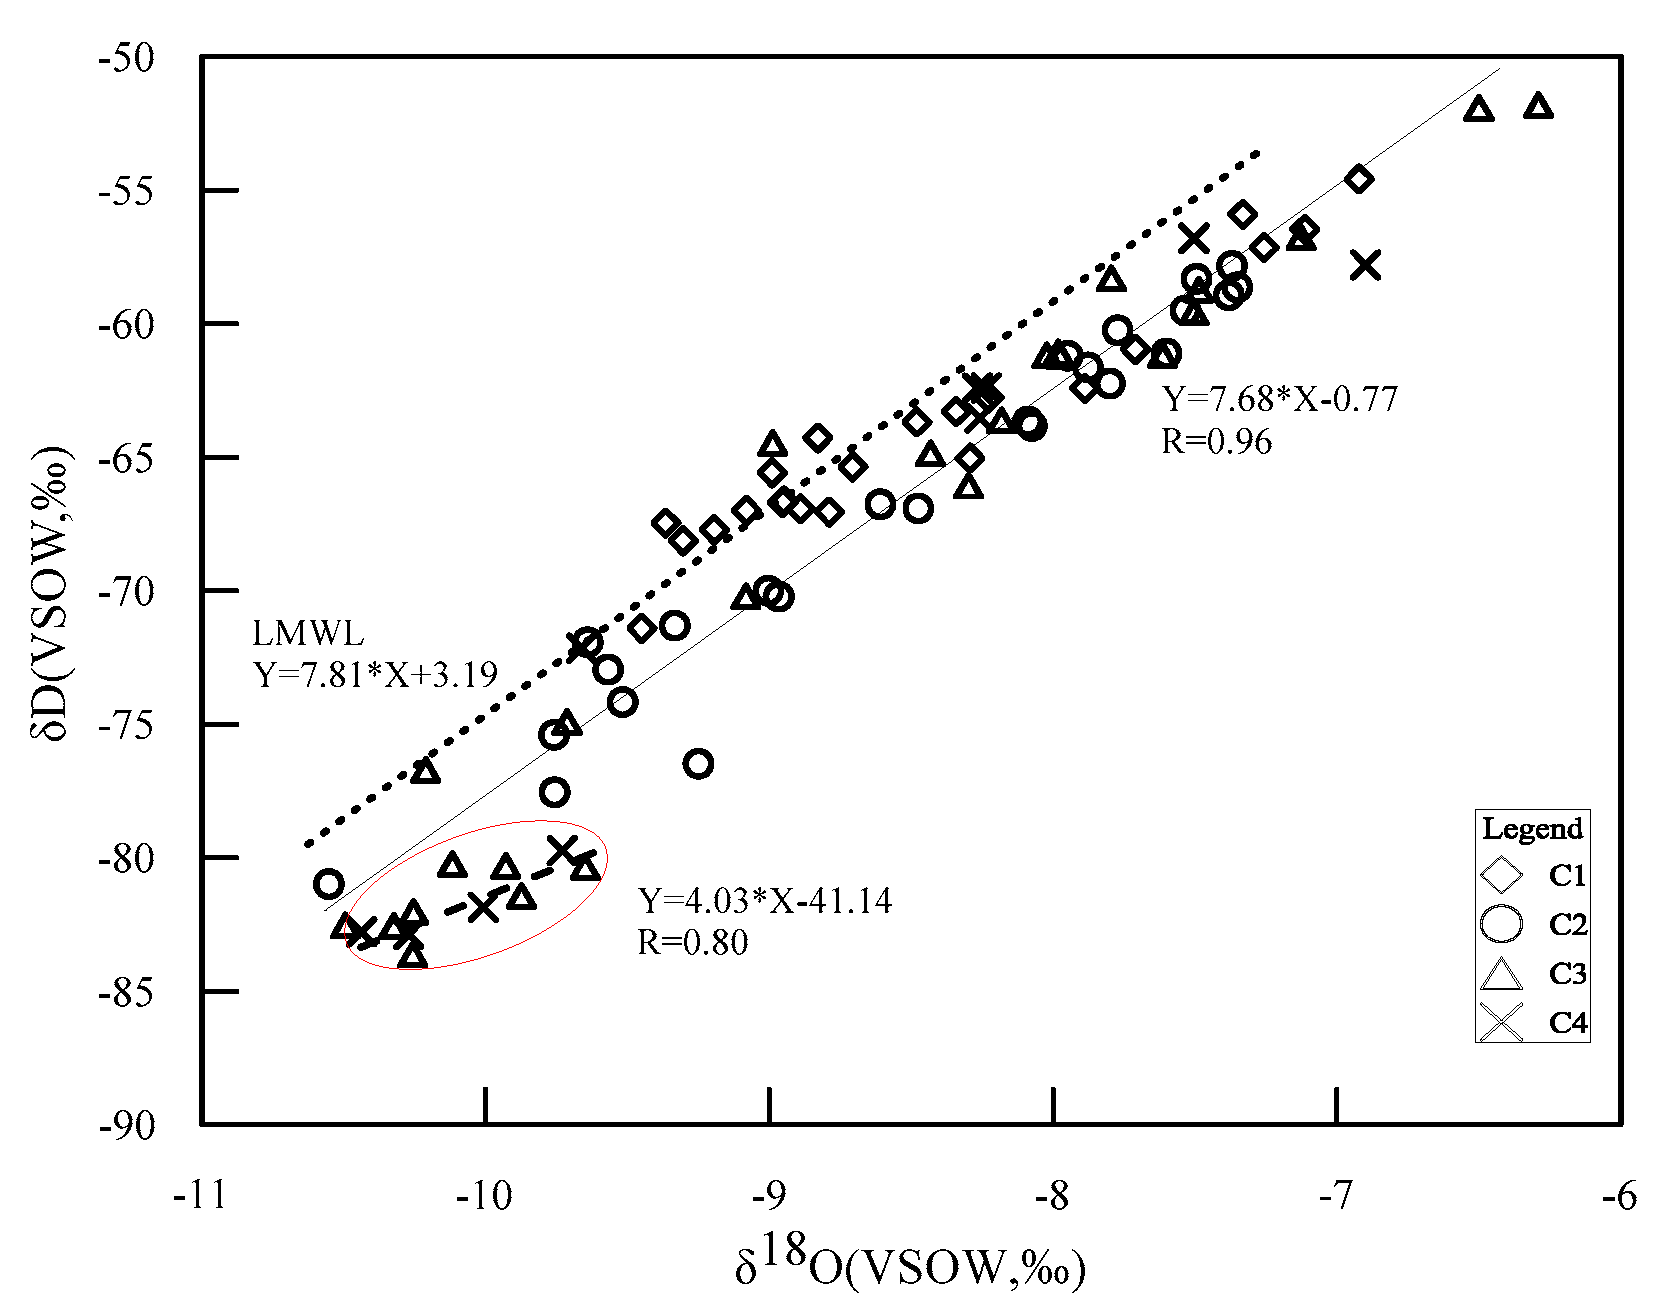
δD and δ18O in groundwater are predominantly determined by atmospheric processes and can be used as natural tracers for groundwater sources [30,31,32]. δD and δ18O in groundwater are controlled by local hydrometeorological factors, including the origin of the water vapor mass, re-evaporation during rainfall, and precipitation seasonality [29,33]. Yin et al. concluded that the local atmospheric precipitation line in the northern Ordos Basin is δD = 6.45δ18O − 6.51 with R2 = 0.87 [34]. Wang et al. obtained the local atmospheric precipitation line as δD = 7.81δ18O + 3.19 based on rainfall data from cities adjacent to the first-level watershed in the Ordos Basin [35]. Compared with the global precipitation line (GMWL), i.e., δD = 8δ18O + 10 defined by Craig [36], the LMWL is below the GMWL, indicating that there is secondary evaporation occurring during rainfall.
The analysis results of stable isotopes in the groundwater in the study area are shown in Figure 3. The scattered points of groundwater δ18O and δD are located at the lower right of the local atmospheric precipitation line, which is relatively close to the local atmospheric precipitation line. The equation fitted according to the hydrogen and oxygen isotopes of groundwater samples is δD = 7.68δ18O − 0.77 with a correlation coefficient of 0.92, which is close to parallel with the LMWL, i.e., δD = 7.81δ18O + 3.19. This indicates that groundwater is the source of modern local precipitation rather than the decline in paleoclimate conditions and is the result of water replenishment. The water sample points in the red circle in the Figure 4 show a pronounced deviation from the local atmospheric precipitation line, and δ18O in the water is enriched. The equation fitted by these scattered points is δD = 4.03δ18O − 41.14. The slope of the straight line is different, and it is also different from the local atmospheric precipitation line. This indicates that the water sample points in this area are replenished by local atmospheric precipitation and may also be replenished by water from other sources. The water sample points in the red circle in Figure 3 correspond to the deeper wells, which may be replenished by water sources other than atmospheric precipitation. The samples in the red circle can be analyzed as a separate research group, which is classified as C5 deep circulating groundwater.

5. Discussion

Water–rock interactions are the most important factor affecting hydrogeochemical processes [37,38]. The test results of hydrogeochemistry and isotopes are important data for studying the evolution mechanisms of hydrogeochemistry [39,40,41]. During groundwater flow, a series of reactions occur to the water and the surrounding environmental media, resulting in the spatial division of water samples [30,42,43]. The study of groundwater through hydrogeochemistry, isotopes, and zoning can clarify the formation mechanisms and evolution of groundwater hydrochemical characteristics.

5.1. Hydrogeochemical Processes

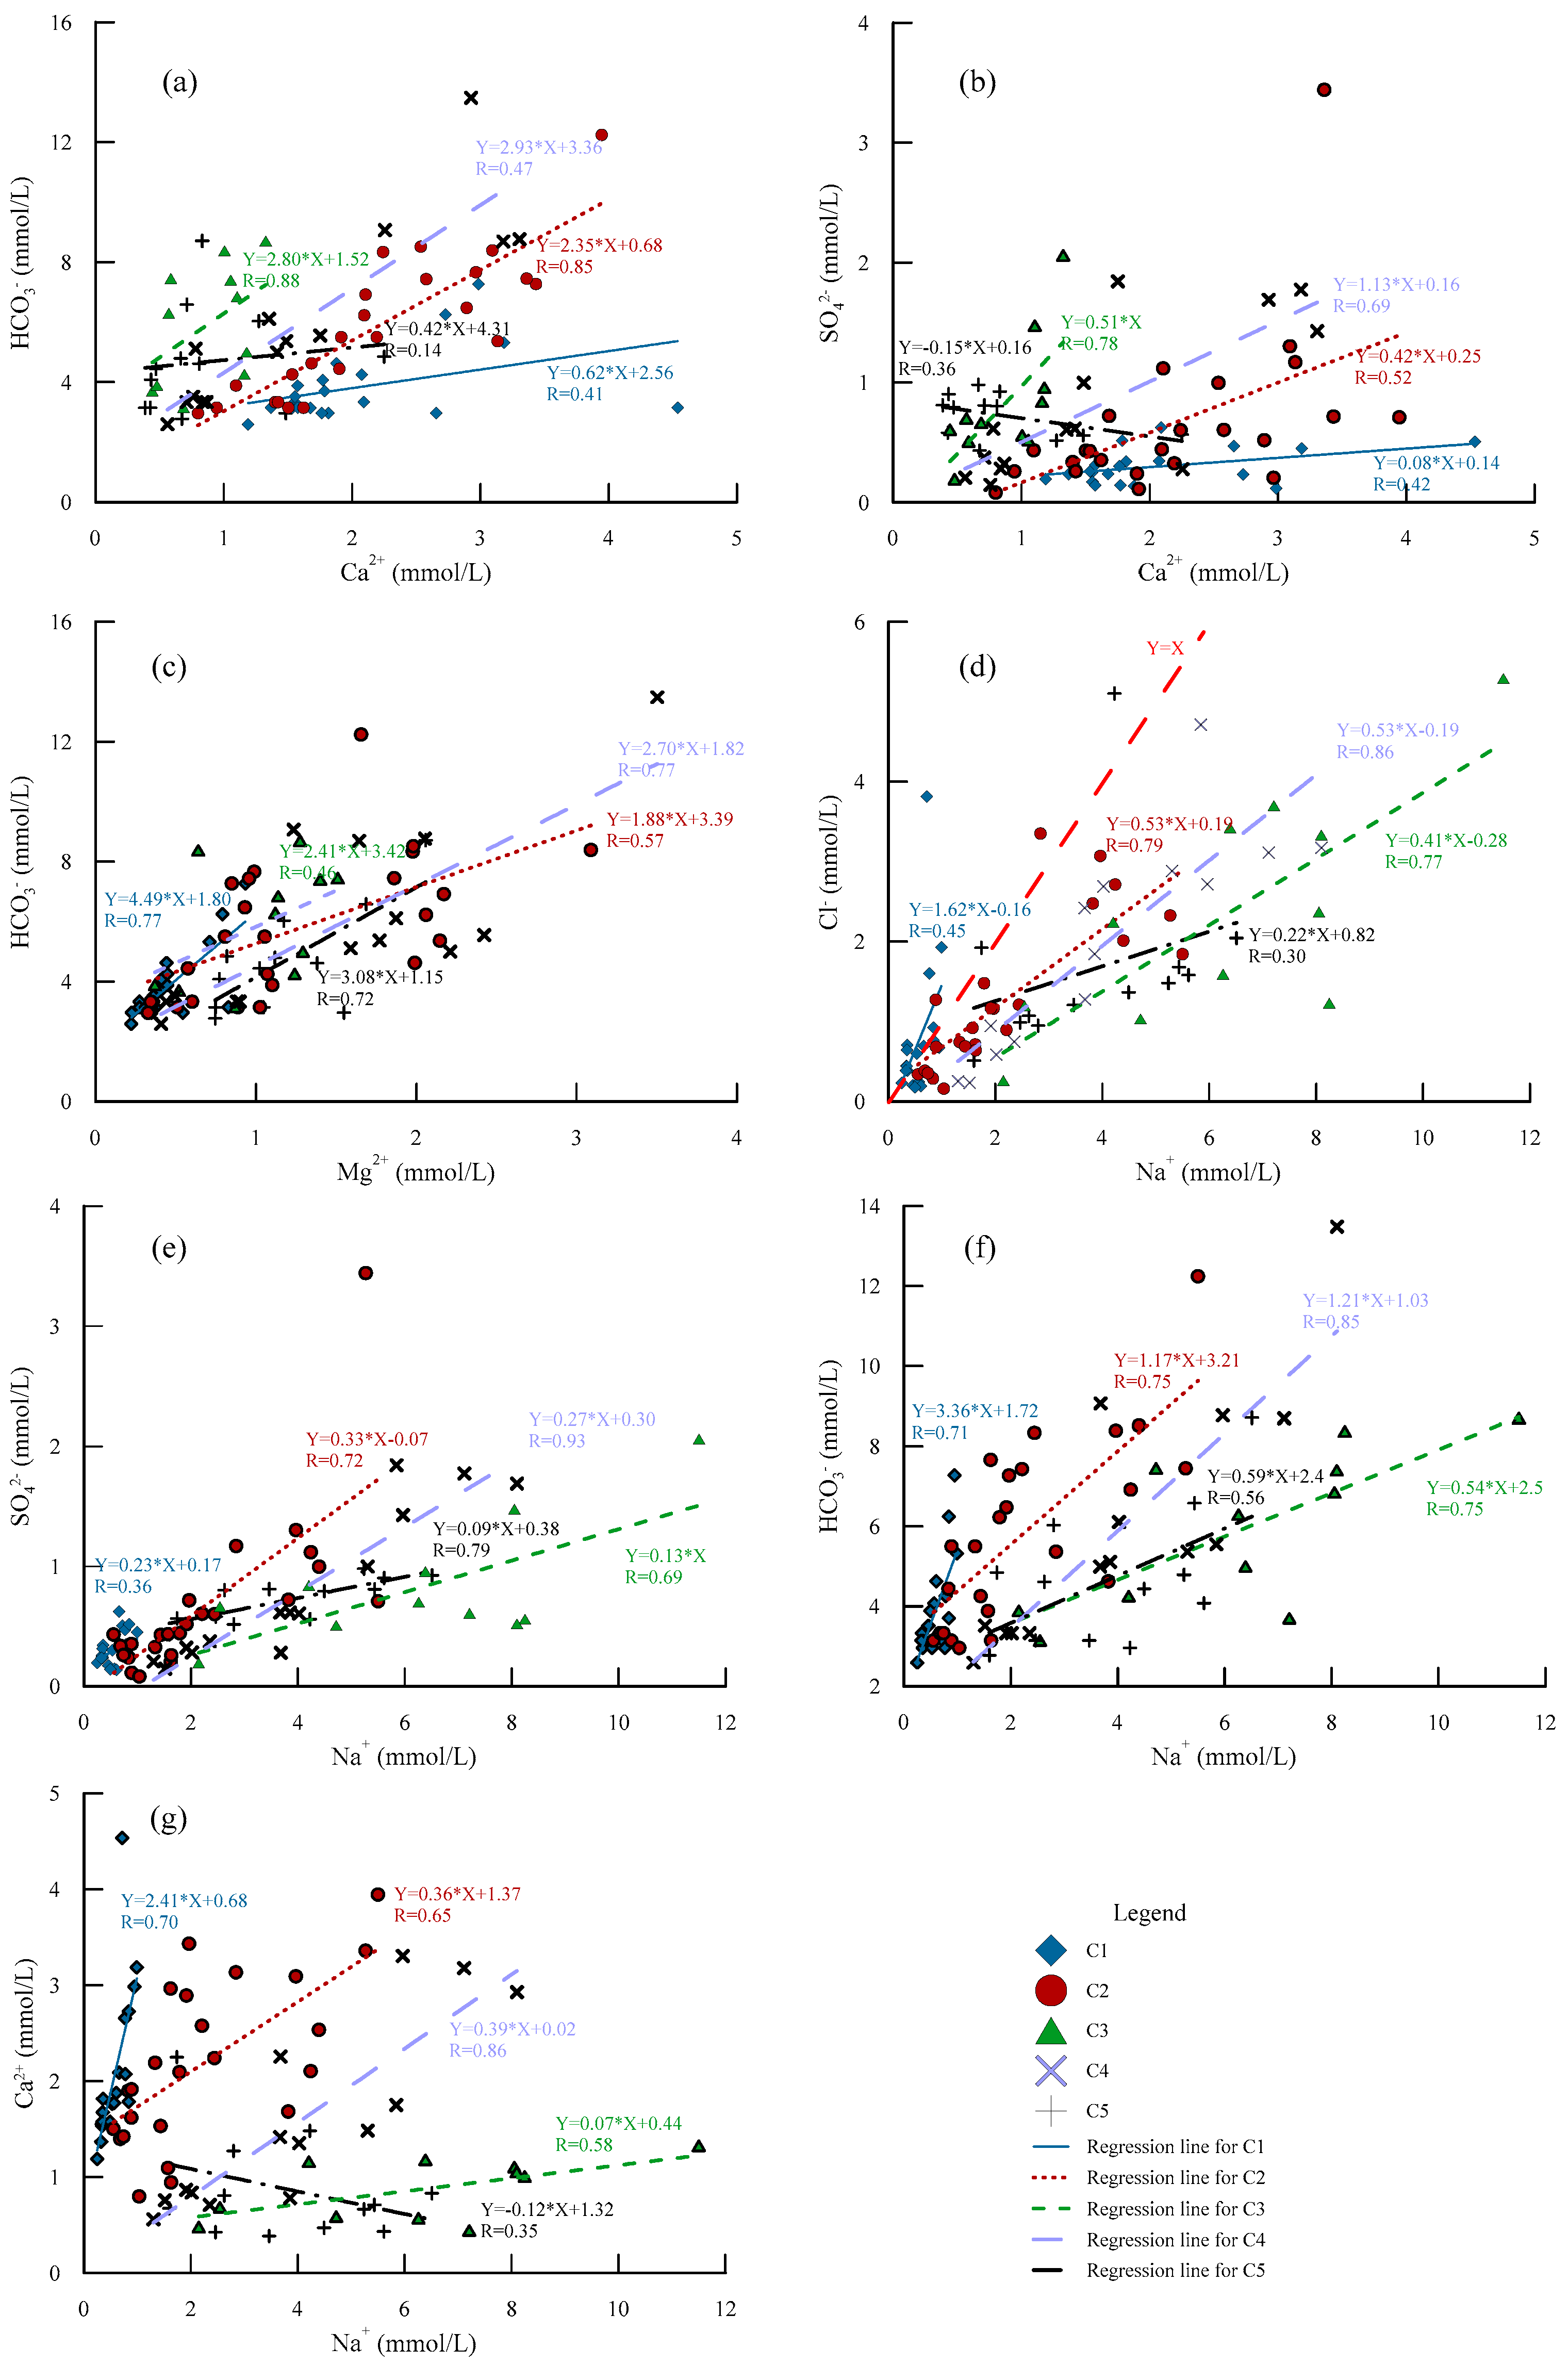
We plotted the scale relationship of the main ions (Figure 5) and obtained the correlation coefficients between different ions for each group of water samples. The scatter plot of Ca2+ and HCO3 (Figure 5a) shows that the two groups of groundwater samples C2 (R = 0.85) and C4 (R = 0.88) are strongly correlated. These two groups of water samples may have experienced weathering and dissolution of calcite, and this hydrogeochemical process can be expressed as R1. The scatter plots for Ca2+ and SO42− (Figure 5b) show that the groundwater samples for the C3 (R = 0.79) and C4 (R = 0.78) groups are well correlated. Weathering and dissolution of gypsum during the formation of groundwater in this group are highly important hydrogeochemical processes, and the expression of this reaction can be expressed as R2. In the groundwater survey report of the Ordos Basin, Hou also mentioned that there is gypsum in the strata in the area [44]. The scatter plot of Mg2+ and HCO3 (Figure 5c) shows that the three groups of groundwater samples C1 (R = 0.77), C4 (R = 0.77), and C5 (R = 0.72) are strongly correlated. The sample may have undergone dolomite dissolution, and the expression for this reaction is R3. The strong correlation of Mg2+ and HCO3 is reflected in the Dakepohu watershed in the Ordos Basin (41). The scatter plot for Na+ and HCO3 (Figure 5f) shows that C1 (R = 0.71), C2 (R = 0.75), C3 (R = 0.75), and C4 (R = 0.85) are well correlated, while the two groups of groundwater C1 (R = 0.85) (R = 0.7) and C4 (R = 0.86) are well correlated between Ca2+ and Na+ (Figure 5g). These two groundwater groups have experienced dissolution of calcite and cation exchange. That is, Ca2+ in groundwater exchanges the adsorbed Na+ in the rock formation. The correlation between Na+ and SO42− in groundwater groups C2 (R = 0.72), C4 (R = 0.93) and C5 (R = 0.79) is stronger (Figure 5e). This indicates that the dissolution of mirabilite may affect the distribution of chemical elements in the groundwater in the three groups. The dissolution reaction equation for mirabilite is shown in R4. The correlation between Na+ and SO42− in the Dakebo Lake watershed is also relatively strong [44,45]. Scatter plots for Na+ and Cl [38,46,47] are often used to explore salinity characteristics in arid–semiarid regions. The three groundwater groups C2 (R = 0.71), C3 (R = 0.73), and C4 (R = 0.86) have strong correlations in the scatter plots for Na+ and Cl (Figure 5d). Dissolution of salt rock may occur in the three groundwater groups and is expressed as Equation (R5).
CaCO3 + CO2 + H2O = Ca2+ + 2HCO3
CaSO4 = Ca2++ SO42−
CaMg(CO3)2 + 2CO2 + 2H2O = Ca2++ Mg2+ + 4HCO3
Na2SO4•10H2O = 2Na+ + SO42− + 10H2O
NaCl = Na++Cl
There is a strong correlation between Na+ and Cl, indicating that the dissolution of rock salt is likely the main source of Na+ and Cl. In theory, the ratio of Na+ and Cl contents obtained from the dissolution of rock salt should be 1:1, but most of the groundwater sampling points in this area are located in the lower right of the line y = x (Figure 5d). This means that the area of the Na+ content in the groundwater samples is greater than that of the Cl content. This is because Ca2+ and Mg2+ in the water exchange with Na+ adsorbed in the rock formation, and the content of Na+ in the water is more than that of Cl. The equation for this reaction is (R6).
Ca2+ (in water) + 2Na+ (clay bound) = 2 Na+ (in water) + Ca2+ (clay bound)
If the ions are only controlled by the dissolution of gypsum and carbonate rocks, (SO42− + HCO3) and (Ca2+ + Mg2+) are equal. The (SO42− + HCO3) and (Ca2+ + Mg2+) ion proportional relationship should be located at the 1:1 line in the scatter plot (Figure 6). If y = x, the curve represents the dissolution line of carbonatite and gypsum. The water sample points in Figure 6 tend to be distributed downward, and almost all the points fall into the area with a relatively high content of (SO42− + HCO3). This indicates that pronounced cation exchange has occurred in this area [10,48], that is, the ion exchange of Ca2+ + Mg2+ dissolved in water and Na+ is adsorbed by clay.
Chloro-alkaline indices (CAI) can be used to characterize the strength of ion exchange during the chemical evolution of groundwater [49,50,51,52], with the expressions (R7) and (R8). If the index is negative, it means that Ca2+ or Mg2+ in groundwater is ion-exchanged with Na+ in the aqueous medium. If the ratio is positive, it means that Na+ in groundwater is ion-exchanged with Ca2+ or Mg2+ in the aqueous medium. The magnitude of the absolute value of the chlor-alkali index can also characterize the strength of the ion exchange.
CAI - 1 = Cl ( Na + + K + ) Cl
CAI - 2 = Cl Na + + K + SO 4 2 + HCO 3 + CO 3 2 + NO 3
Figure 7 shows the changes in the CAI-1 and CAI-2 indices for the five groups of water sampling points. From the perspective of the CAI-1 index (Figure 7a), except for some points of the C1 and C2 indices being greater than 0, the remainder of the water sample points are less than 0. Some points of the C1 and C2 are ion exchange between Ca2+ or Mg2+ in the aqueous medium and Na+ in the groundwater, and most of the points are ion exchange between Na+ in the aqueous medium and Ca2+ or Mg2+ in the groundwater.
CAI-2 follows the same pattern (Figure 7b). According to the average values of CAI-1 and CAI-2 of the five groups of water sampling points, for CAI-1, the absolute value of this index gradually increases from the C1 to C3 groups, showing the increase degree of ion exchange in groundwater from the C1 to C3 groups. However, CAI-1 of the C4 and C5 samples are slightly lower than that of the C3 group, and the degree of ion exchange was weakened. From the CAI-2 index, only the C1 group groundwater has a positive value, indicating that Na+ in the groundwater in this area undergoes ion exchange with Ca2+ or Mg2+ in the aqueous medium. The C4 group groundwater has the largest absolute value of CAI-2. The ion exchange between Ca2+ or Mg2+ in the groundwater and Na+ in the aqueous medium is the most intense for the C4 groundwater samples.
The scatter plot of the chlor-alkali index, (SO42− + HCO3) and (Ca2+ + Mg2+) ion proportions, and the correlation between Na+ and Cl indicate that cation exchange is one of the main contributors to the increase in the Na+ concentration in groundwater. This is an important geochemical process in the groundwater in the Haolebaojinao Basin.

5.2. Formation Mechanisms of the Water Chemistry

The saturation index is a parameter that determines the saturation state of water and a certain mineral and is often represented by the symbol “SI”.
SI = IAP/K or SI = lg (IAP/K)
IAP represents the ionic activity product, and K represents the equilibrium constant in the formula.
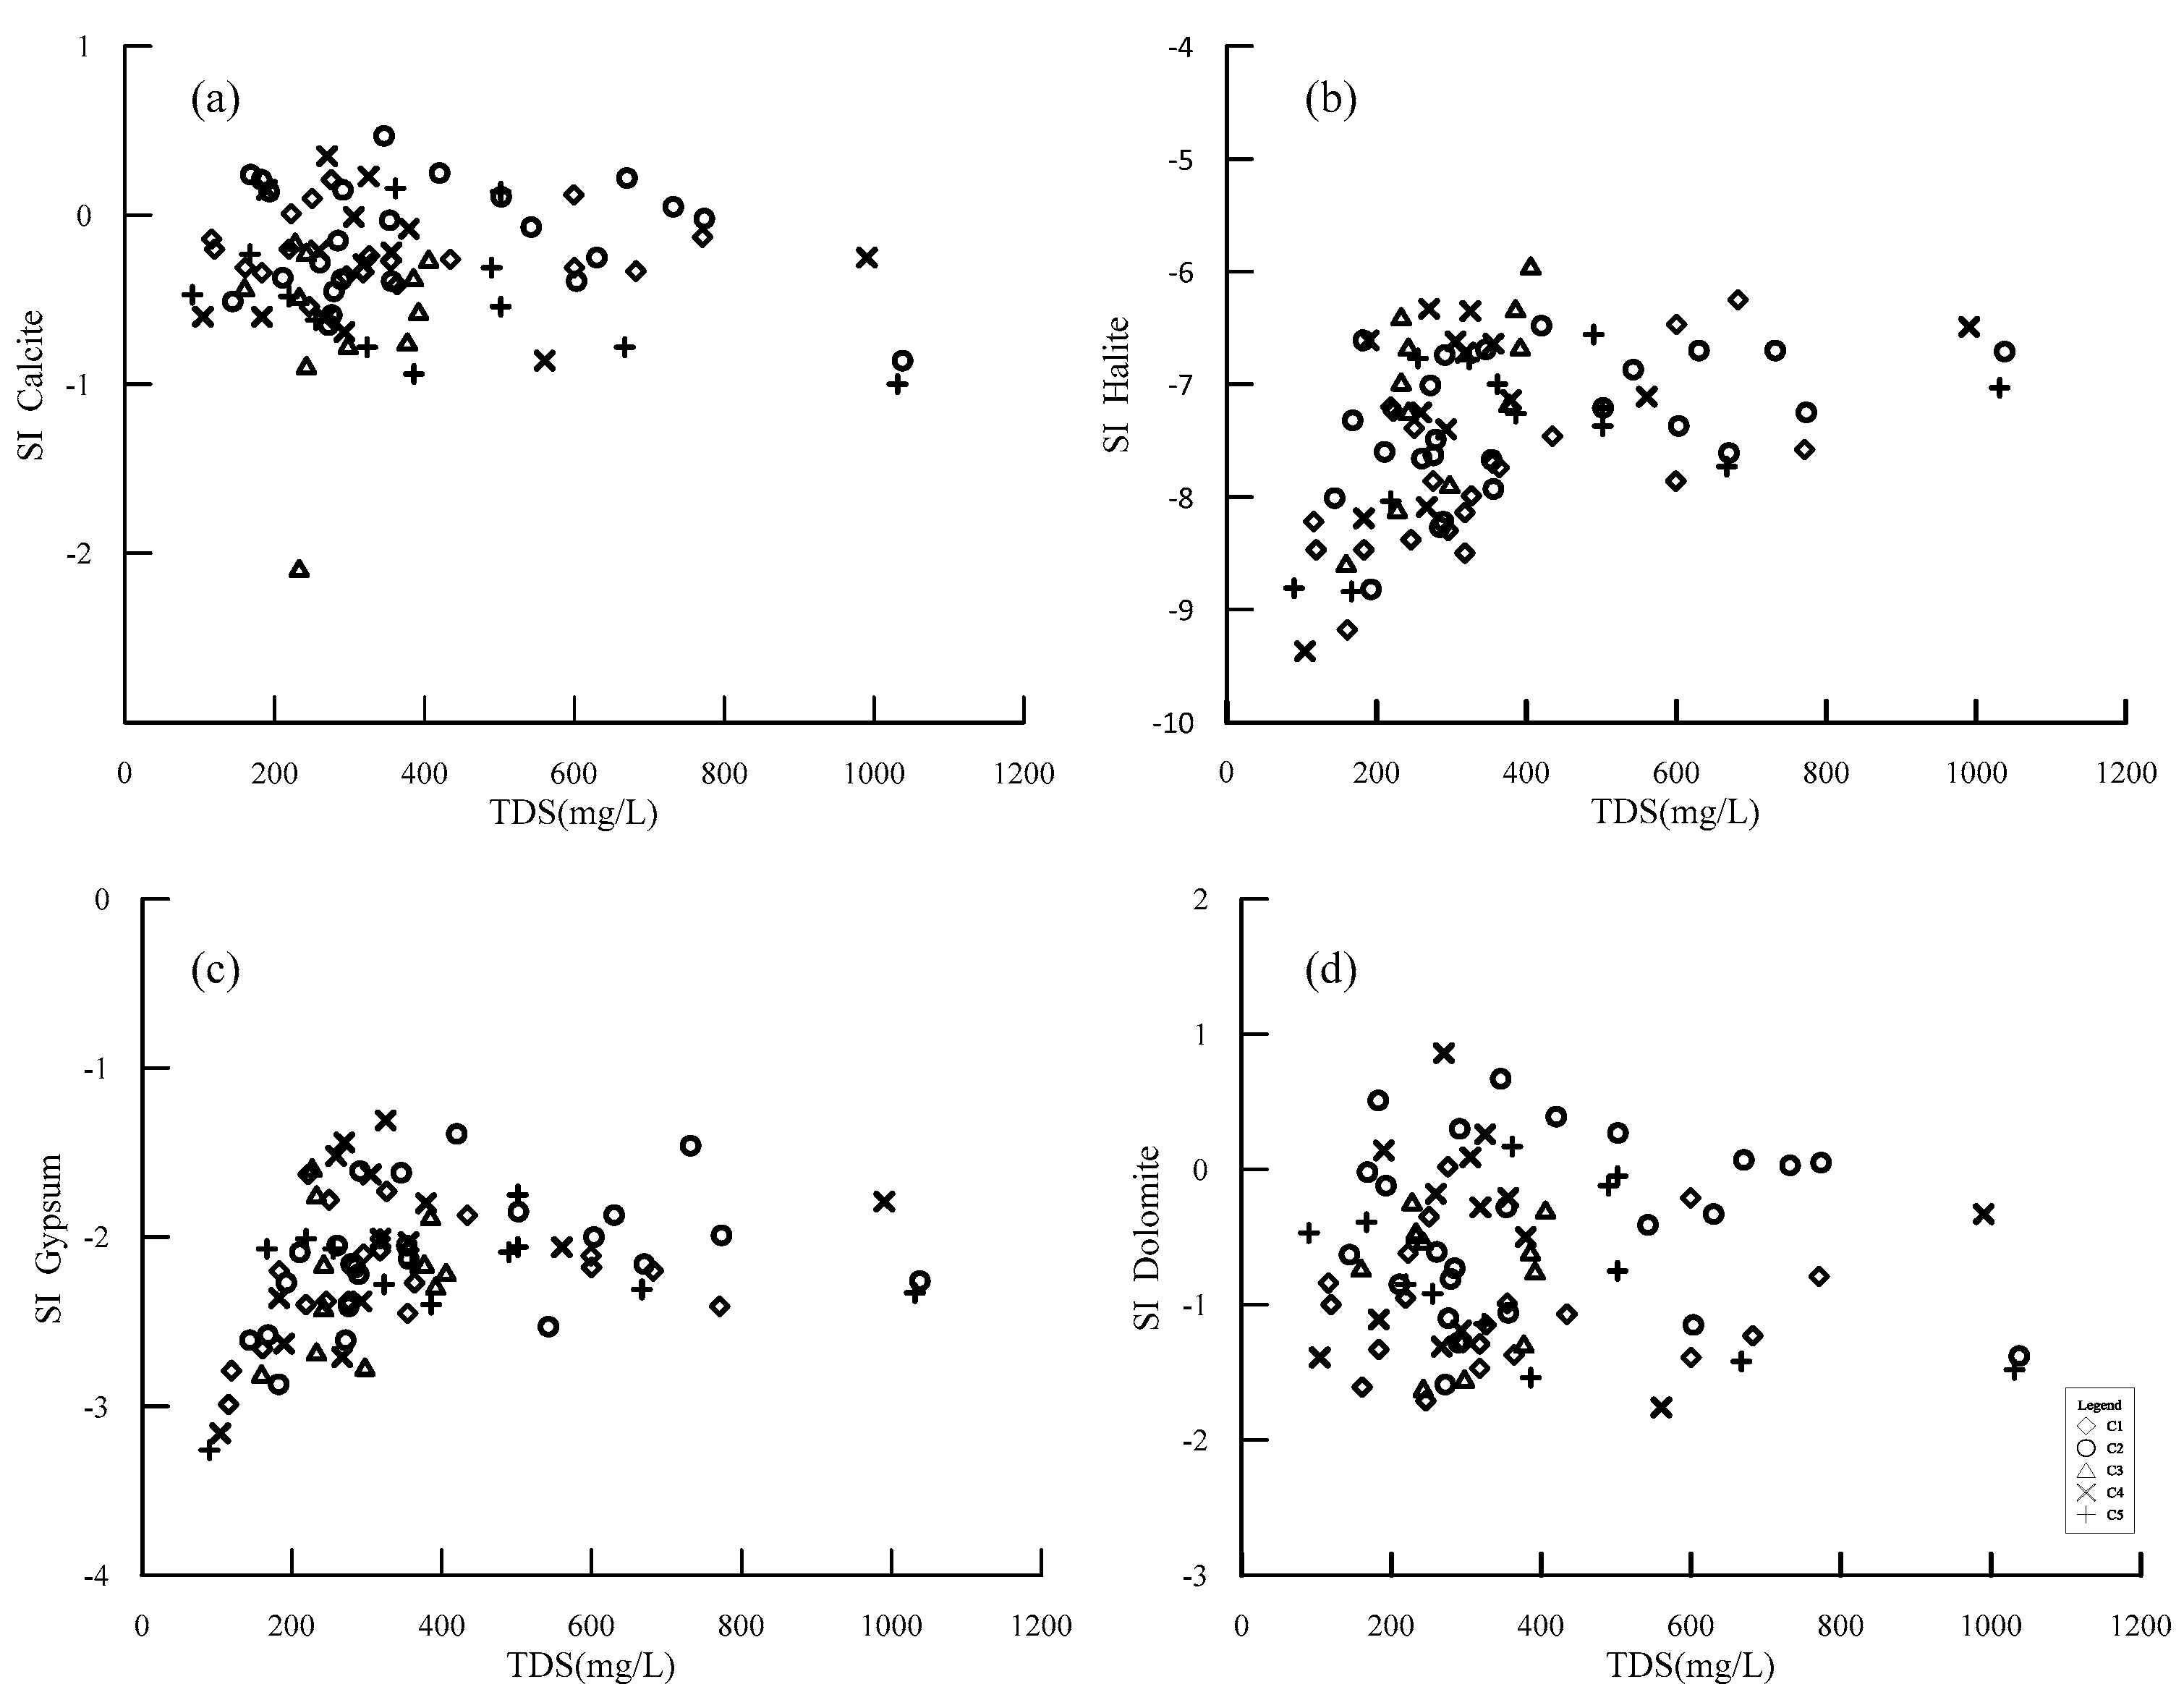
Positive values of SI indicate supersaturation, and negative values indicate undersaturation. When the groundwater is saturated with certain minerals, the SI equals zero [53,54,55,56]. We calculated the saturation index for the water samples from the Haolebaojinao watershed, observed the variation trend for each saturation index with the change in TDS, and plotted the result in Figure 8. The saturation indices of rock salt and gypsum are less than 0, indicating that the rock salt and gypsum in this area are in an unsaturated state and continue to dissolve during the hydrochemical reaction. For calcite and dolomite, only some points of C3, C4, and C5 are greater than 0, and most of the remaining points are less than 0. Only the groundwater samples in some areas of C3, C4, and C5 are saturated, and the remaining water sample points are still in a state of saturation in a dissolved state. When the TDS of rock salt and gypsum is less than 400 mg/L, the SI increases with increasing the TDS, and when the TDS is greater than 400 mg/L, the SI no longer increases with the continuous increase in the TDS. This change indicates that when the TDS is less than 400 mg/L, the dissolution of rock salt and gypsum has a significant contribution to the increase in the TDS. The dissolution of rock salt and gypsum leads to an increase in the TDS, and when it is greater than 400 mg/L, there is a dissolution of rock salt and gypsum, and there is no significant contribution to the increase in the TDS.
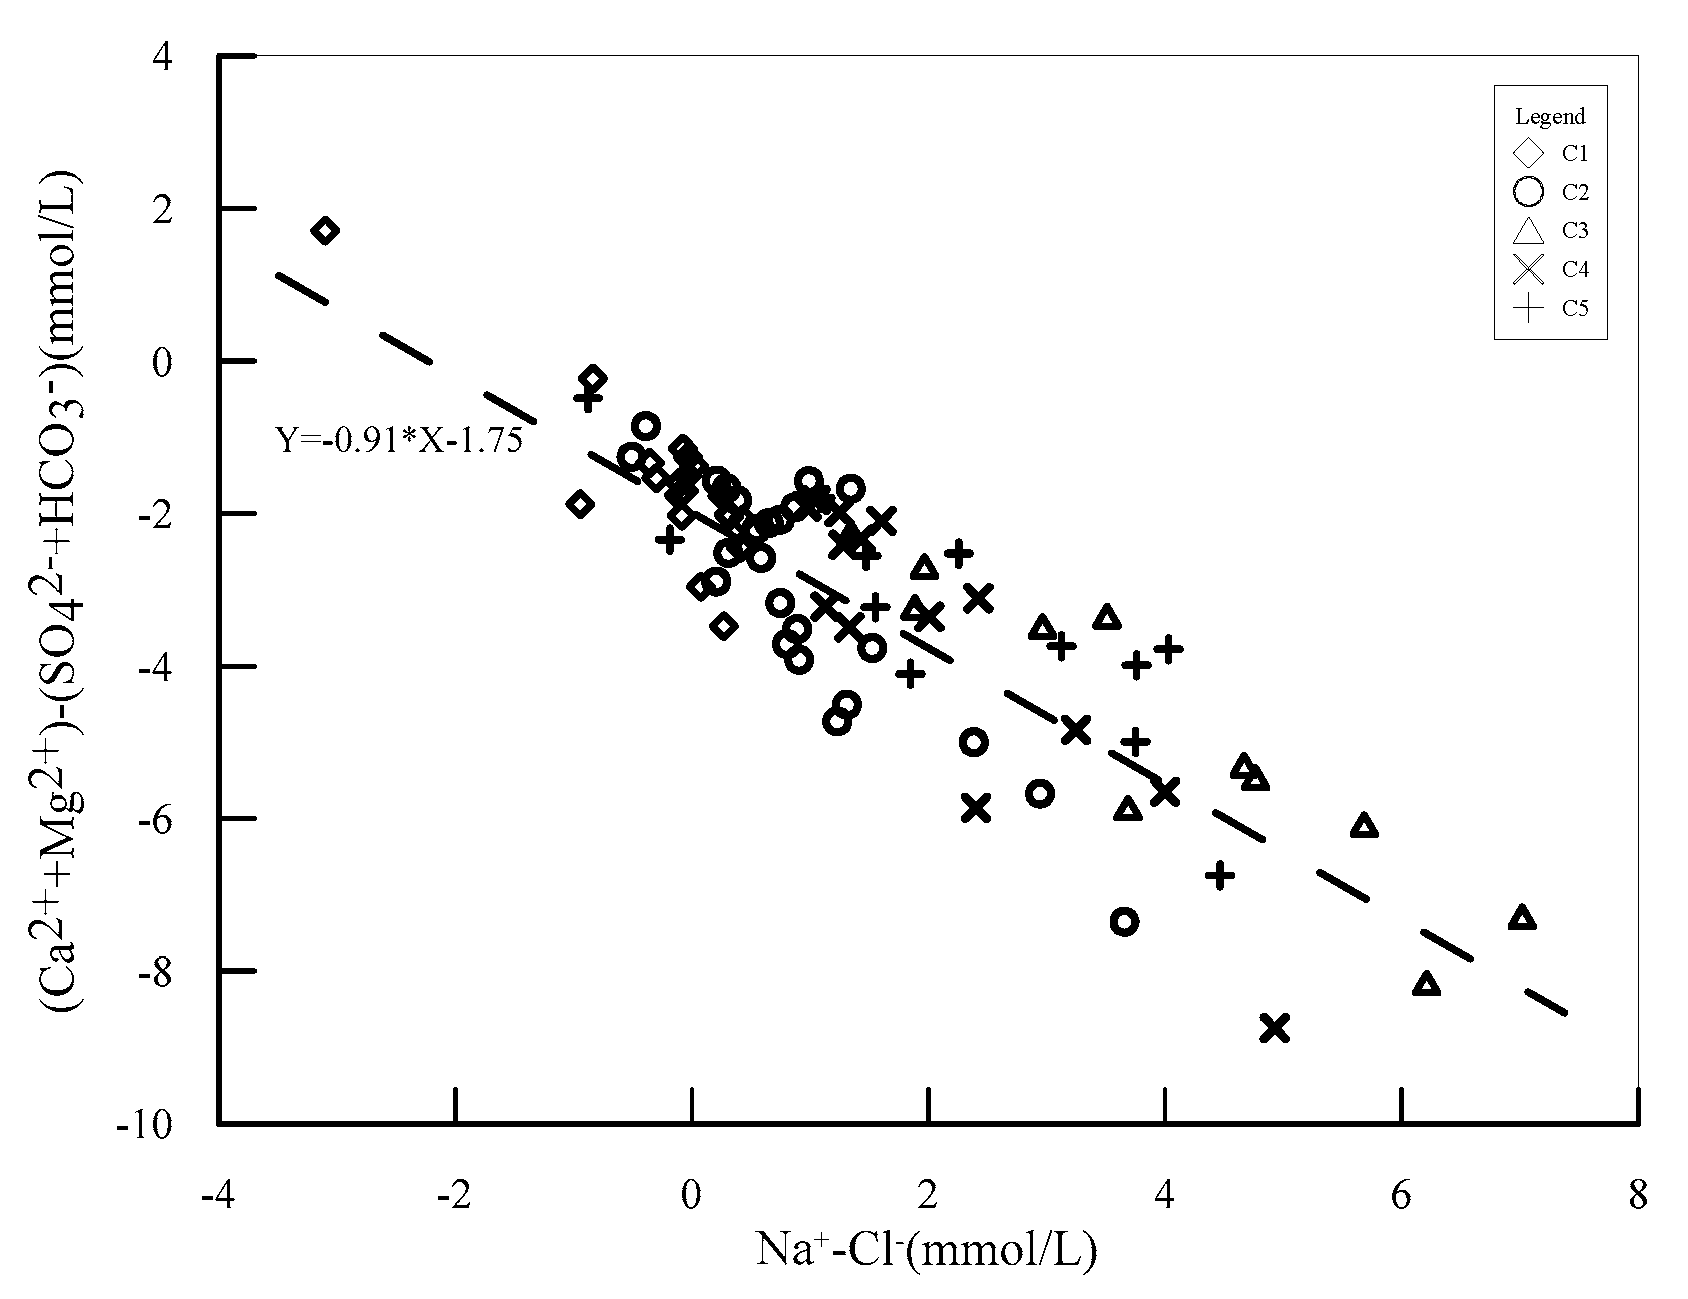
The ionic scale coefficients of (Na+ − Cl) and ((Ca2+ + Mg2+) − (SO42− + HCO3)) can be used to characterize water–rock interactions. If the ratio is −1, this means that the water chemistry in the study area is dominated by silicate dissolution and ion exchange [57,58]. Figure 9 is a scatter plot showing the relationship between (Na+ − Cl) and ((Ca2+ + Mg2+) − (SO42− + HCO3)). The equation formed by all the points is y = −0.91x − 1.75, and the slope is −0.91, which is relatively close to the ideal value of −1. This indicates that silicate dissolution and ion exchange control and affect the type of water chemistry in the study area.
Gibbs [59] divided the chemical effects of groundwater into three categories by comparing the relationship between Na+/(Ca2+ + Na+) and TDS and between Cl/(Cl + HCO3) and TDS: “evaporation control type”, “water–rock interaction type”, and “precipitation control type”. Many researchers have used the Gibbs diagram to study sources of water chemical components and to analyze the formation mechanisms of water chemistry [35,60,61,62,63]. We drew the Gibbs diagram for the study area (Figure 10) and analyzed the main controlling factors of the groundwater hydrochemical composition in the Haolebaojinao Basin. The formation of regional hydrochemical types is predominantly controlled by water–rock interactions. The ratio of Na+/(Na+ + Ca2+) in C1 and some C2 samples is less than 0.5, and rock weathering is the main mechanism controlling the chemical composition of groundwater in the C1 and C2 groups. The ratios of Na+/(Na+ + Ca2+) in some C2, C3, C4, and C5 samples were greater than 0.5. This indicates that these three groups of groundwater were controlled by rock weathering and evaporation crystallization processes. The Na+/(Na+ + Ca2+) ratio of the C1 to C4 samples changed from small to large, and the TDS showed relatively little change. This shows that cation exchange has also played a role in increasing Na+ and reducing Ca2+ under the background of rock dominance. During the cation exchange process, the weight of the displaced sodium ions was close to the weight of the adsorbed calcium ions, and the TDS value did not change considerably.
The average values for hydrogen and oxygen stable isotopes in the groundwater samples of the C5 group are δ18O: −10.2‰ and δD: −82‰, which are deficient compared with those of the other four groups. This may be due to the C5 group groundwater potentially having been recharged in cold climates along with evaporation. It is likely that the recharge time of groundwater in this group is earlier than that of the other four groups because the depths of the wells are all greater than 120 m. In contrast, depletion of heavy isotopes in deep groundwater relative to shallow groundwater occurred in the Harbor Lake Basin, which is located in the recharge zone [50]. The δ18O and δD values of groundwater in groups C1 to C4 are relatively close to the local atmospheric precipitation line. This indicates that the groundwater is predominantly derived from modern atmospheric precipitation.
The first two main factors of the groundwater samples in groups C1 and C2 control the formation process for groundwater according to the factor analysis results of each group (Table 2). The strong correlations with factor F1 are Na+, Ca2+, Mg2+, SO42−, and Cl, and they are all positively correlated. This shows that dissolution of gypsum, mirabilite, and rock salt occurred, and cation exchange occurred at the same time. Factor F2 was positively correlated with δ18O and δD, indicating that the source of groundwater affected the water chemistry type. The pH in the C2 group was negatively correlated, likely due to the precipitation of some minerals by pH. For the groundwater of the C3 group, factor F1 is positively correlated with Na+, Mg2+, SO42−, and Cl, indicating that the dissolution of carbonate, mirabilite, and rock salt may have occurred. Factor F2 is positively correlated with δ18O and δD likely due to the source of groundwater affected the water chemistry type. The contributions of the three factors to groundwater in the C4 group are relatively similar. Factor F1 is positively correlated with Ca2+, Mg2+, and HCO3, indicating that the dissolution of carbonates such as calcite and dolomite occurred. Factor F2 indicates that the dissolution of rock salt and gypsum and ion exchange affect the chemical characteristics of groundwater. The F3 factor has a positive correlation with δ18O and δD and a negative correlation with pH. This indicates that water sources affect the chemical composition of groundwater, and some minerals may precipitate due to pH. There is little difference in the contribution of the three groundwater factors in group C5. Factor F1 may have dissolved carbonate and mirabilite. δ18O and δD are positively correlated with F2, indicating that the source of water is an important factor affecting the composition of groundwater. Factor F3 is positively correlated with Ca2+ and Cl, likely due to the dissolution of calcite and rock salt, accompanied by cation exchange.

6. Conclusions

The groundwater in the study area was divided into four categories, namely, C1 calcium water, C2 calcium magnesium water, C3 sodium calcium water, and C4 sodium water. The four types of water correspond to the three stages of the flow system, including recharge, runoff, and discharge. The relationship between δD and δ18O shows that the groundwater in the study area is mainly recharged by modern atmospheric precipitation. The isotope deficit of deep wells is high, and this component of the groundwater is assigned to the C5 group because it is derived from different sources.
It is inferred through the ion proportional relationship diagram and factor analysis that the recharge area predominantly experienced the dissolution of calcite, dolomite, gypsum, and rock salt. The dissolution of calcite and gypsum made a higher contribution to the runoff area. The discharge area mainly experienced the dissolution of dolomite, mirabilite, and halite. Calculation of the saturation index shows that, except for some of the groundwater samples in the discharge area and recharge area, calcite and dolomite are in a dissolved state, and rock salt and gypsum are in an unsaturated state. When TDS is less than 400 mg/L, rock salt and gypsum dissolution contributes to TDS. When TDS is greater than 400 mg/L, rock salt and gypsum dissolution does not contribute to the increase in TDS.
The Gibbs plot showed that all the water samples were influenced by water–rock interactions. Groundwater group C1 and part of group C2 are only controlled by water–rock interactions, and groundwater in other groups is controlled not only by rock weathering but also by evaporative crystallization processes, accompanied by ion exchange. The ion-pair scatter plot of Na+ and Cl and the chlor-alkali index show that cation exchange is one of the main hydrogeochemical processes in the study area. The intensity of ion exchange gradually increases from the recharge area to the discharge area. The Na+ ions in the water exchange with the Ca2+ and Mg2+ ions in the aqueous medium in the recharge area. The Ca2+ and Mg2+ ions in the water and the Na+ ions in the aqueous medium exchange in the runoff and discharge areas. The intensity of ion exchange is highest in the excretion zone.
More accurate chemical information on groundwater was obtained by studying the chemical evolution of groundwater in the Haolebaojinao watershed. This has further improved our understanding of the geochemical evolution of the groundwater system in intensive groundwater exploitation watershed of the Ordos Basin. This provides decision-makers with important information on the water quality status and groundwater geochemical evolution of the Haolebaojinao Basin. The research method can be used to provide a key reference for other similar intensive groundwater exploitation watersheds for undertaking relevant research. In addition, how the intensive groundwater exploitation changed the hydrogeochemical evolution process and related environmental problems in the Haolebaojibao Basin will be investigated in the further work.

Author Contributions

B.Z., J.W. and R.Z. wrote the manuscript. B.Z. and L.W. designed the research. B.Z. and P.-F.H. process the data. B.Z., R.Z. and J.W. contributed to theoretical interpretation of the results. J.W., L.W. and R.Z. supervised the project. All authors have read and agreed to the published version of the manuscript.

Funding

The authors gratefully acknowledge the Institute of Geophysical and Geochemical Exploration, Chinese Academy of Geological Sciences (AS2020Y04) for financial support.

Institutional Review Board Statement

Not applicable.

Informed Consent Statement

Not applicable.

Data Availability Statement

The data that support the findings of this study are available within the article.

Acknowledgments

The authors gratefully acknowledge Dongmei Han and Peiyue Li for their guidance and revision of the paper.

Conflicts of Interest

The authors declare no conflict of interest.

References

  1. He, S.; Li, P.; Su, F.; Wang, D.; Ren, X. Identification and apportionment of shallow groundwater nitrate pollution in Weining Plain, northwest China, using hydrochemical indices, nitrate stable isotopes, and the new Bayesian stable isotope mixing model (MixSIAR). Environ. Pollut. 2022, 298, 118852. [Google Scholar] [CrossRef] [PubMed]
  2. Xu, F.; Li, P.; Chen, W.; He, S.; Li, F.; Mu, D.; Elumalai, V. Impacts of land use/land cover patterns on groundwater quality in the Guanzhong Basin of northwest China. Geocarto. Int. 2022, 37, 1–17. [Google Scholar] [CrossRef]
  3. Liu, F.; Song, X.; Yang, L.; Han, D.; Zhang, Y.; Ma, Y.; Bu, H. The role of anthropogenic and natural factors in shaping the geochemical evolution of groundwater in the Subei Lake basin, Ordos energy base, Northwestern China. Sci. Total Environ. 2015, 538, 327–340. [Google Scholar] [CrossRef]
  4. Nakamura, T.; Nishida, K.; Kazama, F. Influence of a dual monsoon system and two sources of groundwater recharge on Kofu basin alluvial fans, Japan. Hydrol. Res. 2017, 48, 1071–1087. [Google Scholar] [CrossRef]
  5. Chen, J.; Qian, H.; Gao, Y.Y.; Wang, H.; Zhang, M. Insights into hydrological and hydrochemical processes in response to water replenishment for lakes in arid regions. J. Hydrol. 2020, 581, 124386. [Google Scholar] [CrossRef]
  6. Kamal, S.; Sefiani, S.; Laftouhi, N.; El Mandour, A.; Moustadraf, J.; Elgettafi, M.; Himi, M.; Casas, A. Hydrochemical and isotopic assessment for characterizing groundwater quality and recharge processes under a semi arid area: Case of the Haouz plain aquifer (Central Morocco). J. Afr. Earth Sci. 2021, 174, 104077. [Google Scholar] [CrossRef]
  7. Zhang, H.; Yu, J.; Wang, P.; Wang, T.; Li, Y. Groundwater-fed oasis in arid Northwest China: Insights into hydrological and hydrochemical processes. J. Hydrol. 2021, 597, 123154. [Google Scholar] [CrossRef]
  8. Wang, D.; Li, P.; He, X.; He, S. Exploring the response of shallow groundwater to precipitation in the northern piedmont of the Qinling Mountains, China. Urban Clim. 2023, 47, 101379. [Google Scholar] [CrossRef]
  9. Wang, H.B.; Li, X.; Xiao, J.F.; Ma, M.; Tan, J.; Wang, X.; Geng, L. Carbon fluxes across alpine, oasis, and desert ecosystems in northwestern China: The importance of water availability. Sci. Total Environ. 2019, 697, 133978. [Google Scholar] [CrossRef]
  10. Yang, G.; Tian, L.; Li, X.; He, X.; Gao, Y.; Li, F.; Xue, L.; Li, P. Numerical assessment of the effect of water-saving irrigation on the water cycle at the Manas River Basin oasis, China. Sci. Total Environ. 2019, 691, 506–515. [Google Scholar] [CrossRef]
  11. Bruce, B.Y.; Sandow, M.Y.; Emnmnuel, N. Hydrocliemical analysis of groundwater using multivariate statistical methods-the Volta region. Can. J. Civ. Eng. 2010, 13, 55–63. [Google Scholar]
  12. Liu, Y.; Yamanaka, T. Tracing groundwater recharge sources in a mountain–plain transitional area using stable isotopes and hydrochemistry. J. Hydrol. 2012, 464, 116–126. [Google Scholar] [CrossRef] [Green Version]
  13. Abel, O.T.; Moshood, N.T. Hydrochemical and stable isotopic characterization ofshallow groundwater system in the crystalline basement terrain of Ekitiarea, southwestern Nigeria. Appl. Water Sci. 2014, 3, 229–245. [Google Scholar]
  14. Reza, D.; Navid, S.H.; Jafar, S.S.; Taghipour, H. Integrated assessment of spatial and temporal variations of groundwater quality in the eastern area of Urmia Salt Lakefiasin using multivariate statistical anaIysis. Water Resour. Manag. 2015, 29, 1351–1364. [Google Scholar]
  15. Ayla, B. Assessment of the hydrogeochemical characteristics of groundwater in two aquifer systems in Cumra Plain, Central Anatolia. Environ. Earth Sci. 2016, 75, 674. [Google Scholar]
  16. Argamasilla, M.; Barbera, J.A.; Andreo, B. Factors controlling groundwater salinization and hydrogeochemical processes in coastal aquifers from southern Spain. Sci. Total Environ. 2018, 580, 50–68. [Google Scholar] [CrossRef]
  17. Bouteraa, O.; Mebarki, A.; Bouaicha, F.; Nouaceur, Z.; Laignel, B. Groundwater quality assessment using multivariate analysis, geostatistical modeling, and water quality index (WQI): A case of study in the Boumerzoug-El Khroub valley of Northeast Algeria. Acta Geochim. 2021, 38, 796–814. [Google Scholar] [CrossRef]
  18. Yang, Q.; Li, Z.; Ma, H.; Wang, L.; Martín, J.D. Identification of the hydrogeochemical processes and assessment of groundwater quality using classic integrated geochemical methods in the Southeastern part of Ordos basin, China. Environ. Pollut. 2016, 218, 879–888. [Google Scholar] [CrossRef]
  19. Wu, C.; Su, X.; Guo, J.; Dong, W. Multivariate statistical analysis of hydrogeochemical evolution of groundwater in Cretaceous aquifer Ordos desert plateau. Glob. Geol. 2011, 30, 244–253. (In Chinese) [Google Scholar]
  20. Zhang, H.; Jiang, X.; Wan, L.; Ke, S.; Liu, S.; Han, G.; Guo, H.; Dong, A. Fractionation of Mg isotopes by clay formation and calcite precipitation in groundwater with long residence times in a sandstone aquifer, Ordos Basin, China. Geochim. Cosmochim. Acta 2018, 237, 261–274. [Google Scholar] [CrossRef]
  21. Zhang, R. Hydrochemical characteristics and influencing factors of Cretaceous groundwater in the northern Ordos Basin. Coal Chem. Ind. 2019, 42, 57–64. (In Chinese) [Google Scholar]
  22. Wang, X.R.; Yin, L.; Zhang, J.; Wang, X. Simulation and assessment on allowable groundwater exploitation in the Haolebaoji well field Based on ecological constraint. Geotech. Investig. Surv. 2021, 3, 36–42. (In Chinese) [Google Scholar]
  23. Wang, X.; Yin, L.; Fang, K.; Zhang, J.; Wang, X. Inspection and assessment of the environmental impacts of groundwater exploitation at the Haolebaoji wellfield in Inner Mongolia. Hydrogeol. Eng. Geol. 2019, 46, 5–12. (In Chinese) [Google Scholar]
  24. Greenpeace. Coals devouring water-A survey on the environmental impacts of Shenhua coal conversion to oil project in Ordos. Green Leaf 2013, 8, 88–92. (In Chinese) [Google Scholar]
  25. Jiang, X.W.; Wan, L.; Wang, J.Z.; Yin, B.; Fu, W.; Lin, C. Field identification of groundwater flow systems and hydraulic traps in drainage basins using a geophysical method. Geophys. Res. Lett. 2014, 41, 2812–2819. [Google Scholar] [CrossRef]
  26. Sun, F. Research on Groundwater Circulation and Environment Effect of Dusitu River in Ordos Basin; Chang’an University: Xi’an, China, 2010; (In Chinese with English Abstract). [Google Scholar]
  27. Piper, A.M. A Graphic Procedure in the Geochemical Interpretation of Water Analysis. In Environmental Isotopes in Hydrogeology; Fritz, I., Ed.; United States Department of the Interior, Geological Survey, Water Resources Division, Ground Water Branch: Washington, DC, USA; CRC Press: Boca Raton, FL, USA, 1953; p. 63. [Google Scholar]
  28. Zhang, X.; Guo, Q.; Liu, M.; Luo, J.; Yin, Z.; Zhang, C.; Zhu, M.; Guo, W.; Li, J.; Zhou, C. Hydrogeochemical processes occurring in the hydrothermal systems of the Gonghe–Guide Basin, northwestern China: Critical insights from a principal components analysis (PCA). Environ. Earth Sci. 2016, 75, 1–17. [Google Scholar] [CrossRef]
  29. Kang, X.; Niu, Y.; Yu, H.; Gou, P.; Hou, Q.; Lu, X.; Wu, Y. Effect of rainfall-runoff process on sources and transformations of nitrate using a combined approach of dual isotopes, hydrochemical and Bayesian model in the Dagang River basin. Sci. Total Environ. 2022, 837, 155674. [Google Scholar] [CrossRef]
  30. Kong, X.; Wang, S.; Liu, B.; Sun, H.; Sheng, Z. Impact of water transfer on interaction between surface water and groundwater in the lowland area of North China Plain. Hydrol. Process. 2018, 32, 2044–2057. [Google Scholar] [CrossRef]
  31. Xu, P.; Zhang, Q.; Qian, H.; Li, M.; Hou, K. Characterization of geothermal water in the piedmont region of Qinling Mountains and Lantian-Bahe Group in Guanzhong Basin, China. Environ. Earth Sci. 2019, 78, 442. [Google Scholar] [CrossRef]
  32. Yin, Z.; Luo, Q.; Wu, J.; Xu, S.; Wu, J. Identification of the long-term variations of groundwater and their governing factors based on hydrochemical and isotopic data in a river basin. J. Hydrol. 2021, 592, 125604. [Google Scholar] [CrossRef]
  33. Shamsi, A.; Karami, G.H.; Hunkeler, D.; Taheri, A. Isotopic and hydrogeochemical evaluation of springs discharging from high-elevation karst aquifers in Lar National Park, northern Iran. Hydrogeol. J. 2019, 27, 655–667. [Google Scholar] [CrossRef]
  34. Lihe, Y.; Guangcai, H.; Zhengping, T.; Ying, L. Origin and recharge estimates of groundwater in the ordos plateau, People’s Republic of China. Environ. Earth Sci. 2010, 60, 1731–1738. [Google Scholar] [CrossRef]
  35. Wang, H.; Jiang, X.; Wan, L.; Han, G.; Guo, H. Hydrogeochemical characterization of groundwater flow systems in the discharge area of a river basin. J. Hydrol. 2015, 527, 433–441. [Google Scholar] [CrossRef]
  36. Craig, H. Isotopic variations in meteoric waters. Science 1961, 133, 1702–1703. [Google Scholar] [CrossRef] [PubMed]
  37. Appelo, C.A.J.; Willemsen, A. Geochemical calculations and observations on salt water intrusions, I. A combined geochemical/minxing cell model. J. Hydrol. 1987, 94, 313–330. [Google Scholar] [CrossRef]
  38. Duan, R.; Li, P.; Wang, L.; He, X.; Zhang, L. Hydrochemical characteristics, hydrochemical processes and recharge sources of the geothermal systems in Lanzhou City, northwestern China. Urban Clim. 2022, 43, 1–15. [Google Scholar] [CrossRef]
  39. Su, Y.H.; Zhu, G.F.; Feng, Q.; Li, Z.Z.; Zhang, F.P. Environmental isotopic and hydrochemical study of groundwater in the Ejina Basin, northwest China. Environ. Geol. 2009, 58, 601–614. [Google Scholar] [CrossRef]
  40. Bekele, E.; Zhang, Y.; Donn, M.; McFarlane, D. Inferring groundwater dynamics in a coastal aquifer near wastewater infiltration ponds and shallow wetlands (Kwinana, Western Australia) using combined hydrochemical, isotopic and statistical approaches. J. Hydrol. 2019, 568, 1055–1070. [Google Scholar] [CrossRef]
  41. Noble, J.; Ansari, M.A. Isotope hydrology and geophysical techniques for reviving a part of the drought prone areas of Vidarbha, Maharashtra, India. J. Hydrol. 2019, 570, 495–507. [Google Scholar] [CrossRef]
  42. Wang, Z.; Yin, J.J.; Pu, J.; Wang, P.; Liang, X.; Yang, P.; He, Q.; Gou, P.; Yuan, D. Integrated understanding of the Critical Zone processes in a subtropical karst watershed (Qingmuguan, Southwestern China): Hydrochemical and isotopic constraints. Sci. Total Environ. 2020, 749, 141257. [Google Scholar] [CrossRef]
  43. Dugga, P.; Pervez, S.; Tripathi, M.; Siddiqui, M.N. Spatiotemporal variability and source apportionment of the ionic components of groundwater of a mineral-rich tribal belt in Bastar, India. Groundw. Sustain. Dev. 2020, 10, 100356. [Google Scholar] [CrossRef]
  44. Hou, G.; Zhao, M.; Wang, Y. Groundwater Investigation in the Ordos Basin; China Geological Survey: Beijing, China, 2006. (In Chinese)
  45. Yin, L.; Hou, G.; Dou, Y.; Tao, Z.; Li, Y. Hydrogeochemical and isotopic study of groundwater in the Habor Lake Basin of the Ordos Plateau, NW China. Environ. Earth 2009, 64, 1575–1584. [Google Scholar] [CrossRef]
  46. Magaritz, M.; Nadler, A.; Koyumdjisky, H.; Dan, J. The use of Na/Cl ratios to trace solute sources in a semiarid zone. Water Resour. Res. 1981, 17, 602–608. [Google Scholar] [CrossRef]
  47. Dixon, W.; Chiswell, B. The use of hydrochemical sections to identify recharge areas and saline intrusions in alluvial aquifers, southeast Queensland, Australia. J. Hydrol. 1992, 135, 259–274. [Google Scholar] [CrossRef]
  48. Belkhiri, L.; Boudoukha, A.; Mouni, L.; Baouz, T. Statistical categorization geochemical modeling of groundwater in Ain Azel plain (Algeria). J. Afr. Earth Sci. 2011, 59, 140–148. [Google Scholar] [CrossRef]
  49. Schoeller, H. Qualitative evaluation of groundwater resources. In Methods and Techniques of Groundwater Investigations and Development; UNESCO: Paris, France, 1956; pp. 54–83. [Google Scholar]
  50. Li, P.; Qian, H.; Wu, J.; Zhang, Y.; Zhang, H. Major ion chemistry of shallow groundwater in the Dongsheng Coalfield, Ordos Basin, China. Mine Water Environ. 2013, 32, 195–206. [Google Scholar] [CrossRef]
  51. Kumar, S.; Venkatesh, A.S.; Singh, R.; Udayabhanu, G.; Saha, D. Geochemical signatures and isotopic systematics constraining dynamics of fluoride contamination in groundwater across Jamui district, Indo-Gangetic alluvial plains, India. Chemosphere 2018, 205, 493–505. [Google Scholar] [CrossRef]
  52. Jampani, M.; Liedl, R.; Hülsmann, S.; Sonkamble, S.; Amerasinghe, P. Hydrogeochemical and mixing processes controlling groundwater chemistry in a wastewater irrigated agricultural system of India. Chemosphere 2020, 239, 124741. [Google Scholar] [CrossRef]
  53. Drever, J.I. The Geochemistry of Natural Waters: Surface and Groundwater Environments; Prentice Hall: Hoboken, NJ, USA, 1997. [Google Scholar]
  54. Kim, K.H.; Yun, S.T.; Yu, S.; Choi, B.; Kim, M.; Lee, K. Geochemical pattern recognitions of deep thermal groundwater in South Korea using self-organizing map: Identified pathways of geochemical reaction and mixing. J. Hydrol. 2020, 589, 125202. [Google Scholar] [CrossRef]
  55. Ghobadi, M.H.; Dehban Avan Stakhri, M.; Mirarabi, A. Investigating the hydrogeological properties of springs in a karstic aquifer in Dorfak region (Guilan Province, Iran). Environ. Earth Sci. 2018, 77, 96. [Google Scholar] [CrossRef]
  56. Manoj, S.; Thirumurugan, M.; Elango, L. Hydrogeochemical modelling to understand the surface water-groundwater interaction around a proposed uranium mining site. J. Earth Syst. Sci. 2019, 128, 49. [Google Scholar] [CrossRef] [Green Version]
  57. Yang, N.; Wang, G.C.; Shi, Z.M.; Zhao, D.; Jiang, W.; Guo, L.; Liao, F.; Zhou, P. Application of multiple approaches to investigate the hydrochemistry evolution of groundwater in an Arid Region: Nomhon, Northwestern China. Water 2018, 10, 1667. [Google Scholar] [CrossRef] [Green Version]
  58. Ma, R.; Shi, J.S.; Liu, J.C.; Gui, C. Combined use of multivariate statistical analysis and hydrochemical analysis for groundwater quality evolution: A case study in north chain plain. J. Earth Sci. 2014, 25, 587–597. [Google Scholar] [CrossRef]
  59. Gibbs, R.J. Mechanisms controlling world water chemistry. Science 1970, 170, 1088–1090. [Google Scholar] [CrossRef] [PubMed]
  60. Marghade, D.; Malpe, D.B.; Zade, A.B. Major ion chemistry of shallow groundwater of a fast growing city of Central India. Environ. Monit. Assess. 2012, 184, 2405–2418. [Google Scholar] [CrossRef]
  61. Xing, L.; Guo, H.; Zhan, Y. Groundwater hydrochemical characteristics and processes along flow paths in the North China Plain. J. Asian Earth Sci. 2013, 70–71, 250–264. [Google Scholar] [CrossRef]
  62. Pant, R.R.; Zhang, F.; Rehman, F.U.; Wang, G.; Ye, M.; Zeng, C.; Tang, H. Spatiotemporal variations of hydrogeochemistry and its controlling factors in the Gandaki River Basin, Central Himalaya Nepal. Sci. Total Environ. 2018, 622–623, 770–782. [Google Scholar] [CrossRef]
  63. Winnick, M.J.; Maher, K. Relationships between CO2, thermodynamic limits on silicate weathering, and the strength of the silicate weathering feedback. Earth Planet. Sci. Lett. 2018, 485, 111–120. [Google Scholar] [CrossRef]
Figure 1. Scope of the study area.
Sustainability 15 05091 g001
Figure 2. Piper diagram of the study area. (1). Alkaline earths exceeding alkalics (2). Alkalics exceeding alkaline earths (3). Weak acids exceeding strong acids (4). Strong acids exceeding weak acids (5). Carbonate hardness exceeds 50% (6). Non-carbonate hardness exceeds 50% (7). Alkalics and strong acids predominated (8). Alkalics and weak acids predominated (9). Mixed type; (A). Calcium type (B). No dominant type (C). Magnesium type (D). Sodium and potassium type (E). Bicarbonate type (F). Sulphate type (G). Chloride type).
Sustainability 15 05091 g002
Figure 3. Distribution map of water chemical types.
Sustainability 15 05091 g003
Figure 4. Isotopic composition of groundwater.
Sustainability 15 05091 g004
Figure 5. Relationship between the main ion pairs in groundwater. (a) Relationship between Ca2+ and HCO3. (b) Relationship between Ca2+ and SO42−. (c) Relationship between Mg2+ and HCO3. (d) Relationship betweenNa+ and Cl. (e) Relationship betweenNa+ and SO42−. (f) Relationship between Na+ and HCO3. (g) Relationship between Na+ and Ca2+.
Sustainability 15 05091 g005
Figure 6. Scatter plot of the correlation between SO42−+ HCO3 and Ca2+ + Mg2+.
Sustainability 15 05091 g006
Figure 7. Changes in CAI-1 and CAI-2 in the five groups of water samples. (a) CAI-1 in the five groups of water samples. (b) CAI-2 in the five groups of water samples.
Sustainability 15 05091 g007
Figure 8. Variation in the saturation index with TDS. (a) Variation in the saturation index of calcite with TDS. (b) Variation in the saturation index of halite with TDS. (c) Variation in the saturation index of gypsum with TDS. (d) Variation in the saturation index of dololmite with TDS.
Sustainability 15 05091 g008
Figure 9. Scatter plot of Na+ − Cl and (Ca2+ + Mg2+) − (SO42− + HCO3).
Sustainability 15 05091 g009
Figure 10. Gibbs diagram of the Haolebaojinnao watershed. (a) The relationship between Na+/(Na+ + Ca2+) and TDS. (b) The relationship between Cl/(Cl + HCO3) and TDS.
Sustainability 15 05091 g010
Table 1. Analysis of groundwater ions.
ProjectMinimumMaximumMedianAverage Value
pH7.499.537.947.99
TDS (mg/L)901038305.4366.15
K+ (mg/L)0.4119.612.462.88
Na+ (mg/L)5.68264.5746.3967.37
Ca2+ (mg/L)15.445181.4561.467.08
Mg2+ (mg/L)5.3484.0822.3425.76
Cl (mg/L)5.71187.7941.2552.37
SO42− (mg/L)7.90330.4149.6560.18
HCO3 (mg/L)158.05822.66281.43316.91
CO32− (mg/L)033.3100.71
NO3 (mg/L)095.814.6611.38
δD (‰)−83.61−51.79−65.19−67.04
δ18O (‰)−10.55−6.28−8.48−8.62
Table 2. Rotation factor load matrix for each groundwater index in each group.
GroupingGroup C1 GroundwaterGroup C2 GroundwaterGroup C3 GroundwaterGroup C4 GroundwaterGroup C5 Groundwater
projectF1F2F3F1F2F3F1F2F3F1F2F3F1F2F3
Na+0.67 0.57 0.07 0.86 −0.15 0.11 0.72 0.41 −0.49 0.33 0.89 0.11 0.92 0.00 0.28
Ca2+0.91 0.27 0.02 0.72 0.48 0.28 0.18 0.41 0.65 0.85 0.25 0.18 0.01 −0.20 0.94
Mg2+0.83 0.48 0.16 0.86 0.16 −0.25 0.77 0.22 0.51 0.94 0.11 0.14 0.73 0.24 0.58
Cl0.88 −0.04 −0.04 0.91 −0.10 −0.13 0.93 0.04 0.29 0.17 0.91 0.12 0.06 −0.16 0.91
SO42−0.86 −0.01 0.01 0.77 −0.05 −0.08 0.97 0.00 0.10 0.52 0.72 0.23 0.86 0.01 −0.30
HCO30.37 0.80 0.07 0.72 0.37 0.38 0.30 0.83 −0.03 0.88 0.42 0.11 0.89 0.27 0.11
pH−0.32 −0.05 −0.78 −0.08 −0.74 −0.04 −0.17 0.06 −0.88 −0.16 0.06 −0.83 0.23 0.61 −0.21
δ18O0.04 0.96 0.07 −0.04 0.94 0.06 0.12 0.88 0.26 −0.07 0.45 0.82 0.07 0.96 0.04
δD0.02 0.93 0.10 −0.02 0.96 0.01 0.17 0.90 0.23 0.10 0.49 0.79 −0.01 0.94 −0.28
Eigenvalues3.75 3.08 1.34 3.95 2.78 1.22 3.13 2.88 1.94 2.87 2.83 2.50 3.10 2.53 2.45
Contribution rate/%37.52 30.75 13.42 39.48 27.77 12.23 31.32 28.84 19.39 28.73 28.25 25.02 31.04 25.30 24.52
Cumulative contribution rate/%37.52 68.27 81.68 39.48 67.24 79.47 31.32 60.16 79.54 28.73 56.99 82.0031.04 56.34 80.86
Disclaimer/Publisher’s Note: The statements, opinions and data contained in all publications are solely those of the individual author(s) and contributor(s) and not of MDPI and/or the editor(s). MDPI and/or the editor(s) disclaim responsibility for any injury to people or property resulting from any ideas, methods, instructions or products referred to in the content.