Abstract
In recent years, rainfall extremes have increased significantly and have threatened the socio-economic development in Sri Lanka. This study investigates the rainfall extremes in the Mahaweli River Basin (MRB) of Sri Lanka with daily station datasets from 1985 to 2015. The extreme rainfall indices recommended by the Expert Team on Climate Change Detection Monitoring Indices (ETCCDMI) have been used in this study. Results showed a strong seasonal variation of rainfall extreme events over the MRB and a significant interdecadal change of extreme rainfall indices between 1985–1999 and 2000–2015 in the wet region of MRB, which is coherent with the decadal shift of southwest monsoon (SWM) rainfall from wet to dry situations since the year 2000. Based on the General Extreme Value distributions, the long-term mean of SWM rainfall in the wet region (814 mm) moved leftward for the 2000–2015 period (704 mm) and rightward for the 1985–2000 period, suggesting that SWM rainfall is decreased in the late period. The observed above-average (below-average) rainfall and associated rainfall extremes during the SWM can be ascribed to strengthening (weakening) moisture flux from the Arabian Sea direction and strong (weak) convergence over the study domain. The results further identified the negative correlation between Dipole Mode Index and SWM rainfall and associated rainfall extremes in the wet region, signifying that the negative Indian Ocean Dipole phase can enhance the SWM rainfall over the MRB. The negative correlation between Nino3.4 and SWM rain and extreme indices suggested that high probability of wet rainfall extremes in the La Nina phase. The findings of this study can be used to understand precipitation extremes in the context of climate change at the river basin scale and benefit policymakers in building local adaptation strategies in response to long-term climate change.
1. Introduction
According to the observations and climate model simulations, extreme rainfall events associated with climate warming are intensified over the northern hemisphere [1,2] due to the increased atmospheric moisture content [3,4]. However, the magnitude of changes and interannual variability of rainfall extreme show a heterogeneous pattern in different parts of the world. Inadequate surface observations [5], complex watershed properties [6,7], limitations of hydrological modeling [8], and the development of climate change scenarios [9] are the main contributing factors to the observed heterogeneity of rainfall extremes.
In South Asia, the past and present climate trends and variability are inherited by increasing air temperatures, which amplified the intensity and frequency of extreme events over the last century [10]. In addition, extreme rainfall events in South Asia are projected to intensify under a warming climate [11]. Consequently, the most substantial socio-economic losses are linked to floods and droughts attributed to these extreme rainfall events [12,13]. In this concern, it is imperative to understand the characteristics of rainfall extremes in South Asian countries. In this perspective, many studies have used the Expert Team on Climate Change Detection and Indices (ETCCDI) for investigating hydrometeorological extremes at regional, local, and basin scales [14,15,16,17,18].
The most extreme rainfall indices in the South Asian region depict an increasing trend consistent with globally averaged results. For instance, in central India, the frequency and the magnitude of extreme rain events showed significant rising trends during the monsoon season [17]. Panda and Kumar [18] found that most ETCCDI wet extreme indices show a general increase during the rapid warming period over large parts of India during 1971–2005. In Bangladesh, consecutive dry days (CDD) showed a statistically significant increasing trend of ten days per decade [15]. According to Basher, et al. [19], the northeast part of Bangladesh showed a statistically decreasing trend of rainfall extremes during monsoon seasons from 1984 to 2016. Dietzsch et al. [14] found large values of the CDD for southern Pakistan and Afghanistan climatology. According to the extreme climate projections over the transboundary of “Koshi River Basin”, the number of consecutive wet days is projected to decrease, and the CDD will increase over the basin [20]. The station-based analysis of the same river basin showed an increasing trend in total annual rainfall and rainfall intensity, whereas the number of CDDs increased at almost all stations [21]. Subba, et al. [22] showed that CDD and consecutive wet days in the eastern part of Nepal increased on average from 1997 to 2006, while frequency indices (heavy rainfall days) decreased during the second decade 2007–2016 period. Jayawardena, et al. [23] found that increasing the trend of maximum five-day precipitation and total precipitation on extreme rainfall days increased at most locations in Sri Lanka.
In Sri Lanka, the frequency, occurrence, and magnitude of extreme rainfall events have demonstrated significant regional differences. The variability of rainfall extremes at regional scales cannot describe local extreme events due to the complex topography and the local precipitation structure. Therefore, exploring the variation of extreme rainfall events and associated characteristics for the river basin can help us better understand rainfall extremes in the context of climate change.
The Mahaweli River Basin (hereinafter MRB) is the most important and the largest river basin [24] in Sri Lanka; however, less attention has been given to understanding the hydro-metrological extremes induced by changing climate. Among the limited studies, Wickramagamage [25] revealed a decreasing rainfall trend in the upper catchments of the major rivers in Sri Lanka. Pawar and Rathnayake [26] found no significant trends in rainfall in the MRB at the basin scale. Notably, Chandrasekara, et al. [27] found that annual rainfall over one catchment (Kothmale) in MRB decreased during the 1960–2005 period. De Silva and Hornberger [28] and Zubair [29] found that ENSO and IOD modulate the seasonal rainfall pattern over the MRB. Imbulana, et al. [30] addressed the future changes in the rainfall pattern in the MRB using three general circulation models and found decreasing consecutive dry days in the river basin. Senatilleke, et al. [31] used Standardized Precipitation Index (SPI) and Standardized Precipitation–Evapotranspiration Index (SPEI) to assess meteorological droughts in MRB.
Shelton [24] discussed the streamflow simulation and its variation and extreme flow events in different catchments in MRB. However, there is no systematic research on comprehensive indices identifying extreme rainfall events on annual and seasonal scales. Simultaneously, the interannual variability of extreme rainfall events and the impact of large-scale circulation on rainfall extremes in MRB has not been investigated. Therefore, in this study, we used the interannual variability of daily extreme rainfall events in the MRB during 1985–2015 using comprehensive extreme rainfall indices (ETCCDI) recommended by the World Meteorological Organization.
It is well known that large-scale Ocean Surface and Atmospheric Conditions modulate the variability and occurrence of extreme rainfall events [32,33,34,35]. In the last decades, a weakening of the Sea Surface Temperature (SST) gradients over the Indian Ocean can deteriorate the Indian Summer Monsoon circulation by developing a weak cross-equatorial (south to north) surface pressure gradient and north-to-south mid-and upper troposphere pressure gradient [36,37]. Even though ENSO and IOD influence on rainfall in Sri Lanka is well established [28,32,38,39,40], no studies have focused on evaluating the relationship between large-scale circulation and extreme rainfall events over the MRB. This study has briefly addressed the above-mentioned research gap in a comprehensive manner. Furthermore, we investigate the moisture transport and its convergence to explain extreme rainfall events in above- and below-average monsoon years.
2. Materials and Methods
2.1. Study Site
The Mahaweli river is the longest in Sri Lanka, flowing 331 kilometers, originating from the western highlands capturing the discharge from tributaries on the western and eastern slopes of the highlands, and then discharging to the sea in the northeast [24]. The selected MRB (10,448 km2) is the largest river basin among the 103 river basins in Sri Lanka [24] and covers 16% of the total extent of the country. MRB receives precipitation of 28 × 109 m3 annually (0.7 mm/day). The Upper Mahaweli catchment (1149 km2) is in the western region, where the rainfall is enhanced from April to October due to orographic rain on the windward side of the mountain ridge during the southwest monsoon (SWM). Similarly, the eastern side of the basin received more orographic rainfall during the northeast monsoon (NEM), starting from December to February.
2.2. Data
The Department of Meteorology, Sri Lanka, provided daily rainfalls from 43 rain gauges (Figure 1) covering the MRB from 1985 to 2015. Detailed descriptions of the selected stations are given in Table 1. In addition, 1° × 1° resolution Sea Surface Temperature (SST) data from the Met Office Hadley Center Sea Ice and Sea Surface Temperature version 1.1 (HadISST1.1 https://www.metoffice.gov.uk/hadobs/hadisst/data/download.html, accessed on 12 November 2021) [41] has been used to calculate the Niño3.4 index and Dipole Mode Index (DMI).
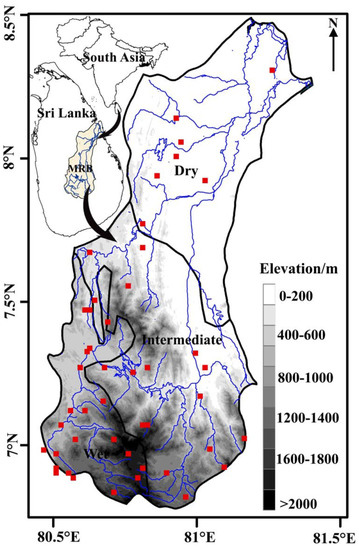
Figure 1.
The distribution of rain gauges (red squares) over the Mahaweli River Basin (MRB). The black lines demarcate dry, intermediate, and wet climate zones, while the blue line represents the Mahaweli River.

Table 1.
Detailed description of the selected stations and annual rainfall.
We collected daily Zonal and Meridional wind, specific humidity, and surface pressure (0.3° × 0.3° grid resolution) from ERA5 (https://www.ecmwf.int/en/forecasts/dataset/ecmwf-reanalysis-v5, accessed on 12 November 2021) [42] because the ERA reanalysis data are among the best reanalysis products to reproduce and interpret the atmospheric branch of the hydrological cycle [43]. Previously, Shelton and Pushpawela [44] used ERA data set to identify the associated mechanisms for SWM rainfall in Sri Lanka.
2.3. Methodology
2.3.1. Data Processing
Most of the time, the long-term continuous observed daily precipitation time series is rare and always composed of missing data records. According to previous studies, data records with less than 2% [45,46] and 5% [47] missing values out of total data records are used to analyze rainfall extremes. In this study, daily rainfall time series with more than 3% missing values within the analysis period and stations with gaps of one or more years between daily rainfall series were discarded. The missing rainfall data were filled in by average values of neighboring days at the same station, which is applied [48,49], and this gap-filling method has no significant influence on the long-term temporal trend and variability. If daily rainfall is outside a threshold of the mean value for that particular day plus three standard deviations, the records are flagged as outliers in the time series. Furthermore, visual inspections of the data plots were carried out to assess data quality control [50].
For the homogenization analysis, 25 stations with a long-term daily rainfall series were tested using the RHtest_dlyPrcp package recommended by previous studies [51]. After homogenization, 10, 9, and 6 daily rainfall series at the wet, intermediate, and dry regions in the MRB, respectively, were selected to calculate the extreme rainfall indices.
2.3.2. Extraction of Extreme Rainfall Indices
Climate extreme indices are defined and reviewed by the Expert Team (ET) and the CCl/CLIVAR/JCOMM Expert Team on Climate Change Detection and Indices (ETCCDI) (http://etccdi.pacificclimate.org/index.shtml, accessed on 25 February 2023) [50]. The indices selected for this study have been widely used to explore changes in the intensity, frequency, and proportion of extremes in total rainfall for different regions worldwide [45,46,52,53,54,55,56,57]. We also used six ETCCDI extreme rainfall indices (Table 2).
Table 2.
Definition of six extreme rainfall indices.
The regional indices were calculated as simple average indices over all stations in the particular region using the approach proposed by New, et al. [58], anticipating more robust results. The regional standardized anomaly series of each index is calculated as follows (Equation (1)).
is the regionally averaged index at year t; is the index for station i at year t; is the index mean at station i for the study period; is the number of stations with data in year t.
The Generalized Extreme Value Probability Distribution Functions (GEVPDFs) has been widely used to describe the distribution of extreme rainfalls for different durations [59]. The Generalized Extreme Value parameters (location, scale, and shape) of selected indices have been calculated using the method of L-moments for two sub-periods and identify the difference of GEVPDFs using the two-tailed Kolmogorov-Smirnov test at 90% confidence level. In this study, we used Cumulative Sum Charts (CUSUM) for SWM, and NEM rainfall was used to divide into two sub-periods.
To identify the years recorded the extreme rainfall in two monsoon seasons, the anomalous SWM rainfall in the wet region and NEM rainfall in dry and intermediate regions were considered for the composite analysis. If a normalized SWM rainfall anomaly is above (below) the +0.8 (−0.8) threshold level in a particular year, it was identified as a strong (weak) SWM monsoon year (Supplementary Figure S1a). Similarly, the procedure is adopted to determine the contrast monsoon years for the NEM season (Supplementary Figure S1b). Finally, eight (seven) strong and weak SWM (NEM) monsoon years were selected for further analysis. Eventually, partial correlation analysis was used to understand the relationships between large-scale oceanic circulation indices (Nino3.4 and DMI) and rainfall extremes in the MRB during the 1985–2015 period. The correlation results have been evaluated at a 90% confidence interval.
3. Results
3.1. Variability of Seasonal Rainfall in MRB
According to Shelton [24], rainfall distribution in MRB is highly related to monsoon circulations. The SWM rainfall has more influence on the wet region due to the orographic effect of the central mountain. As shown in Figure 2a–c, the SWM rainfall in wet (914 ± 244 mm), intermediate (309 ± 86 mm), and dry regions (172 ± 73 mm) contribute to 37.8%, 16.8%, and 10.9% of their annual total rainfall. In the wet region, above-average rainfall was observed before 2000; however, the region experienced less rain from the SWM after 2000. It further suggested that wet events were prominent during the 1985–1999 period over the wet region, which became drier during the 2000–2015 period. Furthermore, a 9-year running mean indicates the strong decadal shift of SWM rainfall in the wet region, responsible for the decadal variability of annual total rainfall, and can explain the similar feature of extreme rainfall indices. Figure 2b,c demonstrate a similar rainfall variability signal, where most of the wet (dry) events were recorded before (after) 2000 over the intermediate and dry regions. At the same time, the 9-year running mean of the SWM rainfall illustrates that both regions experienced the decadal rainfall shift from wet to dry conditions around the year 2000.
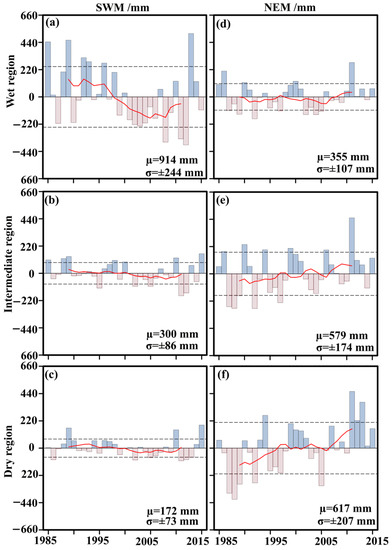
Figure 2.
The time evolution of anomalous rainfall in (a) wet, (b) intermediate, and (c) dry regions of MRB during the southwest monsoon (SWM) season. The right (d–f) panels are the same as the left panels but for the northwest monsoon (NEM) rainfall. The μ and σ represent the long-term mean and standard deviation of each rainfall. The dashed lines indicate the ± σ level. A positive (negative) anomaly is depicted by light blue (light red) color. The red line indicates a 9-year running mean of the rainfall.
The intermediate (579 mm) and dry (617 mm) regions get more rainfall than the wet region (355 mm) from the NEM circulation, which contributes 40%, 31%, and 14.7% to the annual total rainfall of three climate regions, respectively. During the NEM season from 1985 to 2015, the wet region recorded only four wet events (1986, 1990, 2000, and 2011) and seventh dry events (Figure 2d). In the intermediate region, anomalous NEM rainfall showed wet events in 1986, 1990, 1994, 1999, 2007, and 2011, while dry events were observed in 1987, 1988, 1989, 1992, and 1997 (Figure 2e). For the dry region, 1994, 1999, 2011, 2012, and 2013 are considered wet years, while dry events are observed in 1987, 1988, 1989, 1992, and 2005 (Figure 2f). Based on the 9-year running mean, there is no prominent decadal variation of NEM rainfall over the three regions. We detected strong interannual variation in NEM rainfall over the three climate regions. These findings suggested that interannual variation in extreme rainfall indices in the intermediate and dry regions is attributed to the solid year-to-year variation of NEM rainfall over the two regions.
3.2. Seasonal Dependence of Rainfall Extremes in MRB
It is well established that rainfall over MRB is seasonal-dependent [24]. Therefore, understanding extreme rainfall events during the monsoon and inter-monsoonal seasons is essential. For instance, we demonstrate the RX5day, SDII, R95p, and R25 indices for three climate regions at the monthly time scale (Figure 3a–c). Two rainfall peaks are identified in the wet region during the initial month of the SWM (June) and SIM (October) seasons. The maximum RX5day is recorded in June. The SDII (10.6 mm/day) and R25 (2.5 days) showed a peak during the SIM season (October-November). The wet region receives the lowest rainfall during the NEM monsoon season (December to February), where the lowest RX5day (46 mm), R25 (0.4 days), and SDII (4.75 mm/day) were observed. In the same region, we detected the minimum and maximum R95p in January (6.7 mm) and May (22.8 mm), respectively (Figure 3a).
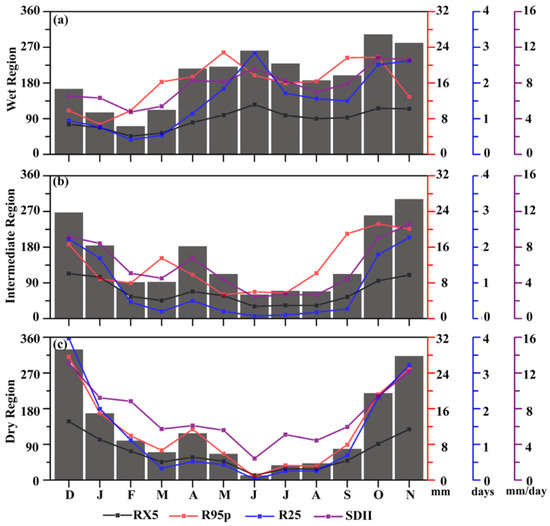
Figure 3.
Annual cycle of rainfall (ash boxes; mm), RX5day (unit: mm), R95p (unit: mm), R25 (unit: days), and SDII (unit: mm/day) in (a) wet, (b) intermediate, and (c) dry regions for the 1985–2015 period. The left Y-axis is common for the rainfall and RX5day rainfall amount, and the x-axis represents the month of the year, starting in December and ending in November.
Figure 3b depicts the annual cycle of rainfall and extreme rainfall indices over the intermediate region. The lowest rainfall over the intermediate region receives in June (60 mm), while the lowest R25, SDII (5 mm/day), and RX5day (30.8 mm) were detected in the same month., The intermediate region recorded a strong maximum R95p (20.1 mm), R25 (2.2 days), and SDII (10.5 mm/day) in November. Interestingly, the second peak of rainfall and all the extreme indices in the same region were reported in December (Figure 3b). We also found that extreme rainfall events are well associated with the rainfall pattern over the dry region. For instance, the maximum RX5day (148 mm), R95p (27.67 mm), R25 (4 days), and SDII (13.31 mm/day) were recorded in December, when the dry region receives maximum rainfall (328 mm). In contrast, the lowest rainfall was recorded in June (11 mm), where the lowest rainfall extremes were reported accordingly (Figure 3c).
We found that rainfall distribution in the MRB is highly related to monsoon circulations. The SWM rainfall has more influence on the wet region due to the orographic effect of the central mountain. In contrast, the intermediate and dry regions receive significant rainfall during the NEM season. Therefore, we investigate the relationship between the rain in two monsoon seasons and extreme rainfall indices using Pearson’s correlation statistics at 90% confidence levels (Supplementary Table S1). All three regions in the MRB depict a statistically significant positive correlation between seasonal rainfall and extreme rainfall indices except for CDD, especially R25, R95p, RX5day, and SDII, recorded above a 0.6 correlation coefficient.
3.3. Variability of Rainfall Extreme in MRB
Due to the observed seasonal dependency of extreme rainfall events, we further investigated the seasonal variation of extreme rainfall indices (RX5day, R25, and SDII), as shown in Figure 4a–i. In the wet region, the long-term mean value of the RX5day, SDII, and R25 for the SWM season is 154 mm, 11.1 mm, and 8.5 mm, respectively. We found a strong positive anomalous of RX5day, SDII, and R25 during the SWM season before 2000, while negative anomalous extremes are mostly recorded after 2000 (Figure 4a–c).
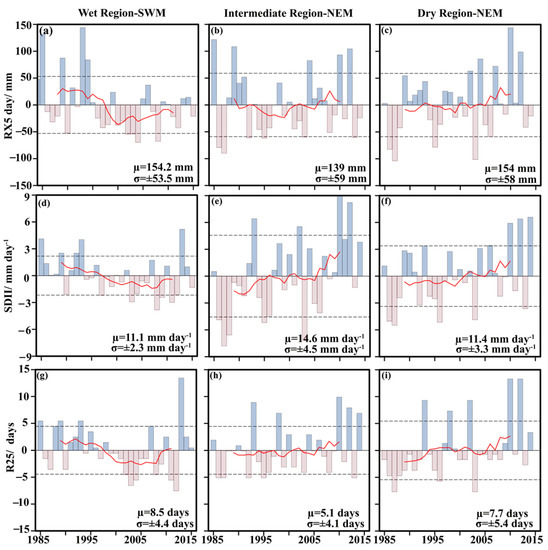
Figure 4.
The time evolution of anomalous consecutive five-day rainfall (RX5day; unit: mm) at the seasonal timescale for (a) wet, (b) intermediate, and (c) dry regions of MRB. The middle (d–f) and lower (g–i) panels are the same as the top panels but for the simple daily intensity index (SDII; unit: mm/day) and the number of days that exceed the 25 mm rainfall (R25; unit: days) indices. The SWM and NEM represent the southwest and northeast monsoon seasons, respectively. The dashed lines indicate the standard deviation (±σ), and μ denotes the long-term mean of each index. A positive (negative) anomaly is depicted by light blue (light red) color. The red line indicates a 9-year running mean of the selected indices.
Figure 4d–f shows the average RX5day and SDII in the NEM season for the intermediate and dry regions, respectively. The intermediate and dry regions record more positive anomalous RX5day and SDII after 2000, while the negative anomalous events dominate before 2000 (Figure 4e,f). The average of R25 in the intermediate region (5.1 days) is less than in the dry region (7.4), suggesting that the intermediate region gets less rainfall than dry regions during the NEM season (Figure 4f–i).
As shown in Figure 5a, the negative anomalous CDD is dominant before 2000 and becomes positive after 2000, which suggests that the wet region has experienced more dry events during the SWM season since 2000. In contrast to CDD, Figure 5b,c depict positive anomalous CWD and R95p during 1985–1999, respectively. After 1999, the negative anomalous CWD and R95p are dominant in the wet region. When evaluating the extreme rainfall indices for the SWM season, all the extreme rainfall indices except CDD demonstrate more positive (negative) anomalies before (after) 2000. Furthermore, the 9 year running means suggested the decadal shift of CWD, CDD, SDII, RX5day, R95p, and R25 during the SWM season, especially over the wet region of MRB. On the other hand, extreme rainfall events during the NEM exhibit strong interannual variation during the 1985–2015 period. Notably, Figure 5e–i depicts that the intermediate and dry regions experienced more wet extremes during the NEM seasons since 2005. Moreover, these findings suggest that the variation of extreme events might be ascribed to seasonal rainfall variation. Therefore, the seasonal rainfall (SWM and NEM) variations of three climate regions are investigated.
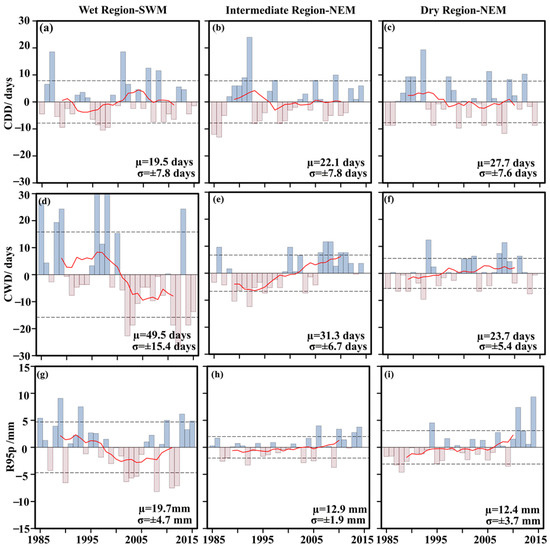
Figure 5.
The time evolution of anomalous consecutive dry days (CDD; unit: days) at the seasonal timescale for (a) wet, (b) intermediate, and (c) dry regions of MRB. The middle (d–f) and lower (g–i) panels are the same as the top panels but for the consecutive wet days (CWD; unit: days) and 95th percentile of daily rainfall (R95p; unit: mm) indices. The SWM and NEM represent the southwest and northeast monsoon seasons, respectively. The dashed lines indicate the standard deviation (±σ), and μ denotes the long-term mean of each index. A positive (negative) anomaly is depicted by light blue (light red) color. The red line indicates a 9-year running mean of the selected indices.
3.4. GEV Distributions for Rainfall Extremes
Based on the step-change of the rainfall, the study period is separated into two sections, and a GEVPDFs is performed to investigate the mean shift, as shown in Figure 6a–i. In this study, we have used the mean value from the GEV distribution to identify the mean shift of two periods relative to the long-term climatological mean. Furthermore, the mean comparison is performed using a Kolmogorov-Smirnov test at a 90% confidence level.
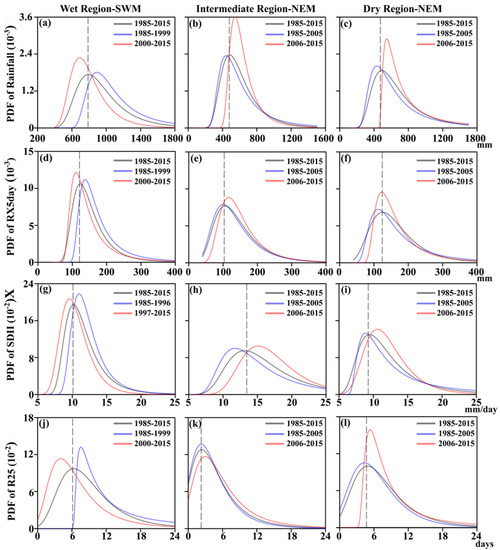
Figure 6.
Probability Density Function (PDF) of the General Extreme Value (GEV) distributions of (a) rainfall (SWM), (d) consecutive five-day rainfall (RX5day; mm), (g) simple daily intensity index (SDII; mm/day), and (j) the number of days that exceed the 25 mm rainfall (R25; day) indices in the wet region for southwest monsoon season. The middle (b,e,h,k) and right (c,f,i,l) panels are the same as the left panel panels but for the northeast monsoon season in intermediate and dry regions. The dashed line indicates the long-term mean, and the mean shift of the early and late periods is considered relative to this line.
As shown in Figure 6a, we found that the SWM rainfall in the wet region for the 2000–2015 period (704 mm) move leftward from the long-term mean (814 mm) and mean for 1985–1999 (948 mm), and this leftward movement is statistically significant at 90% confidence level. In the late period, the observed leftward movement of the RX5day from the long-term mean suggested that the number of consecutive rainy days over the wet region decreased (148 to 120 days) during the SWM season from 2000 to 2015 (Figure 6d). Notably, we found a statistically significant rightward and leftward mean shift of SDII during the early (11.2 mm/day) and the late period (9.6 mm/day), concerning the long-term mean (10.4 mm/day). The findings suggested that daily rainfall intensity was reduced over the wet region during the 2000–2015 period (Figure 6g). Similarly, the mean value of R25 in the SWM season also depicts a statistically significant difference between the early (1985–1999; 9.6 days) and late (2000–2015; 4.6 days) period (Figure 6j).
Compared to the long-term mean of NEM rainfall (503 mm) over the intermediate region, the mean moved during the 1985–2005 and 2006–2015 periods (Figure 6b), indicating more rainfall during the NEM season for the 2005–2015 period. Similarly, the mean of the RX5day and R25 between the early (1985–2005) and late (2006–2015) periods show a statistically significant difference (Figure 6e–k). Furthermore, SDII in the late (2006 to 2015; 15.22 mm/day) period depicts a statistically significant right shift from the long-term mean, as shown in Figure 6h. We found that strengthening SDII in the intermediate region after 2005 will increase the risk of landslides over the hilly areas in the intermediate zone. The climatological mean of NEM rainfall over the dry region is 538 mm, which further increased up to 630 mm during the 2005–2015 period. Considering the early period (1985–2005), rainfall increased by 92 mm in the late period (Figure 6c).
Furthermore, we detected a statistically significant rightward mean shift during the late period. In the dry region, relative to the long-term mean of RX5day, the rightward shift of the mean in the late period is observed (Figure 6f). As a result of increasing flood-producing events (RX5day) during the NEM season from 2005 to 2015, the lowland areas of the intermediate and dry regions are susceptible to floods. The result indicated that the R25 extreme events during the NEM season became more frequent over the intermediate and dry regions after 2005 (Figure 6l). The result also revealed that the frequency of occurrence, duration, and magnitude of rainfall extremes during the SWM season in the wet region is less for the late period (2000–2015), and it is coherent with the decadal variability of SWM in the wet region. Furthermore, the results showed that the wet region became dry during the 2000–2015 period, resulting in more dry extreme events over the wet region. In contrast, we found that the aforementioned characteristics of the NEM season over the intermediate and dry regions have strengthened after 2005.
3.5. Moisture Transport and Its Divergence in Contrast to Monsoon Years
It is established that large-scale convergence, rather than locally enhanced evaporation, controls the precipitation patterns in the tropics [60,61]. Therefore, analysis of the moisture transport and its divergence/convergence provides insights into the major modes of precipitation variability over the MRB, and the moisture sources themselves. Climatological vertical integrated moisture flux transport towards Sri Lanka is investigated to understand the water vapor supply in strong and weak monsoon years (vectors) in the MRB (Figure 7). Furthermore, the vertically integrated moisture divergence fluxes climatology and contrast monsoon rainfall events during the SWM and NEM seasons have been depicted in the same figure (shaded).
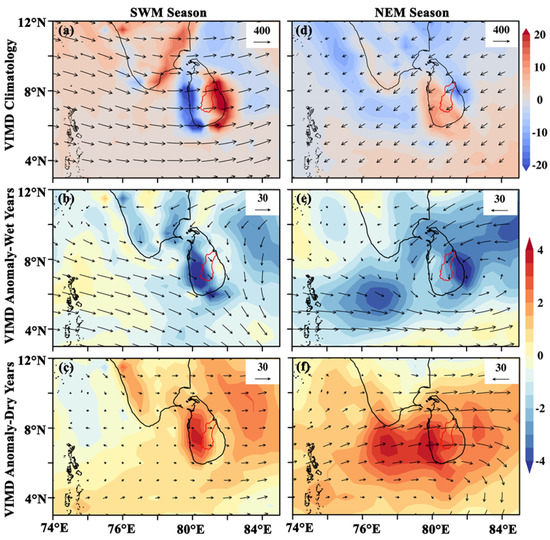
Figure 7.
Vertically integrated moisture flux divergence (VIMD, shaded, unit; 10–6 kg m−2 s−1) superimposed with Vertically integrated moisture flux (VIMT, vector, unit: kg m−1 s−1) for (a) a long-term average of (a) southwest (SWM) seasons. (b) and (c) same as a (a) expect anomalous VIMT superimposed with anomalous VIMT vector for the set of strong and weak SWM years, respectively. The right panels are similar to the left panels (d–f) but for the northeast (NEM) season. The red color polygon depicts the Mahaweli River Basin.
The vertically integrated moisture transport (VIMT) vector from the Arabian Sea direction supplied moisture towards the convention center over Sri Lanka and initiated the SWM rainfall (Figure 7a). Similarly, some studies found that moisture flux from the Western Indian Ocean (Arabian Sea) direction is the most important contributor to the initial phase of the Indian monsoon as compared to moisture flux from the south of the equator direction. Furthermore, the regions that show high vertically integrated moisture flux divergence can be considered potential sources of atmospheric moisture, whereas regions with high convergence are considered potential sink regions [61]. Figure 7a shows climatological mean moisture flux divergence (+value) over the study area. It highlights that more moisture convergence (divergence) occurs in western and southwestern (eastern and southeastern) parts of the county during the SWM season.
Anomalies of water vapor fluxes during the strong SWM years, relative to the climate mean of 1980–2015, are depicted in Figure 7b. Compared to the mean state, the excess moisture fluxes can be seen in the study region, and vectors move towards the south Indian sea direction. In addition, the VIMT vector over the Bay of Bengal and the northern part of Sri Lanka depicts cyclonic VIMT circulation during strong SWM years. In contrast, the weakening of the westerly transport moisture flux can be observed over Sri Lanka and most of the eastern part of the Arabian Sea during weak SWM years (Figure 7c). Consequently, below-average rainfall receives over Sri Lanka during the SWM season.
Similarly, Ratna, et al. [62] found that weakening westerlies reduced the moisture transport towards the southern part of the Western Ghats and local precipitation over India. Considerable spatial variations in the anomalous moisture flux divergence are observed during the contrasting SWM years over Sri Lanka (Figure 7b,c). During strong monsoon years, the area with negative anomalous divergence has been observed over the western and southwestern parts of the country (Figure 7b), and a strong positive anomalous moisture divergence has been recorded in the same region (Figure 7c). Notably, in weak SWM years, divergence fluxes are weak over the Arabian Sea direction compared to the western and southwestern parts of the country. In addition, positive anomalous moisture flux divergence is observed over the Bay of Bengal during the weak monsoon years. Based on Figure 7b,c, it can be concluded that the wet region in Sri Lanka is mostly affected by contrasting SWM rainfall.
As shown in Figure 7d, the easterly wind from the Bay of Bengal direction brings moisture towards the convergence center over Sri Lanka. The northern part of Sri Lanka and the Arabian Sea near the tip of the Indian peninsular showed a large magnitude of VIMT during the NEM season. It further indicates that moisture from the Bay of Bengal direction has converged over the northern and eastern parts of Sri Lanka and the Arabian Sea near the tip of the Indian peninsula. On the other hand, moisture divergence over the western and southern parts of the country is detected during the NEM season (Figure 7d). As a result of the large moisture availability and moisture convergence, the eastern side of the intermediate and dry regions received more rainfall during the NEM season. The observed two convergence centers in two monsoon seasons occurred due to the orography influence of the central mountains.
During the strong NEM years, the above-normal moisture transport is observed all over Sri Lanka except in the southern part of the country. Meanwhile, below-normal moisture transport is detected over the southern Indian Ocean (Figure 7e). In addition, the vectors highlighted cyclonic moisture circulation over Sri Lanka; as a result, the country receives above-average rainfall during the strong NEM period. Meanwhile, moisture convergence in most parts of the country is observed except for the southern part of Sri Lanka and the western part of India. In Sri Lanka, the convergence centers are in the eastern parts of the country during the strong NEM season (Figure 7e). In addition, strong moisture convergence is recorded over the Arabian Sea nearby Sri Lanka. Compared to the mean state, the weak moisture fluxes can be seen in the northern parts of Sri Lanka and the nearby Arabian Sea direction.
In contrast, the southern Indian Ocean depicts moisture surplus during the weak NEM years (Figure 7f), while considerable moisture divergence over the study domain is observed during the weak NEM period compared to strong NEM years (Figure 7f), where the eastern part of Sri Lanka depicts a strong moisture divergence zone. As a result, below-average NEM rainfall was received during the weak NEM years.
3.6. Seasonal Rainfall Extremes Associated with Large-Scale Circulation
It is well known that the Nino3.4 and DMI indices may not be completely independent [63]. Therefore, we evaluated the partial correlation between large-scale circulation indices and extreme rainfall (Table 3). We observed a statistically significant negative correlation between SWM rainfall in the wet region (r = −0.54) and DMI; however, the relationship is weak over the intermediate and dry regions. In addition, DMI positively correlates with SIM rainfall over intermediate (r = 0.45) and dry region s (r = 0.45). As shown in Table 3, the Nino3.4 index shows a negative correlation with SWM rainfall in wet (r = −0.30) intermediate (r = −0.28) and dry (r = −0.17) regions where the wet region recorded a statistically significant relationship. During the NEM season, rainfall in wet (r = −0.30), intermediate (r = −0.31), and dry (r = −0.31) regions depict a statistically significant negative relationship with the Nino3.4 index.
Table 3.
Partial correlation between large-scale oceanic circulation indices with extreme rainfall indices during the first inter-monsoon (FIM), northeast monsoon (NEM), second inter-monsoon (SIM), and the southwest monsoon (SWM) for three climate regions in MRB (1985–2015). The letter “a” indicates a significant correlation at a 90% confidence level. Dipole Mode Index (DMI) and Niño3.4 are selected to represent large-scale oceanic circulation indices.
Interestingly, In the wet region, RX5day, R25; SDII, and R95p showed a statistically significant negative correlation with the DMI index during the SWM season; Furthermore, SDII, R95p in the intermediate region and SDII, R95p, R25 in the dry region exhibit statistically significant positive correlation during the SIM season (Table 3). Most of the rainfall indices showed a weak relationship with the DMI index during the FIM and NEM season. We found that SDII and R95p in all three regions exhibited a statistically significant negative correlation with the Nino3.4 index during the NEM season. Similarly, the extreme rainfall indices in the three climate regions negatively correlated with the Nino3.4 index during the SWM season. Furthermore, we observed that the extreme rainfall events during the FIM and SIM show a weak relationship with the Nino3.4 index. Based on the partial correlation analysis between rainfall and large-scale rainfall indices, the SWM monsoon rainfall and associated rainfall extremes in the wet region have been influenced by the DMI compared to the Nino3.4 index. In contrast, Nino3.4 has more impact on NEM rainfall and extreme rainfall over the intermediate and dry regions in MRB. In addition, the Nino3.4 and DMI have less influence on the rainfall and extreme rainfall events during the FIM season.
4. Discussion
Analysis of precipitation and extreme precipitation events can be used to improve water management strategies, plan agricultural production, and enhance the economic development of a specific region. Therefore, this study has been focused on examining a set of the extreme rainfall indices for the MRB in Sri Lanka; derived from daily precipitation amounts. A group of six descriptive extreme precipitation indices was used and computed at the annual and seasonal scales to explore the changes in the precipitation extremes’ intensity, frequency, and duration over the study basin. To explain the occurrence of extreme rainfall events, moisture flux and its convergence/divergence over the study domain were investigated. Furthermore, the relationship between large-scale oceanic circulation with seasonal rainfall and associated extreme rainfall in the MRB has been evaluated from 1985 to 2015.
As dry and wet spell indices, Consecutive Dry Days (CDD) and Consecutive Wet Days (CWD) are more related to large-scale atmospheric circulation [64]. These two indices can be used to assess the region’s vulnerability to drought [65] and the intensity of flooding [66], respectively. Furthermore, CDD is the only index representing extremely weak rainfall [54]. In this study, CDD in the SWM season does not depict the decadal variation of droughts, suggesting that the average amount of rain per rainy day is decreased, especially in the wet region. The intermediate and dry regions have experienced more wet day rainfall during the NEM season since 2005, indicating that flood events over these two regions are high. Rx5day and SDII further evidence it because the multi-day rainfall event such as RX5day is an indicator of flood-producing events [67], and SDII measures the average rainfall amount that falls on a wet day in a given year [68,69]. On the other hand, extreme wet events during the NEM season are attributed to an increase in NEM rainfall. Similarly, Naidu, et al. [70] revealed that NEM rainfall is increased over the Indian peninsular and Sri Lanka.
We found strengthening of moisture-laden low-level jets from the Arabian Sea in strong (weak) SWM years that brought a large amount of moisture towards Sri Lanka, and more moisture convergence was taken place over the western and southwestern parts (eastern part) of the country, leading to more (less) rainfall during the SWM (NWM?) season over the MRB. On the other hand, strengthening moisture-laden low-level jets from the Bay of Bengal and strong moisture convergence over the eastern part of the country is the leading cause of above-average NEM rainfall over intermediate and dry regions of the MRB. The findings further emphasized that weakening the LLJ from the Arabian Sea (Bay of Bengal) direction and strong moisture flux divergence reduce the SWM (NEM) rainfall and associated rainfall extremes over MRB. IPCC (2013) has also reported that a weakened monsoon will result in a monsoonal rainfall decrease due to the weakening of the tropical meridional overturning circulation. The weakening of monsoon circulation is induced by the warming of the North Indian Ocean, warming over the Pacific warm pool, development of the Asian Brown Cloud, weakening of low-level Somali Jet, and weakening of the tropical easterly jet [70]. The cyclonic activities in the Bay of Bengal and the Arabian Sea are reducing during the summer monsoon season, which brings a substantial amount of rainfall to South Asia [70]; as a result, the rainfall amount received from SWM is reducing with time over the western part of the MRB.
Notably, we observed that SWM rainfall and associated extreme rainfall events over the wet region negatively correlated with the DMI index, which revealed negative IOD events enhance the SWM rainfall over the MRB, especially in the wet region. Additionally, Nino3.4 indicated a negative correlation with SWM rainfall in three regions, which suggested that extreme wet rainfall events are recorded during the La Nina. At the same time, a contrast pattern is observed during the El Nino events. Sengupta and Nigam [71] revealed that El Niño–Southern Oscillation’s (ENSO) impact on NEM rainfall over southeastern peninsular India and Sri Lanka. Similarly, we also found a statistically significant negative correlation between NEM rainfall and the ENSO index. Furthermore, the influence of IOD on NEM rainfall and associated extreme events is weak compared to the NINO3.4 index. Similar to our findings, Kurniadi, et al. [72] found that ENSO and IOD are more closely associated with rainfall and extreme rainfall events in Maritime Continent, with independent, respectively.
This study contributes to understanding the spatiotemporal variation in extreme rainfall in the MRB under climate change. Furthermore, the findings will strengthen water resource management at the basin scale and prevent and mitigate impacts on the regional environment. Although this study depends only on station datasets, the findings highlighted complex inter-scale mechanisms in the formation of heavy rainfall in different climate regions in the MRB. More research is required to explore the spatial variation of seasonal rainfall and extreme rainfall events with varying topography. Additionally, similar studies must be conducted in other major river basins in Sri Lanka, incorporating more observations with long-term data records. The land-use and land-cover changes (LULC), especially urbanization, affect the intensity of extremes and prediction of the long-term trends of extreme precipitation events [73]. Therefore, the influence of LULC on rainfall and extreme rainfall in MRB has to be investigated in future research. The Coupled Model Intercomparison Project Phase 6 (CMIP6) has decent skill in modeling extreme rainfall in comparison to observations [74] that can be used to project the rainfall and rainfall extremes in MRB.
5. Conclusions
The results revealed that extreme rainfall events and associated characteristics such as magnitude, frequency, and duration depend on the seasonal rainfall pattern of the Mahaweli River Basin. Notably, it was revealed that extreme rainfall events in the wet region recorded a positive anomaly during the SWM seasons from 1985 to 1999 period. The negative anomalous of extreme events is dominant after 2000, while the strong decadal variation of extreme events over the wet region is detected during the SWM season, characterized by the decadal shift of SWM rainfall from wet to dry conditions in 2000. We further identified the above-average intensity and magnitude of NEM rainfall over the dry and intermediate regions after 2005, coherent with the annual variation of NEM rainfall over dry and intermediate regions. The detailed investigation of the recent changes in the variability, intensity, frequency, and duration of climate extreme events across the MRB is ultimately helpful in forming a regional strategy for water resource management. It is imperative to provide insight into the linkage between climate change and the hydrological cycle.
Supplementary Materials
The following supporting information can be downloaded at https://www.mdpi.com/article/10.3390/su15065106/s1.
Author Contributions
All authors collaborated in the research presented in this publication by making the following contributions: research conceptualization, S.S.; methodology and formal analysis, S.S.; original draft preparation, S.S. and B.P. All authors have read and agreed to the published version of the manuscript.
Funding
This research received no external funding.
Data Availability Statement
The datasets analyzed in this manuscript are not publicly available. Request to access the datasets should be directed to sranasinghedisanay2@huskers.unl.edu.
Acknowledgments
We are thankful to the Meteorological Department, Sri Lanka, for providing weather data. We thank the Editor and three anonymous reviewers for their comments which helped improve the manuscript.
Conflicts of Interest
The authors declare that the research was conducted in the absence of any commercial or financial relationships that could be construed as a potential conflict of interest.
References
- Mishra, V.; Wallace, J.M.; Lettenmaier, D.P. Relationship between hourly extreme precipitation and local air temperature in the United States. Geophys. Res. Lett. 2012, 39, L16403. [Google Scholar] [CrossRef]
- O’Gorman, P.A. Precipitation Extremes Under Climate Change. Curr. Clim. Chang. Rep. 2015, 1, 49–59. [Google Scholar] [CrossRef] [PubMed]
- Nie, J.; Sobel, A.H.; Shaevitz, D.A.; Wang, S. Dynamic amplification of extreme precipitation sensitivity. Proc. Natl. Acad. Sci. USA 2018, 115, 9467–9472. [Google Scholar] [CrossRef] [PubMed]
- Zhang, X.; Wan, H.; Zwiers, F.W.; Hegerl, G.C.; Min, S.-K. Attributing intensification of precipitation extremes to human influence. Geophys. Res. Lett. 2013, 40, 5252–5257. [Google Scholar] [CrossRef]
- IPCC. Summary for policymakers. In Climate Change 2014: Impacts, Adaptation, and Vulnerability. Part A: Global and Sectoral Aspects. Contribution of Working Group II to the Fifth Assessment Report of the Intergovernmental Panel on Climate Change; Cambridge University Press: Cambridge, UK, 2014. [Google Scholar]
- Andrés-Doménech, I.; García-Bartual, R.; Montanari, A.; Marco, J.B. Climate and hydrological variability: The catchment filtering role. Hydrol. Earth Syst. Sci. 2015, 19, 379–387. [Google Scholar] [CrossRef]
- Woldesenbet, T.A.; Elagib, N.A.; Ribbe, L.; Heinrich, J. Hydrological responses to land use/cover changes in the source region of the Upper Blue Nile Basin, Ethiopia. Sci. Total Environ. 2017, 575, 724–741. [Google Scholar] [CrossRef]
- Troin, M.; Arsenault, R.; Martel, J.-L.; Brissette, F. Uncertainty of Hydrological Model Components in Climate Change Studies over Two Nordic Quebec Catchments. J. Hydrometeorol. 2018, 19, 27–46. [Google Scholar] [CrossRef]
- Chen, J.; Brissette, F.P.; Poulin, A.; Leconte, R. Overall uncertainty study of the hydrological impacts of climate change for a Canadian watershed. Water Resour. Res. 2011, 47, W12509. [Google Scholar] [CrossRef]
- Shelton, S.; Pushpawela, B.; Liyanage, G. The long-term trend in the diurnal temperature range over Sri Lanka from 1985 to 2017 and its association with total cloud cover and rainfall. J. Atmos. Sol.-Terr. Phys. 2022, 227, 105810. [Google Scholar] [CrossRef]
- Ali, H.; Mishra, V. Contrasting response of rainfall extremes to increase in surface air and dewpoint temperatures at urban locations in India. Sci. Rep. 2017, 7, 1228–1243. [Google Scholar] [CrossRef]
- Roxy, M.K.; Ghosh, S.; Pathak, A.; Athulya, R.; Mujumdar, M.; Murtugudde, R.; Terray, P.; Rajeevan, M. A threefold rise in widespread extreme rain events over central India. Nat. Commun. 2017, 8, 708. [Google Scholar] [CrossRef] [PubMed]
- Shelton, S.; Dixon, R.D. Long-Term Seasonal Drought Trends in the China-Pakistan Economic Corridor. Climate 2023, 11, 45. [Google Scholar] [CrossRef]
- Dietzsch, F.; Andersson, A.; Ziese, M.; Schröder, M.; Raykova, K.; Schamm, K.; Becker, A. A Global ETCCDI-Based Precipitation Climatology from Satellite and Rain Gauge Measurements. Climate 2017, 5, 56–65. [Google Scholar] [CrossRef]
- Khan, M.J.U.; Islam, A.K.M.; Das, M.; Mohammed, K.; Bala, S.; Islam, G.M. Observed trends in climate extremes over Bangladesh from 1981 to 2010. Clim. Res. 2019, 77, 45–61. [Google Scholar] [CrossRef]
- Sheikh, M.M.; Manzoor, N.; Ashraf, J.; Adnan, M.; Collins, D.; Hameed, S.; Manton, M.J.; Ahmed, A.U.; Baidya, S.K.; Borgaonkar, H.P.; et al. Trends in extreme daily rainfall and temperature indices over South Asia. Int. J. Climatol. 2015, 35, 1625–1637. [Google Scholar] [CrossRef]
- Goswami, B.N.; Venugopal, V.; Sengupta, D.; Madhusoodanan, M.S.; Xavier, P.K. Increasing Trend of Extreme Rain Events Over India in a Warming Environment. Science 2007, 314, 1442–1445. [Google Scholar] [CrossRef]
- Panda, D.; Kumar, A. The changing characteristics of monsoon rainfall in India during 1971–2005 and links with large scale circulation. Int. J. Climatol. 2014, 34, 3881–3899. [Google Scholar] [CrossRef]
- Basher, M.A.; Stiller-Reeve, M.A.; Saiful Islam, A.K.M.; Bremer, S. Assessing climatic trends of extreme rainfall indices over northeast Bangladesh. Theor. Appl. Climatol. 2018, 134, 441–452. [Google Scholar] [CrossRef]
- Rajbhandari, R.; Shrestha, A.B.; Nepal, S.; Wahid, S.; Ren, G.-Y. Extreme climate projections over the transboundary Koshi River Basin using a high resolution regional climate model. Adv. Clim. Chang. Res. 2017, 8, 199–211. [Google Scholar] [CrossRef]
- Shrestha, A.B.; Bajracharya, S.R.; Sharma, A.R.; Duo, C.; Kulkarni, A. Observed trends and changes in daily temperature and precipitation extremes over the Koshi river basin 1975–2010. Int. J. Climatol. 2017, 37, 1066–1083. [Google Scholar] [CrossRef]
- Subba, S.; Ma, Y.; Ma, W. Spatial and Temporal Analysis of Precipitation Extremities of Eastern Nepal in the Last Two Decades (1997–2016). J. Geophys. Res. Atmos. 2019, 124, 7523–7539. [Google Scholar] [CrossRef]
- Jayawardena, S.; Darshika, D.; Herath, H. Recent Trends in Climate Extreme Indices over Sri Lanka. Am. J. Clim. Chang. 2018, 07, 586–599. [Google Scholar] [CrossRef]
- Shelton, S. Evaluation of the Streamflow Simulation by SWAT Model for Selected Catchments in Mahaweli River Basin, Sri Lanka. Water Conserv. Sci. Eng. 2021, 6, 233–248. [Google Scholar] [CrossRef]
- Wickramagamage, P. Spatial and temporal variation of rainfall trends of Sri Lanka. Theor. Appl. Climatol. 2016, 125, 427–438. [Google Scholar] [CrossRef]
- Pawar, U.; Rathnayake, U. Spatiotemporal rainfall variability and trend analysis over Mahaweli Basin, Sri Lanka. Arab. J. Geosci. 2022, 15, 370. [Google Scholar] [CrossRef]
- Chandrasekara, S.; Prasanna, V.; Kwon, H.-H. Monitoring Water Resources over the Kotmale Reservoir in Sri Lanka Using ENSO Phases. Adv. Meteorol. 2017, 2017, 4025964. [Google Scholar] [CrossRef]
- De Silva, M.T.; Hornberger, G. Identifying ENSO Influences on Rainfall with Classification Models: Implications for Water Resource Management of Sri Lanka. Hydrol. Earth Syst. Sci. Discuss. 2018, 2018, 1–29. [Google Scholar] [CrossRef]
- Zubair, L. El Niño–southern oscillation influences on the Mahaweli streamflow in Sri Lanka. Int. J. Climatol. 2003, 23, 91–102. [Google Scholar] [CrossRef]
- Imbulana, N.; Gunawardana, S.; Shrestha, S.; Datta, A. Projections of extreme precipitation events under climate change scenarios in Mahaweli River Basin of Sri Lanka. Curr. Sci. 2018, 114, 1495–1509. [Google Scholar] [CrossRef]
- Senatilleke, U.; Sirisena, J.; Gunathilake, M.B.; Muttil, N.; Rathnayake, U. Monitoring the Meteorological and Hydrological Droughts in the Largest River Basin (Mahaweli River) in Sri Lanka. Climate 2023, 11, 57. [Google Scholar] [CrossRef]
- Fu, G.; Yu, J.; Yu, X.; Ouyang, R.; Zhang, Y.; Wang, P.; Liu, W.; Min, L. Temporal variation of extreme rainfall events in China, 1961–2009. J. Hydrol. 2013, 487, 48–59. [Google Scholar] [CrossRef]
- Ta, S.; Kouadio, K.Y.; Ali, K.E.; Toualy, E.; Aman, A.; Yoroba, F. West Africa Extreme Rainfall Events and Large-Scale Ocean Surface and Atmospheric Conditions in the Tropical Atlantic. Adv. Meteorol. 2016, 2016, 1940456. [Google Scholar] [CrossRef]
- Onyutha, C. Variability of seasonal and annual rainfall in the River Nile riparian countries and possible linkages to ocean–atmosphere interactions. Hydrol. Res. 2015, 47, 171–184. [Google Scholar] [CrossRef]
- Ntegeka, V.; Willems, P. Trends and multidecadal oscillations in rainfall extremes, based on a more than 100-year time series of 10 min rainfall intensities at Uccle, Belgium. Water Resour. Res. 2008, 44. [Google Scholar] [CrossRef]
- Rajeevan, M.; Bhate, J.; Jaswal, A.K. Analysis of variability and trends of extreme rainfall events over India using 104 years of gridded daily rainfall data. Geophys. Res. Lett. 2008, 35. [Google Scholar] [CrossRef]
- Yadav, R.K.; Roxy, M.K. On the relationship between north India summer monsoon rainfall and east equatorial Indian Ocean warming. Glob. Planet. Chang. 2019, 179, 23–32. [Google Scholar] [CrossRef]
- Malmgren, B.A.; Hulugalla, R.; Hayashi, Y.; Mikami, T. Precipitation trends in Sri Lanka since the 1870s and relationships to El Niño–southern oscillation. Int. J. Climatol. 2003, 23, 1235–1252. [Google Scholar] [CrossRef]
- Ranatunge, E.; Malmgren, B.A.; Hayashi, Y.; Mikami, T.; Morishima, W.; Yokozawa, M.; Nishimori, M. Changes in the Southwest Monsoon mean daily rainfall intensity in Sri Lanka: Relationship to the El Nino-Southern Oscillation. Palaeogeogr. Palaeocl. 2003, 197, 1–14. [Google Scholar] [CrossRef]
- Zubair, L.; Ropelewski, C.F. The Strengthening Relationship between ENSO and Northeast Monsoon Rainfall over Sri Lanka and Southern India. J. Clim. 2006, 19, 1567–1575. [Google Scholar] [CrossRef]
- Rayner, N.A.; Parker, D.; Horton, E.B.; Folland, C.; Alexander, L.; Rowell, D.; Kent, E.; Kaplan, A. Global analyses of sea surface temperature, sea ice, and night marine air temperature since the late Nineteenth Century. J. Geophys. Res. 2003, 108. [Google Scholar] [CrossRef]
- Dee, D.P.; Uppala, S.M.; Simmons, A.J.; Berrisford, P.; Poli, P.; Kobayashi, S.; Andrae, U.; Balmaseda, M.A.; Balsamo, G.; Bauer, P.; et al. The ERA-Interim reanalysis: Configuration and performance of the data assimilation system. Q. J. R. Meteorol. Soc. 2011, 137, 553–597. [Google Scholar] [CrossRef]
- Trenberth, K.E.; Fasullo, J.T.; Mackaro, J. Atmospheric Moisture Transports from Ocean to Land and Global Energy Flows in Reanalyses. J. Clim. 2011, 24, 4907–4924. [Google Scholar] [CrossRef]
- Shelton, S.; Pushpawela, B. Observed southwest monsoon rainfall changes in Sri Lanka and possible mechanisms. Model. Earth Syst. Environ. 2022, 8, 4165–4175. [Google Scholar] [CrossRef]
- de Lima, M.I.P.; Santo, F.E.; Ramos, A.M.; Trigo, R.M. Trends and correlations in annual extreme precipitation indices for mainland Portugal, 1941–2007. Theor. Appl. Climatol. 2015, 119, 55–75. [Google Scholar] [CrossRef]
- Espírito Santo, F.; Ramos, A.M.; de Lima, M.I.P.; Trigo, R.M. Seasonal changes in daily precipitation extremes in mainland Portugal from 1941 to 2007. Reg. Environ. Chang. 2014, 14, 1765–1788. [Google Scholar] [CrossRef]
- Tramblay, Y.; El Adlouni, S.; Servat, E. Trends and variability in extreme precipitation indices over Maghreb countries. Nat. Hazards Earth Syst. Sci. Discuss. 2013, 13, 3235–3248. [Google Scholar] [CrossRef]
- Cheng, A.; Feng, Q.; Fu, G.; Zhang, J.; Li, Z.; Hu, M.; Wang, G. Recent changes in precipitation extremes in the Heihe River basin, Northwest China. Adv. Atmos. Sci. 2015, 32, 1391–1406. [Google Scholar] [CrossRef]
- Aguilar, E.; Peterson, T.C.; Obando, P.R.; Frutos, R.; Retana, J.A.; Solera, M.; Soley, J.; García, I.G.; Araujo, R.M.; Santos, A.R.; et al. Changes in precipitation and temperature extremes in Central America and northern South America, 1961–2003. J. Geophys. Res. Atmos. 2005, 110. [Google Scholar] [CrossRef]
- Vincent, L.A.; Aguilar, E.; Saindou, M.; Hassane, A.F.; Jumaux, G.; Roy, D.; Booneeady, P.; Virasami, R.; Randriamarolaza, L.Y.A.; Faniriantsoa, F.R.; et al. Observed trends in indices of daily and extreme temperature and precipitation for the countries of the western Indian Ocean, 1961–2008. J. Geophys. Res. Atmos. 2011, 116. [Google Scholar] [CrossRef]
- Wang, X.L.; Chen, H.; Wu, Y.; Feng, Y.; Pu, Q. New Techniques for the Detection and Adjustment of Shifts in Daily Precipitation Data Series. J. Appl. Meteorol. Climatol. 2010, 49, 2416–2436. [Google Scholar] [CrossRef]
- Costa, A.C.; Santos, J.A.; Pinto, J.G. Climate change scenarios for precipitation extremes in Portugal. Theor. Appl. Climatol. 2012, 108, 217–234. [Google Scholar] [CrossRef]
- Herrera, G.; Notti, D.; García-Davalillo, J.C.; Mora, O.; Cooksley, G.; Sánchez, M.; Arnaud, A.; Crosetto, M. Analysis with C- and X-band satellite SAR data of the Portalet landslide area. Landslides 2011, 8, 195–206. [Google Scholar] [CrossRef]
- Jiang, F.-q.; Hu, R.-J.; Wang, S.-P.; Zhang, Y.-W.; Tong, L. Trends of precipitation extremes during 1960–2008 in Xinjiang, the Northwest China. Theor. Appl. Climatol. 2013, 111, 133–148. [Google Scholar] [CrossRef]
- Yin, H.; Sun, Y. Characteristics of extreme temperature and precipitation in China in 2017 based on ETCCDI indices. Adv. Clim. Chang. Res. 2018, 9, 218–226. [Google Scholar] [CrossRef]
- Panda, D.K.; Panigrahi, P.; Mohanty, S.; Mohanty, R.K.; Sethi, R.R. The 20th century transitions in basic and extreme monsoon rainfall indices in India: Comparison of the ETCCDI indices. Atmos. Res. 2016, 181, 220–235. [Google Scholar] [CrossRef]
- Manikandan, N.; Das, D.K.; Mukherjee, J.; Sehgal, V.K.; Krishnan, P. Extreme temperature and rainfall events in National Capital Region of India (New Delhi) in the recent decades and its possible impacts. Theor. Appl. Climatol. 2018, 137, 1703–1713. [Google Scholar] [CrossRef]
- New, M.; Hewitson, B.; Stephenson, D.; Tsiga, A.; Kruger, A.; Manhique, A.; Gomez, B.; Coelho, S.; Ntiki Masisi, D.; Kululanga, E.; et al. Evidence of trends in daily climate extremes over southern and west Africa. J. Geophys. Res. 2006, 111, D14102. [Google Scholar] [CrossRef]
- Yeo, M.-H.; Nguyen, V.-T.-V.; Kpodonu, T.A. Characterizing extreme rainfalls and constructing confidence intervals for IDF curves using Scaling-GEV distribution model. Int. J. Climatol. 2021, 41, 456–468. [Google Scholar] [CrossRef]
- Allan, R.P.; Soden, B.J. Large discrepancy between observed and simulated precipitation trends in the ascending and descending branches of the tropical circulation. Geophys. Res. Lett. 2007, 34, L18705. [Google Scholar] [CrossRef]
- Trenberth, K.E.; Dai, A.; Rasmussen, R.M.; Parsons, D.B. The Changing Character of Precipitation. Bull. Am. Meteorol. Soc. 2003, 84, 1205–1217. [Google Scholar] [CrossRef]
- Ratna, S.B.; Cherchi, A.; Joseph, P.V.; Behera, S.K.; Abish, B.; Masina, S. Moisture variability over the Indo-Pacific region and its influence on the Indian summer monsoon rainfall. Clim. Dyn. 2016, 46, 949–965. [Google Scholar] [CrossRef]
- Lestari, S.; King, A.; Vincent, C.; Karoly, D.; Protat, A. Seasonal dependence of rainfall extremes in and around Jakarta, Indonesia. Weather Clim. Extrem. 2019, 24, 100202–100215. [Google Scholar] [CrossRef]
- Casanueva, A.; Rodríguez-Puebla, C.; Frías, M.D.; González-Reviriego, N. Variability of extreme precipitation over Europe and its relationships with teleconnection patterns. Hydrol. Earth Syst. Sci. 2014, 18, 709–725. [Google Scholar] [CrossRef]
- Duan, Y.; Ma, Z.; Yang, Q. Characteristics of consecutive dry days variations in China. Theor. Appl. Climatol. 2017, 130, 701–709. [Google Scholar] [CrossRef]
- Yang, M.; Chen, X.; Cheng, C.S. Hydrological impacts of precipitation extremes in the Huaihe River Basin, China. SpringerPlus 2016, 5, 1731. [Google Scholar] [CrossRef]
- Chen, H.; Sun, J. Changes in climate extreme events in China associated with warming. Int. J. Climatol. 2015, 35, 2735–2751. [Google Scholar] [CrossRef]
- Kusunoki, S.; Arakawa, O. Change in the precipitation intensity of the East Asian summer monsoon projected by CMIP3 models. Clim. Dyn. 2012, 38, 2055–2072. [Google Scholar] [CrossRef]
- Limsakul, A.; Limjirakan, S.; Sriburi, T. Observed changes in daily rainfall extremes along Thailand’s coastal zone. J. Environ. Res. 2010, 32, 49–68. [Google Scholar]
- Naidu, C.V.; Satyanarayana, G.C.; Durgalakshmi, K.; Malleswara Rao, L.; Nagaratna, K. Is winter monsoon rainfall over South Peninsular India increasing in global warming era? Glob. Planet. Chang. 2010, 72, 69–72. [Google Scholar] [CrossRef]
- Sengupta, A.; Nigam, S. The northeast winter monsoon over the Indian subcontinent and Southeast Asia: Evolution, interannual variability, and model simulations. J. Clim. 2019, 32, 231–249. [Google Scholar] [CrossRef]
- Kurniadi, A.; Weller, E.; Min, S.-K.; Seong, M.-G. Independent ENSO and IOD impacts on rainfall extremes over Indonesia. Int. J. Climatol. 2021, 41, 3640–3656. [Google Scholar] [CrossRef]
- Falga, R.; Wang, C. The rise of Indian summer monsoon precipitation extremes and its correlation with long-term changes of climate and anthropogenic factors. Sci. Rep. 2022, 12, 11985. [Google Scholar] [CrossRef] [PubMed]
- Li, C.; Zwiers, F.; Zhang, X.; Li, G.; Sun, Y.; Wehner, M. Changes in annual extremes of daily temperature and precipitation in CMIP6 models. J. Clim. 2021, 34, 3441–3460. [Google Scholar] [CrossRef]


Disclaimer/Publisher’s Note: The statements, opinions and data contained in all publications are solely those of the individual author(s) and contributor(s) and not of MDPI and/or the editor(s). MDPI and/or the editor(s) disclaim responsibility for any injury to people or property resulting from any ideas, methods, instructions or products referred to in the content. |
© 2023 by the authors. Licensee MDPI, Basel, Switzerland. This article is an open access article distributed under the terms and conditions of the Creative Commons Attribution (CC BY) license (https://creativecommons.org/licenses/by/4.0/).