Article

Hydraulic Characteristics of Continuous Submerged Jet Impinging on a Wall by Using Numerical Simulation and PIV Experiment

1
College of Mechatronics Engineering, Hainan Vocational University of Science and Technology, Haikou 571126, China
2
Department of Energy and Power Engineering, Tsinghua University, Beijing 100084, China
3
College of Hydraulic Science and Engineering, Yangzhou University, Yangzhou 225009, China
4
School of Aerospace and Mechanical Engineering/Flight College, Changzhou Institute of Technology, Changzhou 213032, China
5
National Research Center of Pumps, Jiangsu University, Zhenjiang 212013, China
*
Author to whom correspondence should be addressed.
Sustainability 2023, 15(6), 5159; https://doi.org/10.3390/su15065159
Submission received: 30 January 2023 / Revised: 4 March 2023 / Accepted: 10 March 2023 / Published: 14 March 2023

Abstract

:
Due to their high efficiency, low heat loss and associated sustainability advantages, impinging jets have been used extensively in marine engineering, geotechnical engineering and other engineering practices. In this paper, the flow structure and impact characteristics of impinging jets with different Reynolds numbers and impact distances are systematically studied by Flow-3D based on PIV experiments. In the study, the relevant state parameters of the jets are dimensionlessly treated, obtaining not only the linear relationship between the length of the potential nucleation zone and the impinging distance, but also the linear relationship between the axial velocity and the axial distance in the impinging zone. In addition, after the jet impinges on the flat plate, the vortex action range caused by the wall-attached flow of the jet gradually decreases inward with the increase of the impinging distance. By examining the effect of Reynolds number Re on the hydraulic characteristics of the submerged impact jet, it can be found that the structure of the continuous submerged impact jet is relatively independent of the Reynolds number. At the same time, the final simulation results demonstrate the applicability of the linear relationship between the length of the potential core region and the impact distance. This study provides methodological guidance and theoretical support for relevant engineering practice and subsequent research on impinging jets, which has strong theoretical and practical significance.

1. Introduction

The submerged impinging jet is the impinging flow of a free jet against a solid wall or a flexible wall in a homogeneous media-filled environment. Impinging jets have a wide range of applications in many practical projects. For example, in subsea dredging, it avoids the frictional losses of traditional mechanical excavation methods and reduces costs. In geotechnical excavation, high-pressure water jets have the advantage of being highly efficient, dust-free and low-heat. Therefore, the water jet operation method is a sustainable non-mechanical operation method [1,2,3]. For this reason, research related to impinging jets has been a hot topic. The flow characteristics of a submerged impinging jet depend on various factors such as the shape of the nozzle, the radius of the nozzle, the height of the impingement, the angle of the impingement and the flow state of the ambient fluid [4,5,6,7,8]. A large number of experimental studies have been conducted for submerged impinging jets, mainly by Particle Image Velocimetry (PIV) [9,10,11], Laser Doppler Velocimetry (LDV) [12,13,14] and Laser-Induced Fluorescence (LIF) [15,16,17]. Numerous researchers have obtained a large number of results using the above-mentioned experimental techniques, including structural differences in the development of impinging jets under different working conditions, the coupling effect between the structure of impinging jets and the impinging pressure, the coiled suction effect of impinging jets and the energy ex-change characteristics with the ambient fluid, the vortex structure generation law of the ambient fluid, etc. In addition to experimental studies, optimization of algorithms [18,19], modeling of the problem to be solved [20,21], and CFD (Computational Fluid Dynamics) techniques, which have developed rapidly in recent years, are also important tools for the study of jets. Long et al. [22] proposed a design guideline for the nozzle distance of jets based on the law of turbulent jet development and compared the performance of two-phase CO2 injectors with different nozzle distances using CFD simulations. Ni et al. [23] used CFD numerical calculation methods as a means of assessing the performance of dredging jet pumps, and used Design of Experiment (DOE) methods to effectively analysis the sensitivity of design parameters to dredging performance and the interaction between parameters. Zhang et al. [24] used a version of the RNG k-ε turbulence model and R600a working fluid to investigate the effect of nozzle position on entrainment ratio, pressure lift ratio and the performance of the ejector. Fu et al. [25] established an axisymmetric two-dimensional mathematical model for transonic compressible flow inside a steam ejector to investigate the flow characteristics inside steam ejectors, aiming at optimizing primary steam nozzle outlet section distance and mixing chamber throat diameter simultaneously. Lucas et al. [26] used the computational fluid dynamics simulation software Fluent to establish a two-phase flow CO2 ejector heterogeneous model using a numerical simulation of the internal flow field of a CO2 injector based on a non-homogeneous phase model. The phase change, pressure and velocity changes of the internal flow field of the ejector were analyzed. Ma et al. [27] established a rock breaking model based on the SPH method by using the constitutive relation of abrasive material, the corresponding material parameters and the state equations to analyze the particular feature of rock deformation and breakage in oil and gas resources exploitation. He et al. [28] established a coupling model for simulating the rock mass destruction process under the impact of a high-pressure water jet based on the arbitrary Lagrangian-Eulerian finite element method (ALE-FEM). Guo et al. [29] used CFD methods to numerically simulate the flow field inside the multi-port jet wind field model, in order to analyze the flow characteristics of the wind field under the action of a multi-port jet fan. The effects of different nozzle numbers and arrangements on the performance of the flow field were compared and analyzed, and the vortex dynamics theory was introduced to analyze the development of the distribution of the vortex structure in the flow field and its effect on fluid mixing. Most of the above scholars used ANSYS Fluent as a means of numerical simulation. However, Flow-3D as a unique CFD solution technology [30,31,32], often used in areas such as marine engineering and hydraulic engineering, has rarely been used for research in the field of impinging jets. At the same time, the velocity decay characteristics of the impinging jet and its coupling characteristics with the ambient fluid are still a hot topic of research in related fields, and no systematic conclusions and explanations have been formed for the above-mentioned hot topics. At present, there are many scholars who do not stick to one tool alone, but use both experiment, numerical simulation and theoretical analysis to investigate the object of study [11,33,34,35,36,37,38].
Therefore, this paper is based on the fluid simulation technology Flow-3D, combined with some experimental data from Wang et al. [39]. This study investigates the accuracy and applicability of Flow-3D in simulating the impinging of continuous submerged jets on a wall, focusing on the flow structure and velocity decay characteristics of the impact region of the impinging jet to analyze the effect of the two parameters on the hydraulic characteristics of the impinging of continuous submerged jets on a wall by varying the impinging distance and Reynolds number. This study is intended to provide strong support for the subsequent research and development of impinging jet technology.

2. Governing Equations and Turbulence Model

The continuous submerged jet in this article is a fully developed turbulent flow, in which the turbulent kinetic energy contained in the jet is rapidly exchanged with the ambient fluid upon impacting the wall, accompanied by the generation of a large number of non-constant flow structures. In view of the above characteristics of the submerged impinging jet, the RNG k-ε turbulence model is proposed to be used for the related flow prediction. The RNG k-ε turbulence model [40] corrects the turbulent viscosity coefficient and therefore has a greater advantage in describing low-intensity turbulence and flows with strong shear zones with the following equation:
k t + u j k x j   =   v t ( u i u j + u j x i ) u i x j + x j ( α k v e f f ) k x j ε
ε t + u j ε x j   =   c ε 1 ε k v t ( u i x j + u j x i ) u i x j + x j ( α ε v e f f ε x j ) c ε 2 ε 2 k c μ η 3 ( 1 η η 0 ) ε 2 ( 1 + c 3 η 3 ) k
v e f f   =   v t ( 1 + c μ k μ ε ) 2
η   =   ( u i x j + u j x i ) u i x j k ε
where: vt is the eddy current viscosity coefficient, μ is the dynamic viscosity coefficient, the empirical constants cε1 and cε2 are 1.42 and 1.68, respectively, c3 = 0.012, η0 = 4.38, cμ = 0.085, the Prandtl numbers αk and αε correspond to the turbulent kinetic energy k, and dissipation rate ε, which are both 0.7194.

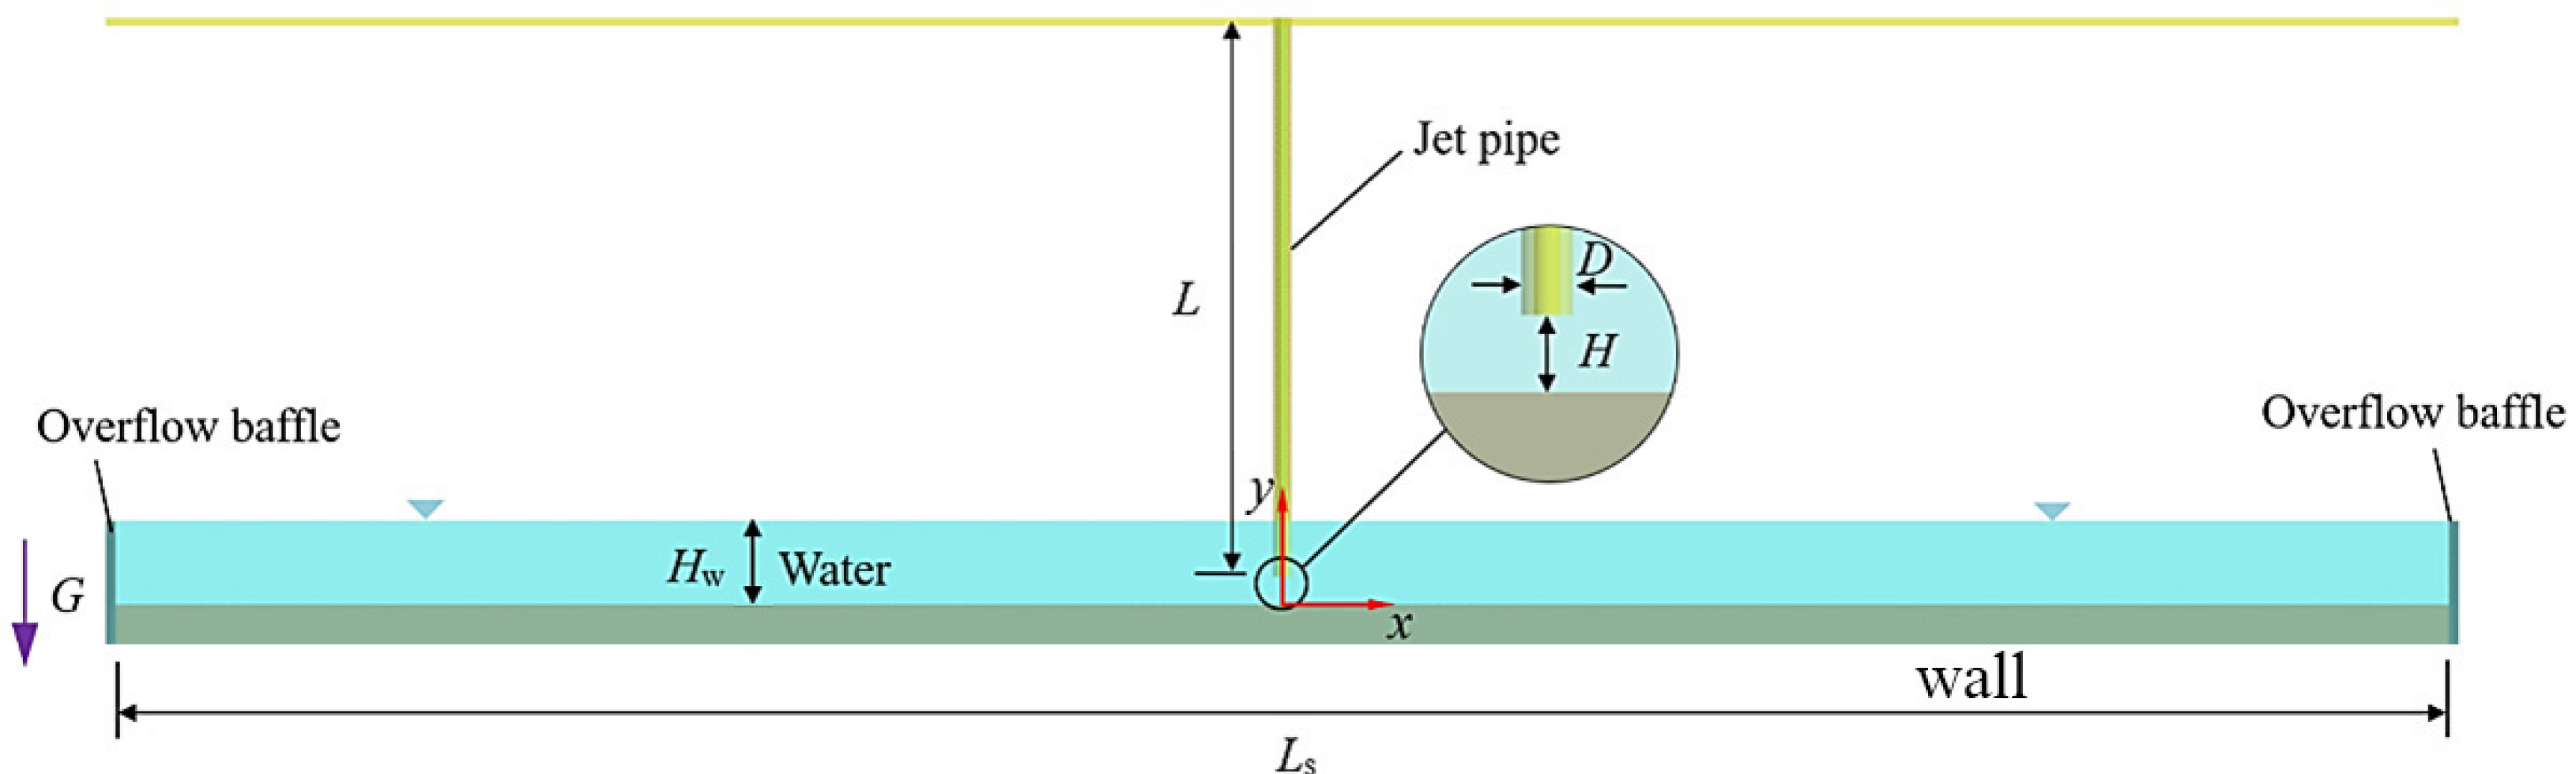
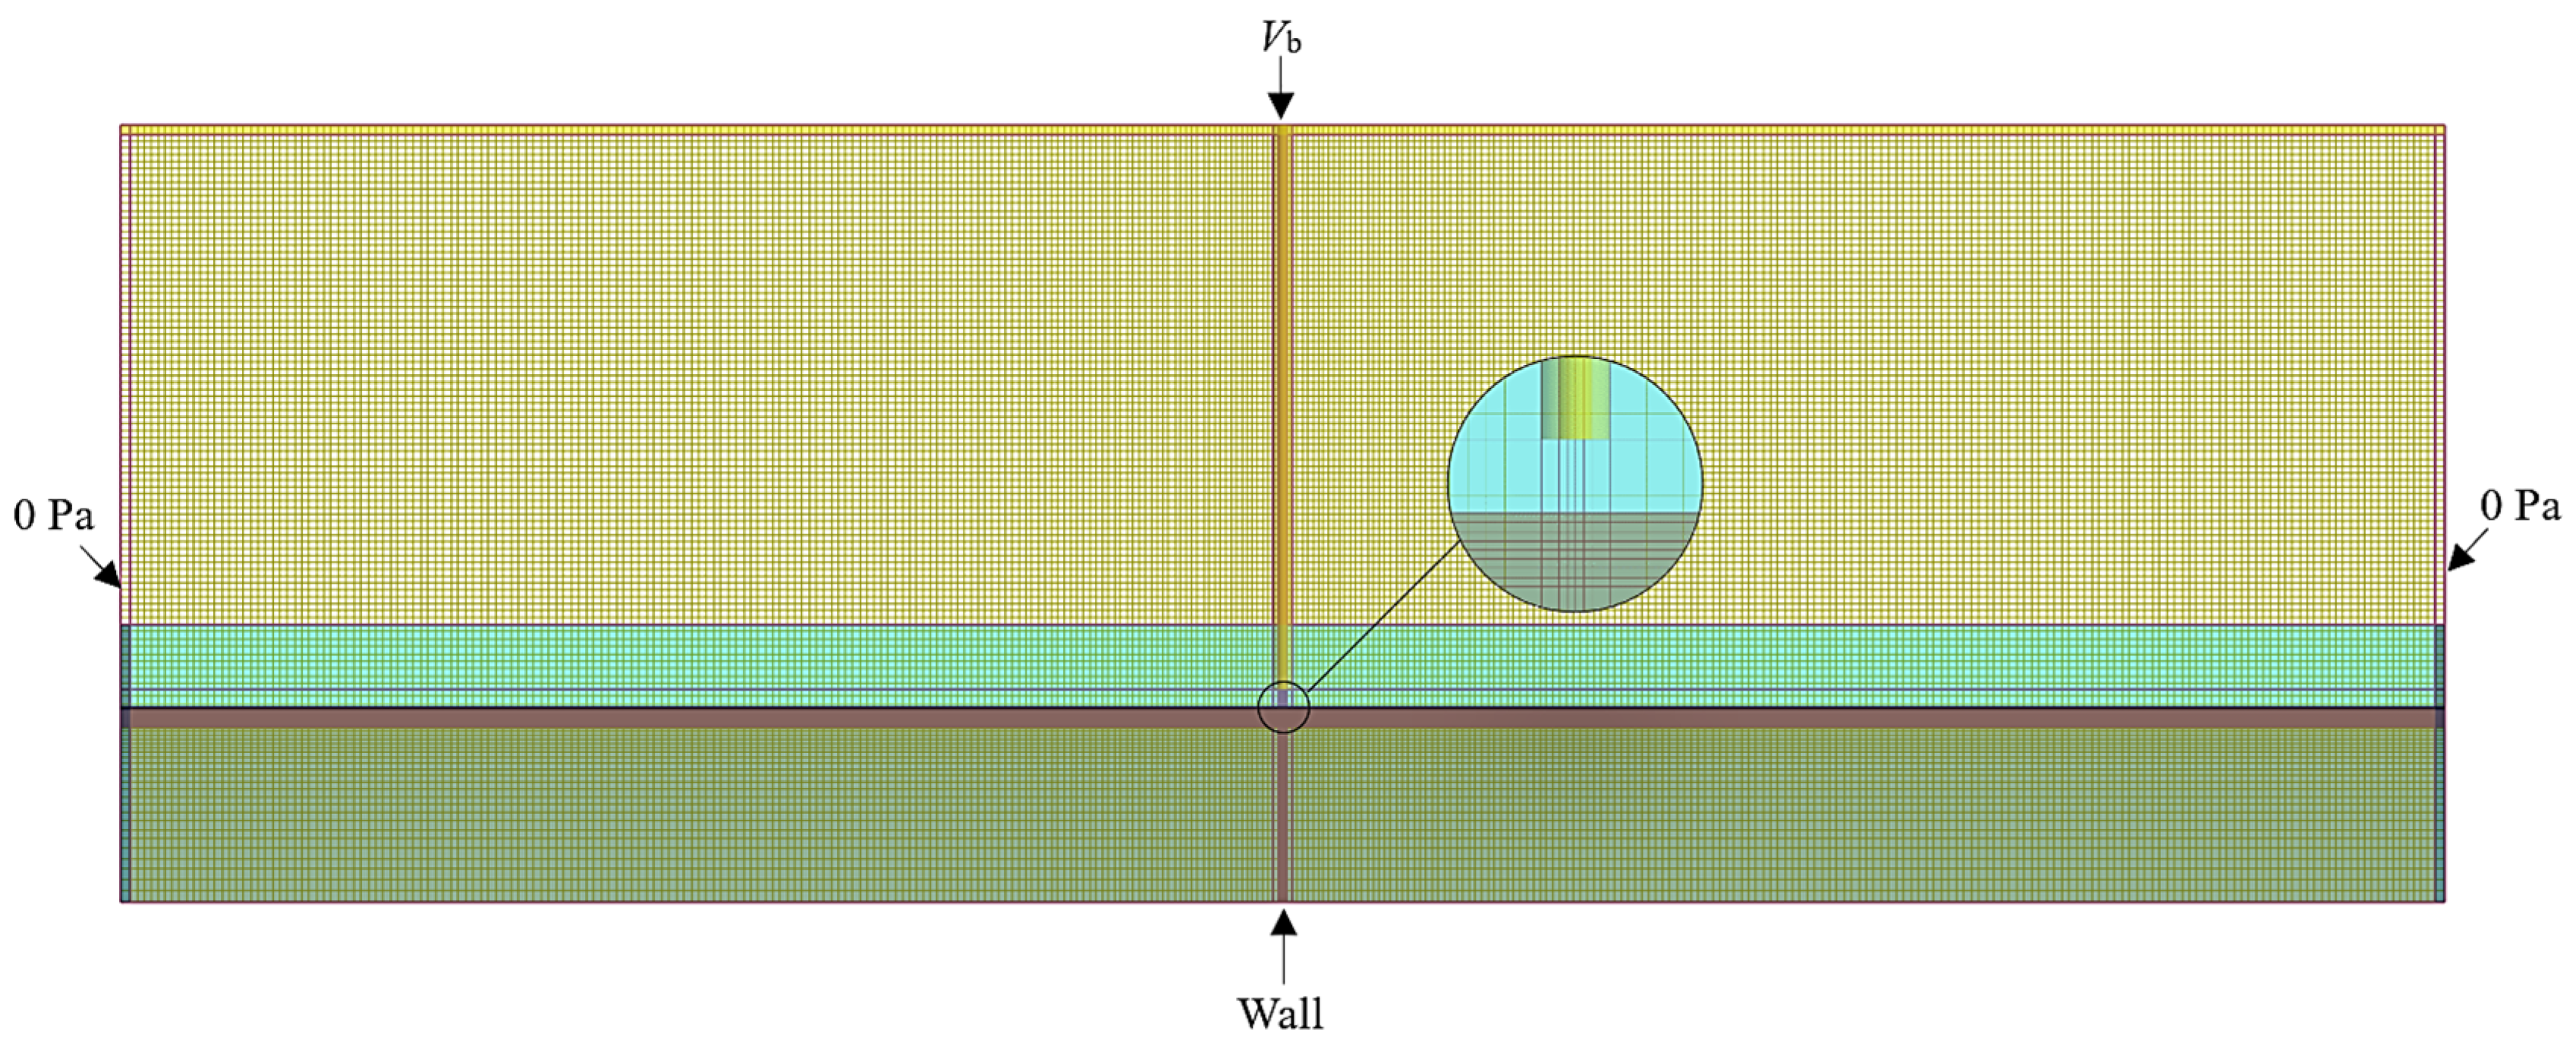
3. Calculation Regions and Boundary Conditions

The geometric model is shown in Figure 1; it consists of three parts: jet pipe, overflow baffle and solid wall. The inner diameter D of the jet pipe is 20 mm, length L is 1200 mm, so the aspect ratio L/D is 60. It ensures that the turbulent flow at the outlet of the jet pipe is fully developed. The vertical distance between the center of the jet pipe and the surface of the solid wall of the jet pipe is H. The initial water height Hw is 180 mm, and the overflow baffle keeps the water level constant. In order to match the numerical calculation with the experiments described below, a solid wall with a length Ls of 5000 mm is set.
The computational domain and grid division are shown in Figure 2, and the whole computational domain is covered by only one block. Due to the large ratio of the length and diameter of the pipe, the turbulent effect at the outlet of the jet pipe is stronger, and the action between the jet and the wall surface is intense. In order to predict the development of the jet more accurately, the grid of the jet pipe and the solid wall surface area is locally encrypted. The overflow baffle is located on the left and right side of the entire calculation domain, low grid coverage. It is easy to cause the bezel to be incomplete or displayed after favorize. Therefore, a grid node is set at both ends of the baffle to ensure that the baffle can display and function normally.
The form of the grid in Flow-3D is a structured finite difference grid. Unlike the common CFD grids, Flow-3D grids are less accurate in describing complex geometries and must be locally encrypted. The grid covers the whole model and is fully institutional, so it has high computational efficiency and the accumulated error values are small. In order to save computational time and to obtain the flow characteristics of a typical mid-section of an impinging jet, the model as a whole is meshed with a two-dimensional structured grid and the area between the outlet of the jet pipe and the impinging plane is encrypted. The grid size of the encrypted area is 5 mm × 5 mm, and the ratio of the size of the encrypted area to that of the ambient fluid grid cannot exceed 1:3 in order to ensure the computational quality, so the grid length of the ambient fluid is taken as 12 mm, and the boundary layer is encrypted. The upper boundary of the grid area is set as the velocity inlet, the direction is vertical downward, and the size is Vb (Vb is the average velocity of the section at the outlet of the jet pipe). The lower boundary is set as the wall boundary, and the fluid cannot cross this boundary. The left and right boundaries are set as the pressure boundary, the pressure on the specified boundary is 0 Pa and the water level is 180 mm.

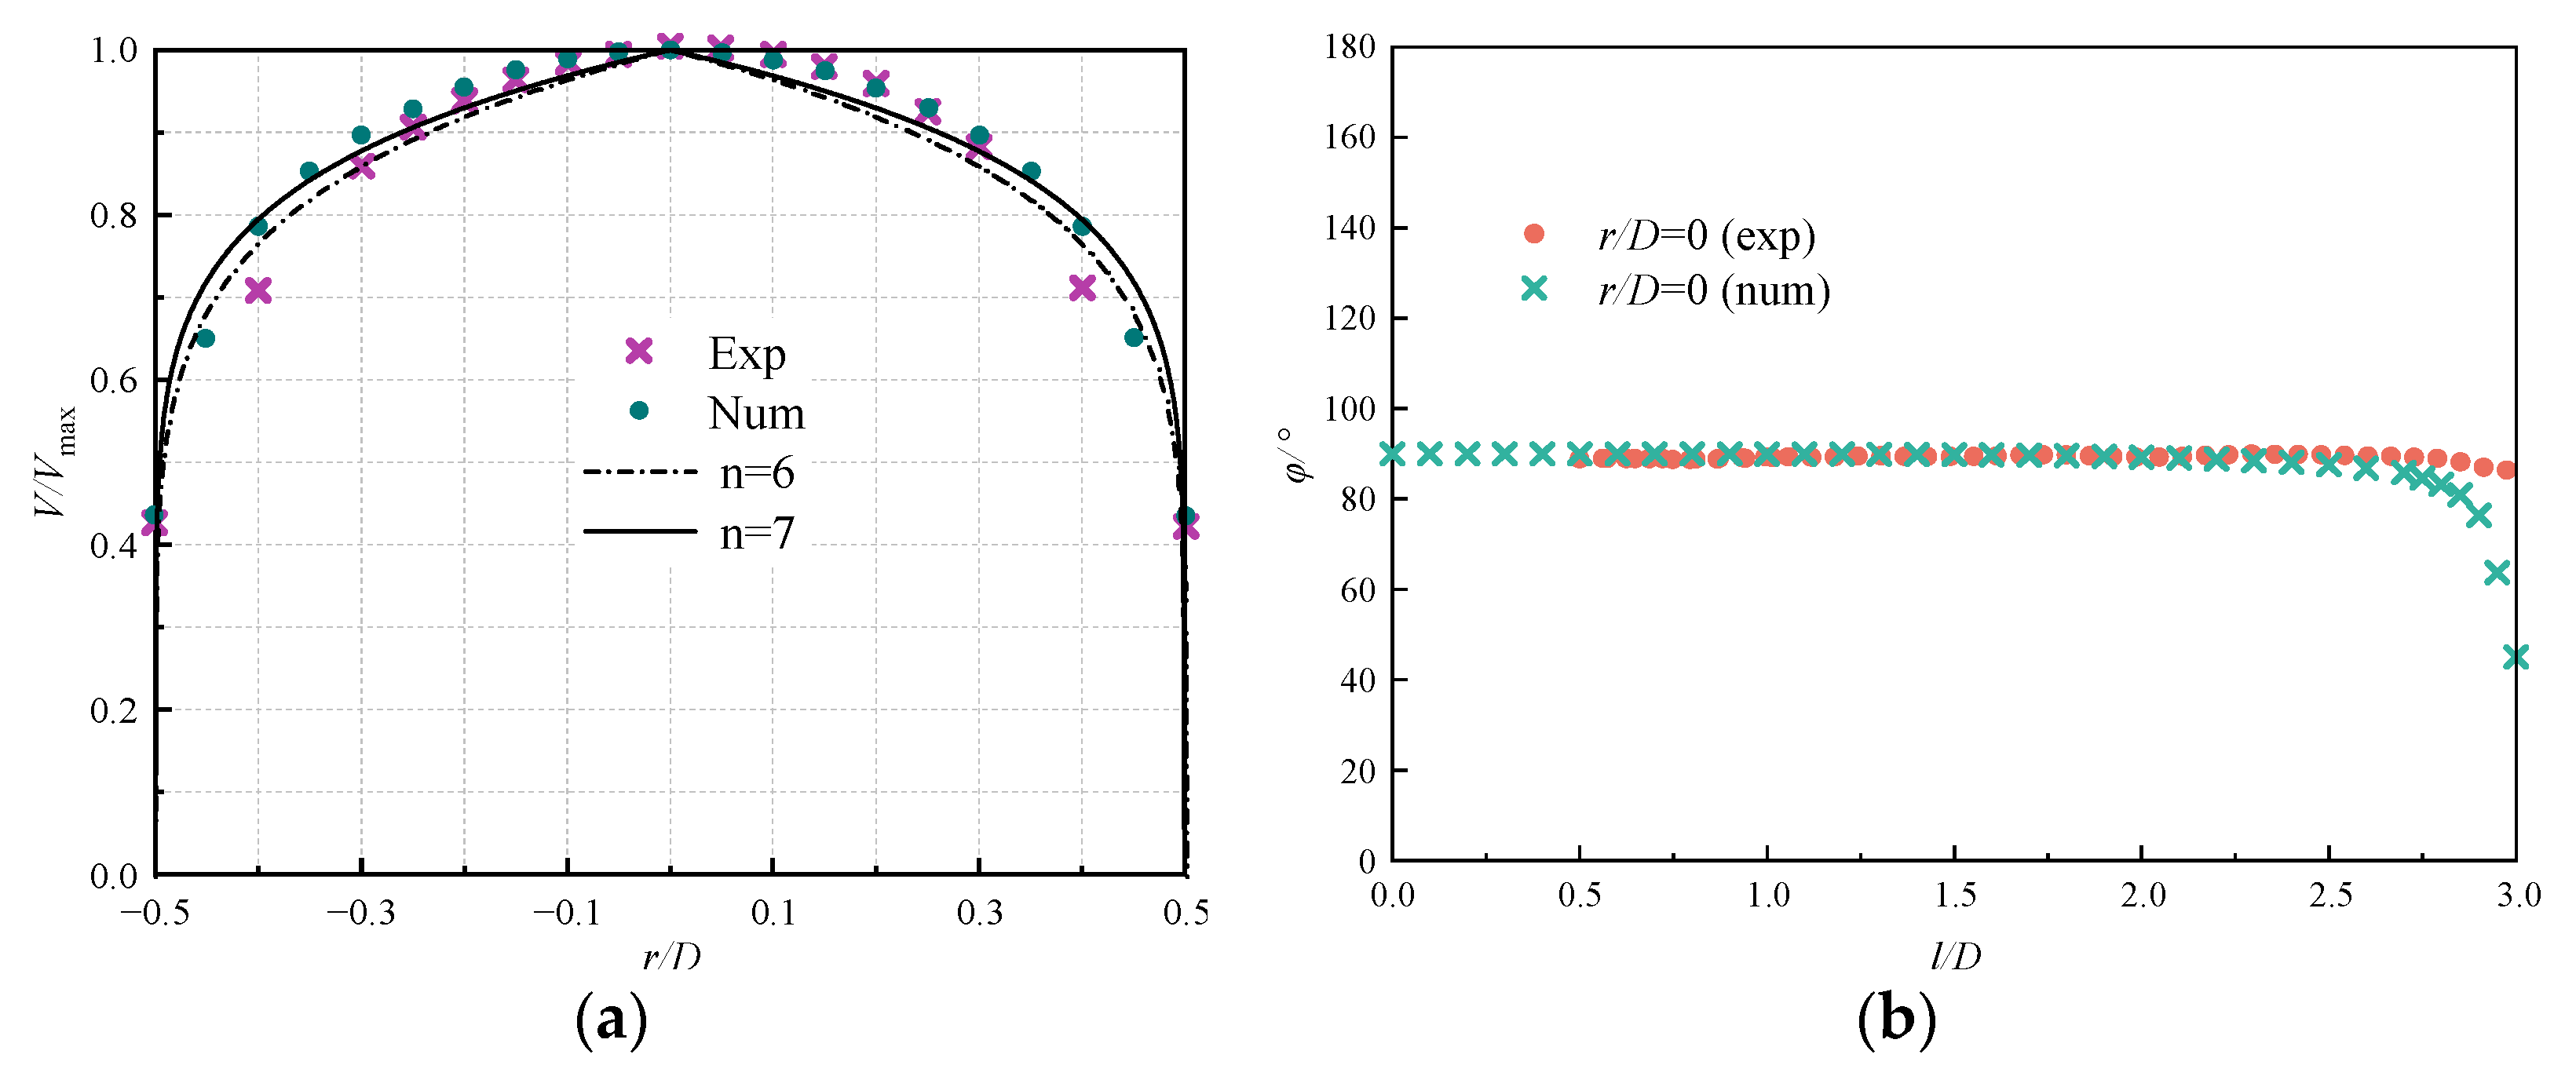
4. Experimental Verification

As in the previous experimental work on impinging jets by the group [41], the experimental setup for an impinging jet on the wall is shown in Figure 3a. The experimental device consists of five parts: jet pipe, water tank, solid wall, piping system and measuring system. The geometry of the numerical model is consistent with its dimensions. The dimensions of the experimental tank are 5000 mm × 350 mm × 400 mm (length × width × height). Its side walls and base are made of transparent glass. The vertical distance between the inner water level and the plate is 180 mm. The jet pipe adopts a straight brass pipe with an inner diameter of D = 20 mm and a length of L = 1200 mm; that is, a length-diameter ratio of 60, to ensure that the turbulent flow at the outlet of the pipe is fully developed. The piping system consists of submersible centrifugal pumps, flow meters, valves and water pipelines. The reading of the flow meter Q is the flow rate in the jet pipe. It is worth noting that the impact angle θ of the jet can be adjusted by the angle disk in the experimental setup in the range of 0° to 90°. In the experiment, the two-dimensional PIV system of the LaVision model is used to capture and measure the velocity of the jet and the direction of the fluid flow in the impact region. Two Yttrium-Aluminum Garnet (YAG) pulsed lasers are placed on the lower side of the water tank with a laser wavelength of 532 nm, a single pulse energy of 135 mJ and a duration of 5 ns. Hollow glass beads are used as tracer particles with a particle diameter of 10–15 μm and a relative degree of 1.05–1.15. The particle image information of the test area is recorded by a 12-bit CCD digital camera with a spatial resolution of 1600 × 1200 pixels and a maximum sampling frequency of 15 Hz. Figure 3b shows the PIV image of the impact region of the jet at Re = 23,400 and H/D = 3 operating conditions [42].
To verify the reliability of the numerical simulation, the impinging distance H in the geometry model parameters is set to 3D (60 mm). The flow velocity in the pipe is set to 1.18 m/s. At this point, the Reynolds number in the circular pipe can be calculated using the following equation:
R e   =   d v ρ μ
where d is the pipe diameter, m; v is the fluid flow rate, m/s; ρ is the fluid density, kg/m3; μ is the dynamic viscosity of the fluid, Pa·s. Therefore, the Reynolds number in the circular pipe can be found as 23,400.
Figure 4a compares the calculated V/Vmax (Vmax is the maximum velocity at the exit of the jet pipe) curve with the empirical formula V/Vmax = (1–2r/D)1/n for the fully developed turbulent velocity distribution of the circular pipe and the results obtained from the model experiment. When n is 6 or 7, the empirical formula is considered to be approximately consistent with the fully developed turbulent velocity distribution of the circular pipe. As can be seen from the figure, the results of the submerged impinging jet applying the RNG k-ε turbulence model are in good agreement with the empirical formulation and the results of the model experiments, indicating not only that the flow at the jet outlet is a fully developed circular pipe turbulence, but also that the RNG k-ε turbulence model is suitable for the numerical simulation of the current model. Figure 4b shows the same corroboration of the above point, from which it can be seen that the numerical results of the axial flow angle of the jet are in good agreement with the experimental results, especially during the development of the jet. However, it is undeniable that there are still some differences between the two in the impact region. It can be noted that the fluid diffusion in the impact region in the experiments is small and the flow angle does not change much, while the results of numerical simulations show that the flow angle of the fluid in the jet decreases rapidly during the impingement process, but the trend of change remains consistent with the experimental results. Considering the accidental or systematic errors between numerical simulation and experiment, the experimental and numerical simulation results can be considered to be well matched.

5. Results and Discussion

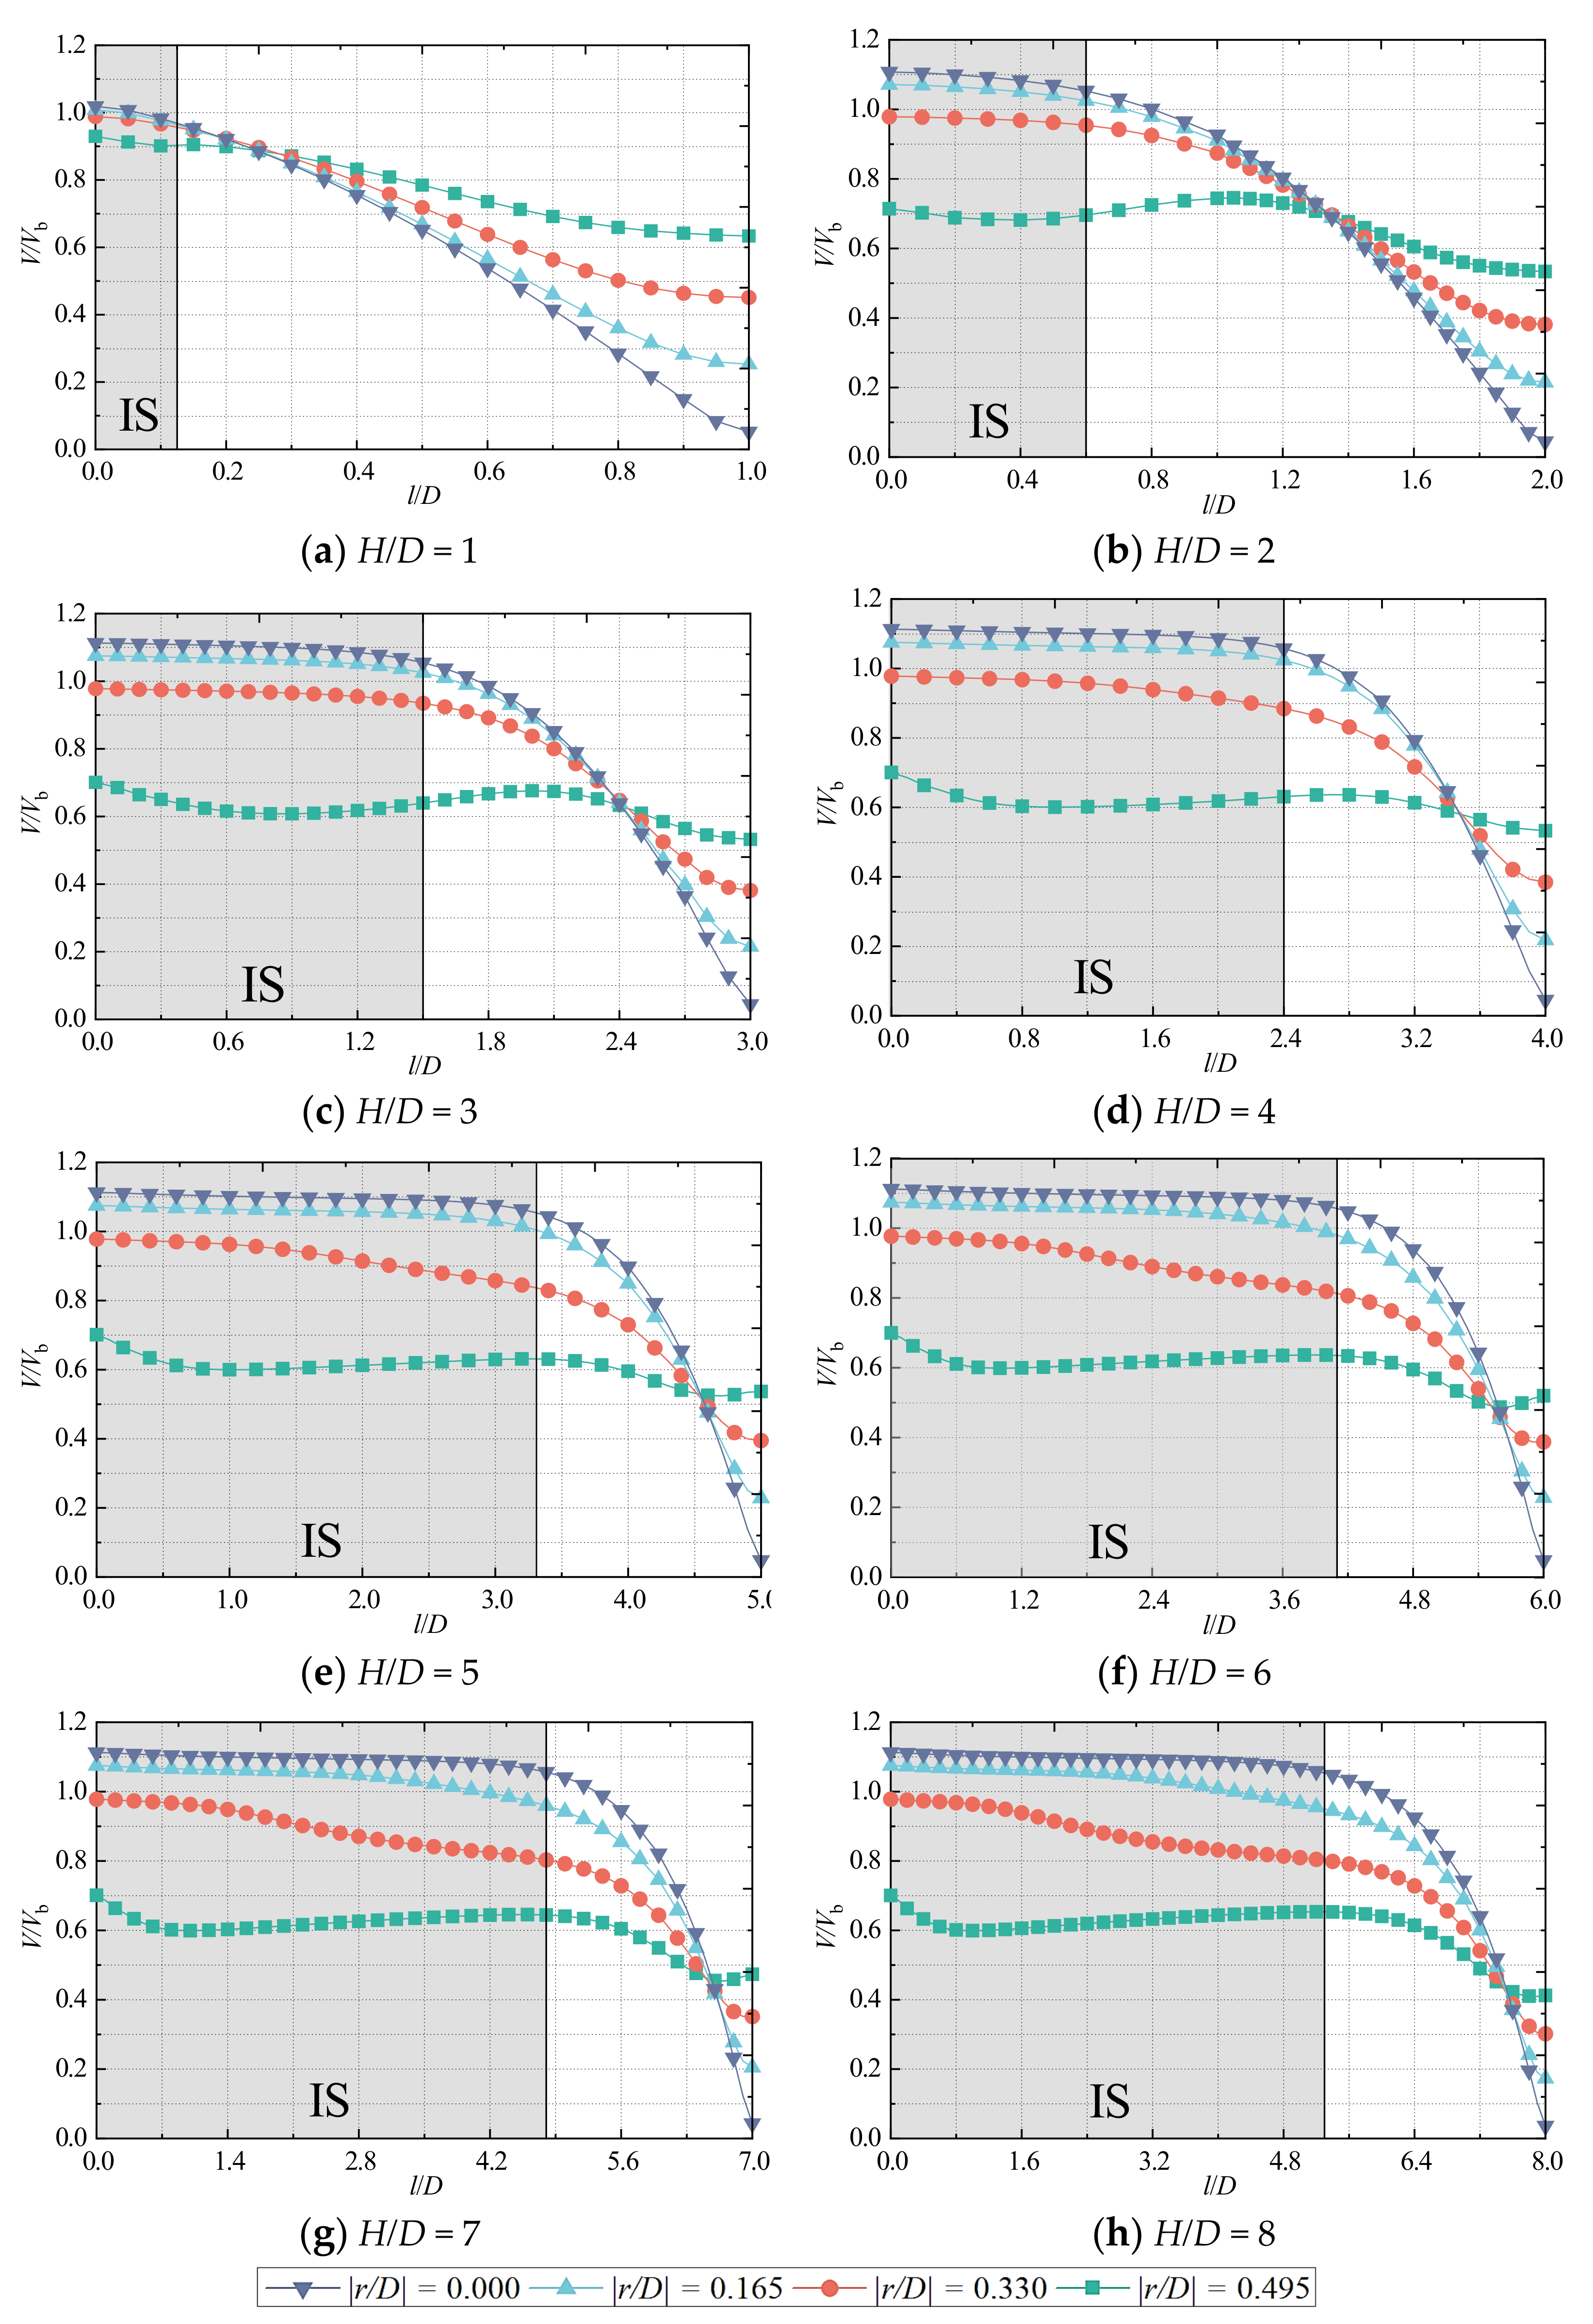
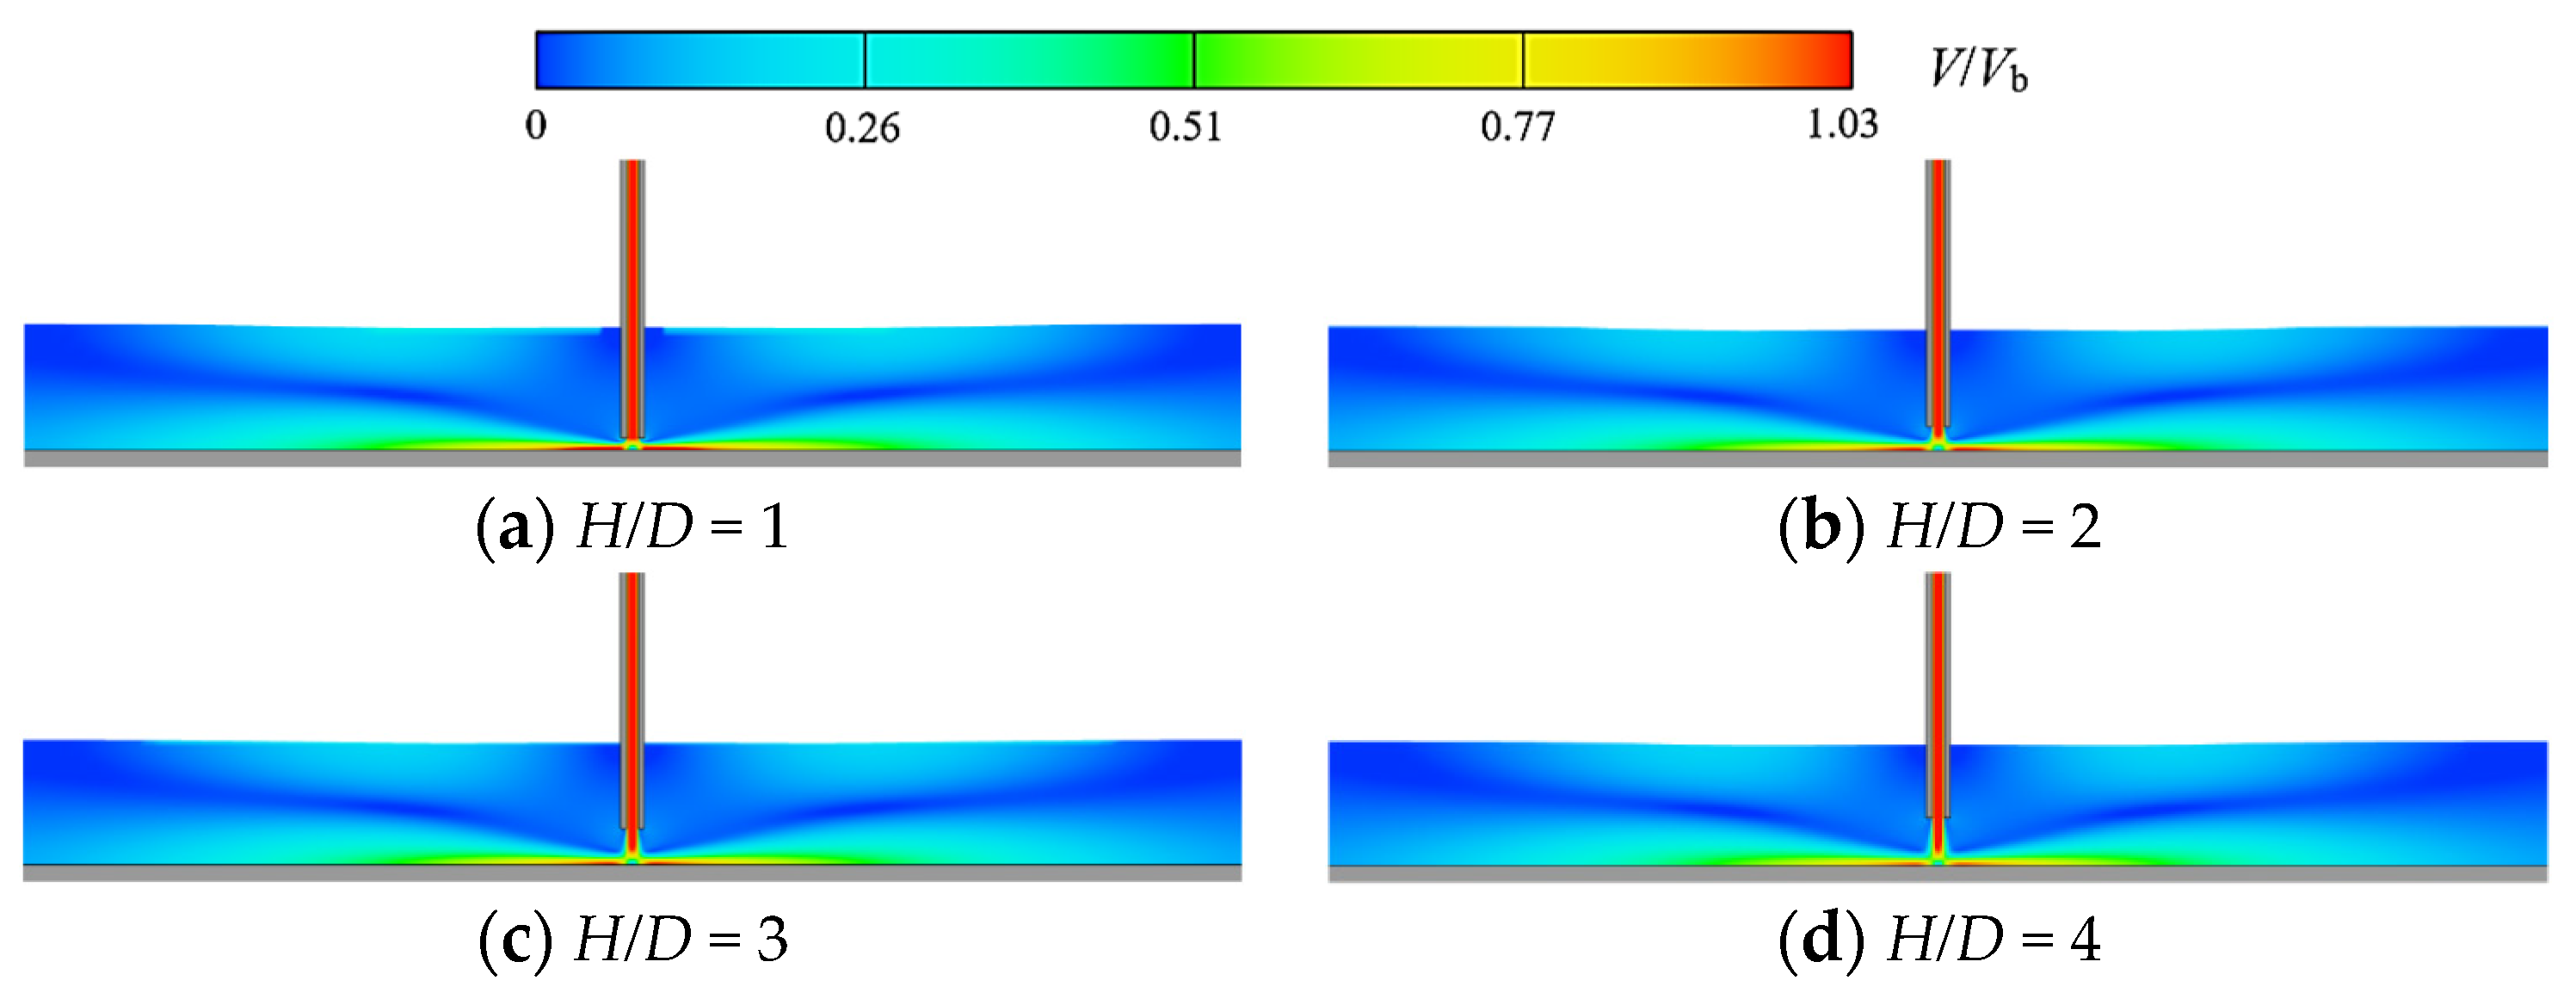
5.1. Flow Field Analysis of Submerged Jet under Different Impinging Distances

Figure 5 shows the axial distribution of the jet at different radial positions (r/D = 0, ±0.25 and ±0.5) V/Vb at different impinging distances for a Reynolds number Re of 23,400. As can be seen from the figure, regardless of the value of the impinging distance, at r/D = 0 (at the axis of the jet pipe), V/Vb first remains constant and then starts to fall, where this distance at which the velocity remains constant is called the length of potential core region Hp/D (Hp is the absolute length of the potential core region). The length of the potential core region Hp/D determined by the “95% guideline” [43]. That is, the axial length from the hole to the point where um decays to 0.95 uj (outlet velocity of the jet pipe). The figure shows that the length of the potential core region Hp/D and the distance from the end of the potential core region to the impinging plate (H/D-Hp/D) both increase with the increase of the impinging distance H/D. This is consistent with the conclusions drawn in the literature [44]. In the initial segment (IS), when r/D = ±0.5, V/Vb first decreases and then increases. The reason is that r/D = ± 0.5 of the radial position of the jet leaving the jet pipe first by the environmental fluid hindrance effect leads to a decrease in its velocity, and then, due to the jet boundary layer and the environmental fluid mixing with each other to promote the environmental fluid by the jet mainstream structure volume absorption and movement with the jet, an increase in the flow rate of the ambient jet results.
Figure 6 shows the variation of Hp/D and (H/D-Hp/D) with H/D. As can be seen from the figure, Hp/D is almost 0 when H/D is 1. This is caused by the limited space during the development of the jet, and the shear layer starts to decay rapidly before it touches the central potential nucleus region. When 2 ≤ H/D ≤ 5, both Hp/D and (H/D-Hp/D) increased linearly with the increase of H/D. When H/D exceeds 5, as H/D increases, the increment of Hp/D begins to decrease. The reason for this is that when the impinging distance increases to a certain value (H/D ≥ 5), the longer the impinging distance is, the longer the jet will be affected by the resistance produced by the ambient static fluid while it is developing. The jet can no longer continue to develop at the same speed.
Figure 7 shows the variation of Hp/H with H/D. Hp/H dimensionless sizes the corresponding length and can better describe the relative length of the potential core region. As can be found from the figure, when 1 ≤ H/D ≤ 2, Hp/H increases rapidly. However, when H/D is gradually increased in the range of 4 to 7, the magnitude of the increase in Hp/H keeps decreasing, compared with H/D = 6, when H/D = 7, Hp/H only increased by about 0.44%. At H/D = 8, Hp/H starts to decrease compared to the former, it shows that under the condition of Re = 23,400, the relative length of the potential core region reaches the maximum value when H/D = 7. As a whole, when 5 ≤ H/D ≤ 8, Hp/H remains basically unchanged. The value can be taken as the average of Hp/H at 4 impinging distances, and is 0.673. Its maximum error with Hp/H at 4 impinging distances is only 3.94%.
Figure 8 shows the distribution of the flow angle φ for different radial positions (r/D = 0, ±0.25 and ±0.5) of the jet at different impinging distances for Reynolds number Re = 23,400. The flow angle is defined as φ = arctan(−Vy/Vx), which can reflect the flow direction at any point in the jet. As can be seen from the figure, when r/D = 0, the φ at the end of the potential core zone is always around 90°. When the jet leaves the potential core zone, the size of φ on the axis (r/D = 0) starts to decrease gradually as the axial distance increases, the axial velocity on the axis starts to be smaller, and the circumferential velocity starts to increase, so the length of the potential core zone can also be defined as the length of the jet axis where φ remains around 90°. When r/D = ±0.5, with the increase of H/D, the range of φ at the end of the potential core region gradually approaches 90°. It shows that with the increase of H/D, the component of the water flow velocity at the end of the potential core region in the axial direction is gradually increasing.
Figure 9 shows the velocity magnitude V/Vb, the horizontal velocity component |Vx|/Vb and the vertical velocity component |Vy|/Vb along the jet axis for different impinging distances. The position of the two sub-attenuation regions (potential core region and transition region), and the impinging region of the free jet region, can be clearly distinguished from the figure.
When H/D = 1, the V/Vb and |Vy|/Vb of the outlet section of the jet pipe (l/D = 0) are obviously smaller than the corresponding velocity of the section at other impinging distances. However, |Vx|/Vb is larger than the corresponding velocity of other impinging distances. The reason for this is the small impinging distance. The jet is strongly influenced by the wall, and the wall jet region forms earlier and influences the development of the jet in the free jet region.
When H/D ≥ 2, in the potential core region, V/Vb remains basically unchanged. In the transition region, the magnitude of V/Vb decreases with the increase of l/D. In the impinging region, |Vx|/Vb increases significantly with the increase of l/D. On the contrary, |Vy|/Vb decreases rapidly, and its decreasing trend is basically the same as that of V/Vb. This shows that in the impinging region, although the axial velocity of the jet gradually decreases and the flow direction starts to change, the velocity of the jet in the axial direction (r/D = 0) is still greatly affected by its axial velocity, and is relatively less affected by the axial velocity.
The trend of jet velocity in the impact zone is mainly linearly decreasing, and the linear relationship can be expressed by Equation (6):
V V b   =   k × ( l / D ) + b
where k is the slope, and |k| represents the decay rate of the jet velocity in the impinging region; the larger |k| is, the faster the velocity of the jet axis attenuates in the impinging region; the smaller |k| is, the slower the velocity decays; and b is the intercept. The values of k and b are related to H/D and have certain errors. The values and standard errors are shown in Table 1.
The linear function is shown in Figure 9a. The variation trend of V/Vb with l/D in the impinging region is basically consistent with the linear function. Comparing the slope of the linear function under each impinging distance in Table 1, it can be found that while H/D is increasing, |k| is decreasing. It shows that within a certain range, the increase of H/D can reduce the decay rate of V/Vb in the impinging region. After the impinging distance increases to 3, (ki+1ki) gradually increases with the increase of the impinging distance. That is, the rate at which |k| decreases is gradually increasing. As shown in Figure 10, the |k| value shows an arc-like decrease. It was fitted using polynomials, and the second order polynomials fit the |k| values better. Its equation is as follows:
| k |   =   0.008 ( H / D ) 2 + 0.05 ( H / D ) + 0.81         ( H / D     3 )
On observing Figure 9a, it is found that the abscissa of the intersection of the l/D-V/Vb curve and the abscissa axis of V/Vb = 0 at each impinging distance is the same as the impinging distance H/D. Then:
V V b 0   =   k ( l / D H / D )
Substituting Equation (7) into (8), the relationship between the velocity V/Vb of the jet axis in the impinging region and l/D can be obtained when H/D ≥ 3:
V V b   =   ( 0.008 ( H / D ) 2 0.05 ( H / D ) 0.81 ) ( l / D H / D )
Figure 11 shows the velocity distribution of the jet impinging on the wall under different impinging distances. When H/D is 1, the length of the high-speed jet at the pipe is short due to the strong wall resistance. When H/D is greater than 1, the range of action due to wall resistance is limited. Compared with the former, the jet has been developed to a certain extent and then impinging on the wall. Especially when H/D increases to 3, the width of the potential core region decreases with the increase of the axial distance. The larger the H/D, the more obvious the phenomenon is. It shows that when the H/D increases to 3, the flow velocity in the potential core region attenuates more obviously. This phenomenon is a direct consequence of the decreasing flow velocity in the free jet region near the wall as H/D increases. It further shows that the velocity of the wall jet region decreases with the increase of H/D and the velocity of the velocity decay in the potential core region is synchronous.

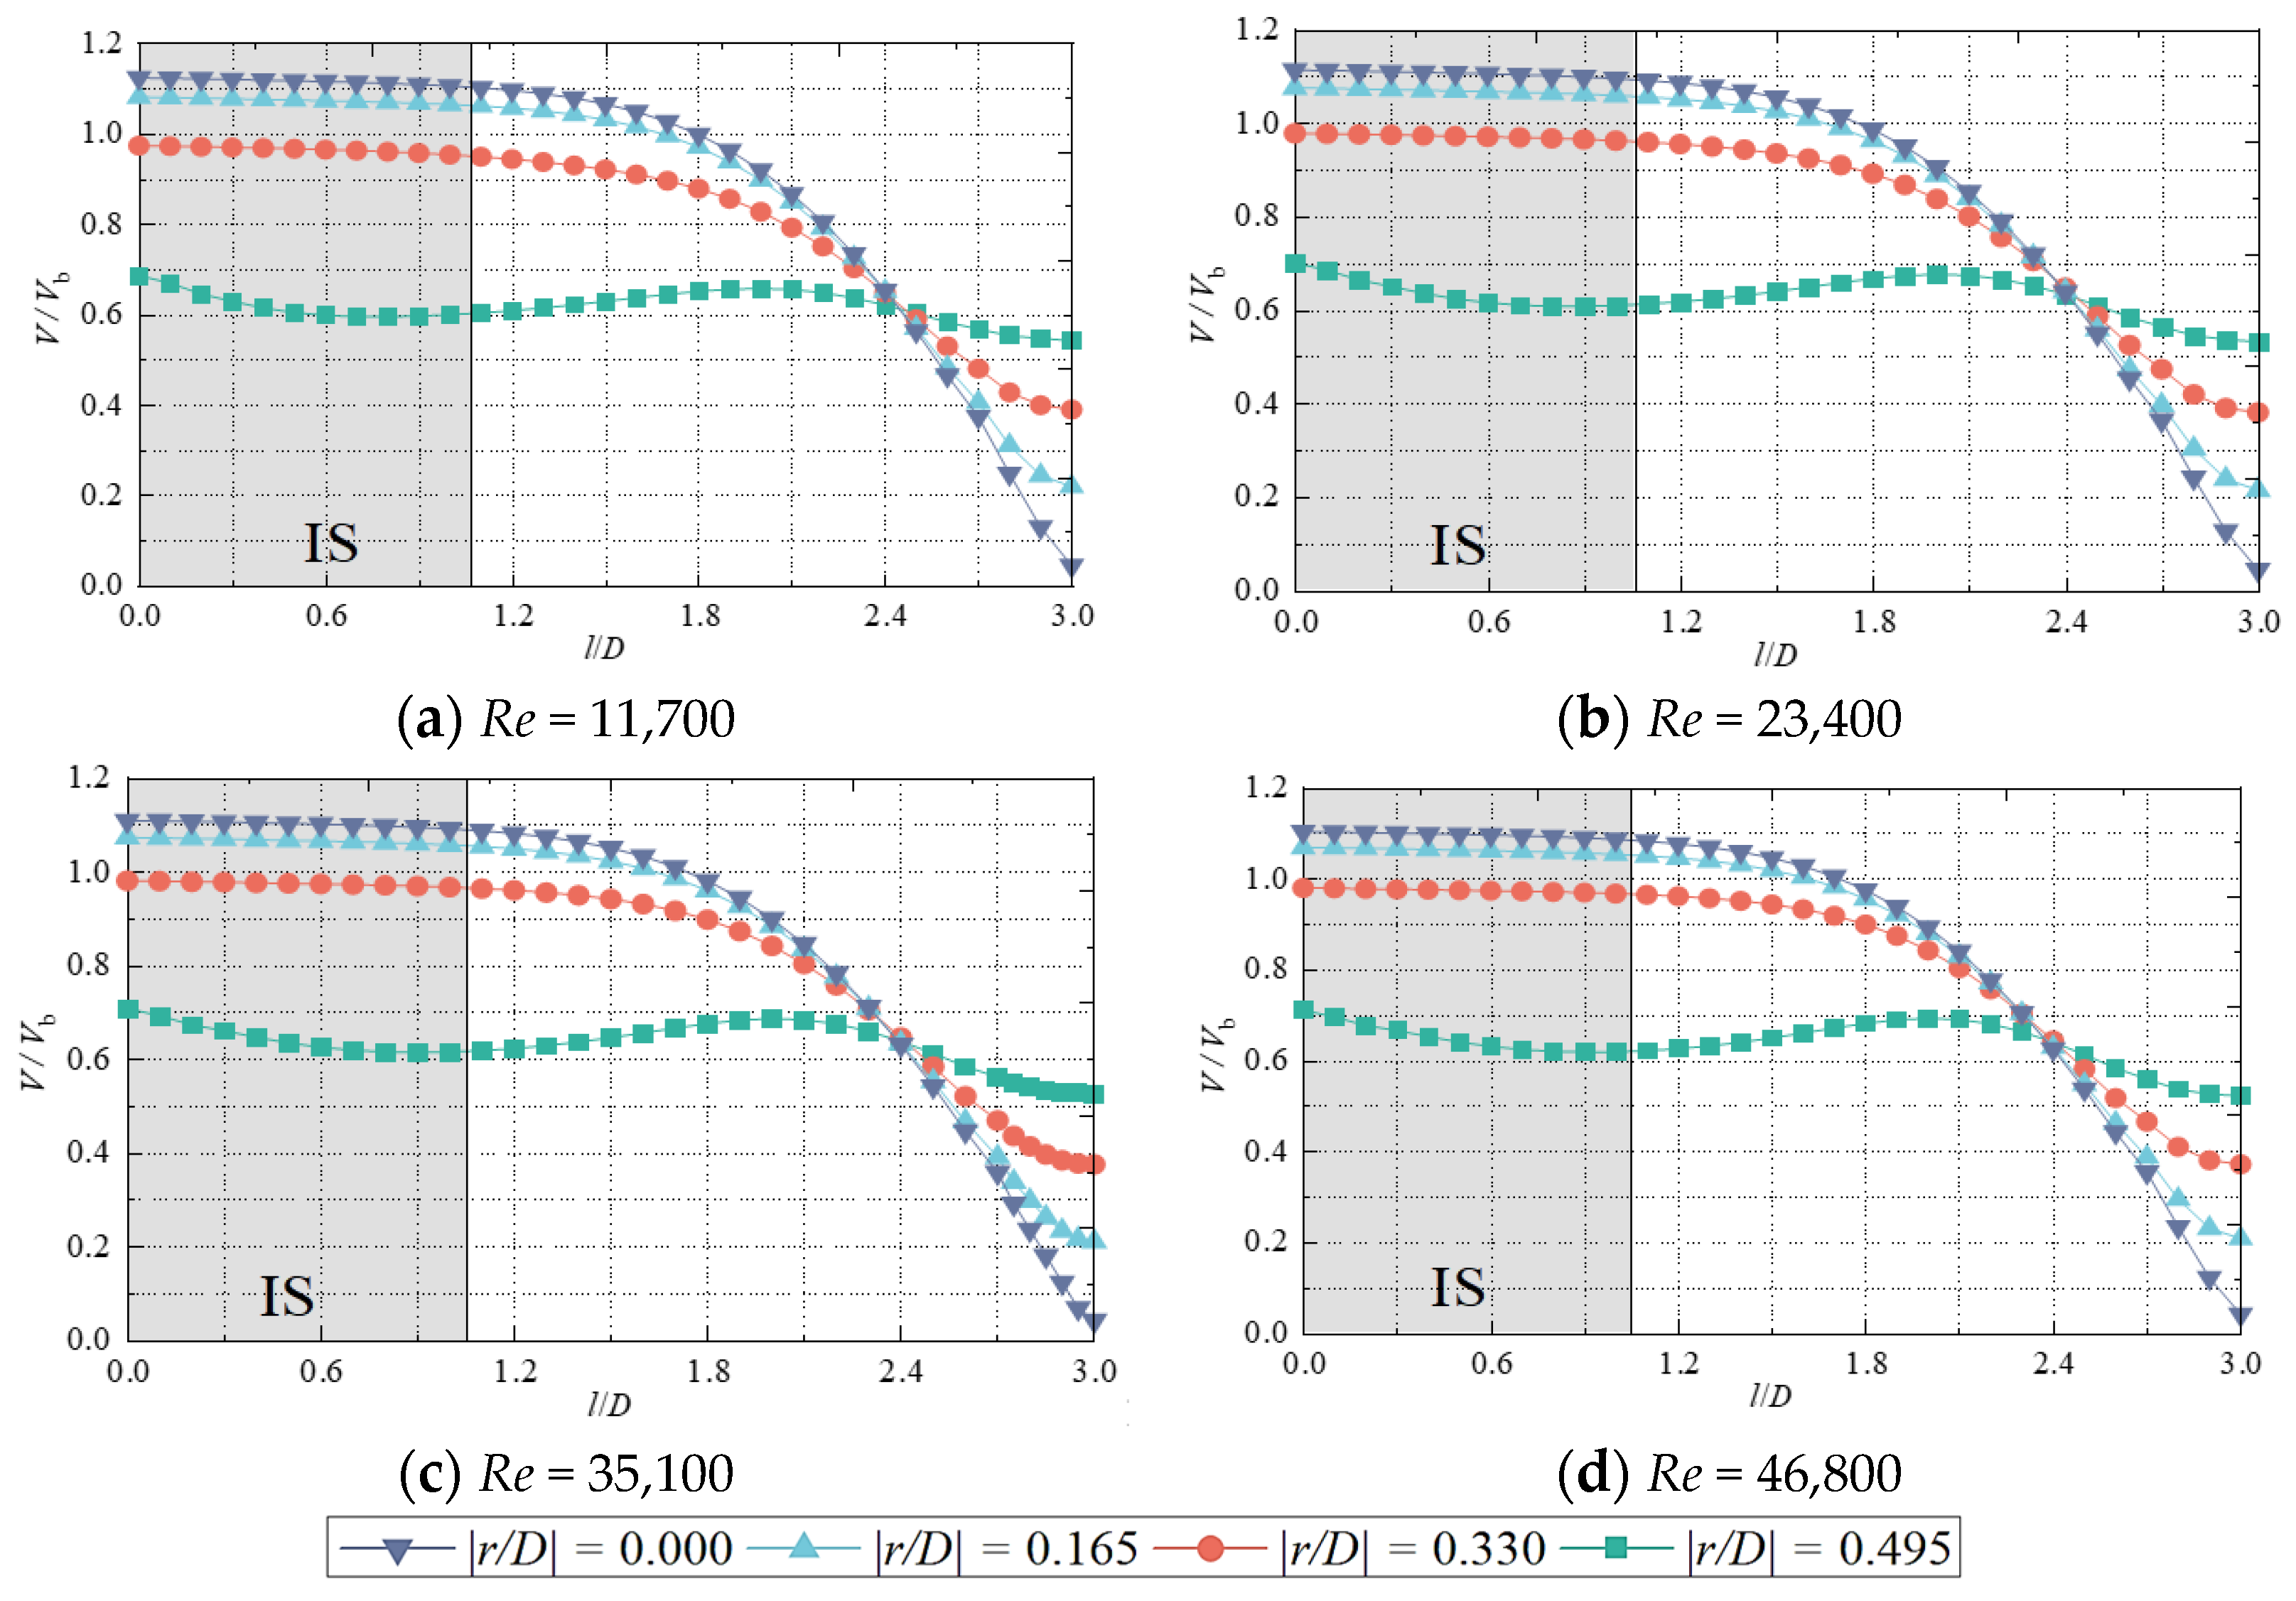
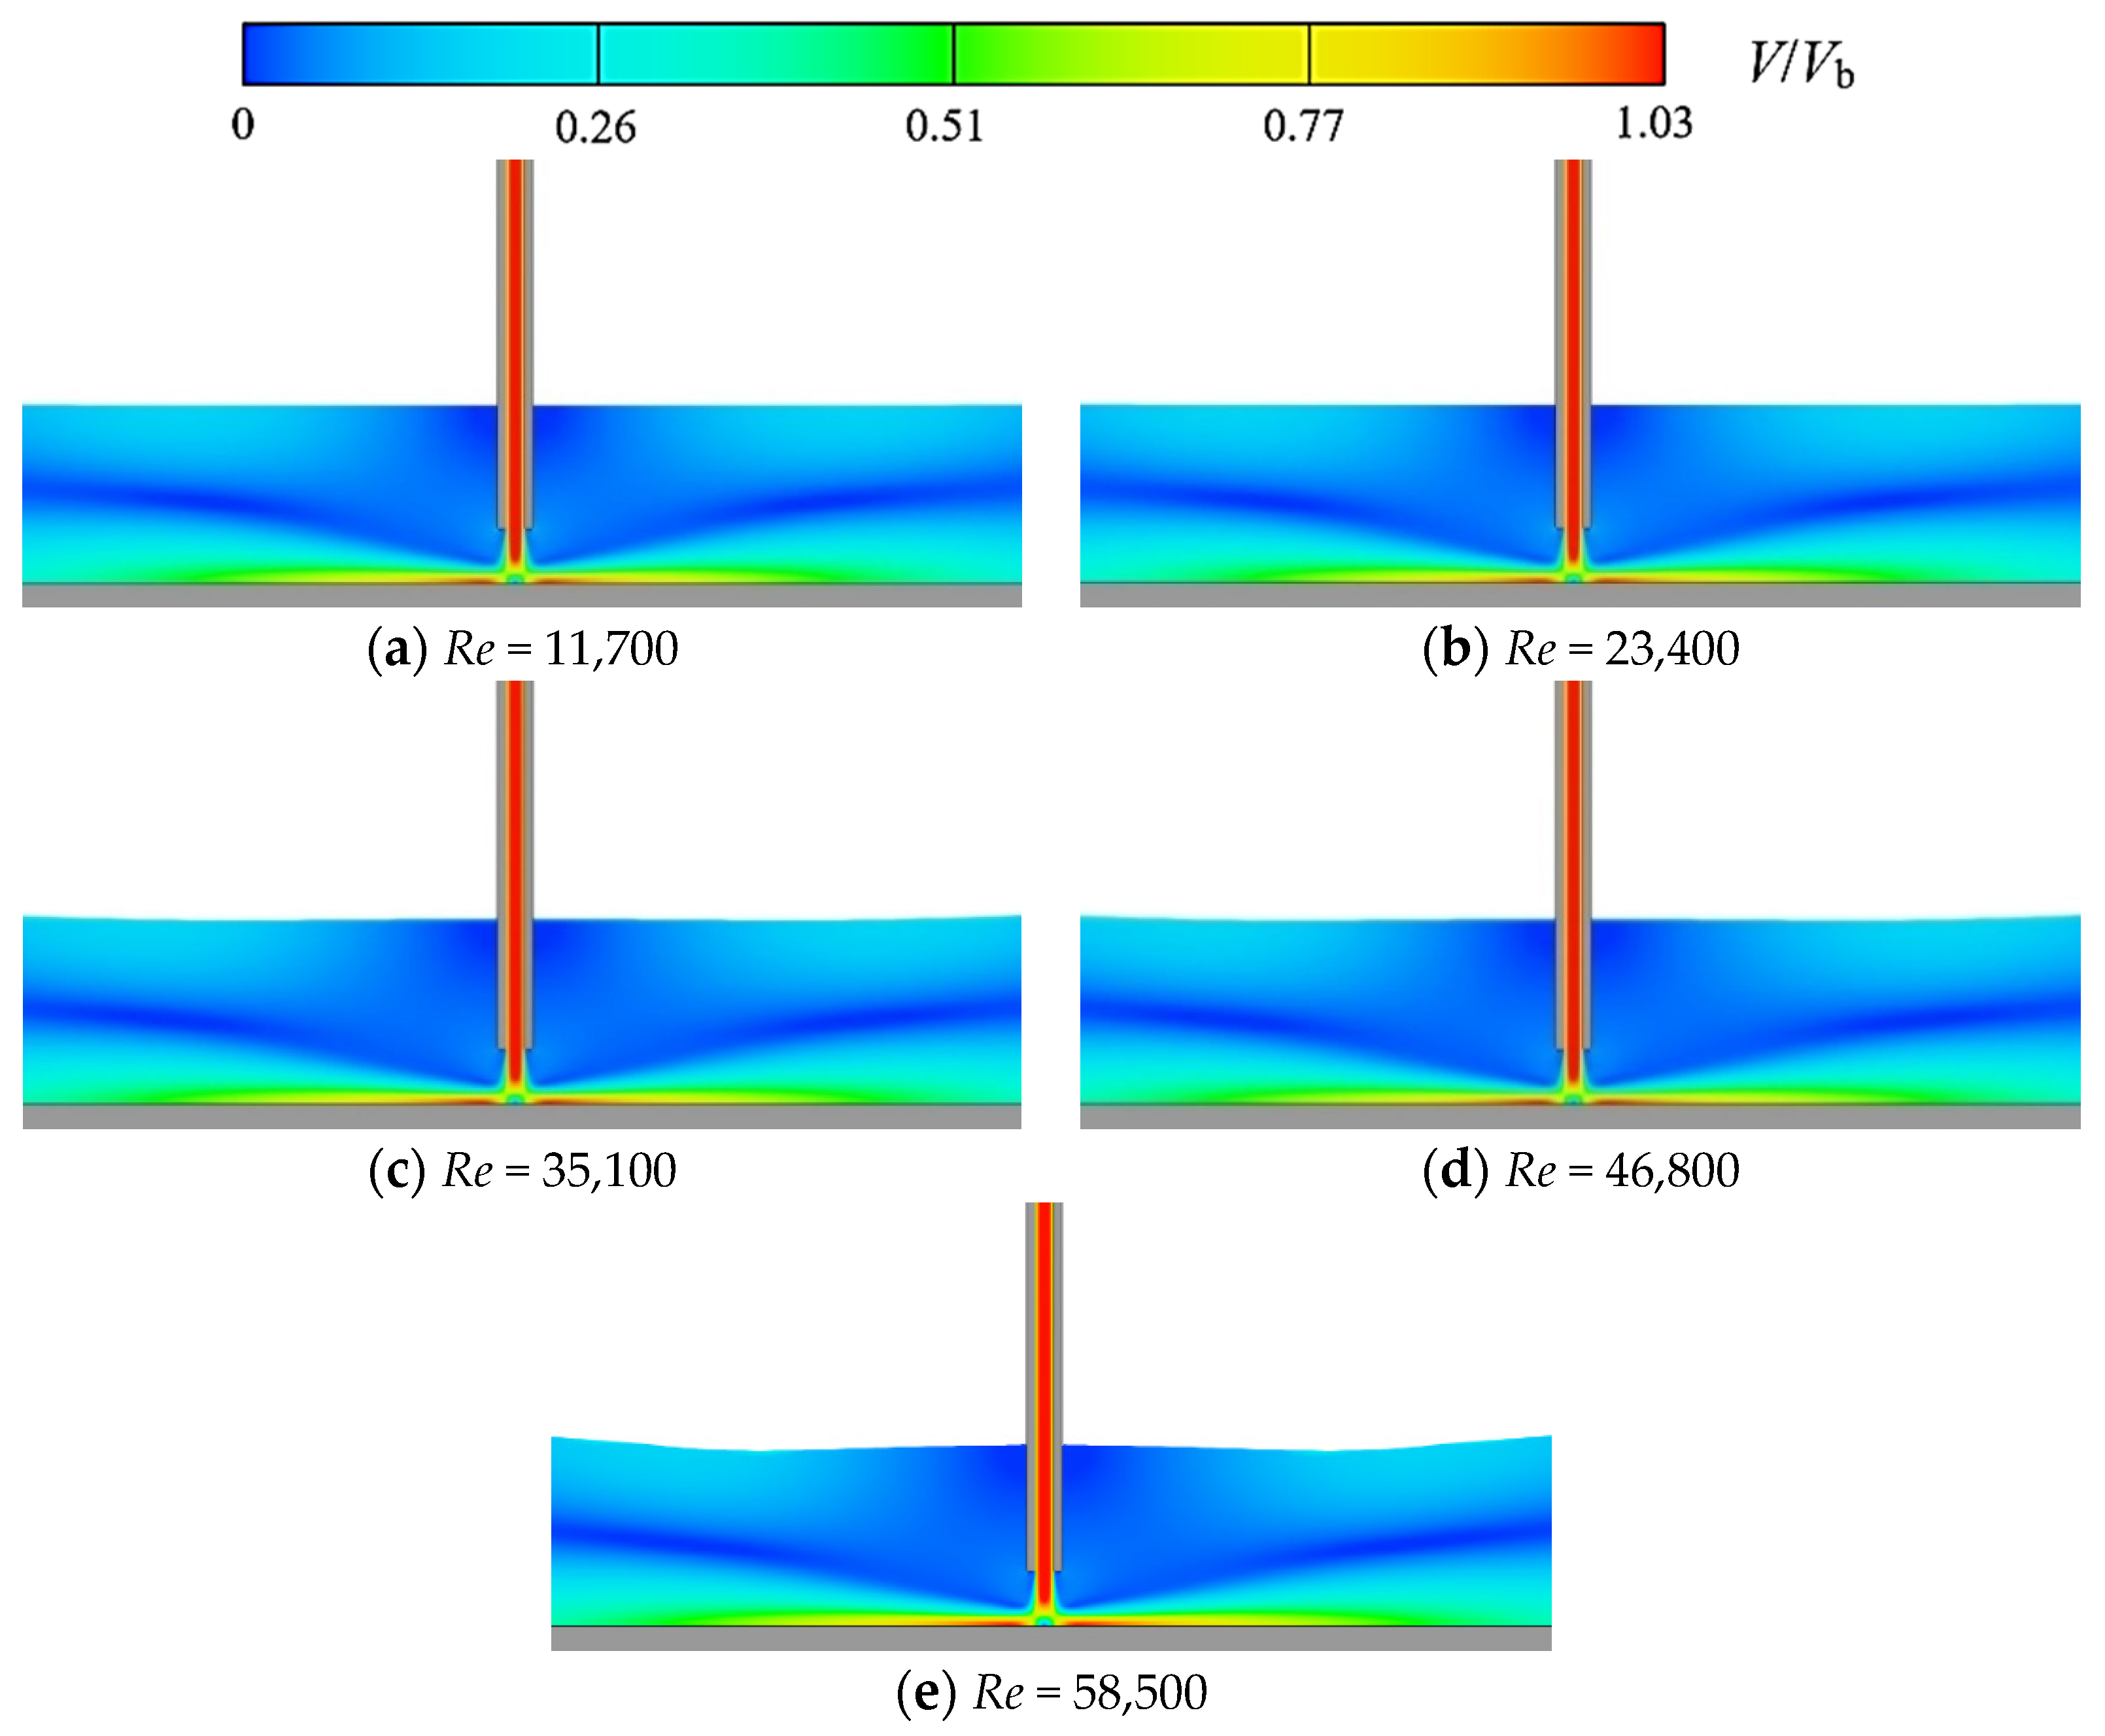
5.2. Analysis of Submerged Jet Flow Field under Different Reynolds Numbers

Figure 12 shows the axial distribution of the jet at different radial positions (r/D = 0, 0.165, 0.330 and 0.495) V/Vb under different Reynolds numbers Re (H/D = 3). As can be found from the figure, for all Re, the relationship between V/Vb and l/D remains the same at a certain radial position. The length of the potential core region Hp/D is around 1.05. It is suggested that the value of Re has essentially no effect on the axial velocity distribution of the jet and the length of the potential core region.
Further, it is interesting that regardless of the value of Re, the curves for V/Vb and l/D at different radial positions both approximately intersect at the same point (l/D = 2.4, V/Vb = 0.65) in the impinging region. Additionally, there is a significant change in speed before and after this point. At the beginning, the jet flows from the initial section through the transition section, and the velocity first remains constant and then slowly decreases, at which time the velocity on the jet axis is greater than the flow velocity on both axes. When the jet reaches the position of l/D =2.4, the velocity on the jet axis begins to drop sharply, and the magnitude of the velocity starts to be lower than the velocity on both axes.
Figure 13 shows the distribution of the flow angle φ of the jet at different radial positions (r/D = 0, ±0.25 and ±0.5) for different Reynolds numbers Re (H/D = 3). As can be found from the figure, in the initial segment range, when −0.5 ≤ r/D ≤ 0.5, no significant change in the size of the flow angle of the jet, which is concentrated around 90°. After the jet leaves the initial section and enters the transition and main sections, its flow angle starts to produce a noticeable change. The farther the radial position is from the axis, the greater the change of the flow angle. The above phenomenon shows that the jet is within the axial distance from the jet pipe to the end of the potential core region, the velocity of the jet is mainly based on the axial velocity, and its circumferential velocity accounts for a very small proportion, which can be ignored. As the jet leaves the initial section and enters the transition section, the axial velocity decreases and the circumferential velocity increases conversely. When the jet impinges near the wall, the flow angle at the position of the jet axis is 45 degrees. That is, the axial velocity component and the circumferential velocity component are equal.
In the overall observation of Figure 13, it can be seen that when the impinging distance remains constant, no matter how the Reynolds number changes, the change trend of the flow angle of the jet at a radial position with the axial distance is basically the same. This phenomenon is consistent with the conclusions drawn from Figure 12.
Figure 14 shows the distribution of the velocity magnitude V/Vb, horizontal velocity component |Vx|/Vb and vertical velocity component |Vy|/Vb along the jet axis at different Reynolds numbers. As can be found from the figure, when the Reynolds number is 11,700, the velocity along the jet axis in the initial section and transition section is slightly larger than the velocity in this range at other Reynolds numbers. The variation in Reynolds number in the impinging region has less effect on the magnitude of the velocity along the axis of the jet. The possible reason is that the low-velocity jet, when the Reynolds number is small, enters the static water body from the jet pipe. The resistance is less than the resistance of a high velocity flow with a higher Reynolds number. As a result, it has been able to maintain its original pace of development relatively well.
The velocity along the jet axis at a Reynolds number of 11,700 is slightly prominent in the initial and transitional sections. However, the horizontal velocity component remains essentially the same over the range, with only slight differences in the impinging region. Nevertheless, the magnitude of the axial velocity of the jet in the impinging region remains essentially the same. This indicates that the difference in horizontal velocity components at different Reynolds numbers in this range has a negligible effect on the magnitude of the axial velocity of the jet. In addition, comparing the vertical velocity component and the velocity of the jet axis with the axial distance, it can be found that the change trend of the two is basically the same. It shows that the velocity of the jet axis is controlled by the vertical velocity component, and the horizontal velocity component has little effect.
Apart from this, it can be found that regardless of the variation in Reynolds number, the variation trend of jet axial velocity with axial distance is consistent. This indicates that the Reynolds number has little effect on the axial velocity of the jet, consistent with the above conclusion. Equation (9) is still applicable to describe the variation of the jet axial velocity with axial distance at other Reynolds numbers.
Figure 15 shows the flow velocity distribution of the impinging jet on the wall under different Reynolds numbers. It can be seen from the figure that with the increase of Reynolds number, the equilibrium state of the liquid surface is broken, near both sides of the jet pipe and the water tank side wall position at the higher water level; the water level in the middle of the two positions is lower. The reasons for this phenomenon can be generalized in two points. First, when the Reynolds number is large, the entrainment effect of the high-speed jet is stronger, and the formation of larger vortices on either side of the jet pipe causes a higher water level at that location. Second, the limitation of the length of the water tank causes the wall to have a greater impinging on the water flow near the wall of the water tank, resulting in a higher water level at this location.
An observation of the impinging jet at each Reynolds number in the figure shows that the jet is in this interval from the jet pipe outlet to the wall. Whether it is free jet zone, impinging region or wall jet zone, the velocity distribution of each section has not changed significantly. It shows that the velocity distribution of an impinging jet has little sensitivity to the Reynolds number and verifies the above conclusion again.

6. Conclusions

In this study, the hydraulic characteristics of continuous submerged impinging jets were carried out based on Flow-3D, and the effects of impinging distance H/D and Reynolds number Re on its flow characteristics and flow structure were analyzed. The following conclusions were obtained:
(1)
Flow-3D can properly simulate the flow of continuous submerged jets impacting a wall. Meanwhile, the prediction results based on the RNG k-ε turbulence model are in good agreement with the empirical equations and the results of the model experiments, indicating that the RNG k-ε turbulence model is suitable for the numerical simulation of the submerged impinging jet.
(2)
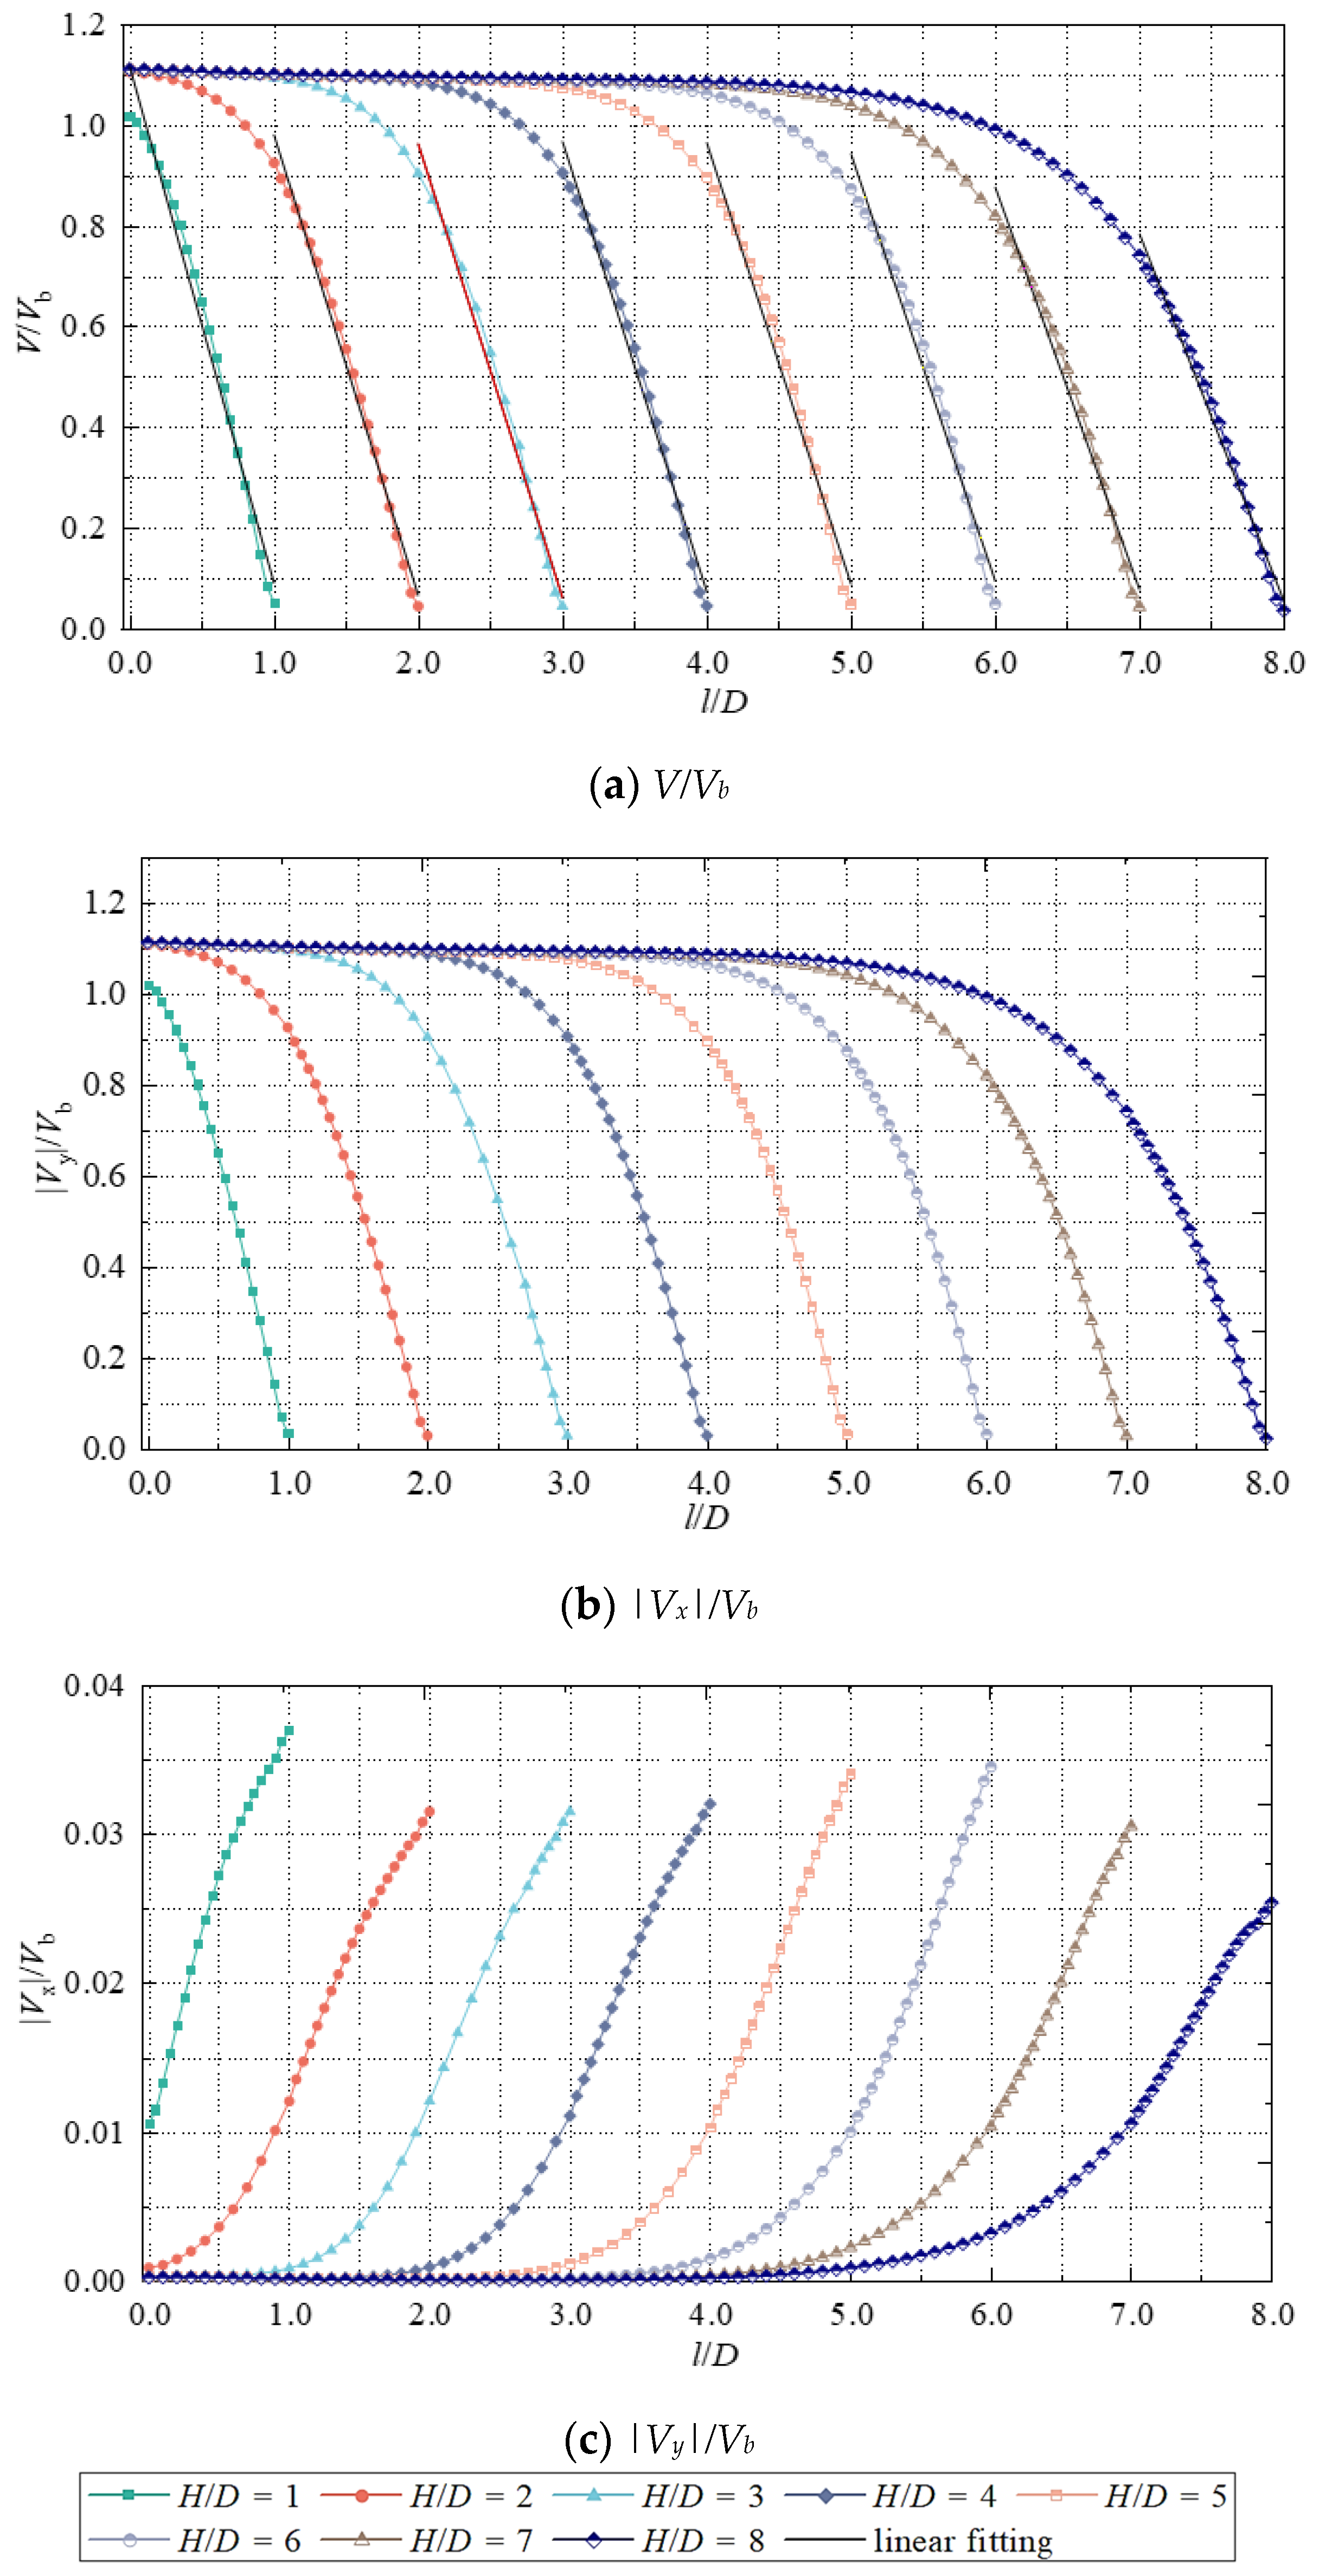
The length of the potential core region Hp/D increases with the increase of the impinging distance H/D. Among them, when 2 ≤ H/D ≤ 5, the length of the potential core region Hp/D increases linearly with the increase of the impinging distance H/D; when H/D > 5, the length of the potential core region Hp/D still increases with the increase of the impinging distance H/D, but the increase decreases.
(3)
The length of the potential core region can be defined as the length at which the flow angle in the axial direction of the jet is kept near 90°. As the impinging distance H/D increases, the component in the direction of the flow axis at the end of the potential core region gradually increases.
(4)
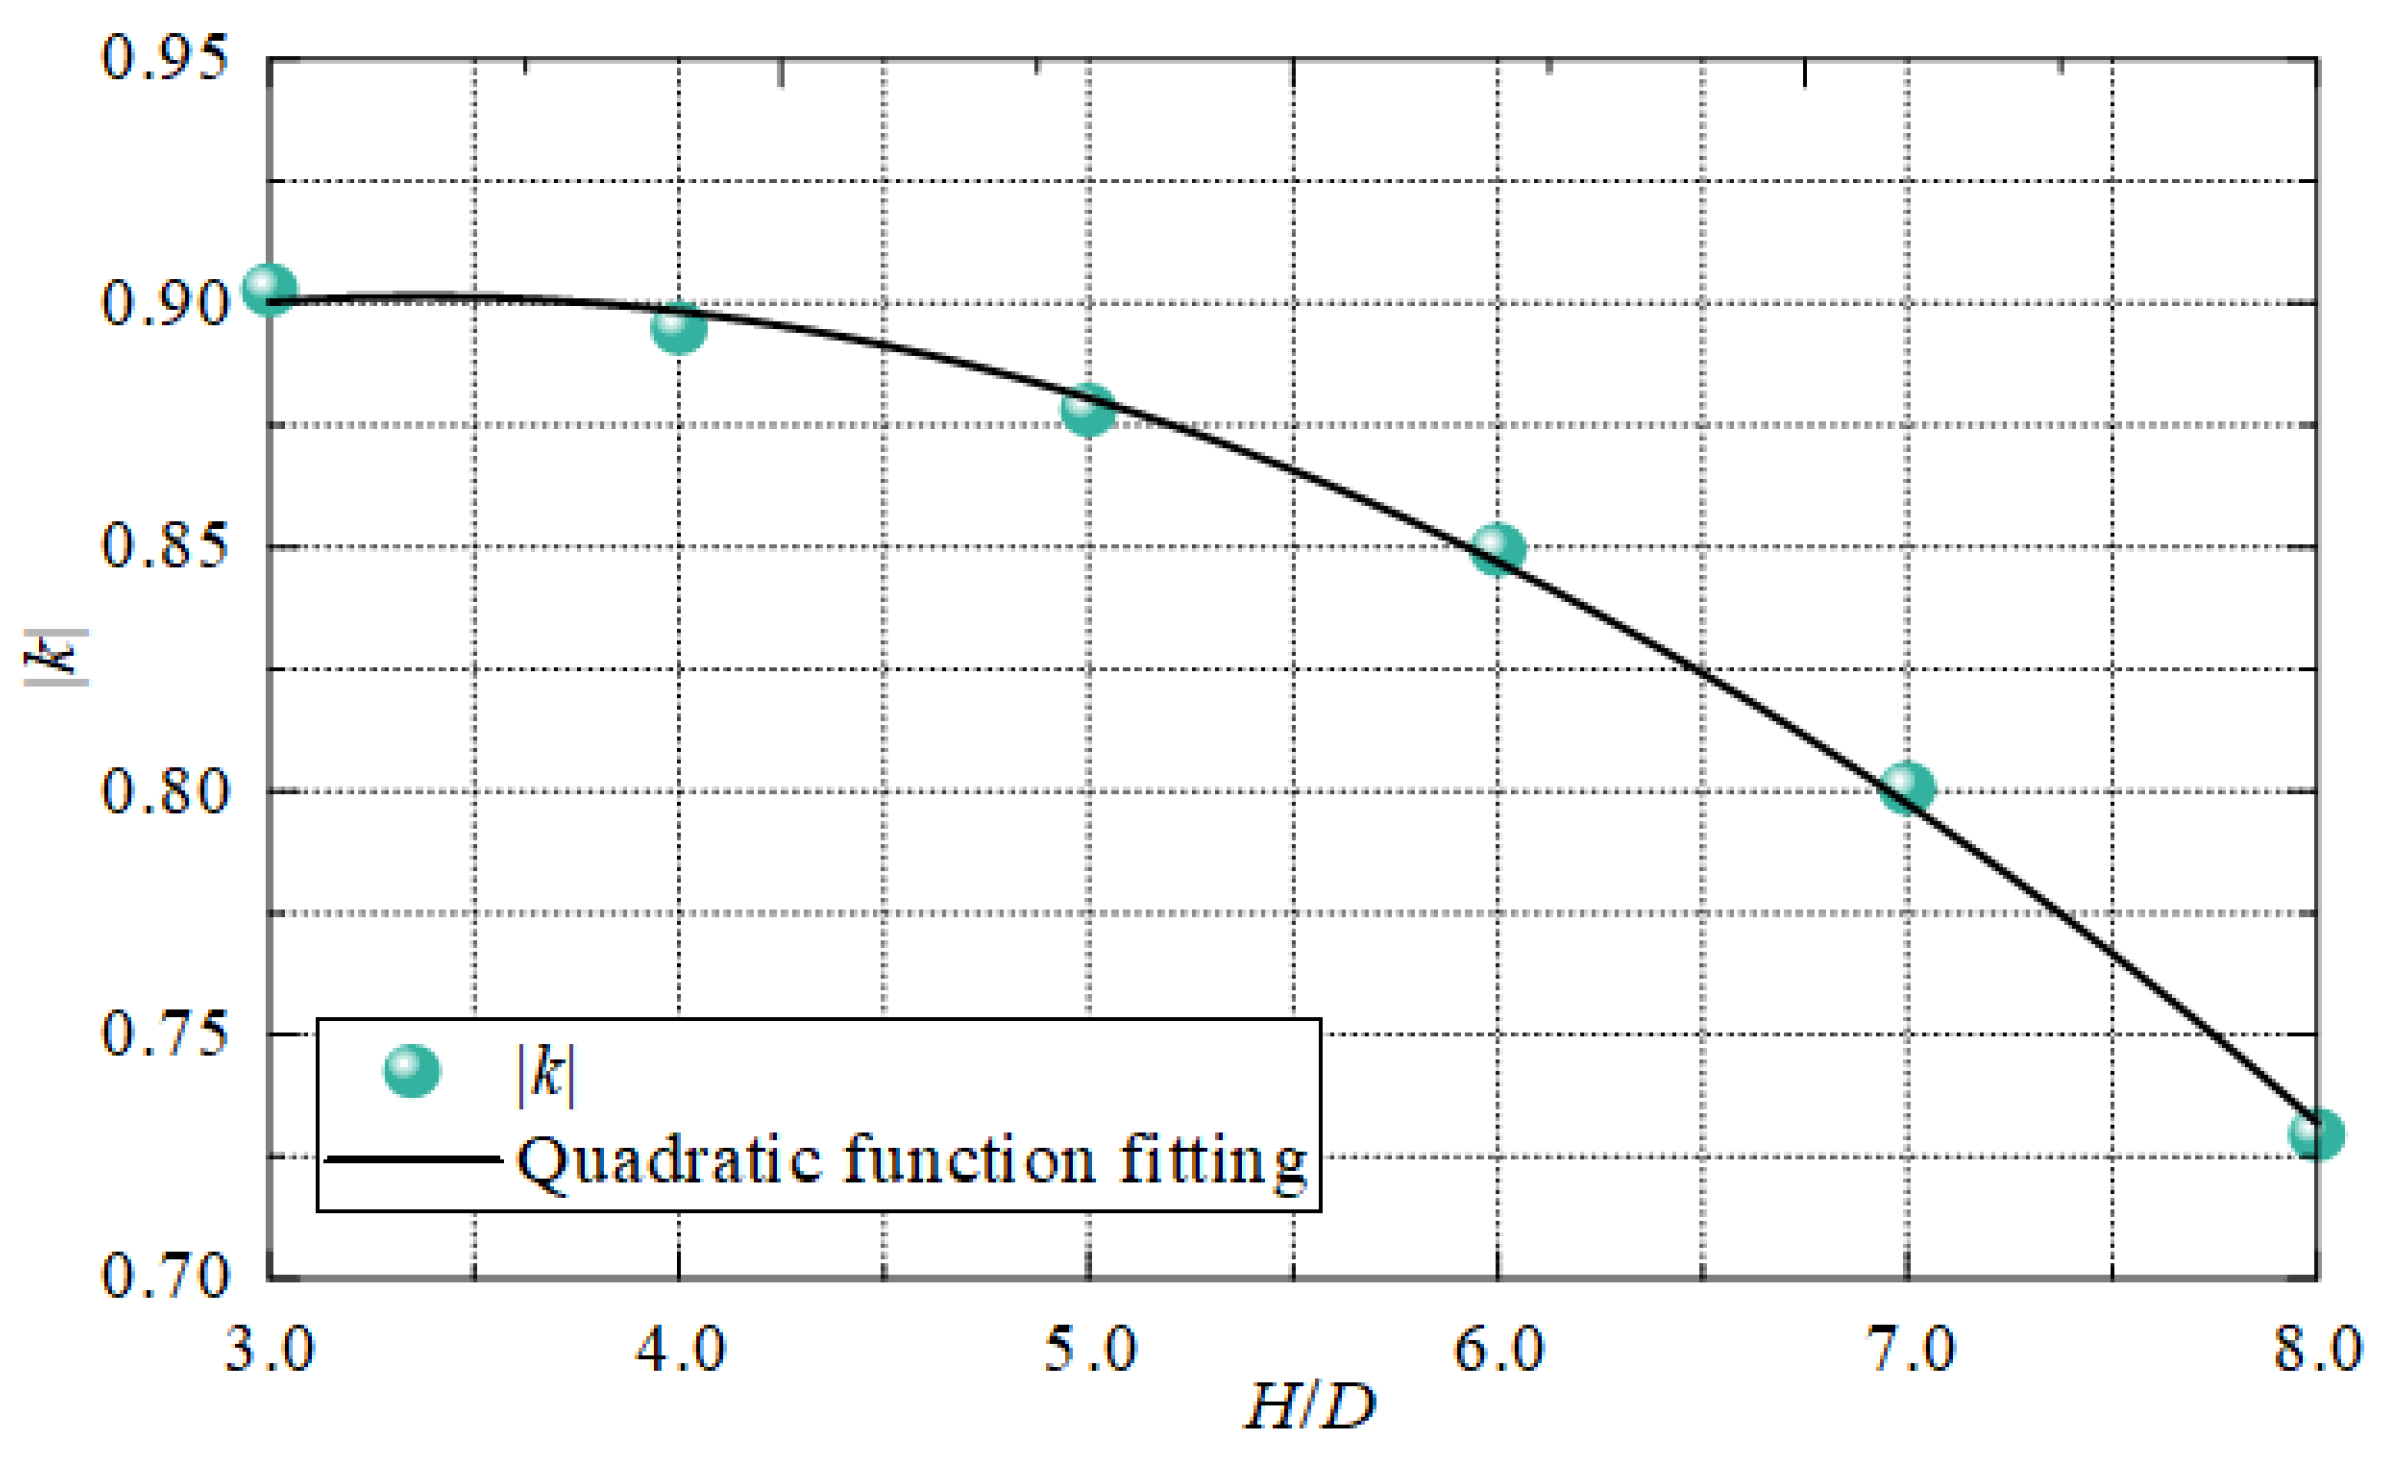
The velocity V/Vb of the jet axis in the impact zone decreases linearly with the development of the jet. At the same time, the action range of the vortex caused by the wall flow of the jet after impacting the flat plate is gradually reduced inward with the increase of the impinging distance H/D.
(5)
The flow structure and flow characteristics of continuous submerged impinging jets are relatively independent of the Reynolds number Re; i.e., the length of the potential core region and the relationship between the axial velocity of the jet within the impinging zone and the impinging distance are also applicable to the conditions at other Reynolds numbers.
In summary, the present work focused on the impact effects and flow field structure at different Reynolds numbers and impact distances. This will not only help to enrich the classical impact jet theory and deepen understanding of the interaction mechanism between the impact jet and the wall, but also serve as a methodological guide and theoretical support for relevant engineering practice. However, the scope of our study is still not comprehensive. In our subsequent work, we will build on this paper and work on the high accuracy visualization of impinging jets on a spatial scale (with the help of the TSI V3VTM system). At the same time, the hydraulic characteristics and scouring effects of impinging jets under the influence of multiple factors will be considered, such as multiphase media (gas phase, solid phase), nozzles of different shapes and sizes, differentiated jet inlet conditions (e.g., pulsing) and ambient fluids with different initial velocity conditions.

Author Contributions

Data curation, C.W. and H.W. (Hongliang Wang); formal analysis, H.W. (Hui Wang); writing—original draft, X.J.; writing—review and editing, H.M. and B.H.; software, Y.Z. All authors have read and agreed to the published version of the manuscript.

Funding

This research was funded by the National Natural Science Foundation of China (No. 51979240), the Science Center for Gas Turbine Project (P2021-A-I-003-002), the National Natural Science Foundation of China (No. 52009013), the China Postdoctoral Science Foundation (No. 273746), the Open Research Fund of Hainan Vocational University of Science and Technology, and the National Key R&D Program of China (No. 2020YFC1512402).

Institutional Review Board Statement

Not applicable.

Informed Consent Statement

Not applicable.

Data Availability Statement

Not applicable.

Conflicts of Interest

The authors declare no conflict of interest.

References

  1. Zhang, J.; Li, Y.; Zhang, Y.; Yang, F.; Liang, C.; Tan, S. Using a high-pressure water jet-assisted tunnel boring machine to break rock. Adv. Mech. Eng. 2020, 12, 1687814020962290. [Google Scholar] [CrossRef]
  2. Shi, X.; Zhang, G.; Xu, G.; Ma, Y.; Wu, X. Inactivating Microorganism on Medical Instrument Using Plasma Jet. High Volt. Eng. 2009, 35, 632–635. [Google Scholar]
  3. Gao, Y.; Han, P.; Wang, F.; Cao, J.; Zhang, S. Study on the Characteristics of Water Jet Breaking Coal Rock in a Drilling Hole. Sustainability 2022, 14, 8258. [Google Scholar] [CrossRef]
  4. Xu, W.; Wang, C.; Zhang, L.; Ge, J.; Zhang, D.; Gao, Z. Numerical study of continuous jet impinging on a rotating wall based on Wray—Agarwal turbulence model. J. Braz. Soc. Mech. Sci. Eng. 2022, 44, 433. [Google Scholar] [CrossRef]
  5. Hu, B.; Wang, C.; Wang, H.; Yu, Q.; Liu, J.; Zhu, Y.; Ge, J.; Chen, X.; Yang, Y. Numerical Simulation Study of the Horizontal Submerged Jet Based on the Wray—Agarwal Turbulence Model. J. Mar. Sci. Eng. 2022, 10, 1217. [Google Scholar] [CrossRef]
  6. Dahiya, A.K.; Bhuyan, B.K.; Kumar, S. Perspective study of abrasive water jet machining of composites—A review. J. Mech. Sci. Technol. 2022, 36, 213–224. [Google Scholar] [CrossRef]
  7. Abushanab, W.S.; Moustafa, E.B.; Harish, M.; Shanmugan, S.; Elsheikh, A.H. Experimental investigation on surface characteristics of Ti6Al4V alloy during abrasive water jet machining process. Alex. Eng. J. 2022, 61, 7529–7539. [Google Scholar] [CrossRef]
  8. Hu, B.; Wang, H.; Liu, J.; Zhu, Y.; Wang, C.; Ge, J.; Zhang, Y. A numerical study of a submerged water jet impinging on a stationary wall. J. Mar. Sci. Eng. 2022, 10, 228. [Google Scholar] [CrossRef]
  9. Peng, J.; Shen, H.; Xie, W.; Zhai, S.; Xi, G. Influence of flow fluctuation characteristics on flow and heat transfer in different regions. J. Drain. Irrig. Mach. Eng. 2022, 40, 826–833. [Google Scholar]
  10. Zhai, S.; Xie, F.; Yin, G.; Xi, G. Effect of gap ratio on vortex-induced vibration characteristics of different blunt bodies near-wall. J. Drain. Irrig. Mach. Eng. 2021, 39, 1132–1138. [Google Scholar]
  11. Lin, W.; Zhou, Y.; Wang, L.; Tao, L. PIV experiment and numerical simulation of trailing vortex structure of improved INTER-MIG impeller. J. Drain. Irrig. Mach. Eng. 2021, 39, 158–164. [Google Scholar]
  12. Han, B.; Yao, Z.; Tang, R.; Xu, H. On the supersonic impinging jet by laser Doppler velocimetry. Exp. Meas. Fluid Mech. 2002, 16, 99–103. [Google Scholar]
  13. Darisse, A.; Lemay, J.; Benaissa, A. LDV measurements of well converged third order moments in the far field of a free turbulent round jet. Exp. Therm. Fluid Sci. 2013, 44, 825–833. [Google Scholar] [CrossRef]
  14. Kumar, S.; Kumar, A. Effect of initial conditions on mean flow characteristics of a three dimensional turbulent wall jet. Proc. Inst. Mech. Eng. Part C J. Mech. Eng. Sci. 2021, 235, 6177–6190. [Google Scholar] [CrossRef]
  15. Tao, D.; Zhang, R.; Ying, C. Development and application of the pollutant diffusion testing apparatus based on the image analysis. J. Saf. Environ. 2016, 16, 247–251. [Google Scholar]
  16. Seo, H.; Kim, K.C. Experimental study on flow and turbulence characteristics of bubbly jet with low void fraction. Int. J. Multiph. Flow 2021, 142, 103738. [Google Scholar] [CrossRef]
  17. Wen, Q.; Sha, J.; Liu, Y. TR-PIV measurement of the turbulent submerged jet and POB analysis of the dynamic structure. J. Exp. Fluid Mech. 2014, 4, 16–24. [Google Scholar]
  18. Yang, Y.; Zhou, L.; Shi, W.; He, Z.; Han, Y.; Xiao, Y. Interstage difference of pressure pulsation in a three-stage electrical submersible pump. J. Petrol. Sci. Eng. 2021, 196, 107653. [Google Scholar] [CrossRef]
  19. Tang, S.; Zhu, Y.; Yuan, S. An improved convolutional neural network with an adaptable learning rate towards multi-signal fault diagnosis of hydraulic piston pump. Adv. Eng. Inform. 2021, 50, 101406. [Google Scholar] [CrossRef]
  20. Han, Y.; Song, X.; Li, K.; Yan, X. Hybrid modeling for submergence depth of the pumping well using stochastic configuration networks with random sampling. J. Petrol. Sci. Eng. 2022, 208, 109423. [Google Scholar] [CrossRef]
  21. Tang, S.; Zhu, Y.; Yuan, S. A novel adaptive convolutional neural network for fault diagnosis of hydraulic piston pump with acoustic images. Adv. Eng. Inform. 2022, 52, 101554. [Google Scholar] [CrossRef]
  22. Long, J.; Song, X.; Shi, J.; Chen, J. Optimization and CFD Analysis on Nozzle Exit Position of Two-phase Ejector. J. Refrig. 2022, 43, 39–45. [Google Scholar]
  23. Ni, Q.; Ruan, W. Optimization design of desilting jet pump parameters based on response surface model. J. Ship Mech. 2022, 26, 365–374. [Google Scholar]
  24. Zhang, K.; Zhu, X.; Ren, X.; Qiu, Q.; Shen, S. Numerical investigation on the effect of nozzle position for design of high performance ejector. Appl. Therm. Eng. 2017, 126, 594–601. [Google Scholar] [CrossRef]
  25. Fu, W.; Liu, Z.; Li, Y.; Wu, H.; Tang, Y. Numerical study for the influences of primary steam nozzle distance and mixing chamber throat diameter on steam ejector performance. Int. J. Therm. Sci. 2018, 132, 509–516. [Google Scholar] [CrossRef]
  26. Lucas, C.; Rusche, H.; Schroeder, A.; Koehler, J. Numerical investigation of a two-phase CO2 ejector. Int. J. Refrigeration 2014, 43, 154–166. [Google Scholar] [CrossRef]
  27. Ma, X.; Zhu, T.; Fu, Y.; Yan, Y.; Chen, W. Numerical simulation of rock breaking by abrasive water jet. J. Coast. Res. 2019, 93, 274–283. [Google Scholar] [CrossRef]
  28. He, L.; Liu, Y.; Shen, K.; Yang, X.; Ba, Q.; Xiong, W. Numerical research on the dynamic rock-breaking process of impact drilling with multi-nozzle water jets. J. Pet. Sci. Eng. 2021, 207, 109145. [Google Scholar] [CrossRef]
  29. Yu, Z.; Wang, Z.; Lei, C.; Zhou, Y.; Qiu, X. Numerical Simulation on Internal Flow Field of a Self-excited Oscillation Pulsed Jet Nozzle with Back-flow. Mech. Sci. Technol. Aerosp. Eng. 2022, 41, 998–1002. [Google Scholar]
  30. Huang, J.; Ni, F.; Gu, L. Numerical method of FLOW-3D for sediment erosion simulation. China Harb. Eng. 2019, 39, 6–11. [Google Scholar]
  31. Al Shaikhli, H.I.; Khassaf, S.I. Using of flow 3d as CFD materials approach in waves generation. Mater. Today Proc. 2022, 49, 2907–2911. [Google Scholar] [CrossRef]
  32. Kosaj, R.; Alboresha, R.S.; Sulaiman, S.O. Comparison Between Numerical Flow3d Software and Laboratory Data, For Sediment Incipient Motion. IOP Conf. Ser. Earth Environ. Sci. 2022, 961, 012031. [Google Scholar] [CrossRef]
  33. Du, C.; Liu, X.; Zhang, J.; Wang, B.; Chen, X.; Yu, X. Long-distance water hammer protection of pipeline after pump being first lowered and then rasied. J. Drain. Irrig. Mach. Eng. 2022, 40, 1248–1253, 1267. [Google Scholar]
  34. Gao, F.; Li, X.; Gao, Q. Experiment and numerical simulation on hydraulic characteristics of novel trapezoidal measuring weir. J. Drain. Irrig. Mach. Eng. 2022, 40, 1104–1111. [Google Scholar]
  35. Tu, A.; Nie, X.; Li, Y.; Li, H. Experimental and simulation study on water infiltration characteristics of layered red soil. J. Drain. Irrig. Mach. Eng. 2021, 39, 1243–1249. [Google Scholar]
  36. Chen, J.; Zeng, B.; Liu, L.; Tao, K.; Zhao, H.; Zhang, C.; Zhang, J.; Li, D. Investigating the anchorage performance of full-grouted anchor bolts with a modified numerical simulation method. Eng. Fail. Anal. 2022, 141, 106640. [Google Scholar] [CrossRef]
  37. Hu, B.; Yao, Y.; Wang, M.; Wang, C.; Liu, Y. Flow and Performance of the Disk Cavity of a Marine Gas Turbine at Varying Nozzle Pressure and Low Rotation Speeds: A Numerical Investigation. Machines 2023, 11, 68. [Google Scholar] [CrossRef]
  38. Yao, J.; Wang, X.; Zhang, S.; Xu, S.; Jin, B.; Ding, S. Orthogonal test of important parameters affecting hydraulic performance of negative pressure feedback jet sprinkler. J. Drain. Irrig. Mach. Eng. 2021, 39, 966–972. [Google Scholar]
  39. Wang, C.; Wang, X.; Shi, W.; Lu, W.; Tan, S.K.; Zhou, L. Experimental investigation on impingement of a submerged circular water jet at varying impinging angles and Reynolds numbers. Exp. Therm. Fluid Sci. 2017, 89, 189–198. [Google Scholar] [CrossRef]
  40. Speziale, C.G.; Thangam, S. Analysis of an RNG based turbulence model for separated flows. Int. J. Eng. Sci. 1992, 30, 1379–1388. [Google Scholar] [CrossRef]
  41. El Hassan, M.; Assoum, H.H.; Sobolik, V.; Vétel, J.; Abed-Meraim, K.; Garon, A.; Sakout, A. Experimental investigation of the wall shear stress and the vortex dynamics in a circular impinging jet. Exp. Fluids 2012, 52, 1475–1489. [Google Scholar] [CrossRef]
  42. Fairweather, M.; Hargrave, G. Experimental investigation of an axisymmetric, impinging turbulent jet. 1. Velocity field. Exp. Fluids 2002, 33, 464–471. [Google Scholar] [CrossRef]
  43. Ashforth-Frost, S.; Jambunathan, K. Effect of nozzle geometry and semi-confinement on the potential core of a turbulent axisymmetric free jet. Int. Commun. Heat Mass Transf. 1996, 23, 155–162. [Google Scholar] [CrossRef]
  44. Chen, M.; Huang, H.; Wang, D.; Lv, S.; Chen, Y. PIV tests for flow characteristics of impinging jet in a semi-closed circular pipe. J. Vib. Shock 2021, 40, 90–97, 113. [Google Scholar]
Figure 1. Geometric model.
Sustainability 15 05159 g001
Figure 2. Model grid schematic.
Sustainability 15 05159 g002
Figure 3. (a) Schematic diagram of the experimental setup; (b) PIV images of vertical impinging jets with velocity fields.
Sustainability 15 05159 g003
Figure 4. (a) Velocity distribution verification at the outlet of the jet pipe; (b) Distribution of flow angle in the mid-axis of the jet [39].
Sustainability 15 05159 g004
Figure 5. Along-range distribution of the dimensionless axial velocity of the jet at different impact distances.
Sustainability 15 05159 g005
Figure 6. Relationship between the distribution of potential core region and the impact height H/D.
Sustainability 15 05159 g006
Figure 7. The relationship between the potential core length Hp/H and the impact height H/D.
Sustainability 15 05159 g007
Figure 8. Along-range distribution of the flow angle φ of the jet at different impact distances.
Sustainability 15 05159 g008
Figure 9. Velocity distribution along the axis of the jet at different impinging regions.
Sustainability 15 05159 g009
Figure 10. The absolute value distribution of slope under different impact distances.
Sustainability 15 05159 g010
Figure 11. Velocity distribution of impinging jet on wall under different impinging distances.
Sustainability 15 05159 g011aSustainability 15 05159 g011b
Figure 12. Along-range distribution of the dimensionless axial velocity of the jet at different Reynolds numbers.
Sustainability 15 05159 g012
Figure 13. Along-range distribution of the flow angle φ of the jet at different Reynolds numbers.
Sustainability 15 05159 g013
Figure 14. Velocity distribution along the jet axis at different Reynolds numbers.
Sustainability 15 05159 g014
Figure 15. Velocity distribution of impinging jet on a wall under different Reynolds numbers.
Sustainability 15 05159 g015
Table 1. Slope and intercept of the linear variation of V/Vb as a function of l/D in the impinging region at different impinging distances and their standard errors.
Impinging Distance H/DSlope k(ki+1ki) × 10−2Standard Error KIntercept bStandard Error b
1−1.02709 0.031841.117850.01861
11.10900
2−0.91600 0.020531.898510.03141
1.33400
3−0.90266 0.026142.769970.06783
0.78100
4−0.89485 0.023363.653760.08207
1.67900
5−0.87806 0.027154.479090.12244
2.86400
6−0.84942 0.028135.191170.15494
4.88700
7−0.80055 0.023425.681750.1524
7.09600
8−0.72959 0.016985.892480.12745
Disclaimer/Publisher’s Note: The statements, opinions and data contained in all publications are solely those of the individual author(s) and contributor(s) and not of MDPI and/or the editor(s). MDPI and/or the editor(s) disclaim responsibility for any injury to people or property resulting from any ideas, methods, instructions or products referred to in the content.

