Article

Comparing the Carbon Footprint of Conventional and Organic Vineyards in Northern Italy

1
Agrofood Research Hub, Department of Civil Engineering, Architecture, Land, Environment and Mathematics, University of Brescia, Via Branze, 43, 25123 Brescia, Italy
2
Sata Agronomist Consultants, Piazza della Loggia 5, 25121 Brescia, Italy
3
Department of Agricultural and Environmental Science, University of Milan, Via Celoria 2, 20133 Milano, Italy
*
Author to whom correspondence should be addressed.
Sustainability 2023, 15(6), 5252; https://doi.org/10.3390/su15065252
Submission received: 25 January 2023 / Revised: 28 February 2023 / Accepted: 10 March 2023 / Published: 16 March 2023
(This article belongs to the Special Issue Sustainable Organic Agriculture and Food Supply Chains)

Abstract

:
The carbon footprint is an index used to assess the impact of an activity in terms of greenhouse gas emissions. Viticulture contributes to greenhouse gas emissions due to the use of fuels, fertilizers and pesticides, and the consequent soil erosion. Organic viticulture differs from conventional viticulture, mainly because of the absence of synthetic products, the soil tillage, and the level of organic carbon in the soil. The purpose of the study was to determine the actual differences between conventional and organic vineyard management in terms of greenhouse gas emissions, comparing multiannual data from 25 wineries in northern Italy. No statistically significant differences were found between the overall mean values of conventional and organic management. In organically farmed vineyards, a higher incidence of fuel consumption was observed, while in conventionally farmed vineyards higher emissions were observed, due to the use of such products as pesticides and fertilizers. No differences were found between the two management systems in terms of emissions resulting from direct fertilizing. Further assessment of the potential sequestration of organic fertilizer would be necessary.

1. Introduction

The carbon footprint (CF) is an indicator of global warming [1]. The CF expresses the amount of greenhouse gas emissions (GHGs) generated during the production or consumption of goods and converted into the CO2 equivalent (CO2-eq), according to their global warming potential [2]. It can be considered a simplified LCA, focusing on global warming as the only impact category [3]. CF can be assessed either at the corporate level, according to the ISO 14064 standard (2018) and the GHG Protocol for organizations (2004 and 2011), or at the product level, according to the ISO 14067 standard (2018) and the GHG Protocol for products (2011). The corporate CF method consists of calculating direct and indirect GHG emissions that a company generates over one year while performing its activities. Direct emissions are generated from sources controlled by a company, while indirect emissions are a consequence of the activities of a company [4]. All company products are included in the assessment of the corporate CF, and only one company product is assessed in the product CF [5]. Corporate CF is therefore a method used to assess the sustainability of a company according to the impact of its production activities on global warming.
Viticulture contributes to GHG emissions, due to the use of fertilizers, pesticides, water and fuels, and soil erosion and degradation, not to mention the production of a significant amount of organic waste [6]. In particular, the impact of fossil fuels in the carbon footprint of the vineyard stage is always particularly relevant in all flat vineyard systems. [7] In addition, the production of synthetic products used in viticulture can result in significant emissions, due to high resource and energy consumption. In addition to the high emissions from the production of fertilizers, particularly nitrogen fertilizers [8], there are also emissions from the production of synthetic pesticides, such as fungicides and insecticides, which can be particularly high in viticulture [9]. Even though viticulture leads to carbon sequestration by the vines and all cover crops, intensive vineyard cultivation needs to be correctly managed to reduce GHG emissions [10]. From this perspective, many wineries are now gearing towards sustainable grape-growing practices [11]. The key sustainable measures contemplate innovation and improvement in terms of energy and water consumption, the restricted use of environmentally harmful products such as pesticides and fertilizers, and the limitation of other pollutants potentially released into the ecosystem [12]. Among the certifications considering sustainable viticultural practices, the certification of organic wine is considered the most widespread [13]. In the European Union, this certification can be obtained if the vine grower complies with specific organic farming rules set forth by the European Parliament and Council Regulation 2018/848/EU. Compared to conventional management, organic viticulture management does not use synthetic products such as fertilizers and pesticides, applies different soil-tillage practices, and leads to a different level of organic carbon sequestered in croplands [14]. The wineries certified for sustainable organic viticulture tend to be perceived as businesses with a generally beneficial impact on the environment compared to those adopting conventional viticulture [15]. The FAO has highlighted the fact that both conventional and organic agriculture are key models for addressing global warming [16]. The question arises as to whether conventional and organic viticulture has an impact in terms of GHG emissions. Some authors have highlighted the fact that organic practices may not necessarily lead to a reduction in CF values, compared to conventional ones. The lower yields, the possible increase in the consumption of fuels necessary for the greater number of phytosanitary treatments, the need to adopt mechanical weeding, the high number of soil management interventions [17] and the transport of a large amount of manure and organic fertilizers could generate higher GHG emissions than conventional farming [18]. Furthermore, a number of studies have shown that conventional systems maximizing productivity have a reduced environmental impact according to several indicators, including the CF [19].
The current literature shows little knowledge of the real differences in the amount of greenhouse gas emissions in the organic versus conventional management of vineyards. There is an emerging need for an environmental assessment that takes into account the distinctive features of the two systems, based on a large sample of wineries with different characteristics over several years. This paper aims to obtain a comparative overview of organic and conventional vineyard management, focusing on the main categories of carbon dioxide emissions. The approach used is the corporate carbon footprint, involving 25 wineries in northern Italy over nine different vintages. The extent of the dataset of the present study, both in terms of wineries and in terms of years, allows for the obtaining of a real comparison of the effects of organic and conventional viticulture strategies over the long term.

2. Materials and Methods

2.1. Geographical Location and Years of Study

The study involved 25 wineries, located in four administrative regions of northern Italy. Six wineries adopting organic management practices (ORG) were certified according to EU Regulation 2018/848, or, while not certified, did not use synthetic products in plant protection, weed management, fertilization, or other practices. Nineteen wineries were conventionally managed (CONV), meaning that they used synthetic products for at least one phase of grape production. The data collected refer to the years 2009–2017. A case study represents the overall data collected in one year from one farm. For the years 2009, 2010, 2011, 2014 and 2016, it was possible to collect more case studies for both management systems. Table 1 shows the administrative regions, the years and the average vineyard surface area managed, with maximum and minimum values, by each winery available for CONV and ORG, for the number of case studies.

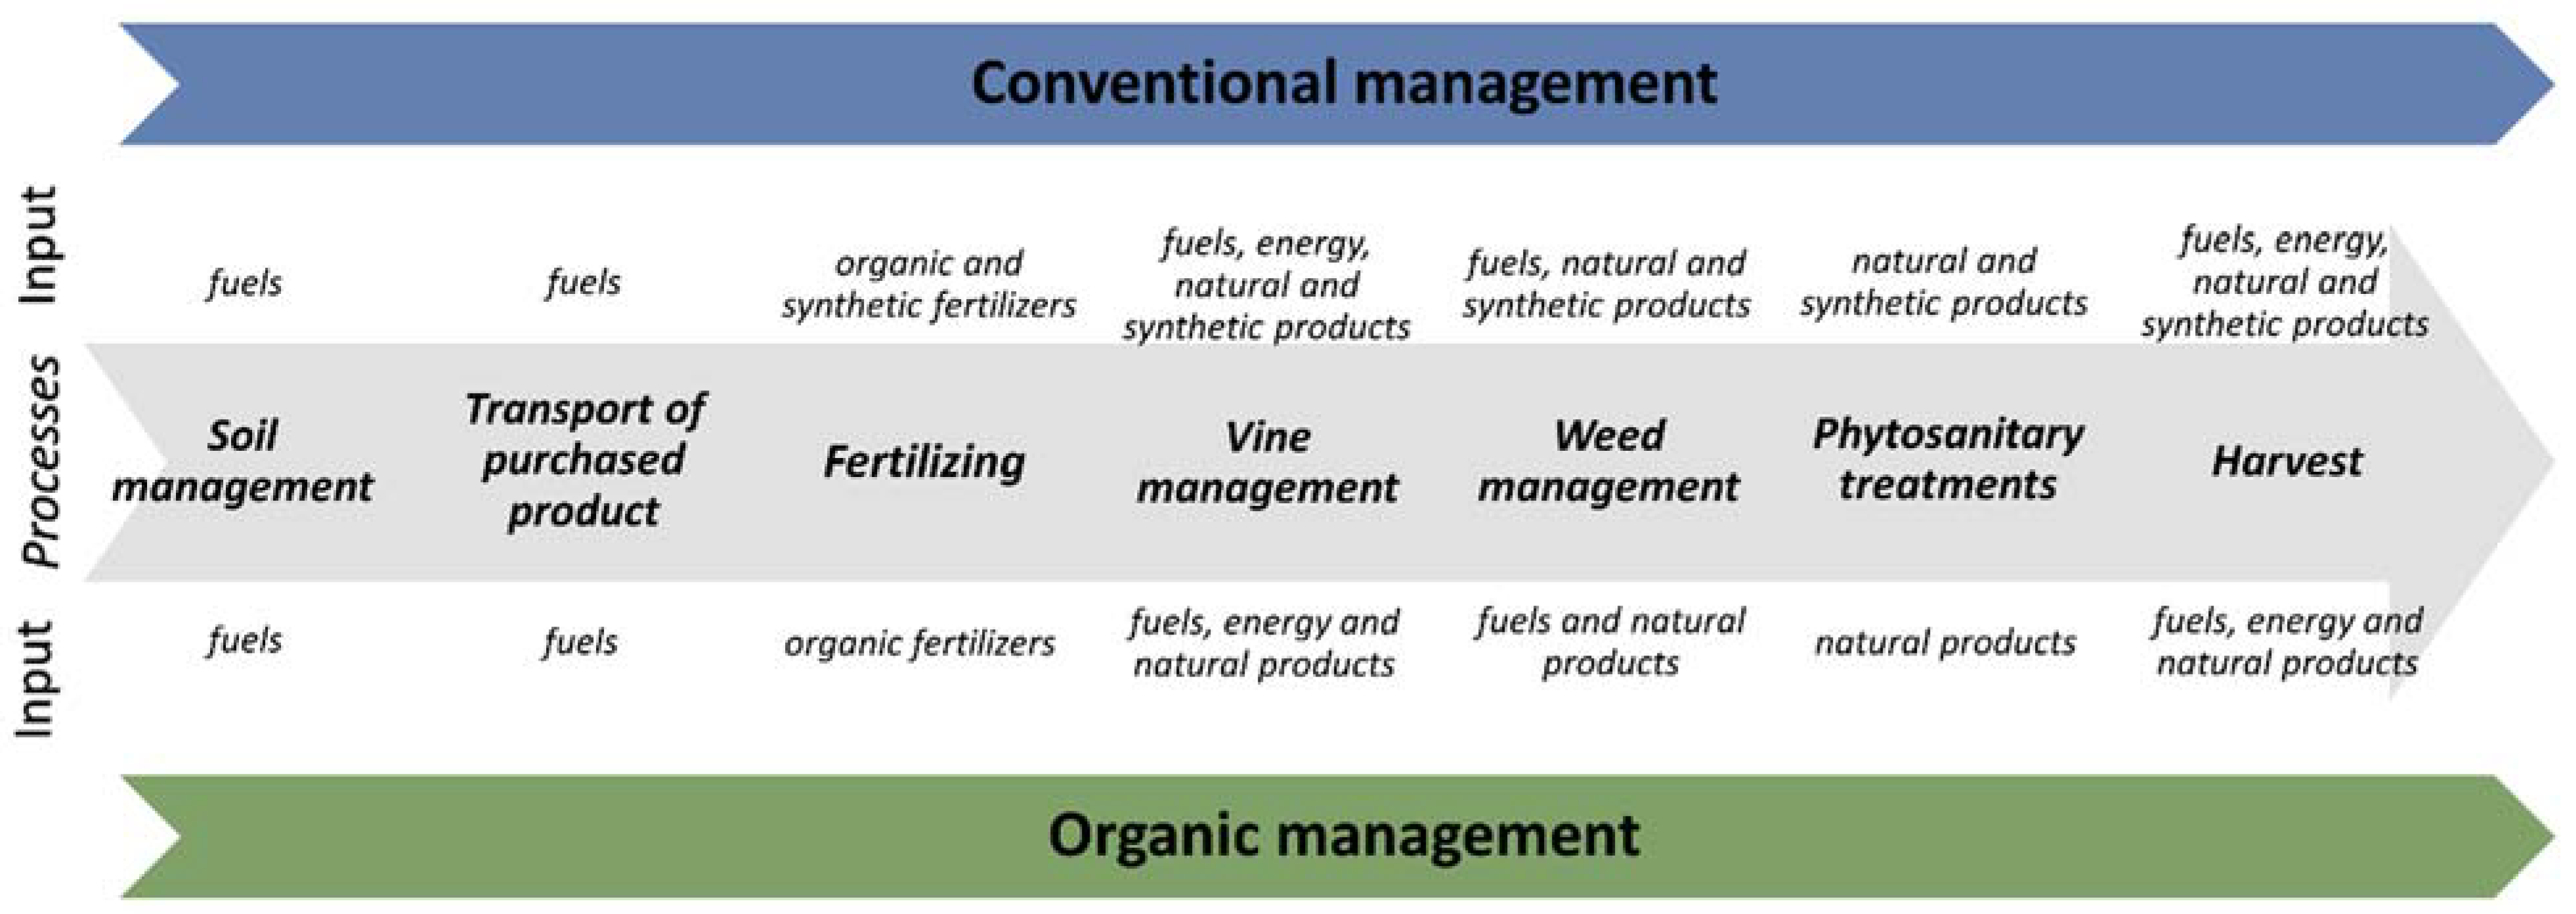
2.2. System Boundaries and Description of Viticultural Practices

Figure 1 describes the processes associated with organic and conventional vineyard management. According to specific European Parliament and Council rules on organic agriculture (Regulation 2018/848/EU), ORG differs from CONV in a number of agronomic aspects: (i) control of weeds and pests is allowed only by the application of mechanical and physical methods, (ii) the exclusive use of natural or naturally derived substances, such as organic or mineral low-solubility fertilizers, and (iii) the exclusive use of natural or mineral products for pest control, such as sulfur and copper for fungal treatments and plant-extracted pyrethrins for insecticide treatments, with specific restrictions [20,21].
In this study, a cradle-to-gate approach is adopted, and therefore the system boundaries include all the main sources of GHG emissions during the production processes in accordance with ISO 14064 [22]. The production process was considered to be from post-harvest operations to the delivery of the following year’s grapes to the winery, regardless of the post-agricultural life cycle stages, as described in Figure 1. All inputs related to the stages of grape production shown in Figure 1 were included. According to other studies [23], co-products from grape production (e.g., pruning waste) do not fall within the production system boundaries. Regarding direct emissions, this study did not consider specific mechanical soil cultivation, due to the lack of information on each individual vineyard. Indirect GHG emissions from machinery, infrastructure (including vineyard planting) and vehicles were excluded, because they were considered negligible compared to the overall impact [24]. Emissions generated from waste management were also considered negligible as, unlike wine-making or bottling operations, they are not relevant during grape production [25]. No complete data were available on irrigation water and energy required by the pumps for vineyard irrigation; therefore, these sources of emissions were neglected. The vine nursery phase was also excluded from the study, considering that the average number of vines replaced on an annual basis is low [23].

2.3. Primary Data Acquisition

A survey was prepared and submitted to wineries in order to obtain the primary data necessary for CF calculation: type of management (conventional/organic), total vineyard surface area managed (ha), type and quantity of fertilizers consumed, type and quantity of pesticides consumed, transport of purchased products, fuel consumption of vehicles owned by the winery, rented, or owned by agricultural contractors. Data on fuel consumption which related to the use of farming machinery owned by the winery or agricultural contractors were collected directly, as the amount of fuel consumed (e.g., kilos of diesel and petrol), whereas fuel consumption related to the use of vehicles for other activities, such as off-road vehicles, were collected as mileage traveled. For fuel consumption, aggregate data from the use of tractors and other vehicles were considered without separation, in a single operation. As envisaged in the latest version of the ISO 14064 standard, the transport of the purchased products was calculated by determining the weight of the products and the mileage covered upstream of the supply chain. Workers’ commuting trips were not considered, due to lack of data. The amount of specific active principle was collected for the mineral or synthetic fertilizers, pesticides, and herbicides. The concentration stated on the label was used to determine the amount in kg of nitrogen contained in synthetic fertilizers. In the case of organic fertilizers (e.g., manure, compost, solid fraction of digestate), the nitrogen content was determined using data on organic matrices collected in several Italian geographical areas during the LIFE VITISOM Project [26].

2.4. Corporate Carbon-Footprint Method

Primary data were aggregated and classified into three categories and five subcategories according to ISO 14064:2018. A total of twelve entries were defined, based on data collected from questionnaires submitted to wineries (Table 2). Starting from the wineries’ primary data, the corporate CF was determined adopting Ita.Ca® (Italian Wine Carbon Calculator), a tool for calculating greenhouse gas emissions specifically for the Italian wine sector. Ita.Ca® protocol is based on the OIV-GHG (Organisation Internationale de la Vigne et du Vin-Greenhouse Gas) emissions calculator, which is publicly available (on the OIV website) and built on the International Wine Carbon Calculator (IWCC) guidance [27]. In addition, the Ita.Ca® carbon calculator complies with the ISO14064 standard [22]. The carbon footprint can be quantified using the following equation:
C F = Σ ( P d i · E F i )
where P d i is the primary datum quantifying a specific process (i) and E F i is the emission factor of the specific process (i).
Ita.Ca® provides the use of specific emission factors (EFs) derived from the main LCA databases, including the UK Department for Environment, Food and Rural Affairs [28], the French ADEME, Agence de l’environnement et de la maîtrise de l’énergie, Bilan Carbone database [32], and the ecoinvent database, as well as publications of the Joint Research Centre (JRC), the European Commission’s science and knowledge service and the Intergovernmental Panel on Climate Change (IPCC). An example of emission computation using Ita.Ca® is shown in Figure S1 of the Supplementary Materials. The adoption of different databases allows for the increase in accuracy and specificity of emission factors [34]. In Table 2, EFs used for direct emissions from the use of vehicle fuels include indirect emissions related to the production and transportation of fuels. A specific EF has been used for each type of fuel or vehicle (e.g., diesel, LPG, petrol), derived from DEFRA [28]. In the case of plant protection products, specific EFs found in the ecoinvent, and Bilan Carbone databases were used, when available; otherwise, an average EF value was applied. For herbicides, the glyphosate emission factor was used [35]. In the case of urea, it was taken into consideration the fact, that during fertilizing, CO2 is also released into the atmosphere, in addition to N2O emissions [30]. The attribution of environmental impact to organic fertilizers can be a controversial issue in agricultural systems [23,36,37]. As for manure, digestate, and the waste from other production systems, the approach proposed by several authors was adopted; this includes only the impact directly related to viticultural practices, such as the transport and direct fertilizing, in relation to the release into the atmosphere of GHGs, such as nitrous oxide, into the atmosphere [24,38,39]. As indicated by Zampori and Pant [29], N2O direct and indirect emissions must be estimated by taking into account 0.022 kg of N2O emitted into the atmosphere for each kg of synthetic N fertilizer and organic fertilizer applied.
We decided to express the functional unit as mass per unit of surface area, i.e., kg of CO2 equivalent per hectare, per year ( k g C O 2 e q · h a 1 y 1 ). A comparison among wineries of different dimensions and different limits of yield defined by wine origin regulations, as those considered in the present study, could not be performed using kg CO2-eq per kg of grape as the functional unit [40,41].

2.5. Data Analysis

An analysis of variance (ANOVA) was conducted to assess whether the total impact per hectare differed significantly between the two types of management, CONV and ORG. The relevance of the crop years was also tested, given that different agronomic practices may have been adopted due to climatic conditions and pest pressure. Therefore, the effects of management and winery, management, and year (two-way ANOVA) and the combination of management, winery, and year (three-way ANOVA) were tested (function aov and TukeyHSD, R software). The second stage of analysis focused on the difference between the CF of direct- and indirect-emission subcategories, according to management type. The non-parametric Wilcoxon rank-sum test for two independent groups of samples was used (function Wilcox. Test, R software).

3. Results

3.1. Inventory Data for Vineyard Inputs

Table 3 shows the mean, standard deviation, minimum and maximum values obtained for the key inputs in the vineyard, according to the management systems (ORG or CONV).
Inputs for fertilizers, fungicides, insecticides, and herbicides are reported as active substances. Some inputs considered in the categories of fertilizers, fungicides, herbicides, and insecticides are not considered in the case of the ORG system (-) because they cannot be used in organic agriculture based on the specific rules and regulations set forth by the European Parliament and Council Regulation 2018/848/EU. The minimum value recorded in the case of fuels (direct and indirect emissions) is zero, because some wineries carry out farming operations using owned vehicles only (direct emissions) or, conversely, using rented or farm-contractor vehicles only (indirect emissions).

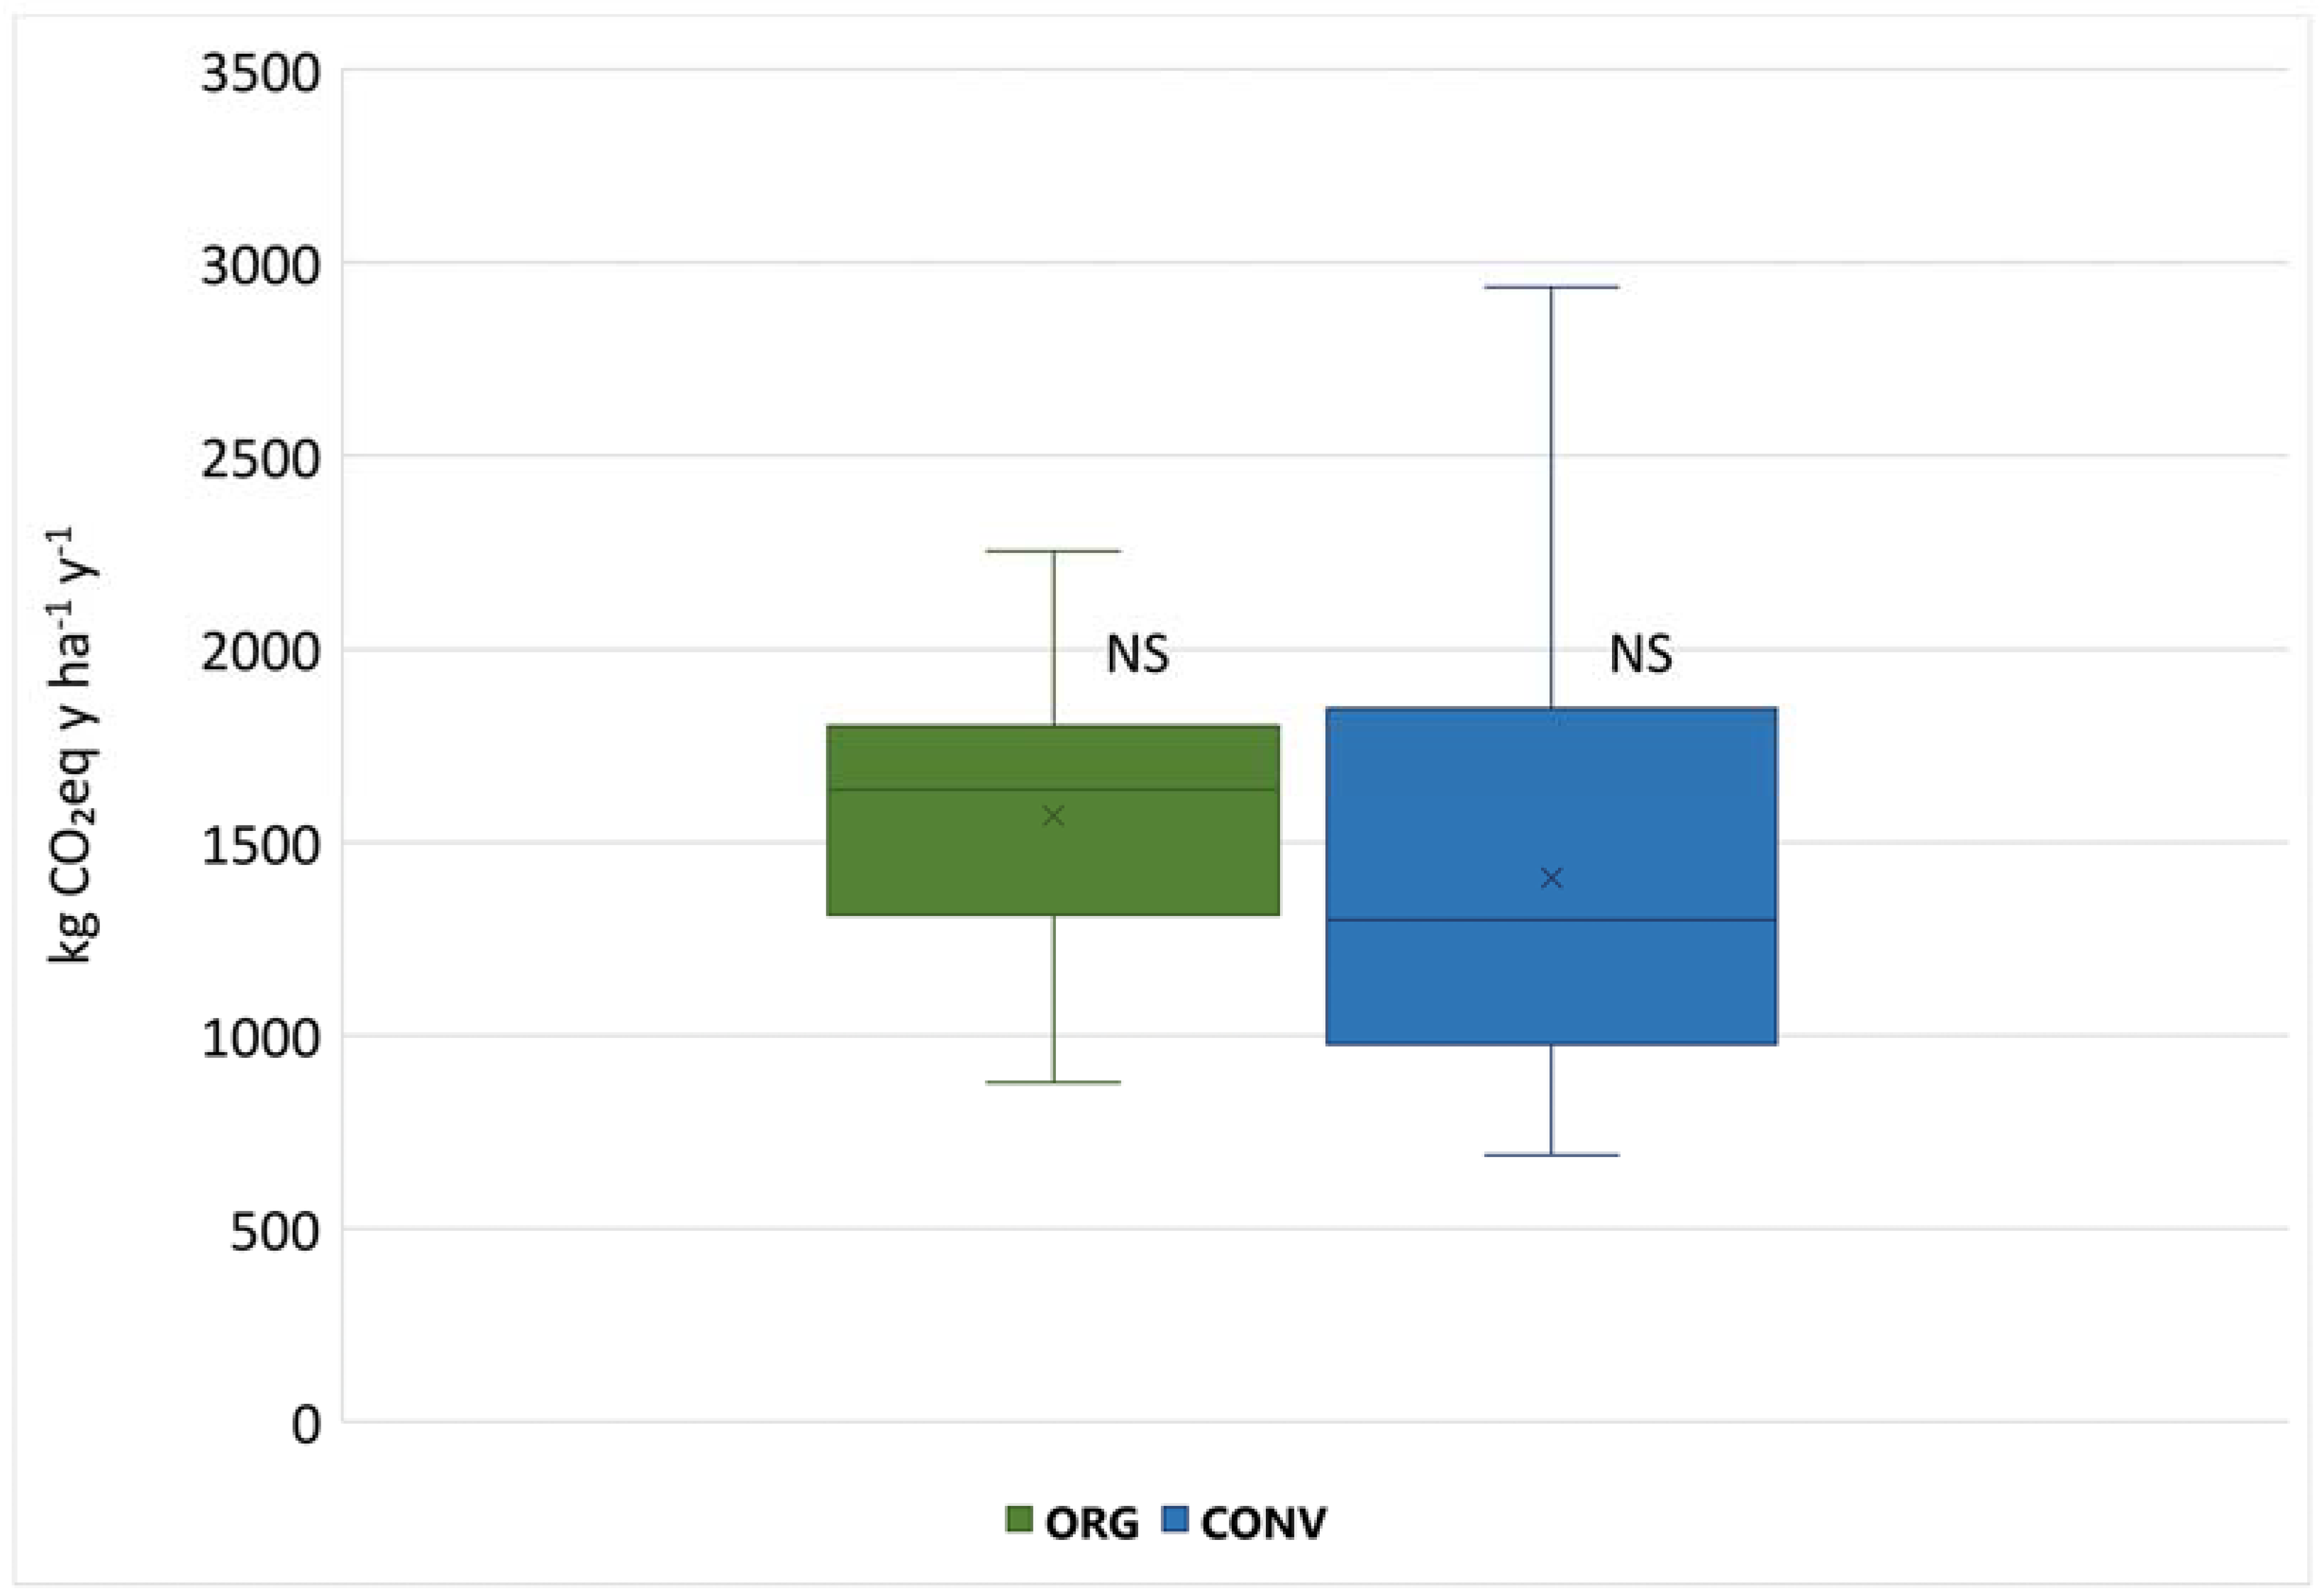
3.2. Overall Organic and Conventional Viticulture Carbon-Footprint Results

As shown in Table 4, the overall emissions from the wineries range between 690.39 and 2937.03 kg CO2-eq ha−1 y−1. The median carbon footprint is 1408.34 and 1568.77 kg CO2-eq ha−1 y−1 for the CONV and ORG wineries, respectively. Data analysis (Figure 2) reveals a high variability of data in the ORG system, and an even higher one in the CONV system. The mean values of the overall impacts in the CONV and ORG systems show no significant differences. Comparison of mean values of overall impacts by management by single year also show no significant differences, in any year of the study.

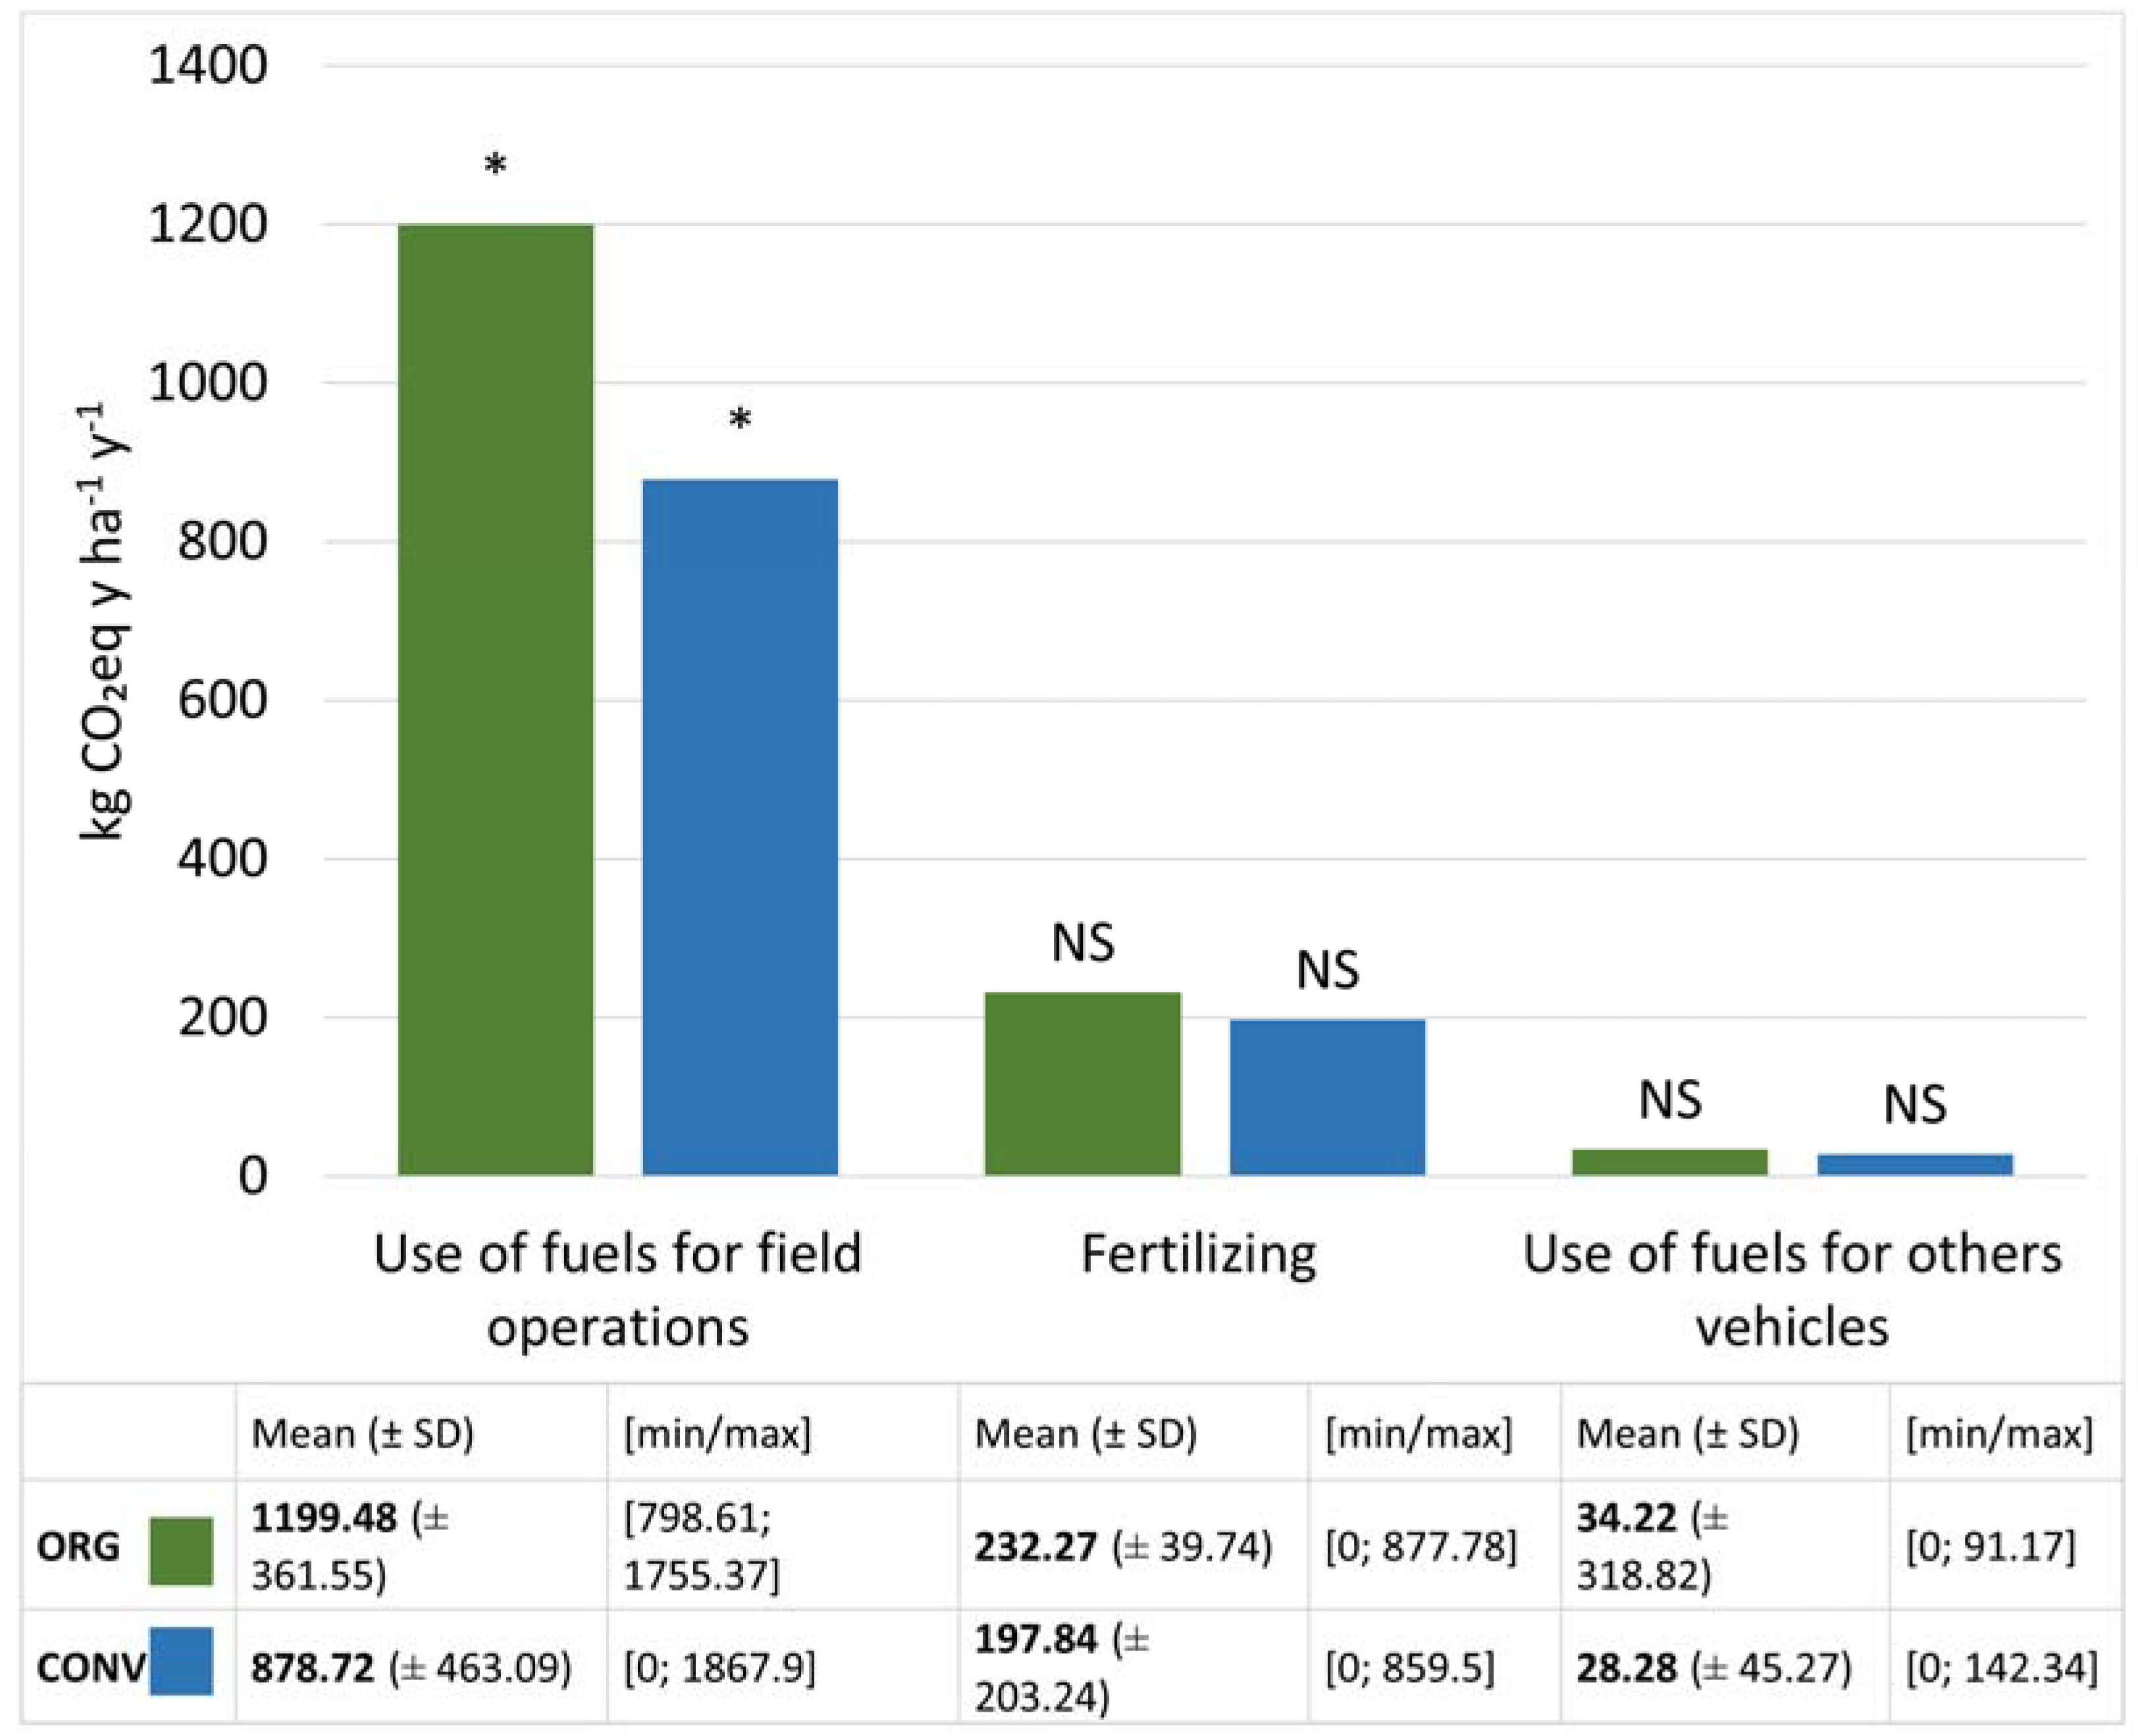
3.3. Direct Emissions in Organic and Conventional Management

As shown in Figure 3, emissions from “Use of fuels for field operations” show a high range of variability. This category represents the main contribution to direct emissions for both ORG and CONV systems, with a mean value of 1199.48 kg CO2-eq ha−1 y−1 in the case of organic management and 878.72 kg CO2-eq ha−1 y−1 in the case of conventional management. Direct nitrogen emissions generated by fertilizer distribution (Fertilizing) show an overall average value of 205.42 kg CO2-eq ha−1 y−1; these emissions, together with the consumption of fuels, represent the greatest contribution to the value of direct emissions.
In Figure 3, the category “Use of fuels for field operations” refers to emissions from the use of own agricultural machinery, while the category “Use of fuels for other vehicles” refers to cars and vehicles, other than the winery’s own agricultural machinery. The emissions due to “Use of fuels for field operations” resulted as statistically significant (p-value < 0.01) between ORG and CONV, while non-statistically significance is detected for Fertilizing and Use of fuels for other vehicles (Figure 3).

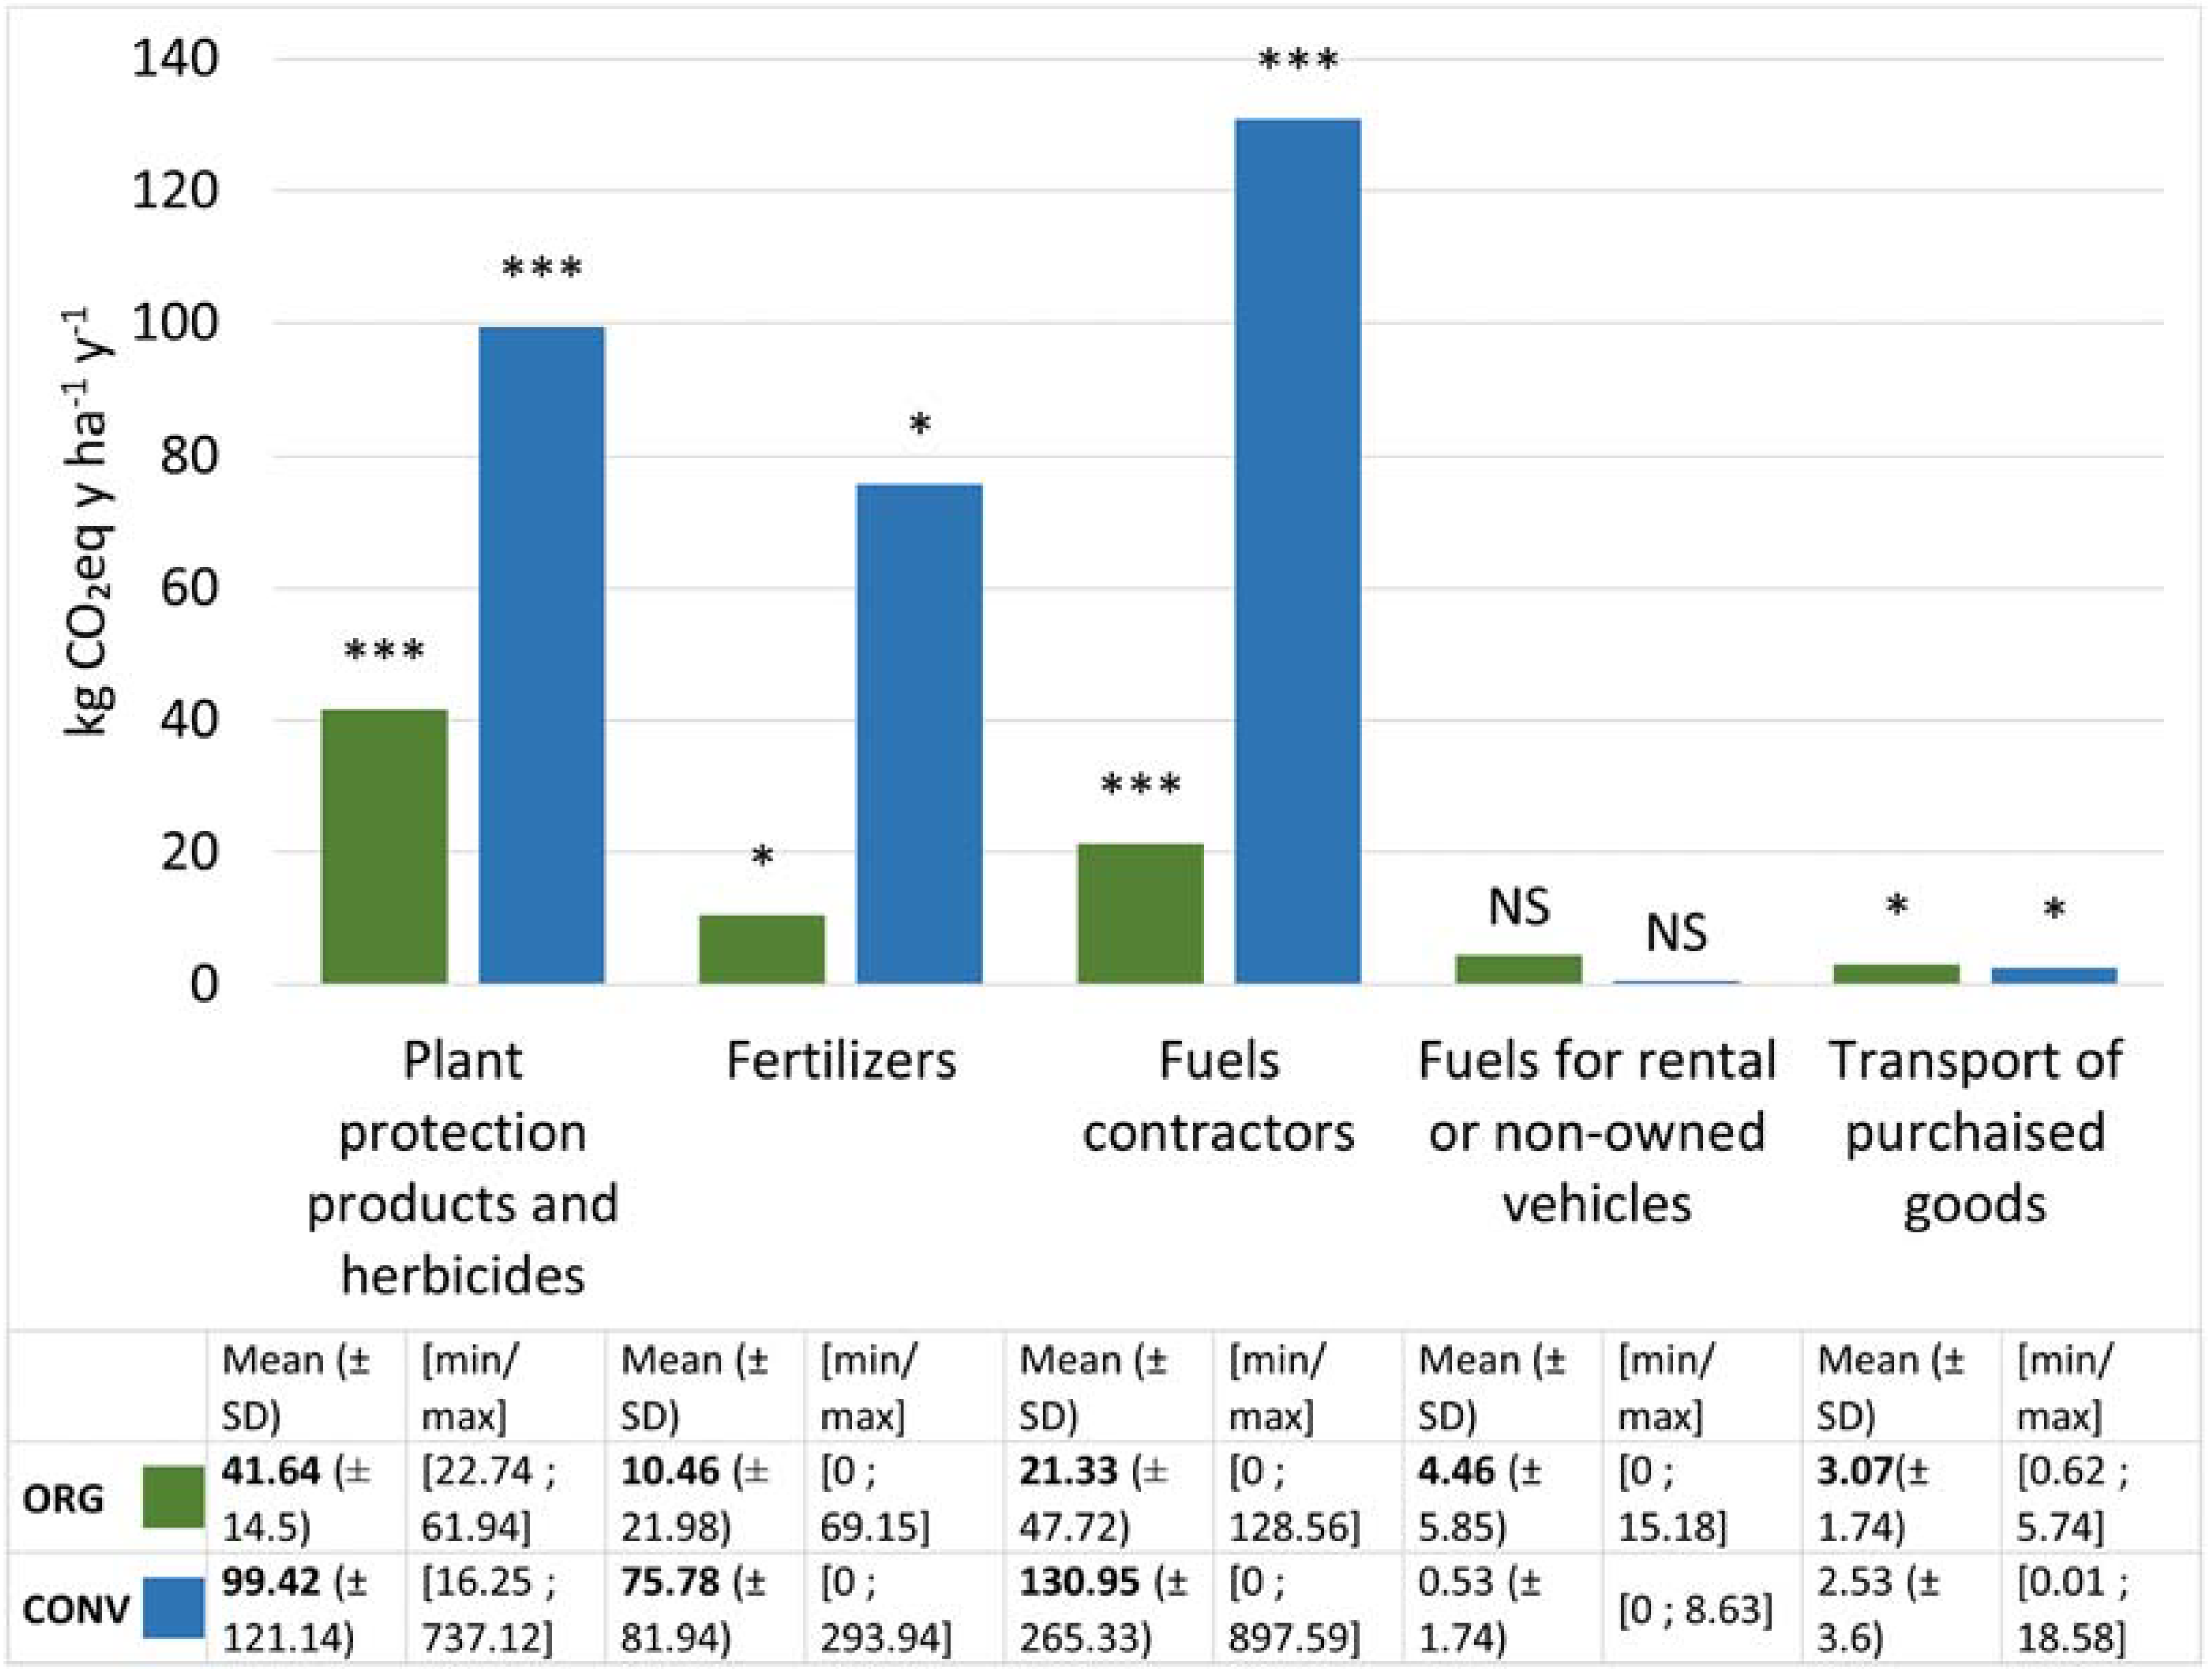
3.4. Indirect Emissions in Organic and Conventional Management

Under the categories “Fertilizers” and “Plant protection products and herbicides” indirect emissions (Figure 4) in CONV where higher than those in ORG. The lower value in the “Fertilizers” category for ORG vs CONV is due to the exclusion of indirect emissions for manure and digestate, whose production emissions are excluded as waste from other production systems. Emissions from the transport of goods purchased account for less than 1% of overall indirect emissions, in both the CONV and ORG systems.
The Wilcoxon test (Figure 4) confirmed the existence of statistically significant differences between CONV and ORG. The indirect emissions due to fertilizers, plant protection products and herbicides, and fuels for contractors in CONV are higher than those associated with ORG (p-values < 0.01, <0.001, <0.001, respectively). Indirect emissions from the transport of goods purchased are higher for the ORG system (p-value < 0.001). No significant differences are found for “Fuels for rental or not-owned vehicles”.

4. Discussion

Overall GHG emissions. In this study, the overall mean value of corporate CF is 1443.63 kg CO2-eq ha−1 y−1. For ORG, the mean value is 1568.77 kg CO2-eq ha−1 y−1, while for CONV the mean value is 1408.34 of kg CO2-eq ha−1 y−1. High variability was observed, with corporate results ranging from 690.39 to 2937.03 kg CO2-eq ha−1 y−1. No statistically significant difference was found, probably also due to the high heterogeneity of company CF estimated within each management system.
For a winery in the north-east of Italy, Borsato et al., 2020 [4] in a study involving an organically managed vineyard and a conventionally managed one, showed a greater emission n 1827 kg CO2-eq ha−1 y−1 in the organic vineyard. Different values were found by Volanti et al., 2022 [12] who, in a study involving three Spanish wineries using different management systems, estimated a CF ranging from 57.4 to 289.3 kg CO2-eq ha−1 y−1 for ORG and 438.3 to 481.0 kg CO2-eq ha−1 y−1 for the CONV wineries. Average values similar to those presented here have been found by Renaud-Gentié et al., 2020 [42] who, in a multi-year study conducted on 12 plots using different management systems, located in three different French wine-growing regions, found average CF values of approximately 1300 kg CO2-eq ha−1 y−1.
According to Tuomisto et al., 2012 [43] ORG and CONV should be understood not as one viticulture system, but rather as a set of different practices. Therefore, the level of greenhouse gas emissions depends more on the choice of winery management than the management system. Some ORG wineries may have low CF values as a result of minimal use of inputs, fertilizing based on the addition of organic-soil improvers and the use of non-synthetic products with a low-emission impact, as argued by Reganold and Wachter, 2016 [44]. Similarly, some CONV wineries may have lower CF values from optimizing energy inputs and fertilizing with not only synthetic products but also organic-soil improvers.
Direct GHG emissions. The contribution of the category “Use of fuels for field operations”, with an average value of 1199.48 kg CO2-eq ha−1 y−1, accounts for 79.69% of the main emissions in the case of ORG systems, while it accounts for 61.99% in CONV systems, with an average value of 878.72 kg CO2-eq ha−1 y−1 (Figure 5).
As noted by Gierling et al. [45], due to fossil fuels, the impact is particularly relevant within the carbon footprint of grape production. This is, in fact, a consequence of mechanization. In addition, Rouault et al., 2016 [46] in a study comparing the organic and conventional system in a Chenin Blanc vineyard in the Loire Valley, noted that the major carbon footprint impact in both management systems is due to fuel consumption, especially for plant protection treatments and soil management operations. The high contribution of “Fuels for field operations” to corporate CF is confirmed also by other studies. In research involving 14 grape producers from four German administrative regions, Ponstein et al., 2019 [35] observed the higher incidence of this category, with an average value of 565.59 kg CO2-eq ha−1 y−1, compared to the overall emissions. Litskas et al., 2020 [17] analyzed three different vineyards in Cyprus, with high or low conventional input and organic management, and observed a higher incidence of emissions from fuel consumption in ORG systems than from other factors, which is in line with what has emerged in this paper.
Increased fuel consumption in ORG systems vs CONV systems can be expected in relation to the high number of tractor transits in ORG systems [17,47]. In fact, non-synthetic copper-based fungicides are largely lost in foliar wash-off from vine leaves treated, due to the action of rainfall [48], with the consequent need for numerous interventions in rainy periods and hence greater diesel consumption. Similarly, the non-use of herbicides entails the need for a greater number of tillage operations, such as hoeing and mowing, for mechanical weed control [46].
Direct emissions of nitrous oxide and carbon dioxide into the atmosphere during “Fertilizing” did not reveal any significant differences between the CONV and ORG systems. For both operations, some companies recorded zero emissions because of a lack of fertilizing in the study year. In accordance with the results of Venkat, 2012 [18], which compared 12 agricultural products, including wine grapes grown in California, with ORG and CONV management systems, direct emissions for fertilizing are similar for both systems, whereas CONV wineries limit the use of synthetic fertilizers.
As required by the legislation on organic farming, emissions related to synthetic fertilizing only concern CONV wineries when using synthetic fertilizers such as urea. For this reason, in ORG systems, the contribution of organic carbon is generally higher than that of CONV systems. Although the direct emissions from organic fertilizing are significant, it would be interesting to deepen the environmental benefits derived from the use of these matrices, such as the improvement in the chemical–physical structure of the soil, the stimulation of the soil microbiota [49], and the natural sequestration and maintenance of the soil carbon stock [50,51]. Furthermore, it is to be considered that, unlike synthetic fertilizers produced specifically for agricultural fertilizing, organic fertilizers, which are often waste products from other activities, would still have an environmental impact.
Indirect GHG emissions. In CONV wineries, the amount of indirect emissions due to “Fertilizers” and “Plant protection products and herbicides” is higher than that in ORG wineries (Figure 5). A total of 99.42 kg CO2-eq ha−1 y−1 indirect emissions from “Pesticides and herbicides” were estimated on average in the CONV, compared to 41.64 kg CO2-eq ha−1 y−1 in the ORG, while the average estimated emissions due to “Fertilizers” in CONV was 75.78 kg CO2-eq ha−1 y−1, which was more than 7 times the value measured in the ORG (10.46 kg CO2-eq ha−1 y−1). As observed by Cech et al. [9], in the case of CONV systems, due to the production of pesticides (fungicides, herbicides and insecticides), the impact is greater overall than that of organic fertilizers, which are also used in the case of some CONV systems.
Our estimates are consistent with the results obtained by Chiriacò et al., 2019 [10]. The authors, who were assessing the GHG balance in an organic winery in the Lazio administrative region (Central Italy), found that organic wineries can state emissions for the category “Plant protection products” lower than 10 kg CO2-eq ha−1 y−1, due to the non-use of synthetic products. In the Global Warming category, Volanti et al., 2022 [12] also found a significant impact for conventional farming, as the result of the use of fertilizers and synthetic products as herbicides.
Synthetic fertilizers, pesticides and herbicides are key inputs in CONV systems; in contrast, ORG systems are based on the use of natural mineral or organic substances, generating fewer indirect emissions [52].
Regarding the differences highlighted in the “Fuels for contractors” category, where high values were found in CONV cellars, it is important to note that, although they are divided, these emissions are similar to the fuel consumption for field operations. In fact, if the winery did not employ contractors, it would be required to directly manage the operations in the field. This category depends very much on the strategic choices and the winery’s specific characteristics; indeed, equipment cost and size, as well as the rapid pace of technological innovation, all affect the choice of whether to use contractors, especially in small and medium-sized farms [53].

5. Conclusions

In conclusion, the study of twenty-five wineries, including nineteen CONV and six ORG, during several years of harvesting, did not reveal statistically significant differences between the overall CF of ORG and CONV wineries. The extent of the dataset made it possible to highlight the differences in impact of each category within the two systems.
In relation to the total amount of GHG emissions, beyond the management system (ORG or CONV), a specific management approach is to be considered, depending on each winery’s characteristics and production strategies. A management approach encompassing the agricultural technical specifications according to the characteristics of the winery is more effective in mitigating corporate emissions. In both management systems, the greatest impact is due to fuel consumption for field operations, which suggests precise monitoring of fuel consumption in order to optimize management strategies. This is particularly relevant in ORG systems, due to a high number of plant protection treatments and mechanical weed control.
Nitrogen fertilizing has an important impact on CF, both in ORG and CONV systems, mainly in relation to the release of nitrous oxide into the atmosphere. Organic fertilizing, which is more common in ORG vineyards, should also be considered as a mitigation action contributing to the increase in naturally fixed carbon stock in the soil. The integration of organic carbon sequestration in the CF analysis can consequently lead to a more complete comparison of ORG and CONV systems. As already explored by Abad et al. [54], another aspect that can be explored in future studies is the potential effect of the use of cover crops in the vineyard.
In the case of indirect emissions, synthetic products have a greater impact in terms of greenhouse gas emissions, although these emissions have a low share overall.
From what has been observed with respect to the main GHG emissions, it is possible to adopt some mitigation strategies for both management systems: (i) the innovation in technology, introducing agricultural machineries with a greater efficiency in fuel consumption, (ii) a reduction in the number of interventions in the field, reducing the depth of soil tillage [36], and (iii) the optimization of the number of treatments, based on weather conditions and previous fungal infections [55].

Supplementary Materials

The following supporting information can be downloaded at: https://www.mdpi.com/article/10.3390/su15065252/s1, Figure S1: Ita.Ca® Computation.

Author Contributions

Conceptualization, I.G. and G.G.; Methodology, M.T., P.D. and L.V.; Formal analysis, I.G., A.S., L.F. and G.G.; Investigation, I.G., M.T., P.D. and L.V.; Data curation, I.G., A.S. and L.F.; Writing—original draft, I.G., A.S. and L.F.; Writing—review & editing, M.T., P.D., L.V. and G.G.; Supervision, G.G. All authors have read and agreed to the published version of the manuscript.

Funding

This research received no external funding.

Institutional Review Board Statement

Not applicable.

Informed Consent Statement

Not applicable.

Data Availability Statement

Data sharing is not applicable to this article.

Acknowledgments

The authors thank all the wineries that provided the primary data for this study.

Conflicts of Interest

The authors declare that they have no known competing financial interests or personal relationships that could have appeared to influence the work reported in this paper.

References

  1. Pörtner, H.O.; Roberts, D.C.; Adams, H.; Adler, C.; Aldunce, P.; Ali, E.; Begum, R.A.; Betts, R.; Kerr, R.B.; Biesbroek, R.; et al. Climate Change 2022: Impacts, Adaptation and Vulnerability; IPCC: Geneva, Switzerland, 2022. [Google Scholar]
  2. Röös, E.; Sundberg, C.; Tidåker, P.; Strid, I.; Hansson, P.-A. Can Carbon Footprint Serve as an Indicator of the Environmental Impact of Meat Production? Ecol. Indic. 2013, 24, 573–581. [Google Scholar] [CrossRef]
  3. Pattara, C.; Raggi, A.; Cichelli, A. Life Cycle Assessment and Carbon Footprint in the Wine Supply-Chain. Environ. Manag. 2012, 49, 1247–1258. [Google Scholar] [CrossRef] [PubMed]
  4. Borsato, E.; Zucchinelli, M.; D’Ammaro, D.; Giubilato, E.; Zabeo, A.; Criscione, P.; Pizzol, L.; Cohen, Y.; Tarolli, P.; Lamastra, L.; et al. Use of Multiple Indicators to Compare Sustainability Performance of Organic vs Conventional Vineyard Management. Sci. Total Environ. 2020, 711, 135081. [Google Scholar] [CrossRef]
  5. Navarro, A.; Puig, R.; Fullana-i-Palmer, P. Product vs Corporate Carbon Footprint: Some Methodological Issues. A Case Study and Review on the Wine Sector. Sci. Total Environ. 2017, 581–582, 722–733. [Google Scholar] [CrossRef] [PubMed]
  6. Bandinelli, R.; Acuti, D.; Fani, V.; Bindi, B.; Aiello, G. Environmental Practices in the Wine Industry: An Overview of the Italian Market. Br. Food J. 2020, 122, 1625–1646. [Google Scholar] [CrossRef]
  7. Gierling, F.; Blanke, M. Lower Carbon Footprint from Grapevine Cultivation on Steep Slopes Compared with Flat Terrain? A Case Study. Acta Hortic. 2021, 1327, 703–706. [Google Scholar] [CrossRef]
  8. Menegat, S.; Ledo, A.; Tirado, R. Greenhouse Gas Emissions from Global Production and Use of Nitrogen Synthetic Fertilisers in Agriculture. Sci. Rep. 2022, 12, 14490. [Google Scholar] [CrossRef] [PubMed]
  9. Cech, R.; Leisch, F.; Zaller, J.G. Pesticide Use and Associated Greenhouse Gas Emissions in Sugar Beet, Apples, and Viticulture in Austria from 2000 to 2019. Agriculture 2022, 12, 879. [Google Scholar] [CrossRef]
  10. Chiriacò, M.V.; Belli, C.; Chiti, T.; Trotta, C.; Sabbatini, S. The Potential Carbon Neutrality of Sustainable Viticulture Showed through a Comprehensive Assessment of the Greenhouse Gas (GHG) Budget of Wine Production. J. Clean. Prod. 2019, 225, 435–450. [Google Scholar] [CrossRef]
  11. Tsalidis, G.A.; Kryona, Z.-P.; Tsirliganis, N. Selecting South European Wine Based on Carbon Footprint. Resour. Environ. Sustain. 2022, 9, 100066. [Google Scholar] [CrossRef]
  12. Volanti, M.; Cubillas Martínez, C.; Cespi, D.; Lopez-Baeza, E.; Vassura, I.; Passarini, F. Environmental Sustainability Assessment of Organic Vineyard Practices from a Life Cycle Perspective. Int. J. Environ. Sci. Technol. 2022, 19, 4645–4658. [Google Scholar] [CrossRef]
  13. Letamendi, J.; Sevigne-Itoiz, E.; Mwabonje, O. Environmental Impact Analysis of a Chilean Organic Wine through a Life Cycle Assessment. J. Clean. Prod. 2022, 371, 133368. [Google Scholar] [CrossRef]
  14. Ahrens, F.; Land, J.; Krumdieck, S. Decarbonization of Nitrogen Fertilizer: A Transition Engineering Desk Study for Agriculture in Germany. Sustainability 2022, 14, 8564. [Google Scholar] [CrossRef]
  15. Baiano, A. An Overview on Sustainability in the Wine Production Chain. Beverages 2021, 7, 15. [Google Scholar] [CrossRef]
  16. FAO. Adaptation to Climate Change in Agriculture, Forestry and Fisheries: Perspective, Framework and Priorities; FAO: Rome, Italy, 2007. [Google Scholar]
  17. Litskas, V.; Mandoulaki, A.; Vogiatzakis, I.N.; Tzortzakis, N.; Stavrinides, M. Sustainable Viticulture: First Determination of the Environmental Footprint of Grapes. Sustainability 2020, 12, 8812. [Google Scholar] [CrossRef]
  18. Venkat, K. Comparison of Twelve Organic and Conventional Farming Systems: A Life Cycle Greenhouse Gas Emissions Perspective. J. Sustain. Agric. 2012, 36, 620–649. [Google Scholar] [CrossRef]
  19. Korsaeth, A. Relations between Nitrogen Leaching and Food Productivity in Organic and Conventional Cropping Systems in a Long-Term Field Study. Agric. Ecosyst. Environ. 2008, 127, 177–188. [Google Scholar] [CrossRef]
  20. EC Commission Implementing Regulation (EU) 2021/1165 of 15 July 2021 Authorising Certain Products and Substances for Use in Organic Production and Establishing Their Lists (Text with EEA Relevance); Official Journal of the European Union: Brussels, Belgium, 2021; Volume 253.
  21. EP, EC Regulation (EU) 2018/848 of the European Parliament and of the Council of 30 May 2018 on Organic Production and Labelling of Organic Products and Repealing Council Regulation (EC) No 834/2007. 2018. Available online: http://data.europa.eu/eli/reg/2018/848/oj (accessed on 24 June 2022).
  22. ISO 14064; Greenhouse Gases—Part 1: Specification with Guidance at the Organization Level for Quantification and Reporting of Greenhouse Gas Emissions and Removals. International Organization for Standardization: Geneva, Switzerland, 2018.
  23. Villanueva-Rey, P.; Vázquez-Rowe, I.; Moreira, M.T.; Feijoo, G. Comparative Life Cycle Assessment in the Wine Sector: Biodynamic vs. Conventional Viticulture Activities in NW Spain. J. Clean. Prod. 2014, 65, 330–341. [Google Scholar] [CrossRef]
  24. D’Ammaro, D.; Capri, E.; Valentino, F.; Grillo, S.; Fiorini, E.; Lamastra, L. Benchmarking of Carbon Footprint Data from the Italian Wine Sector: A Comprehensive and Extended Analysis. Sci. Total Environ. 2021, 779, 146416. [Google Scholar] [CrossRef]
  25. ANPA. I Rifiuti del Comparto Agroalimentare. Studio di Settore; Technical Report 11/2001; National Agency for the Protection of the Environment (ANPA): Roma, Italy, 2001. Available online: https://www.isprambiente.gov.it/contentfiles/00003800/3854-rapporti-01-11.pdf/ (accessed on 24 June 2022).
  26. Valenti, L.; Ghiglieno, I.; Sambo, F.; Pitacco, A.; Tezza, L.; Vendrame, N.; Virgili, G.; Minardi, I.; Giovenali, E.; LoBello, J. LIFE15 ENV/IT/000392−LIFE VITISOM Project, Viticulture Innovation Technology and GHG Emission Monitoring. BIO Web Conf. 2019, 13, 02008. [Google Scholar] [CrossRef]
  27. Corbo, C.; Lamastra, L.; Capri, E. From Environmental to Sustainability Programs: A Review of Sustainability Initiatives in the Italian Wine Sector. Sustainability 2014, 6, 2133–2159. [Google Scholar] [CrossRef] [Green Version]
  28. DEFRA-Department for Environment, Food Rural Affairs Greenhouse Gas Reporting: Conversion Factors 2021. Available online: Https://Www.Gov.Uk/Government/Publications/Greenhouse-Gas-Reporting-Conversion-Factors-2021 (accessed on 24 June 2022).
  29. Zampori, L.; Pant, R. Suggestions for Updating the Product Environmental Footprint (PEF) Method; JRC Publications Repository: Brussels, Belgium, 2019. [Google Scholar]
  30. IPCC. Chapter 11: N2O Emissions from Managed Soils, and CO2 Emissions from Lime and Urea Application 2006. In IPCC Guidelines for National Greenhouse Gas Inventories; IPCC: Geneva, Switzerland, 2006. [Google Scholar]
  31. IPCC. N2O Emissions from Managed Soils, and CO2 Emissions from Lime and Urea Application 2019. In IPCC 2019 Refinement to the 2006 IPCC Guidelines for National Greenhouse Gas Inventories; IPCC: Geneva, Switzerland, 2019. [Google Scholar]
  32. ADEME. Documentation Base Carbone 18.1.0 2020; French Environment and Energy Management Agency: Paris, France, 2020. Available online: https://www.data.gouv.fr/fr/datasets/base-carbone-complete-de-lademe-en-francais-v17-0/ (accessed on 22 June 2022).
  33. Frischknecht, R.; Rebitzer, G. The Ecoinvent Database System: A Comprehensive Web-Based LCA Database. J. Clean. Prod. 2005, 13, 1337–1343. [Google Scholar] [CrossRef]
  34. Rugani, B.; Vázquez-Rowe, I.; Benedetto, G.; Benetto, E. A Comprehensive Review of Carbon Footprint Analysis as an Extended Environmental Indicator in the Wine Sector. J. Clean. Prod. 2013, 54, 61–77. [Google Scholar] [CrossRef]
  35. Ponstein, H.J.; Meyer-Aurich, A.; Prochnow, A. Greenhouse Gas Emissions and Mitigation Options for German Wine Production. J. Clean. Prod. 2019, 212, 800–809. [Google Scholar] [CrossRef]
  36. Vázquez-Rowe, I.; Villanueva-Rey, P.; Moreira, M.T.; Feijoo, G. Environmental Analysis of Ribeiro Wine from a Timeline Perspective: Harvest Year Matters When Reporting Environmental Impacts. J. Environ. Manag. 2012, 98, 73–83. [Google Scholar] [CrossRef]
  37. Luo, L.; van der Voet, E.; Huppes, G.; Udo de Haes, H.A. Allocation Issues in LCA Methodology: A Case Study of Corn Stover-Based Fuel Ethanol. Int. J. Life Cycle Assess 2009, 14, 529–539. [Google Scholar] [CrossRef]
  38. Bhatia, P.; Cummis, C.; Draucker, L.; Rich, D.; Lahd, H.; Brown, A. Greenhouse Gas Protocol. Product Life Cycle Accounting and Reporting Standard; GHG Protocol for Products. Product Life Cycle Accounting and Reporting Standard; World Resources Institute: Washington, DC, USA, 2011. [Google Scholar]
  39. Navarro, A.; Puig, R.; Kılıç, E.; Penavayre, S.; Fullana-i-Palmer, P. Eco-Innovation and Benchmarking of Carbon Footprint Data for Vineyards and Wineries in Spain and France. J. Clean. Prod. 2017, 142, 1661–1671. [Google Scholar] [CrossRef]
  40. Chiriacò, M.V.; Grossi, G.; Castaldi, S.; Valentini, R. The Contribution to Climate Change of the Organic versus Conventional Wheat Farming: A Case Study on the Carbon Footprint of Wholemeal Bread Production in Italy. J. Clean. Prod. 2017, 153, 309–319. [Google Scholar] [CrossRef]
  41. Renzulli, P.A.; Bacenetti, J.; Benedetto, G.; Fusi, A.; Ioppolo, G.; Niero, M.; Proto, M.; Salomone, R.; Sica, D.; Supino, S. Life Cycle Assessment in the Cereal and Derived Products Sector. In Life Cycle Assessment in the Agri-Food Sector: Case Studies, Methodological Issues and Best Practices; Notarnicola, B., Salomone, R., Petti, L., Renzulli, P.A., Roma, R., Cerutti, A.K., Eds.; Springer International Publishing: Cham, Switzerland, 2015; pp. 185–249. ISBN 978-3-319-11940-3. [Google Scholar]
  42. Renaud- Gentié, C.; Dieu, V.; Thiollet-Scholtus, M.; Merot, A. Addressing Organic Viticulture Environmental Burdens by Better Understanding Interannual Impact Variations. Int. J. Life Cycle Assess. 2020, 25, 1307–1322. [Google Scholar] [CrossRef]
  43. Tuomisto, H.L.; Hodge, I.D.; Riordan, P.; Macdonald, D.W. Does Organic Farming Reduce Environmental Impacts?--A Meta-Analysis of European Research. J. Environ. Manag. 2012, 112, 309–320. [Google Scholar] [CrossRef]
  44. Reganold, J.; Wachter, J. Organic Agriculture in the Twenty-First Century. Nat. Plants 2016, 2, 15221. [Google Scholar] [CrossRef] [PubMed]
  45. Gierling, F.; Blanke, M. Carbon Reduction Strategies for Regionally Produced and Consumed Wine: From Farm to Fork. J. Environ. Manag. 2021, 278, 111453. [Google Scholar] [CrossRef] [PubMed]
  46. Rouault, A.; Beauchet, S.; Renaud-Gentie, C.; Jourjon, F. Life Cycle Assessment of Viticultural Technical Management Routes (TMRs): Comparison between an Organic and an Integrated Management Route. OENO One 2016, 50, 84. [Google Scholar] [CrossRef] [Green Version]
  47. Probst, B.; Schüler, C.; Joergensen, R.G. Vineyard Soils under Organic and Conventional Management—Microbial Biomass and Activity Indices and Their Relation to Soil Chemical Properties. Biol. Fertil. Soils 2008, 44, 443–450. [Google Scholar] [CrossRef]
  48. Pérez-Rodríguez, P.; Soto-Gómez, D.; López-Periago, J.E.; Paradelo, M. Modeling Raindrop Strike Performance on Copper Wash-off from Vine Leaves. J. Environ. Manag. 2015, 150, 472–478. [Google Scholar] [CrossRef] [PubMed]
  49. Fregoni, M. Viticoltura di Qualità; Tecniche Nuove: Milano, Italy, 1999; ISBN 978-88-7220-103-9. [Google Scholar]
  50. Brunori, E.; Farina, R.; Biasi, R. Sustainable Viticulture: The Carbon-Sink Function of the Vineyard Agro-Ecosystem. Agric. Ecosyst. Environ. 2016, 223, 10–21. [Google Scholar] [CrossRef]
  51. Patinha, C.; Durães, N.; Dias, A.C.; Pato, P.; Fonseca, R.; Janeiro, A.; Barriga, F.; Reis, A.P.; Duarte, A.; Ferreira da Silva, E.; et al. Long-Term Application of the Organic and Inorganic Pesticides in Vineyards: Environmental Record of Past Use. Appl. Geochem. 2018, 88, 226–238. [Google Scholar] [CrossRef]
  52. Briar, S.S.; Grewal, P.S.; Somasekhar, N.; Stinner, D.; Miller, S.A. Soil Nematode Community, Organic Matter, Microbial Biomass and Nitrogen Dynamics in Field Plots Transitioning from Conventional to Organic Management. Appl. Soil Ecol. 2007, 37, 256–266. [Google Scholar] [CrossRef]
  53. Nye, C. Agriculture’s ‘Other’ Contingent Labour Source. Agricultural Contractors and Relationships of Interdependence at the Farmer-Contractor Interface. J. Rural. Stud. 2020, 78, 223–233. [Google Scholar] [CrossRef]
  54. Abad, J.; de Mendoza, I.H.; Marín, D.; Orcaray, L.; Santesteban, L.G. Cover Crops in Viticulture. A Systematic Review (1): Implications on Soil Characteristics and Biodiversity in Vineyard. OENO One 2021, 55, 295–312. [Google Scholar] [CrossRef]
  55. Mian, G.; Comuzzo, P.; Iacumin, L.; Zanzotti, R.; Celotti, E. Study to Optimize the Effectiveness of Copper Treatments for a Low Impact Viticulture. Internte J. Vitic. Enol. 2021. [Google Scholar] [CrossRef]
Figure 1. Description of the grape production system, processes, and inputs in conventional and organic management.
Sustainability 15 05252 g001
Figure 2. Box plots showing variability of CFs in ORG and CONV systems and the results obtained by ANOVA analysis; NS: not significant differences.
Sustainability 15 05252 g002
Figure 3. Results comparing ORG and CONV systems in terms of direct emissions. * p-value < 0.05; NS: Not significant.
Sustainability 15 05252 g003
Figure 4. Results comparing ORG and CONV systems in terms of indirect emissions. *** p-value < 0.001; * p-value < 0.05; NS: Not significant.
Sustainability 15 05252 g004
Figure 5. Contributions of the emission categories in ORG and CONV management.
Sustainability 15 05252 g005
Table 1. Information about vineyard areas per number of case studies involved, years of data collection, management system and administrative region.
Administrative
Region
ManagementYears of Data
Collection
Number of Case
Studies
Vineyard Surface Area (ha)
Mean[min; max]
Friuli-Venezia GiuliaCONV2012, 2013, 2015, 2017469.31[38.85; 83.65]
LombardyORG2009, 2010, 2011, 2014, 2015, 2016, 2017949.24[3.41; 84.65]
CONV2009, 2010, 2011, 2012, 2013, 2014, 20163457.37[9.22; 180.63]
PiedmontCONV2010193.01[93.01; 93.01]
VenetoORG2012, 2013217.19[17.18; 17.19]
Overall 5055.96[3.41; 180.63]
Table 2. Breakdown of primary data and sources of emission factors used (EFs).
Categories
According to ISO 14064
Subcategories
According to ISO 14064
EntriesEmission Factor Sources
Direct GHG emissions.Direct emissions from mobile combustion.Fuels for field operations.
Fuels for other vehicles.
DEFRA-Department for Environment, Food Rural Affairs, 2021 [28].
Direct fugitive emissions arising from the release of GHGs in anthropogenic systems.Synthetic fertilizing.
Organic fertilizing (manure, compost, digestate).
For nitrous oxide emissions from fertilizing: Joint Research Centre (JRC), the European Commission’s science and knowledge service provides scientific evidence throughout the whole policy cycle [29].
For carbon dioxide emissions from urea use: Intergovernmental Panel on climate Change. [30,31]
Indirect GHG emissions from transportation.Indirect emissions from upstream transport for goods.Transport of purchased goods.DEFRA-Department for Environment, Food and Rural Affairs, 2021 [28].
Indirect GHG emissions from products and services used by organization.Indirect emissions from purchased goods which are associated with product manufacturing activities.Synthetic fertilizers.
Organic fertilizers;
Fungicides,
Herbicides,
Insecticides.
ADEME’s Bilan Carbone database [32].
The ecoinvent database [33].
Indirect emissions from mobile combustion.Fuels for rental or non-owned vehicles.
Fuels for agricultural contractors.
DEFRA-Department of the Environment, Food and Rural Affairs, 2021 [28].
Table 3. Mean, standard deviation (SD), minimum and maximum values of vineyard inputs by surface area (ha) in organic and conventional vineyards. a.s.: active substance.
Vineyard InputsOrganicConventional
Mean (±SD)[min; max]Mean (±SD)[min; max]
Fuels for field work (kg ha−1)324.31 (±97.44)[216.44; 475.32]237.1 (±125.12)[0; 500.81]
Fuel for other vehicles (km ha−1)169.22 (±197.45)[0; 459.28]139.14 (±221.24)[0; 693.86]
Manure (q ha−1)3659.09 (±6115.74)[0; 16,738.65]2098.3 (±3456.63)[0; 13,731.48]
Compost (q ha−1)562.33 (±1735.34)[0; 5781.81]78.62 (±361.03)[0; 2029.78]
Nitrous-based fertilizers (kg N ha−1)--8.07 (±15.15)[0; 72.59]
Urea-based synthetic fertilizers (kg ha−1)--5.99 (±10)[0; 45.08]
Phospho-potassium fertilizers and others (kg a.s. ha−1)--20.43 (±23.81)[0; 167.72]
Sulphur-based fungicides (kg a.s. ha−1)125.07 (±65.92)[38.16; 225.39]47.63 (±48.94)[0; 210.06]
Copper-based fungicides (kg a.s. ha−1)4.66 (±0.86)[3.68; 5.76]3.43 (±2.75)[0; 10.44]
Unspecific fungicides (kg a.s. ha−1)--9.84 (±20.05)[0; 116.31]
Herbicides (kg a.s. ha−1)--0.73 (±0.88)[0; 3.38]
Insecticides (kg a.s. ha−1)--0.46 (±0.46)[0; 2.05]
Natural insecticides (kg a.s. ha−1)0.59 (±1.17)[0; 3.92]0.25 (±0.62)[0; 2.43]
Fuels for rental or non-owned vehicles (km ha−1)21.32 (±28.38)[0; 73.99]2.37 (±7.72)[0; 37.02]
Fuels for agricultural contractors (kg ha−1)238.91 (±534.52)[0; 1440.00]1213.02 (±2596.32)[0; 9489.15]
Table 4. Mean, standard deviation (SD), minimum and maximum estimates of overall GHG emissions (kg CO2-eq ha−1 y−1) in ORG and CONV wineries.
ManagementGHG Emissions
Mean (±SD)
GHG Emissions
[min/max]
ORG1568.77 (±396.80)[876.99; 2253.34]
CONV1408.34 (±535.27)[690.39; 2937.03]
ALL1443.63 (±508.76)[690.39; 2937.03]
Disclaimer/Publisher’s Note: The statements, opinions and data contained in all publications are solely those of the individual author(s) and contributor(s) and not of MDPI and/or the editor(s). MDPI and/or the editor(s) disclaim responsibility for any injury to people or property resulting from any ideas, methods, instructions or products referred to in the content.

