Article

A Convolutional Neural Network for Coastal Aquaculture Extraction from High-Resolution Remote Sensing Imagery

1
Airborne Remote Sensing Center, Aerospace Information Research Institute, Chinese Academy of Sciences, Beijing 100094, China
2
University of Chinese Academy of Sciences, Beijing 100049, China
*
Author to whom correspondence should be addressed.
Sustainability 2023, 15(6), 5332; https://doi.org/10.3390/su15065332
Submission received: 25 February 2023 / Revised: 15 March 2023 / Accepted: 15 March 2023 / Published: 17 March 2023
(This article belongs to the Special Issue Regional Climate Change and Application of Remote Sensing)

Abstract

:
Aquaculture has important economic and environmental benefits. With the development of remote sensing and deep learning technology, coastline aquaculture extraction has achieved rapid, automated, and high-precision production. However, some problems still exist in extracting large-scale aquaculture based on high-resolution remote sensing images: (1) the generalization of large-scale models caused by the diversity of remote sensing in breeding areas; (2) the confusion of breeding target identification caused by the complex background interference of land and sea; (3) the boundary of the breeding area is difficult to extract accurately. In this paper, we built a comprehensive sample database based on the spatial distribution of aquaculture, and expanded the sample database by using confusing land objects as negative samples. A multi-scale-fusion superpixel segmentation optimization module is designed to solve the problem of inaccurate boundaries, and a coastal aquaculture network is proposed. Based on the coastline aquaculture dataset that we labelled and produced ourselves, we extracted cage culture areas and raft culture areas near the coastline of mainland China based on high-resolution remote sensing images. The overall accuracy reached 94.64% and achieved a state-of-the-art performance.

1. Introduction

Seafood is an essential source of nutrition for humans. According to statistics from the Food and Agriculture Organization of the United Nations, the total global seafood production in 2018 was about 179 million tons around the world, of which about 156 million tons were for direct human consumption [1]. China has a vast territory, and its long coastline covers tropical, subtropical, and temperate climate zones [2]. It has unique natural and geographical conditions for aquaculture. The development of aquaculture has created many jobs for people in coastal areas. However, while creating economic benefits, it also brings a series of environmental problems, such as water pollution caused by a large amount of breeding bait and chemical fertilizers [3], eutrophication caused by cultured crop metabolites [4], antibiotic abuse [5], and the impact of the uncontrolled expansion of breeding areas on coastal wetland systems and marine traffic [6]. Therefore, the aquaculture industry’s enormous economic value and environmental benefits make it necessary to conduct periodic and rapid supervision and statistics on the aquaculture industry. Limited by the growth cycle of marine organisms [7] and the ecological complexity of water areas [8], traditional field surveys have great difficulties and limitations. The monitoring work of aquaculture must be completed on time and needs to be repeated year on year. Therefore, improving the monitoring capability of aquaculture is of great significance for improving the quality and efficiency of fisheries, improving the supply capacity of aquatic products, and promoting the green development of offshore ecology.
The satellite remote sensing technology developed in the 20th century has provided a large amount of satellite image data to assist in monitoring ground objects due to its wide imaging area and fast data collection cycle [9]. Compared with manual field surveys, it has provided huge benefits. Early studies mainly used related methods such as visual interpretation and geographical information systems to explore breeding areas’ spatial and temporal changes from a macro perspective [10,11,12,13]. Methods such as the water body index [14,15,16] and object-oriented classification [17,18,19,20] use prior knowledge to separate water from land, and use the similarity characteristics of different regions to improve the interpretation accuracy from a higher level.
The deep-seated value in massive remote sensing data has also been exploited thanks to improved computing power and developed deep learning algorithms [21]. Deep learning algorithms are currently the most widely used automatic information extraction method. Automatic information extraction refers to the automatic extraction of feature information in image data by machines using deep learning methods. Automatic information extraction by deep learning algorithms has gradually replaced manual visual interpretation methods. The deep learning method automatically encodes and extracts image features by stacking many convolutional neural networks without manually designing feature extractors based on expert knowledge [22]. It has better feature extraction capabilities and large-scale generalization capabilities. Semantic segmentation technology in computer vision corresponds to coastal aquaculture information extraction. Semantic segmentation algorithms based on deep learning are mainly divided into four types: encoder–decoder, backbone, hybrid, and transformer. The encoder–decoder network extracts features of different scales through multiple pooling and upsampling [23,24]. The backbone network extracts features of different scales through parallel feature modules [25,26]. The hybrid network fully combines the advantages of the encoder–decoder and backbone types to improve the ability to extract features of different scales [27]. The transformer network uses the self-attention mechanism to suggest the global correlation of features [28]. It avoids the problem of limited receptive fields of local features at different scales.
The convolutional neural network is the most commonly used method in deep learning. The following discusses some studies that used deep learning methods to extract aquaculture features: Liu et al. [29] used Landsat 8 images to extract the main coastal aquaculture areas within 40 km of the shore. Cheng et al. [30] used UNet and dilated convolution to expand the receptive field, solved the problem that the breeding area was easily gridded, and optimized the issue of misidentifying floating objects and sediments on the water surface. Su et al. [31] used the RaftNet to optimize the extraction accuracy of turbid seawater and made the model adaptable to different scales of raft culture areas. However, the extraction of breeding areas often has blurred and glued edges, usually caused by the complexity of the ocean background. The edge enhancement method has a certain optimization effect for extracting aquaculture areas. Ottinger et al. [32] proposed that a fine edge detection method using enhanced linear structure can improve the accuracy of breeding area monitoring. Cui et al. [33] used the UPSNet with the PSE structure to adapt to multi-scale feature maps to extract complex environments and improve the edge blurring and adhesion that often occur in raft culture extraction. Fu et al. [34] extracted aquaculture areas with an automatic labelling method based on convolutional neural networks. They used multi-layer cascaded networks to aggregate multi-scale information captured by dilated convolutions. Furthermore, the channel attention mechanism and spatial attention mechanism modules are used to refine the feature layer to obtain better extraction results, but the network model extraction speed is slow. Cui et al. [35] extracted the raft aquaculture in the Lianyungang based on a fully convolutional neural network. Still, their network could only identify a single raft aquaculture area under a simple seawater background. Lin et al. [36] proposed a method for extracting ocean, land, and ships based on a fully convolutional network. A multi-scale convolutional neural network adapts to the differences in scales of land and sea ships. The idea is also applicable to extraction in aquaculture areas. Feng et al. [37] designed a homogeneous convolutional neural network to extract small-scale aquaculture rafts in the image, sea and land were separated while extracting and obtaining better results on the Gaofen-1 image. Ferriby et al. [38] used a Laplacian 5 × 5 convolution filter to improve the edge of fish pond extraction results, but it made many pixels appear grey. Zhang et al. [39] proposed a segmentation network NSCT method combined with non-subsampling contour transformation, which can enhance the main contour features of raft culture in the ocean. The SE2Net [40] embedded the self-attention mechanism module in the network and introduced the Laplacian operator to enhance edge information. The simple edge enhancement algorithm has a certain effect on the edge extraction of the breeding area. Still, it cannot solve the problem of a large number of broken edges in a high-detail area. As a result, the breeding area is discontinuous and broken due to the influence of ocean currents, clouds, etc. The extracted results are challenging to form a completely large area from the blurred and disconnected areas.
For aquaculture extraction using remote sensing images, it is necessary to overcome the environmental complexity and species diversity of target objects and adapt to the characteristics of the spatial and temporal differences in the remote sensing images in the study area. Extracting large-scale aquaculture based on high-resolution remote sensing images still has the following problems.
  • Remote sensing diversity of breeding areas. There are differences in the types of aquaculture in different regions. Cage and raft cultures are different in size, colour, shape, and scale. As a result, the model’s generalization ability faces significant challenges in large-scale research areas, and the spatial distribution of samples is an essential research factor.
  • The complex background interference of land and sea. Although the background of aquaculture is relatively simple in the ocean, there will be complex sea–land interlacing in offshore aquaculture areas. In addition, cages and rafts will also appear in tidal flats and ponds on land. The diversity and comprehensiveness of samples is also a key research factor to avoid aquaculture sea–land interference.
  • The boundaries of breeding areas are difficult to accurately extract. Because seawater may randomly submerge the edges of cage and raft cultures, the boundaries are not completely straight, and irregular edges will appear. Therefore, affected by complex imaging factors, it is not easy to extract the precise boundaries of breeding areas.
In response to the above problems, we propose a coastal aquaculture network (CANet) to effectively extract large-scale aquaculture areas. The main contributions of this paper are as follows:
  • We constructed the sample database from the perspective of the balance of spatial distribution. Considering the differences in the size, colour, and shape of aquaculture areas in diverse regions, representative samples covering each region are labelled. In this way, the model has a good large-scale generalization ability in all areas.
  • We expanded the sample database by taking confused land objects as negative samples. For the complex background conditions of land, the target of the land prone to misdetection by the model is labelled as the negative sample. Then, the interference of confusing land objects with aquaculture extraction from land areas is solved.
  • We designed a multi-scale-fusion superpixel segmentation optimization module. Considering the problem of inaccurate boundaries of extraction results, we take full advantage of the sensitivity of superpixel segmentation to edge features and the abstraction of features by semantic segmentation networks. In this way, the network effectively optimized the accuracy of boundary identification and improved the overall accuracy of aquaculture extraction.
  • Based on 640 scenes of Gaofen-2 satellite images, we extracted cage and raft culture areas near the coastline in mainland China, covering a range of 30 km outward from the coastline. The overall accuracy was satisfactory, and it can support the breeding area and quantity statistics. Compared with other mainstream methods, our proposed CANet achieved state-of-the-art performance.

2. Materials and Methods

In this section, we first propose an overall framework for the deep learning-based aquaculture extraction workflow. The overall workflow includes data acquisition, preprocessing, sample production and iteration, model training and iteration, and product production. Among these, sample production and negative sample iteration are key contributors to the overall workflow. Then, for model training, based on the DeepLabV3+ network, we design a multi-scale feature superpixel optimization method and build a CANet model. CANet is a key contribution to the method design of deep learning models.

2.1. Study Area

The seashore in eastern China stretches from the mouth of the Yalu River in the north to the mouth of the Kunlun River in the south, with a total coastline of more than 18,000 km [41]. Hangzhou Bay roughly bounds the coast of China. To the north of Hangzhou Bay, the coastline passes through several uplift and subsidence zones, presenting an interlaced pattern of rising mountainous harbour coasts and descending plain coasts. To the south of Hangzhou Bay, the coastline continues the same uplift zone, and has relatively consistent characteristics. The average elevation of the coastline is below 500 m, with a temperate marine monsoon climate, a subtropical marine monsoon climate, and a tropical monsoon climate [42,43]. Most coasts are sea erosion coasts, characterized by steep twists and turns and dangerous terrain. For millions of years, complex geological structures, ocean currents, biological effects, and climate conditions have formed many coastal landforms, such as bays and estuaries, providing a sufficient breeding ground for aquaculture [44].
There are more than 200 bays of various sizes in China, with more than 150 bays with an area larger than 10 km 2 . Affected by factors such as regional structure, the bays are distributed along the coastal sections with relatively solid dynamics and zigzagging coastlines. Among them, the Zhejiang and Fujian coastal bays have the largest number of distributions, followed by Shandong and Guangdong. Next are Liaoning, Guangxi, and Hainan. The remaining coastal bays of Hebei, Tianjin, Jiangsu, and Shanghai are relatively small in size. We selected the coastlines of the coastal provinces in mainland China as the research area. The selected coastal bays were Liaoning, Hebei, Tianjin, Shandong, Jiangsu, Shanghai, Zhejiang, Fujian, Guangdong, Guangxi, and Hainan from north to south.

2.2. Data Source

We extracted aquaculture based on Gaofen-2 satellite images. The data was sourced from the China Centre for Resources Satellite Data and Application (https://data.cresda.cn/#/2dMap, accessed on 15 March 2023). The Gaofen-2 satellite is equipped with a panchromatic camera with a resolution of 0.8 m and a multispectral camera with a resolution of 3.2 m, with an imaging width of 45 km. The study selected 640 scenes of Gaofen-2 images from 2019 covering the waters outside the coastline and about 30 km in the estuary. The selection of images was determined by the growth cycle of farmed crops and the difficulty of obtaining images. The distribution of marine animal cages does not change with the seasons. However, the optimum temperature for marine plant growth is usually below 19 C , so the date of the selected image should be near the crops vigorous growth period. In addition, due to the influence of the downdraft in the coastal zone, the coastal area is often covered by thick clouds throughout the year, especially the southern area during summer, resulting in fewer available images in summer. The temporal resolution of Gaofen-2 is limited, making it very difficult to obtain high-quality, low-cloud images that completely cover the entire coastline in a short period. Therefore, the proportion of selected images distributed from October to March is relatively large, while the number from June to September is relatively small. The seawater temperature used for mariculture varies very little throughout the year, and aquaculture can be carried out all year round. There is no significant change in the aquaculture area between summer and winter, so using images from other months is acceptable. Even so, some areas are still completely covered by clouds. These area were supplemented or replaced with images from the same period in 2018 and 2020. Furthermore, there is an overlap between the images as clouds cover obscured many images. However, these unobstructed images are still usable.

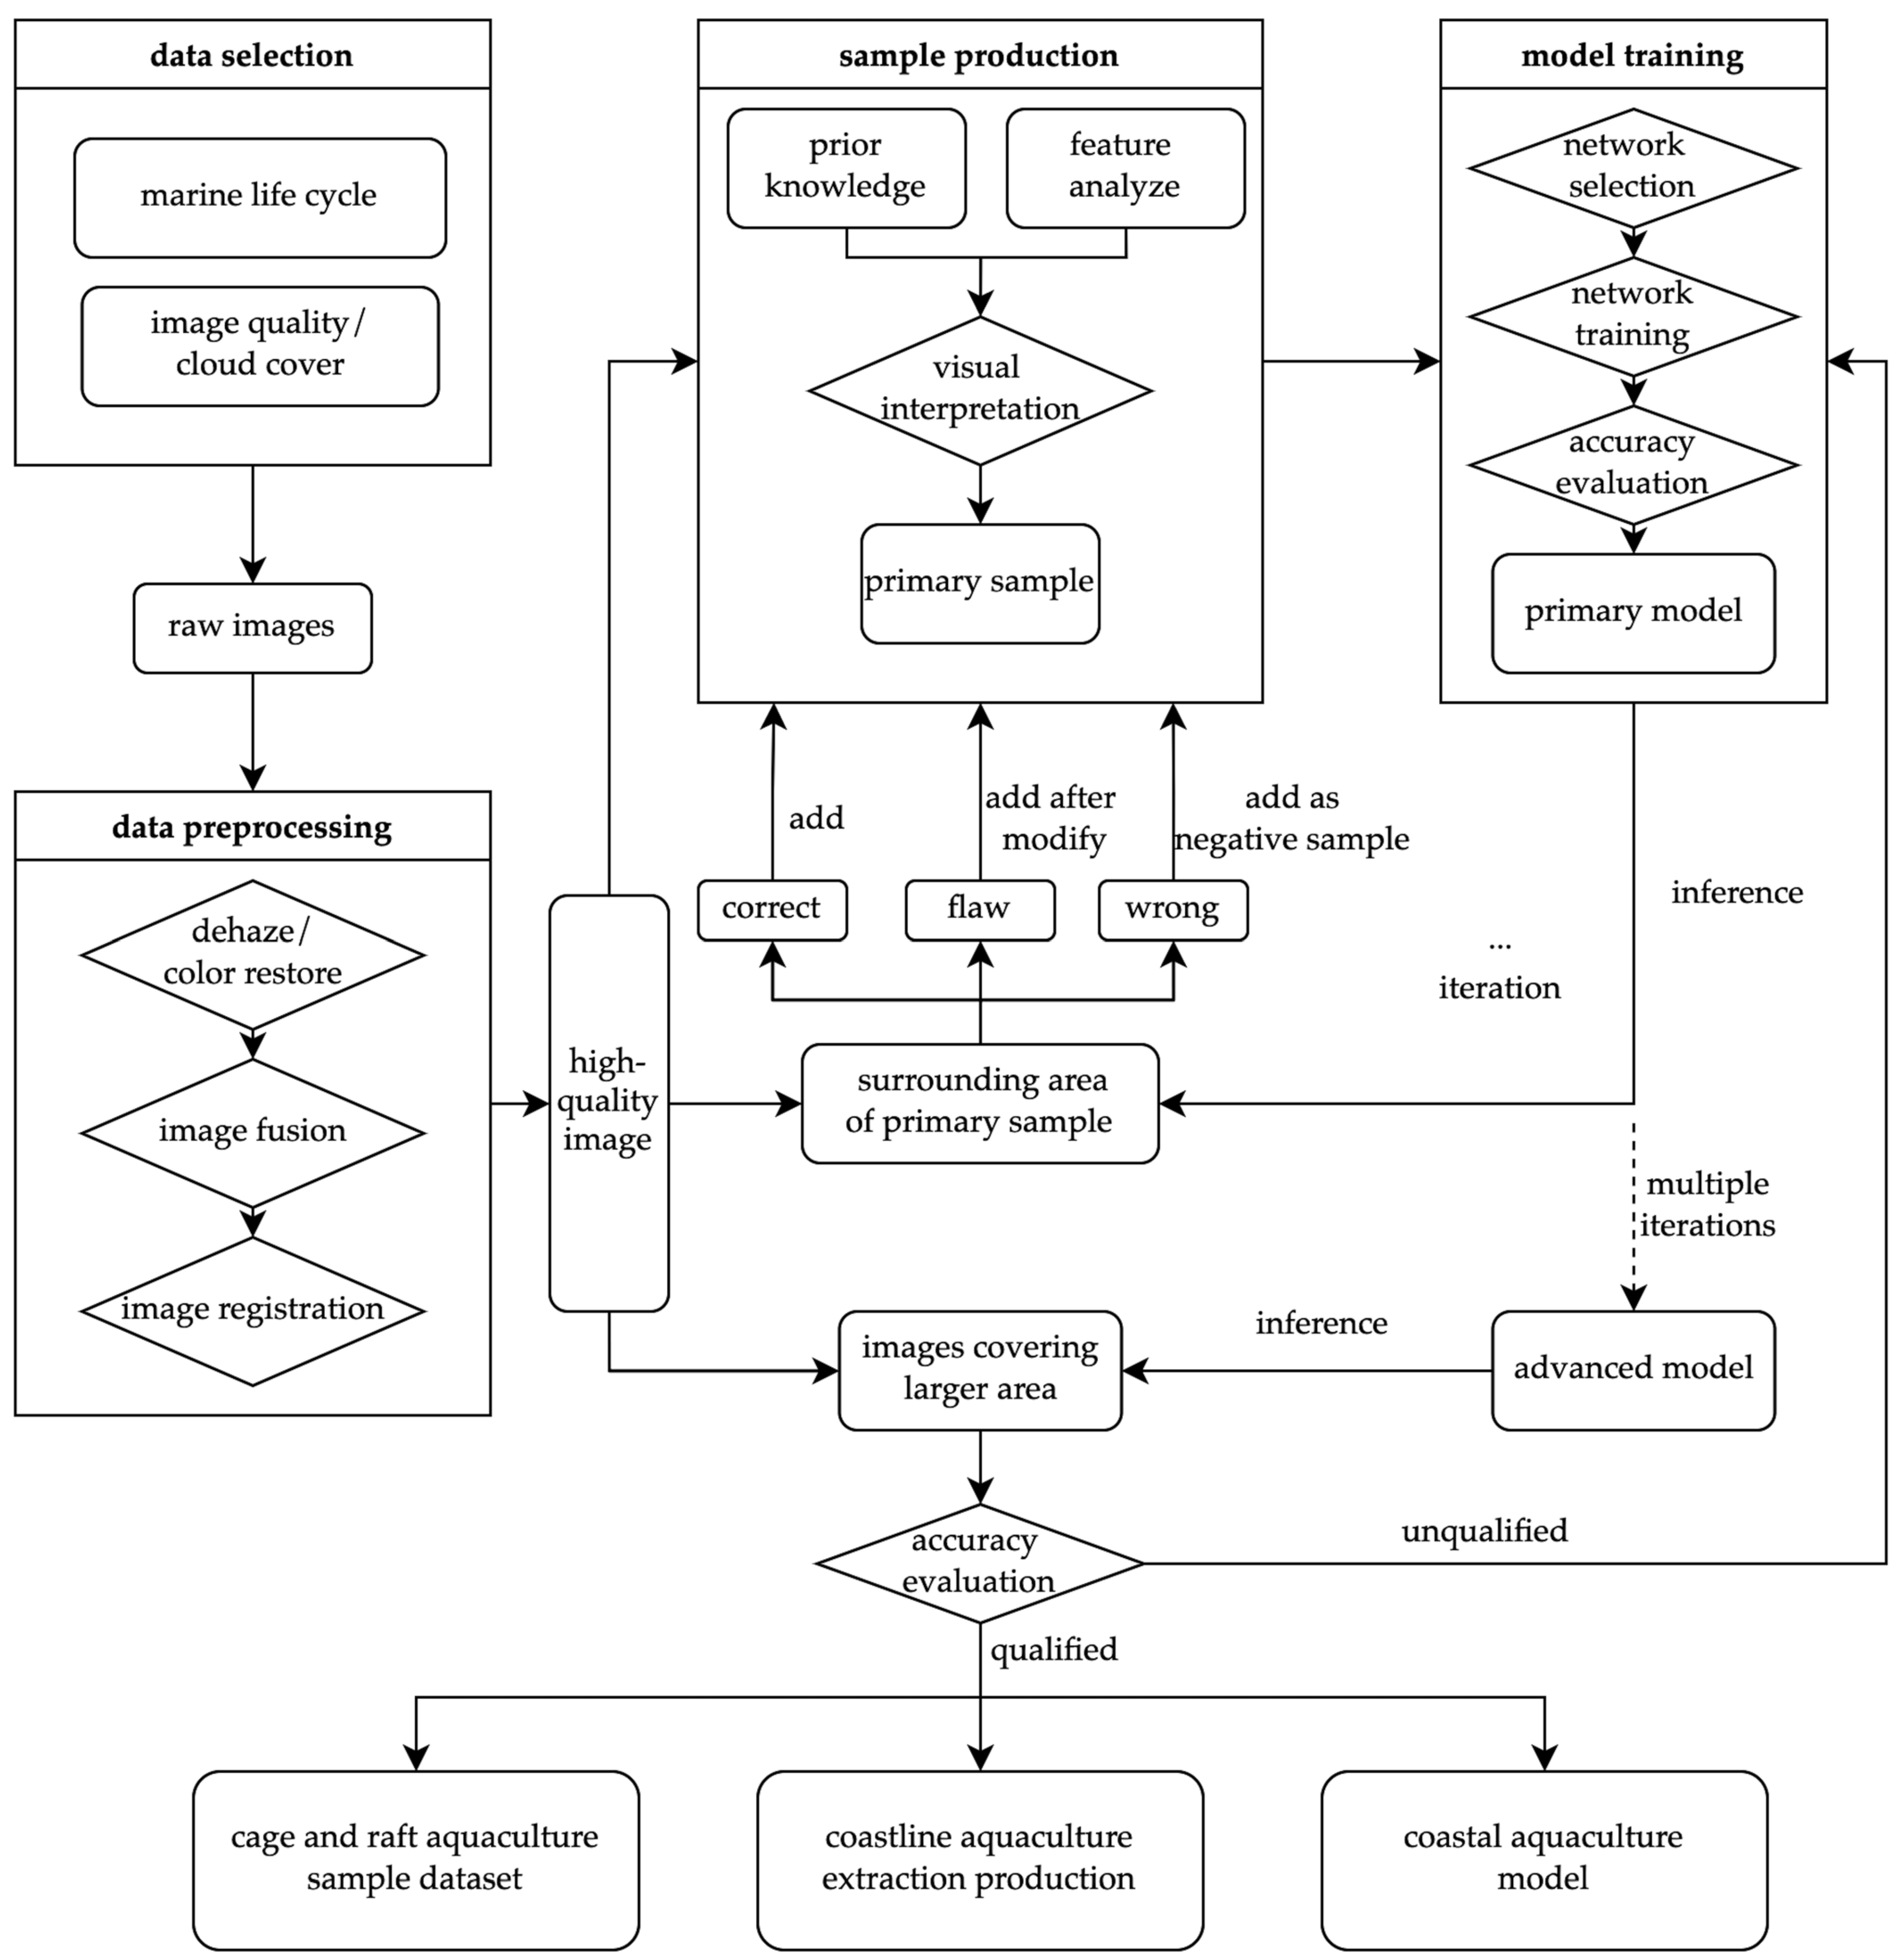
2.3. Overall Framework

We first selected the high-resolution image data according to the growth cycle of marine animals and plants, image quality, and cloud cover to obtain the original image set. In the data preprocessing stage, the original image underwent three steps of de-hazing/colour restoration, fusion, and registration to obtain a high-quality image set. Then, a small number of representative images were selected from the high-quality image set, and combined with prior knowledge and feature analysis, visual interpretation was performed to obtain the primary samples. The next step was to build a computer vision-based network model and use the primary samples to train a primary model and evaluate its accuracy. Next, the primary model was used to predict images of the surrounding area of the primary sample, and obtain corresponding prediction results. We performed human visual judgment on the prediction results. The correct prediction results were added to the sample set. The results with certain flaws were added to the sample set after being manually labelled and modified. The results of the wrong predictions were added to the sample set as a negative sample to expand the sample set. We used the new sample set to retrain the model and again predict images of the surrounding area of the sample set, to realize multiple rounds of sample and model iteration. Finally, we obtained a larger sample set and a more stable advanced model. We used the advanced models to predict images of the whole study area and evaluate the accuracy of the prediction results. Since the accuracy of the model can be improved with multiple iterations of the sample set, we can set an accuracy expectation value according to the task requirements, computing resources, and time conditions. If the accuracy evaluation does not meet expectations, we can optimize the model structure and training strategy to retrain the sample set. If the accuracy meets expectations, we can obtain three major achievements: the cage and raft culture dataset, coastline aquaculture area extraction products, and the coastline aquaculture area automatic extraction model. The overall framework of this study is shown in Figure 1.

2.4. Dataset

2.4.1. Data Processing

The raw Gaofen-2 images must undergo a processing series before they can be used. Seawater showed low radiation intensity in the image. The image’s original information needs to be enhanced, especially to identify breeding areas in marine areas. The images covered a large span of time and space. Data processing ensured that the processed data had decent consistency.
First, the raw images generally have a bluish cast. Second, due to the weather, mist exists in many images. In addition, the blue band of some images is missing or damaged, which distorts image colour. Before the images can be input into the neural network, we must precisely register the raw images between multiple periods in the same area between different scenes. It is also necessary to ensure that the images are rich in colour, moderate in saturation, and have good visibility to facilitate visual interpretation and machine learning. The image is then de-hazed, and its colour restored in the form of batch processing, and the resolution of its multispectral bands is improved by image fusion from the panchromatic band.

2.4.2. Samples

The production of samples needs to consider the remote sensing diversity of the breeding area and the complex background interference of the land and sea. The species of cultured organisms located in different regions are different for aquaculture cages. The scale and materials of the breeding cages vary in scale, size, colour, and shape, and various forms and distribution patterns appeared in the remote sensing images. Marine plants in the images will show their unique seasonal growth cycles for aquaculture rafts. This makes breeding areas in different phases in the same area display periodic changes in colour, texture, and structure, and the original biological characteristics will disappear after harvesting. Therefore, we need to consider the representativeness and comprehensiveness of the sample from the distribution of geographical factors.
We selected sea areas with an average water depth of 2∼15 m and an average annual seawater velocity of less than 3 m/s, including tropical, subtropical, and temperate climate zones in the range of 18° N~45° N latitude. This was combined with the fishery statistics in each province’s aquaculture production and large-scale marine pasture areas, after removing important marine transportation hubs such as ports. The original primary samples were labelled by human visual interpretation. All samples consisted of a remote sensing image and corresponding ground truth label. As shown in Table 1, most of the selected areas were bays, where the seawater depth is moderate, the flow rate is slow, and the area is well-lit, which is suitable for aquaculture. These areas represent the differences in breeding areas between the north and south, and cover multiple dimensional and climate zones, ensuring the comprehensiveness and diversity of the samples. In addition, assuming sufficient images for the same area, we tried to obtain multi-phase images for samples where possible. In this way, the differences caused by the remote sensing data in terms of time and irradiation conditions can be resolved. Therefore, we also considered the differences in the images caused by different lighting and seasonal factors and images of different quality when selecting samples.
Although the marine environment will change due to waves, sea winds, ships, marine life, etc., it can still be considered a relatively simple background compared to the complex surface environment on land. Ground objects present the phenomena of same object with a different spectrum and different object with the same spectrum in remote sensing data. There will be a large number of images containing ground objects that are easily confused with aquaculture targets. However, the terrestrial environment cannot be completely discarded when extracting the aquaculture area because many aquaculture cages and rafts are distributed in tidal flats and ponds on land. Therefore, in the land area and complex background area of the coastline, we labelled some ground features with similar characteristics or as easily confused features. We used these as negative samples to assist in model training, thereby reducing the model’s false detection rate and improving model accuracy. Figure 2 shows some examples of the sample database.

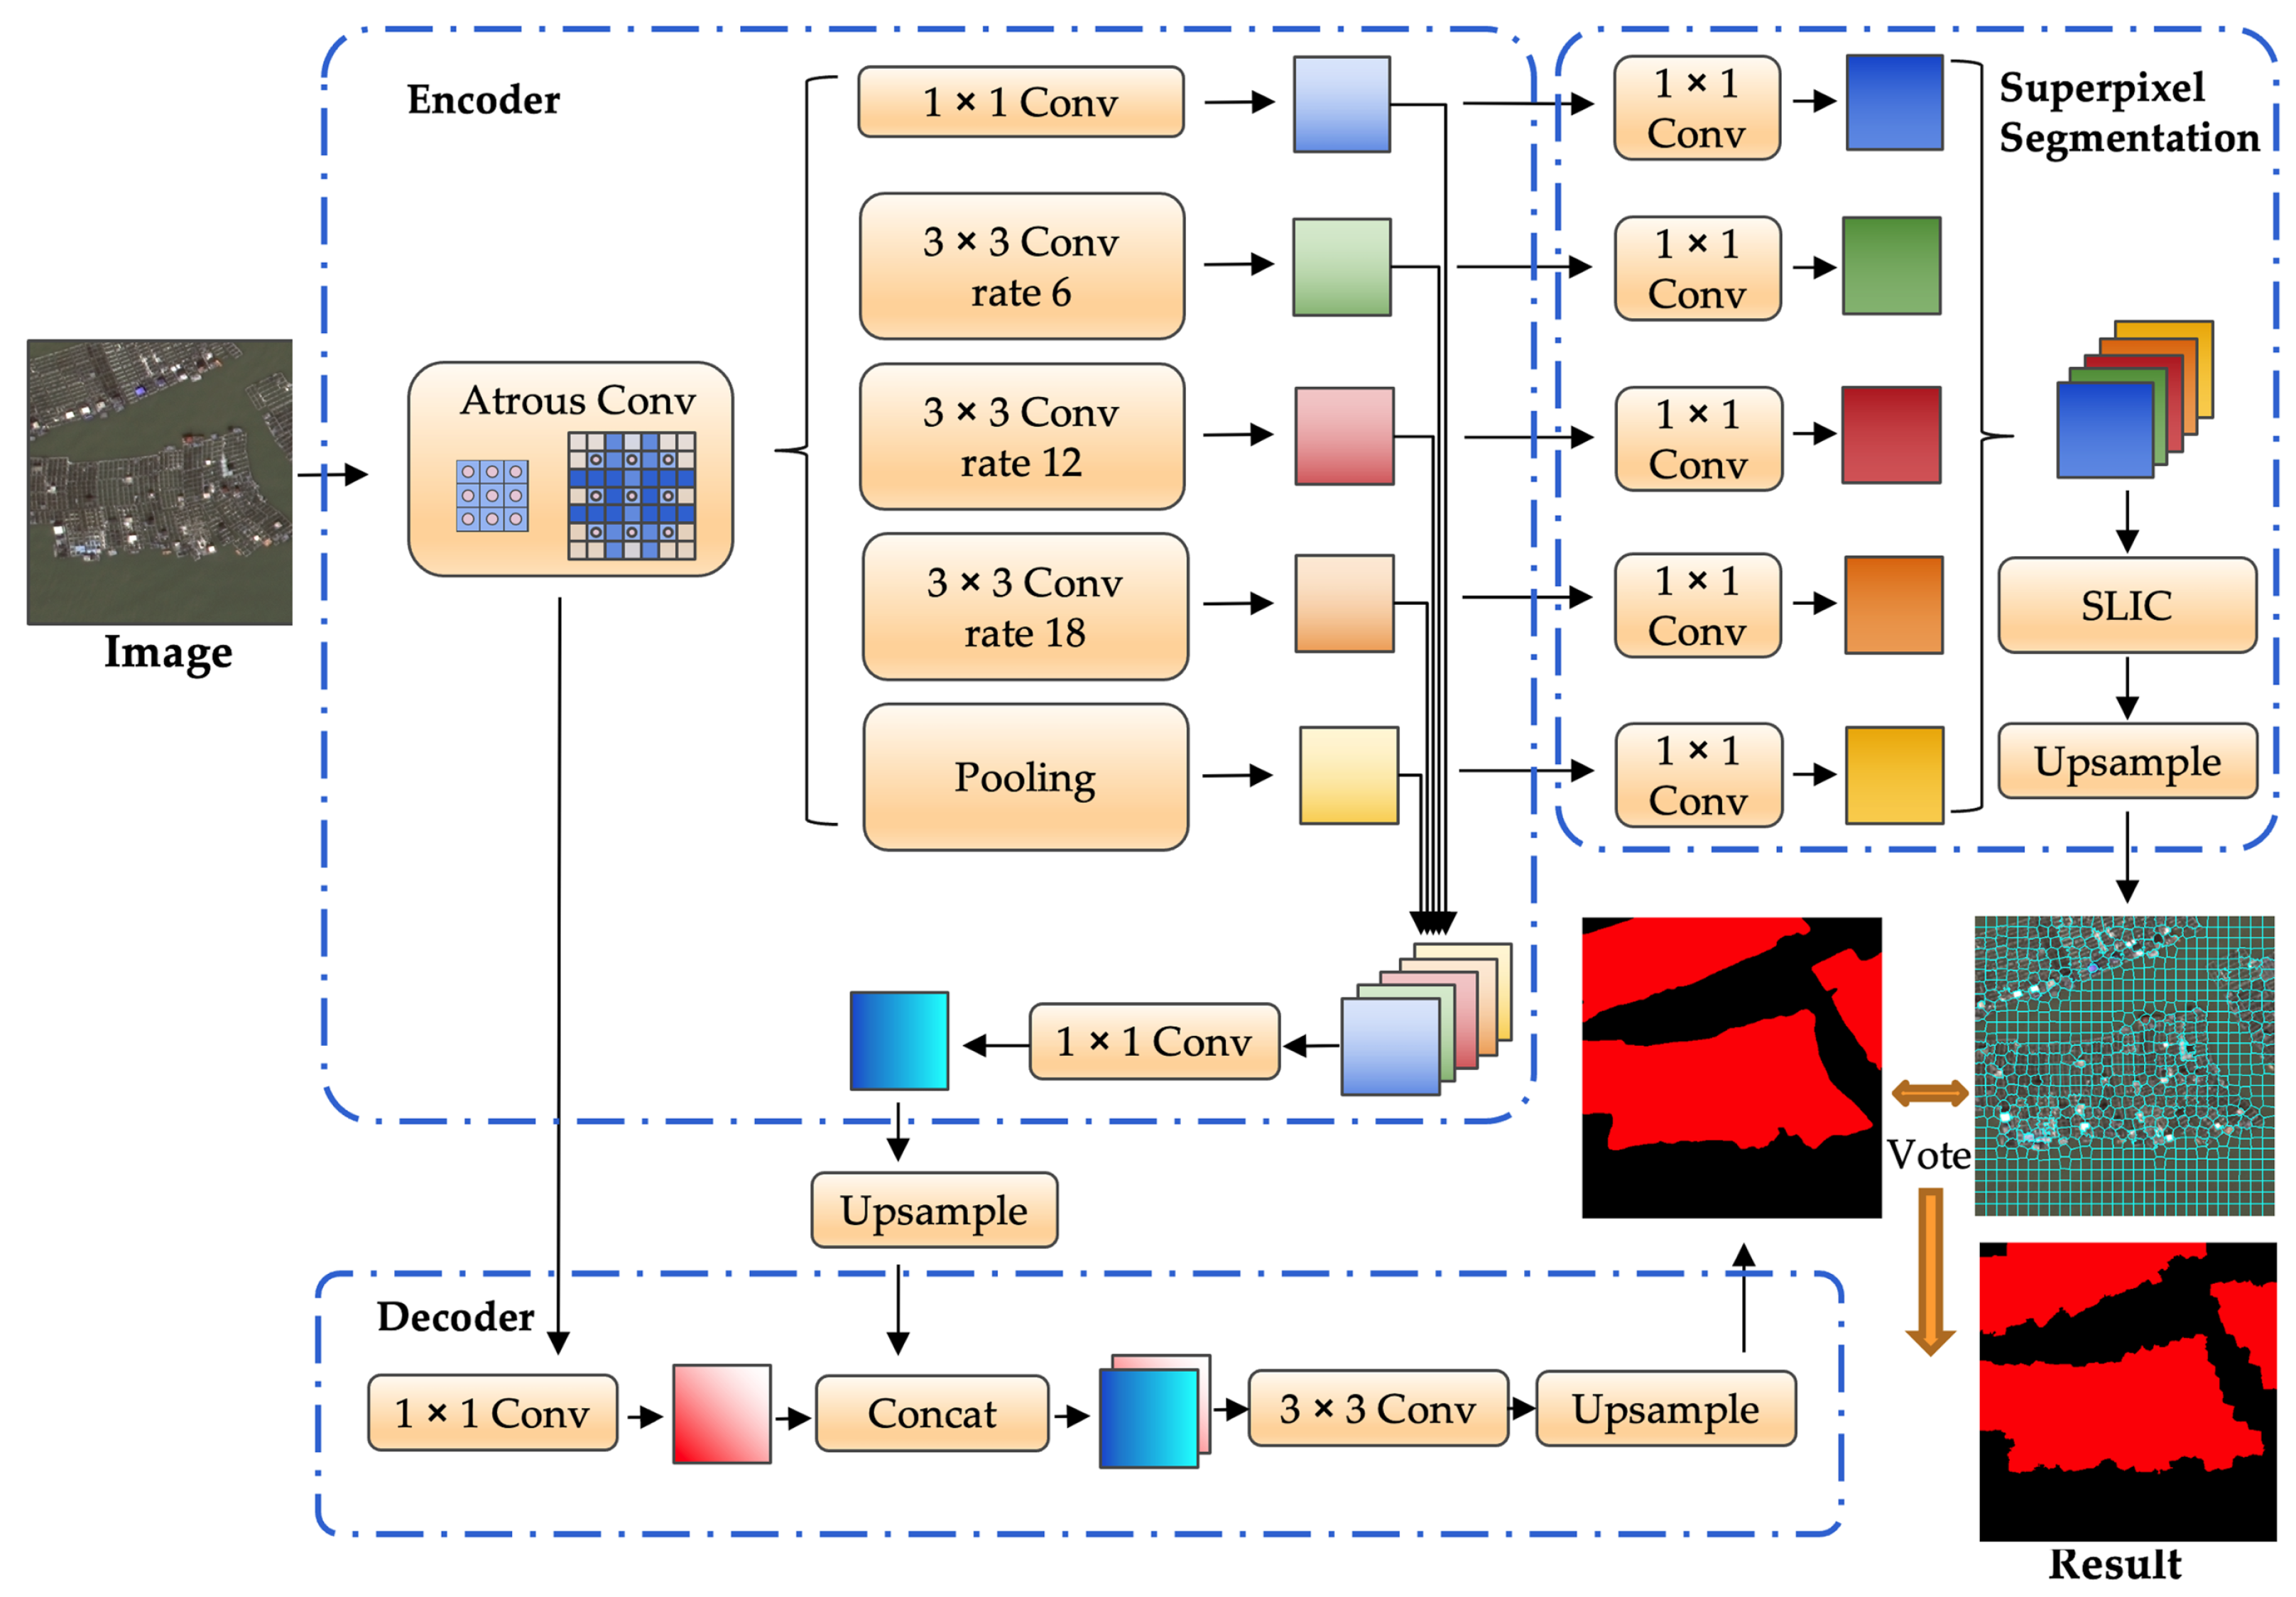
2.5. Coastal Aquaculture Network

2.5.1. Baseline

To maximize the advantages of the encoder–decoder and backbone networks simultaneously, we choose the hybrid network DeepLabV3+ [27] as the baseline network architecture. The DeepLabV3+ network adopts the encoder–decoder structure to fuse the multi-scale information of the network to meet the feature extraction requirements of breeding areas of different sizes. However, encoder–decoder networks usually use pooling operations to increase receptive fields and aggregate features. This leads to the problem of a decrease in the resolution of the features. Although the upsampling is restored to the decoder’s original size, the features’ details is still irreversibly lost, resulting in decreased accuracy. DeepLabV3+ adopts a dilated convolution operation commonly used in backbone networks to increase the receptive field while avoiding the reduction in feature resolution and the loss of feature information. Keeping the feature resolution unchanged causes difficulties in feature aggregation. To solve this problem, DeepLabV3+ adopts a multi-scale feature pyramid structure, encoding the features with dilated convolutions with different dilation rates, and fuses the multi-scale information of the features. In addition, the encoder adopts a depth-wise separable convolution to improve the speed of network feature extraction.

2.5.2. Superpixel Optimization

In the multi-scale feature pyramid structure of DeepLabV3+, five parallel feature aggregation encoding operations are performed on the feature map. These operations include 1 × 1 convolution, dilated convolutions at rates of 6, 12, and 18, and global pooling operations. The encoded features, in addition to fusion and upsampling according to the original DeepLabV3+ network, also construct five feature copies. After the five feature copies are fused, the simple linear iterative clustering (SLIC) algorithm [45] is used for the unsupervised segmentation of high-level features.
In the superpixel segmentation module of the network, the feature maps are converted into approximate, compact, and uniform superpixel blocks for aggregation. The specific implementation process of the SLIC algorithm is as follows:
After dimensionality reduction, the feature map is treated as an RGB colour space image and converted to a CIELab colour space. The LAB colour space consists of three components. L represents the brightness value of a pixel. The value ranges from 0 to 100, where 0 represents pure black, and 100 represents pure white. A represents the relative value between green and red. The value ranges from −128 to 127, where negative values represent the green range and positive values represent the red range. B represents the relative value between yellow and blue. The value ranges from −128 to 127, where negative values represent the blue range, and positive values represent the yellow range. Then, we can obtain a wider colour gamut from the input feature map. Finally, we can use a five-dimensional vector composed of L , a , b , x , y to represent each pixel of the feature map [45]. Among these, L, A, and B correspond to the three components in the colour space, and x and y correspond to the relative coordinates of the pixel in the feature map.
The superpixel centre is first determined. The N number of superpixel blocks is specified, and n reference points are generated in the map according to the proportion of the feature map. If the number of pixels in the entire image is M, the size of the pre-segmented superpixel blocks in the image is M / N pixels, and the side length of each superpixel block is S = M / N . The gradient of all pixels in the surrounding 3 × 3 range is calculated with the superpixel reference point as the centre. The centre of the superpixel is then moved to the minimum gradient value in the range, which is the centre point of the superpixel. The formula of the gradient is defined as:
G ( x , y ) = ( V ( x + 1 , y ) V ( x 1 , y ) 2 + ( V ( x , y + 1 ) V ( x , y 1 ) 2
V i = [ L i , a i , b i , x i , y i ] T
A class label is then assigned to each pixel within the 2 S range of the superpixel centre point. For each pixel, the colour distance D c and space distance D s between the pixel and the centre point is calculated:
D c = ( L i L j ) 2 + ( a i a j ) 2 + ( b i b j ) 2
D s = ( x i x j ) 2 + ( y i y j ) 2
D = ( D c N c ) 2 + ( D s N s ) 2
where N c is the maximum colour distance, representing the gap between two colours. In this study, N c takes a fixed constant of 15. N s represents the maximum intra-class space distance, and the value of N s in this study is the side length S of the superpixel. Multiple centre points around the pixel will search each pixel. When distance D between the point and a certain centre point is minimum, the centre point will be the cluster centre of the superpixel block.
The integrity of superpixel blocks is subsequently optimized. The above steps are then iterated through until the cluster centre of each superpixel remains constant. If a superpixel size is too small, it will merge into other adjacent superpixel blocks in this area. Figure 3 shows the results when a different number of superpixel blocks are set in an image.

2.5.3. Network Architecture

The semantic segmentation results obtained based on the baseline network have completely classified semantic information, but the boundary accuracy is relatively poor. The result of superpixel segmentation based on high-level features has accurate boundary information. However, due to the limitations of unsupervised segmentation, no semantic information is gathered. Therefore, each superpixel block cannot be automatically classified. We use the semantic information of semantic segmentation to vote on superpixel blocks. The dominant class in each superpixel block is used as the classification category of the whole superpixel block. After this, we obtain precise optimization of the classification boundary details. We call this network architecture a coastal aquaculture network (CANet). Figure 4 shows the network detail diagram of CANet.

2.5.4. Loss Function

To calculate the loss value of the CANet, as the learning motivation of the network, it is necessary to normalize the model’s output with the softmax function and use cross-entropy as the loss function. The cross-entropy formula for multi-classification problems is as follows:
L = i = 1 n y ( i ) · log y ^ ( i )
y ^ = P ( y ^ = i | x ) = e X ( i ) j = 0 n e X ( j )
For the above formula, y ^ is the conditional probability when the pixel label is a certain category. Single-category information uses one-hot encoding as the label input, and the input vector is normalized and exponentially transformed using the softmax function. Then we obtain the predicted probability of each category. The probability values are all non-negative and the sum to 1.

2.6. Training Settings

We experimentally verified CANet based on the PyTorch deep learning framework [46]. We used the ResNet-101 [47] pre-trained model to initialize the network encoder, the initial learning rate was set to 0.001, and a warm-up strategy was used to optimize the learning rate. AdamW [48] was used as the optimizer for training, the weight decay was set to 0.0001, and the momentum was set to 0.9. We used four NVIDIA TITAN Xp GPUs and set the batch size to 32.

2.7. Evaluation Metrics

We used the F1 score to evaluate the extraction accuracy of cages, rafts, and the background, and used the mean F1 score and mean intersection over union (IoU) values to evaluate the overall accuracy. The F1 score can balance the missed and false detection of extracted results with the accuracy of the image, and the IoU is a more intuitive and universal metric.
The formula for the F1 score is as follows:
F 1 = 2 · P r e c i s i o n · R e c a l l P r e c i s i o n + R e c a l l
where
P r e c i s i o n = T P T P + F P
R e c a l l = T P T P + F N
where T P is the number of pixels that are classified as breeding areas and are correct, F P is the number of pixels that are classified as breeding areas but are incorrect, and F N is the number of pixels that are not classified as breeding areas but are actually breeding areas. It is known that T P + F P is the total number of pixels classified as breeding areas, and T P + F N is the actual number of pixels that cover the breeding area.
The formula for the IoU is as follows:
IoU = T P T P + F P + F N
The mean F1 score and mean IoU represent the average F1 score and IoU for each category, respectively.

3. Experimental Results
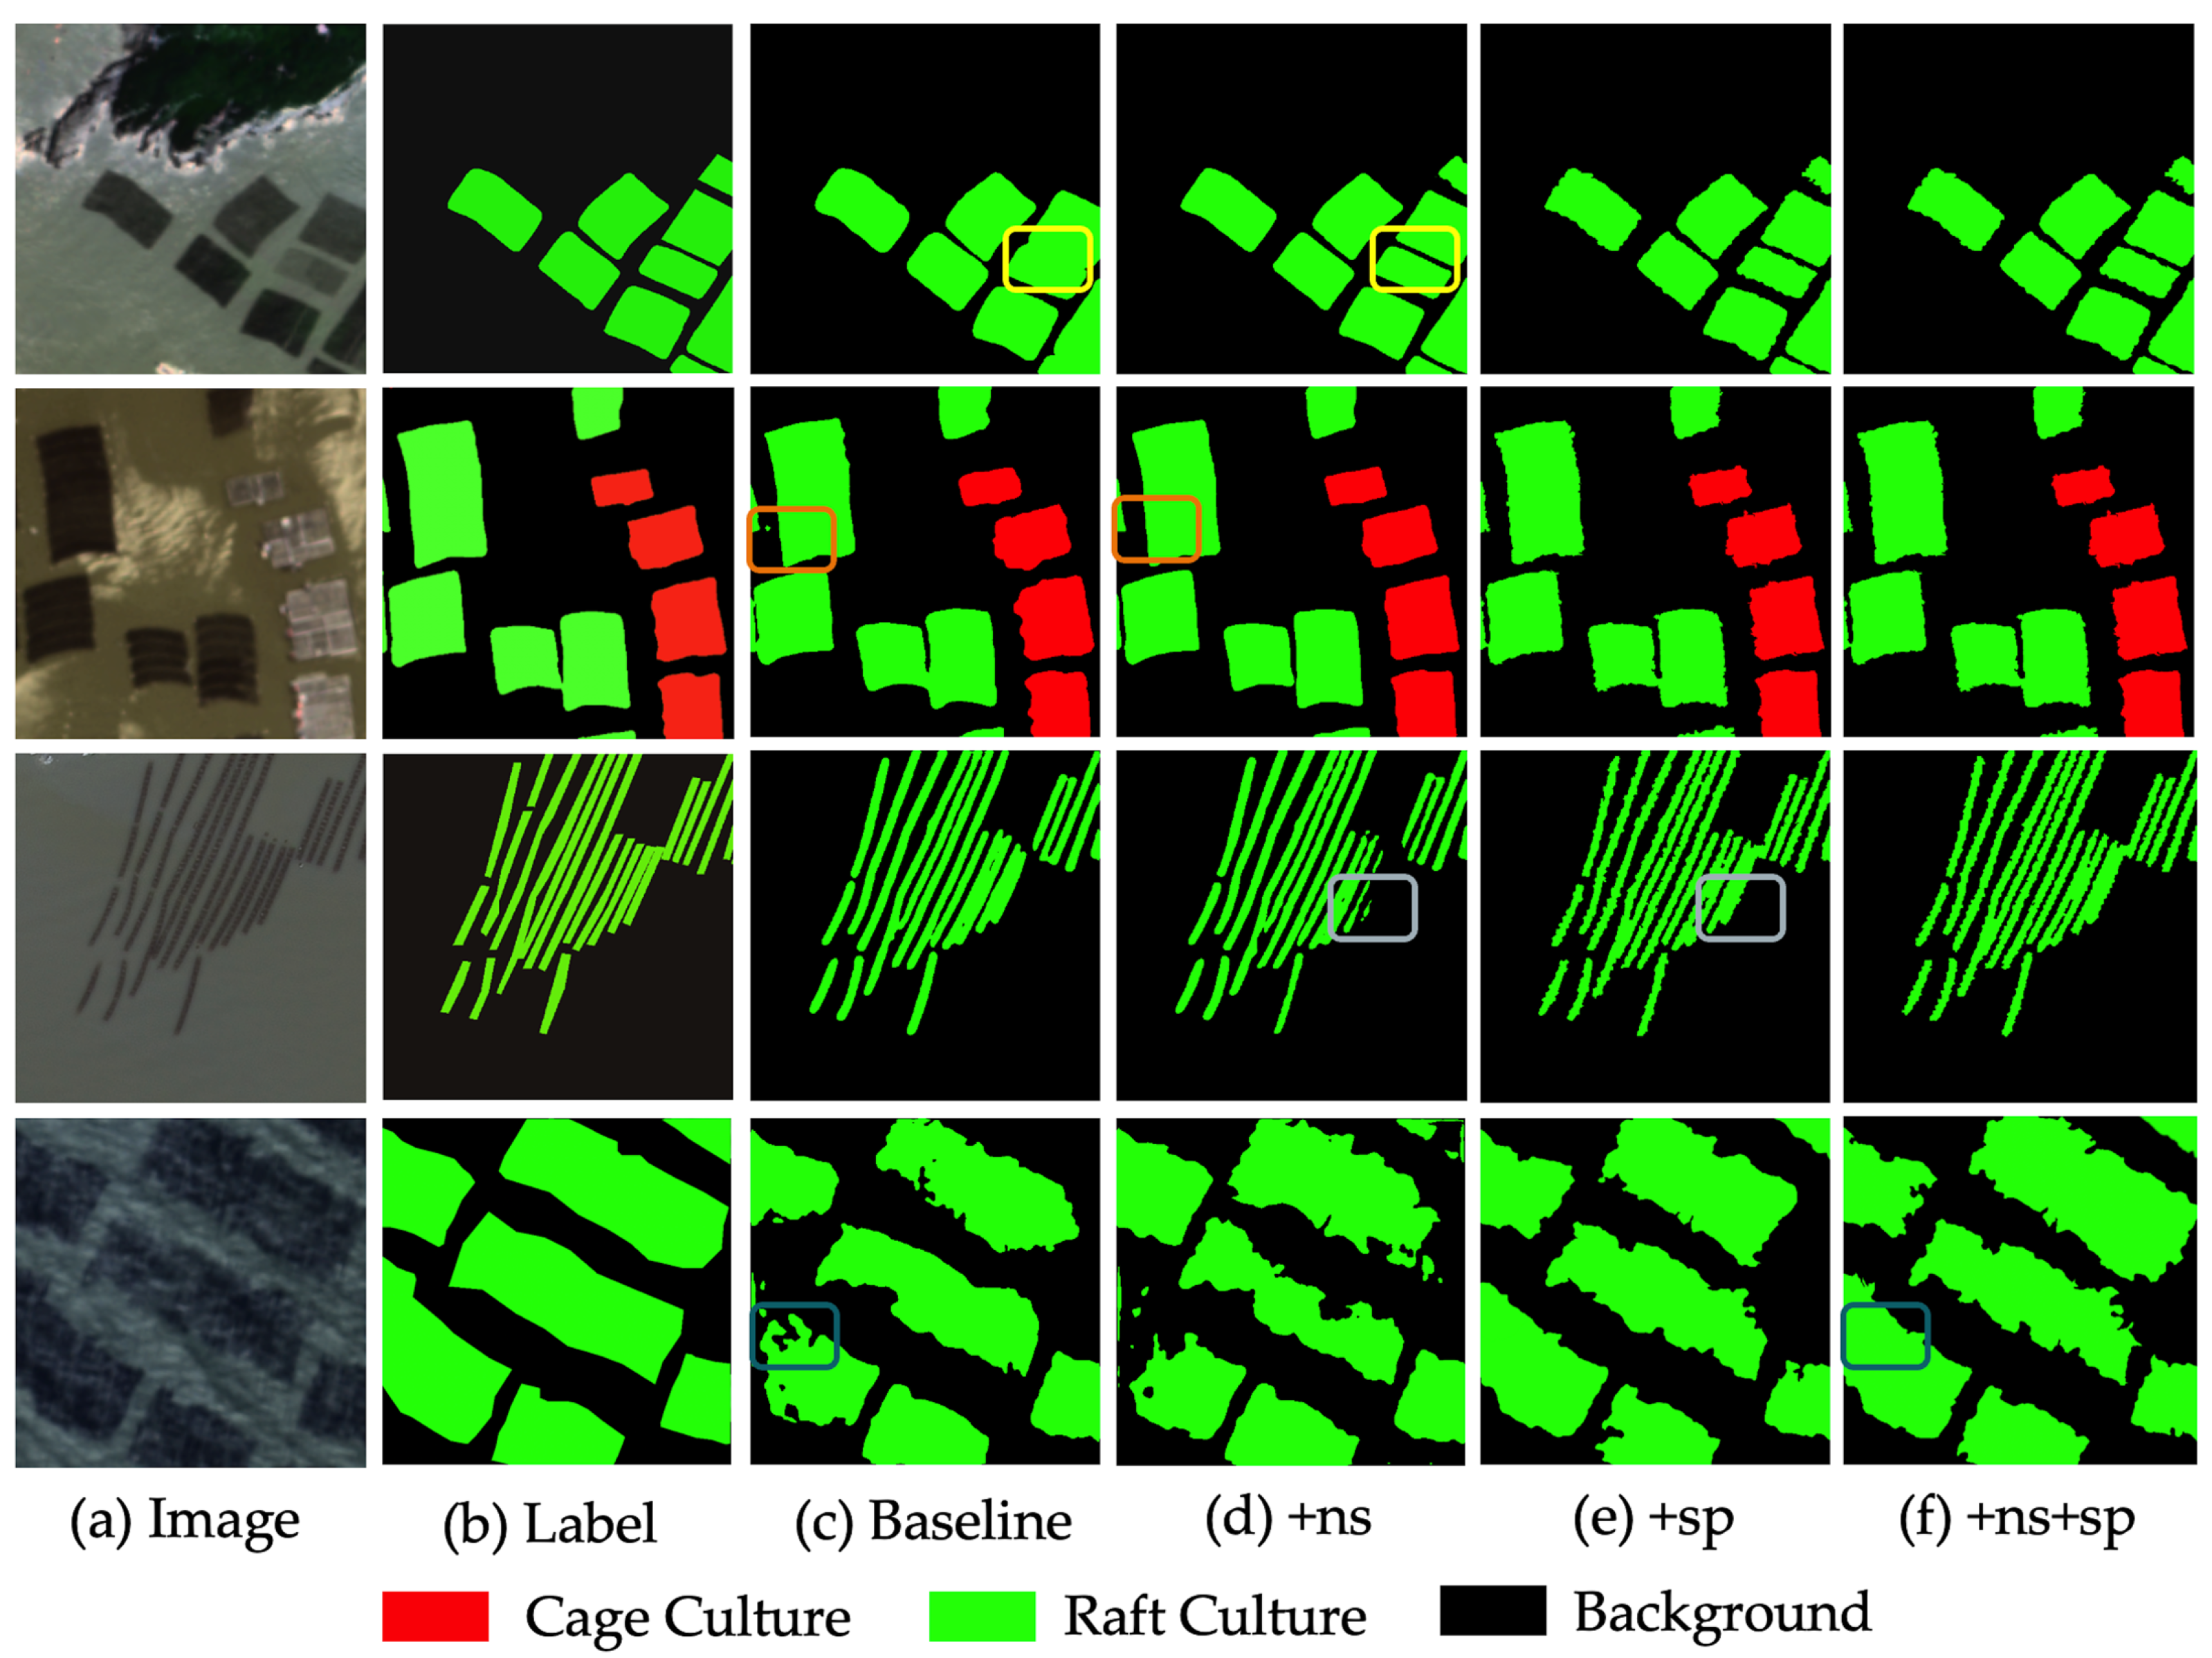
3.1. Ablation Study

To evaluate the performance of the negative sample technology, superpixel optimization module, and CANet, we gradually added various modules and methods proposed in this paper to the baseline network DeepLabV3+ and conducted experiments on the coastline aquaculture dataset produced in this paper. First, we used the baseline network DeepLabV3+ for training using it as a benchmark for comparison. Then the negative sample technology was added based on the baseline to test the effect of the negative sample technology on aquaculture extraction. Next, a superpixel optimization module was added based on the baseline to check the module’s ability to extract aquaculture details. Finally, based on the baseline, the negative sample technology and superpixel optimization module were added to verify the aquaculture extraction performance of the proposed CANet.
It can be seen from Table 2 that when using the baseline network, the overall accuracy mean F1 is 91.98%. When adding confusing negative samples as target resistance in the sample database, the overall accuracy rose to 93.22%. The single-category accuracy of aquaculture cages and rafts also increased by over 1%. After adding the superpixel optimization module to the baseline network, the overall accuracy reached 92.94%. The superpixel optimization module optimizes the extraction result details, so the accuracy improvement is smaller than the negative sample technology. After adding negative samples and superpixel optimization modules simultaneously, the overall accuracy reached 94.64%. Additionally, the accuracy of breeding cages and raft identification further improved. The quantitative accuracy comparison shows that the proposed CANet can significantly improve the accuracy of aquaculture extraction with the assistance of thee negative sample technology and superpixel optimization module.
Figure 5 is the visualization result obtained using the above four methods to perform model inference on the sample dataset, used to intuitively evaluate the performance of the negative sample technology and superpixel optimization module. In the first row, due to the significant colour difference and small distance between one breeding cage and the other cages, the result of the baseline network connects the two cages together; thus, a false detection occurs. After adding the negative sample technology, using negative samples for adversarial learning effectively distinguished the background area. In the second row, false detections occurred in the culture cages on the left, and were effectively resolved by adding the negative sample technology. After introducing superpixel optimization, the edge details of the contour of the culture raft on the right were more accurate and richer. In the third row, small false detections are present for slender culture cages after introducing the negative sample technique. However, using the superpixel optimization module reduced false detection. In the fourth row, the boundary of the culture cage label is relatively smooth, but in the remote sensing image the boundary is relatively rough. In this complex situation, both the baseline network and negative sample technology have a large number of missing detections. Combining the superpixel optimization module and negative sample technology can effectively solve the problem of missed detection and ensure that the boundary is more in line with the original image. In summary, CANet, which integrates negative sample technology and the superpixel optimization module, performs excellently in coastal aquaculture extraction tasks.

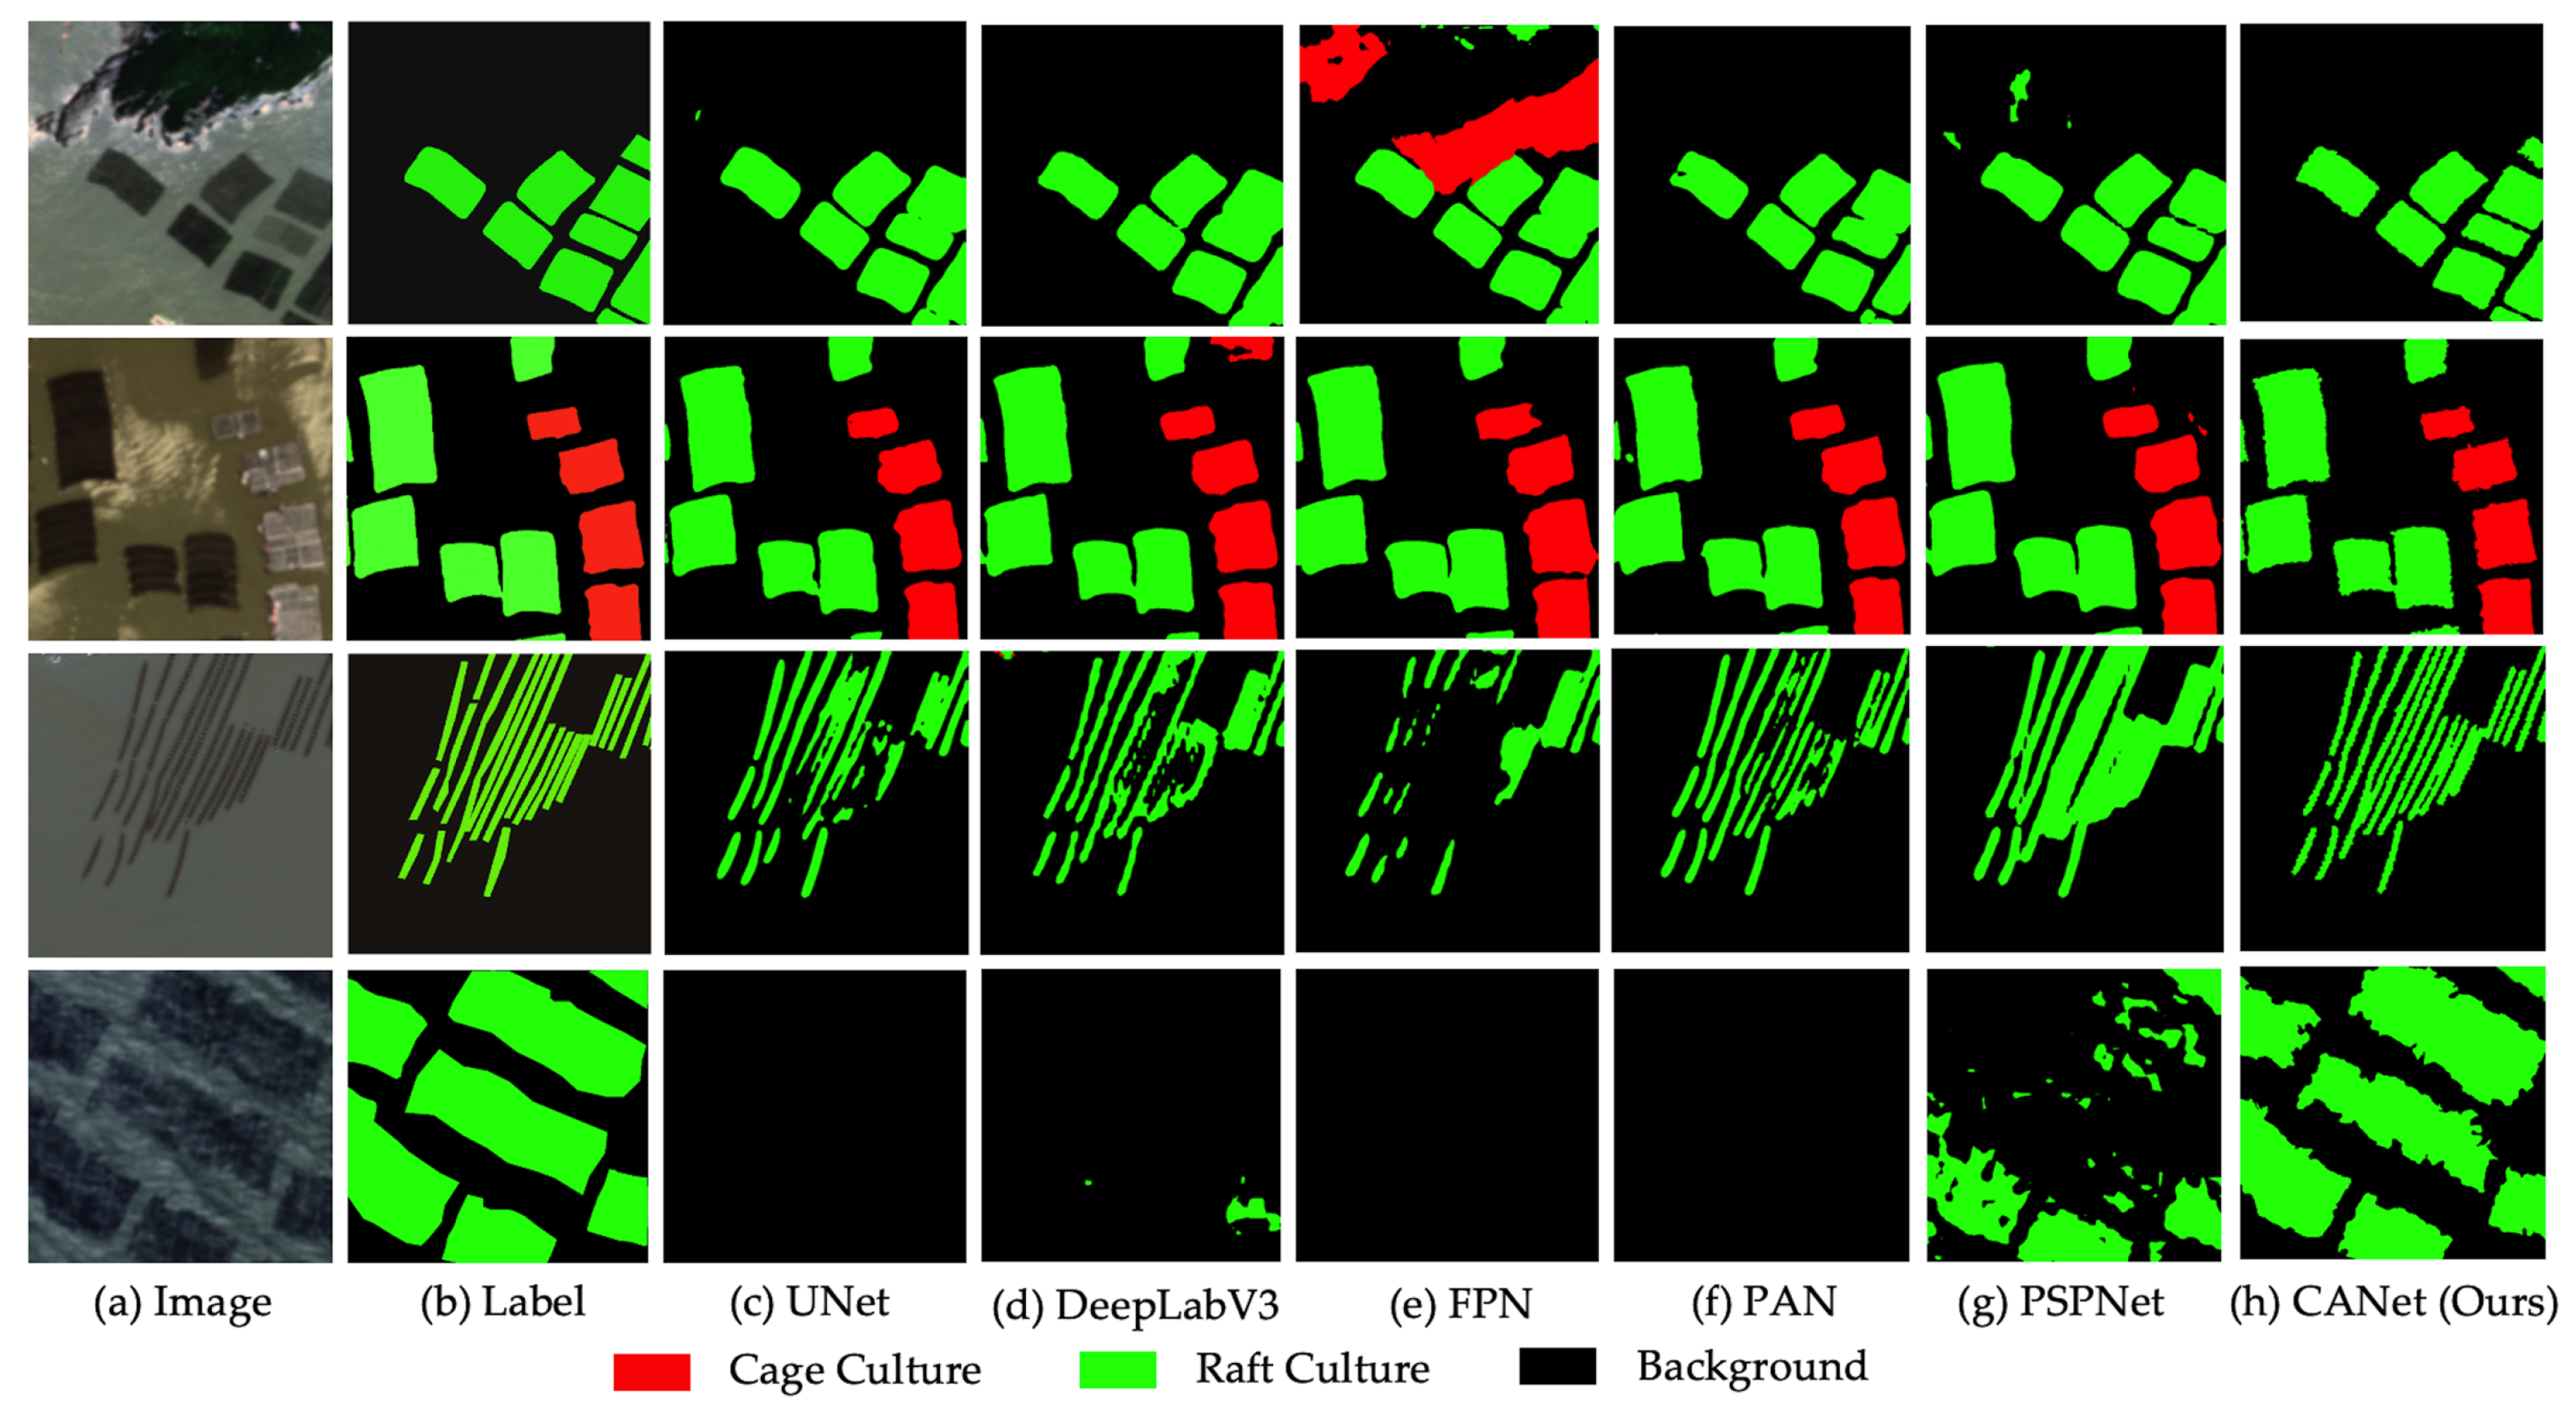
3.2. Comparing Methods

We selected some mainstream semantic segmentation networks for comparison to verify whether our proposed CANet network can achieve state-of-the-art performance. The following introduces the mainstream models used for comparison: UNet [23], a classic encoder–decoder network using a symmetrical U-shape structure and skip-layer connections to fuse deep semantic information with shallow spatial information. DeepLabV3 [49], a classic backbone network using different dilation convolution rates to solve multi-scale information extraction problems. FPN [50] uses a feature pyramid structure to fuse the semantic information of features of different scales. PAN [51] uses the attention mechanism to accurately filter effective feature information. PSPNet [26] uses the spatial pooling pyramid structure to solve multi-scale feature aggregation problems. Our proposed CANet integrates the negative sample technique and superpixel optimization module.
It can be seen from Table 3 that PSPNet has the highest overall accuracy compared with the other mainstream networks, and the mean F1 reaches 93.28%, while the proposed CANet reaches 94.64%. The background category CANet exceeds PSPNet by about 1.2%, the culture cage category exceeds PAN by about 0.4%, and the culture raft exceeds PSPNet by about 1.4%. This shows that the proposed CANet surpasses the other mainstream semantic segmentation networks from the perspective of quantitative comparison and reaches state-of-the-art performance.
Figure 6 compares the visualization results of CANet and other mainstream semantic segmentation networks for aquaculture extraction. In the first row, the FPN produces many false detections, and the other mainstream networks possess false concatenations and small false detections, while the CANet performs better. In the second row, almost all the other mainstream networks have certain false detections, while the extraction results of the proposed CANet are more accurate. In the third row, there are many missed detections in the FPN. PSPNet mistakenly connects breeding cages into one piece, while the result of proposed CANet is closest to the ground truth of the label. In the fourth row, the aquaculture cages and background in the original image are very complicated. Other mainstream networks struggle to effectively extract the aquaculture cages. PSPNet can extract a few, but there are still many missed detections. However, CANet can effectively extract all breeding cages, and the edge is more in line with the actual image. In summary, our proposed CANet achieved the best performance.

3.3. Large-Scale Mapping and Statistics

We use the trained CANet model with the best performance to automatically extract aquaculture from Gaofen-2 satellite data covering 640 coastal scenes of mainland China. After this, we obtained a regional distribution map of the cage and raft cultures within 30 km of the coast, as shown in Figure 7. Based on the coastal aquaculture map, we calculated statistics to obtain the area of breeding areas and the number of breeding targets in each province, as shown in Table 4.

3.4. Discussion

In this study, samples were created based on the panchromatic-fused Gaofen-2 images, and a rapid extraction method for two major marine aquaculture areas near the coast was explored based on high-resolution images. Compared with the Sentinel image, the Gaofen-2 images have a higher spatial resolution. The method improved the edge extraction and accuracy of the breeding area to varying degrees, providing a new benchmark method for the fast and high-precision extraction of small areas. Zhangzidao island, located in Liaoning Province, has been previously investigated for fraudulent aquaculture operations. The investigation used the Beidou navigation system to analyse the fishing operations of its fishing boats for several years. The actual production of aquaculture in Zhangzidao island can be evaluated with the help of single-phase high-resolution images using the method proposed in this work. Regarding data processing and interpretation efficiency, the advantages of using deep learning methods to extract aquaculture areas rapidly are demonstrated.
However, optical remote sensing images still have limitations [9]. Due to the characteristics of its sensors, the Gaofen-2 images have limited visibility to water bodies. The temporal resolution also results in a large amount of cloud coverage. For areas of turbulent sea, images may be jagged or contain disconnected phenomena in marine plant breeding areas [33], which will cause errors in the extraction results. Our superpixel optimization method can solve the impact of small-area disconnected problems. However, low-latitude regions with abundant clouds and rain often face problems of cloud coverage, making it difficult to obtain large-area images of the same time phase. Therefore, although the extraction of aquaculture areas by this method can maintain good accuracy, the actual extraction results will somewhat differ from human field survey data. Human field survey data depends on the date of data collection, whereas the automatic extraction algorithm depends on the imaging date. Although aquaculture in different periods does not change based on time or seasons, small changes cannot be avoided due to the influence of tides. Moreover, the model’s accuracy could not reach 100%, so there are slight difference between the automatically extracted aquaculture area and human field surveys. The proposed CANet model avoids the influence of location and time on the extraction results as much as possible by labelling samples of different locations and dates, achieving strong and robust generalization capabilities. Compared with other deep learning-based aquaculture extraction research [30,31,33,34,35,36,37], our method adopts the negative sample technique and multi-scale superpixel optimization method, which has a stronger generalization ability and robustness across time and location. Therefore, using the proposed CANet achieves good extraction results in large-scale aquaculture extraction, providing technical support for the automation of fishery resource censuses and the sustainable development of marine resources.

4. Conclusions

In this work, we proposed a convolutional neural network for coastal aquatic extraction from high-resolution remote sensing images. We constructed a sample database balancing spatial distribution and solving the model generalization problem for large-scale aquaculture extraction. We expanded the sample database by using confused land features as negative samples, thus solving the interference of confusing land features on aquaculture extraction. We designed a multi-scale-fusion superpixel segmentation optimization module based on the baseline DeepLabV3+, and designed the CANet network architecture. CANet effectively optimizes boundary identification and improves the overall accuracy of aquaculture extraction. Based on CANet, we extracted cage and raft culture areas near the coastline of mainland China with an overall accuracy of 94.64%, reaching state-of-the-art performance. The results obtained in this work can provide scientific, technical, and data support for the spatial planning and regulation of China’s coastal fisheries. In future research, we will aim to introduce more intensive time-series images to explore the relationship and laws between aquaculture and seawater flow, climate, economy, and other factors.

Author Contributions

Conceptualization, J.D. and Z.C.; methodology, J.D. and X.Y.; software, X.Y.; validation, J.D. and Y.B.; formal analysis, J.D. and X.Y.; investigation, J.D.; resources, C.L.; data curation, J.D. and Y.B.; writing—original draft preparation, J.D.; writing—review and editing, X.Y.; visualization, J.D. and Y.B.; supervision, T.S.; project administration, Z.C. and Y.B.; funding acquisition, Z.C. All authors have read and agreed to the published version of the manuscript.

Funding

This research was supported by the Strategic Priority Research Program of the Chinese Academy of Sciences under Grant No. XDA23100304.

Institutional Review Board Statement

Not applicable.

Informed Consent Statement

Not applicable.

Data Availability Statement

Not applicable.

Acknowledgments

The authors thank the editors and anonymous reviewers for their valuable comments, greatly improving the quality of the paper.

Conflicts of Interest

The authors declare no conflict of interest.

Abbreviations

The following abbreviations are used in this manuscript:
CANetcoastal aquaculture network
SLICsimple linear iterative clustering
F1F1 score
TPtrue positive
FPfalse positive
FNfalse negative
IoUintersection over union
nsnegative sample technology
spsuperpixel optimization technology

References

  1. Food and Agriculture Organization of the United Nations. The State of World Fisheries and Aquaculture 2020: Sustainability in Action; Food and Agriculture Organization of the United Nations: Rome, Italy, 2020. [Google Scholar]
  2. Hao, J.; Xu, G.; Luo, L.; Zhang, Z.; Yang, H.; Li, H. Quantifying the relative contribution of natural and human factors to vegetation coverage variation in coastal wetlands in China. Catena 2020, 188, 104429. [Google Scholar] [CrossRef]
  3. Rico, A.; Van den Brink, P.J. Probabilistic risk assessment of veterinary medicines applied to four major aquaculture species produced in Asia. Sci. Total. Environ. 2014, 468, 630–641. [Google Scholar] [CrossRef] [PubMed]
  4. Zheng, Y.; Jin, R.; Zhang, X.; Wang, Q.; Wu, J. The considerable environmental benefits of seaweed aquaculture in China. Stoch. Environ. Res. Risk Assess. 2019, 33, 1203–1221. [Google Scholar] [CrossRef]
  5. Gao, Q.; Li, Y.; Qi, Z.; Yue, Y.; Min, M.; Peng, S.; Shi, Z.; Gao, Y. Diverse and abundant antibiotic resistance genes from mariculture sites of China’s coastline. Sci. Total. Environ. 2018, 630, 117–125. [Google Scholar] [CrossRef] [PubMed]
  6. Ottinger, M.; Clauss, K.; Kuenzer, C. Aquaculture: Relevance, distribution, impacts and spatial assessments—A review. Ocean. Coast. Manag. 2016, 119, 244–266. [Google Scholar] [CrossRef]
  7. Zhang, J.; Wu, W.; Ren, J.S.; Lin, F. A model for the growth of mariculture kelp Saccharina japonica in Sanggou Bay, China. Aquac. Environ. Interact. 2016, 8, 273–283. [Google Scholar] [CrossRef] [Green Version]
  8. Maiti, S.; Bhattacharya, A.K. Shoreline change analysis and its application to prediction: A remote sensing and statistics based approach. Mar. Geol. 2009, 257, 11–23. [Google Scholar] [CrossRef]
  9. Campbell, J.B.; Wynne, R.H. Introduction to Remote Sensing; Guilford Press: New York, NY, USA, 2011. [Google Scholar]
  10. Karthik, M.; Suri, J.; Saharan, N.; Biradar, R. Brackish water aquaculture site selection in Palghar Taluk, Thane district of Maharashtra, India, using the techniques of remote sensing and geographical information system. Aquac. Eng. 2005, 32, 285–302. [Google Scholar] [CrossRef]
  11. Kapetsky, J.M.; Aguilar-Manjarrez, J. Geographic Information Systems, Remote Sensing and Mapping for the Development and Management of Marine Aquaculture; Number 458; Food & Agriculture Organization: Rome, Italy, 2007. [Google Scholar]
  12. Seto, K.C.; Fragkias, M. Mangrove conversion and aquaculture development in Vietnam: A remote sensing-based approach for evaluating the Ramsar Convention on Wetlands. Glob. Environ. Chang. 2007, 17, 486–500. [Google Scholar] [CrossRef]
  13. Saitoh, S.I.; Mugo, R.; Radiarta, I.N.; Asaga, S.; Takahashi, F.; Hirawake, T.; Ishikawa, Y.; Awaji, T.; In, T.; Shima, S. Some operational uses of satellite remote sensing and marine GIS for sustainable fisheries and aquaculture. ICES J. Mar. Sci. 2011, 68, 687–695. [Google Scholar] [CrossRef] [Green Version]
  14. Zhang, T.; Yang, X.; Hu, S.; Su, F. Extraction of coastline in aquaculture coast from multispectral remote sensing images: Object-based region growing integrating edge detection. Remote Sens. 2013, 5, 4470–4487. [Google Scholar] [CrossRef] [Green Version]
  15. Zhang, X.; Ma, S.; Su, C.; Shang, Y.; Wang, T.; Yin, J. Coastal oyster aquaculture area extraction and nutrient loading estimation using a GF-2 satellite image. IEEE J. Sel. Top. Appl. Earth Obs. Remote Sens. 2020, 13, 4934–4946. [Google Scholar] [CrossRef]
  16. Sun, Z.; Luo, J.; Yang, J.; Yu, Q.; Zhang, L.; Xue, K.; Lu, L. Nation-scale mapping of coastal aquaculture ponds with sentinel-1 SAR data using google earth engine. Remote Sens. 2020, 12, 3086. [Google Scholar] [CrossRef]
  17. Zhu, H.; Li, K.; Wang, L.; Chu, J.; Gao, N.; Chen, Y. spectral characteristic analysis and remote sensing classification of coastal aquaculture areas based on GF-1 data. J. Coast. Res. 2019, 90, 49–57. [Google Scholar] [CrossRef]
  18. Kang, J.; Sui, L.; Yang, X.; Liu, Y.; Wang, Z.; Wang, J.; Yang, F.; Liu, B.; Ma, Y. Sea surface-visible aquaculture spatial-temporal distribution remote sensing: A case study in Liaoning province, China from 2000 to 2018. Sustainability 2019, 11, 7186. [Google Scholar] [CrossRef] [Green Version]
  19. Du, Y.; Wu, D.; Liang, F.; Li, C. Integration of case-based reasoning and object-based image classification to classify SPOT images: A case study of aquaculture land use mapping in coastal areas of Guangdong province, China. Gisci. Remote Sens. 2013, 50, 574–589. [Google Scholar] [CrossRef]
  20. Wei, Z. Analysis on the Relationship between Mangrove and Aquaculture in Maowei Sea Based on Object-Oriented Method. E3S Web Conf. 2020, 165, 03022. [Google Scholar] [CrossRef]
  21. Zhang, B.; Chen, Z.; Peng, D.; Benediktsson, J.A.; Liu, B.; Zou, L.; Li, J.; Plaza, A. Remotely sensed big data: Evolution in model development for information extraction [point of view]. Proc. IEEE 2019, 107, 2294–2301. [Google Scholar] [CrossRef]
  22. LeCun, Y.; Bengio, Y.; Hinton, G. Deep learning. Nature 2015, 521, 436–444. [Google Scholar] [CrossRef]
  23. Ronneberger, O.; Fischer, P.; Brox, T. U-net: Convolutional networks for biomedical image segmentation. In Proceedings of the International Conference on Medical Image Computing and Computer-Assisted Intervention, Munich, Germany, 5–9 October 2015; Springer: Berlin/Heidelberg, Germany, 2015; pp. 234–241. [Google Scholar]
  24. Badrinarayanan, V.; Kendall, A.; Cipolla, R. Segnet: A deep convolutional encoder-decoder architecture for image segmentation. IEEE Trans. Pattern Anal. Mach. Intell. 2017, 39, 2481–2495. [Google Scholar] [CrossRef]
  25. Chen, L.C.; Papandreou, G.; Kokkinos, I.; Murphy, K.; Yuille, A.L. Deeplab: Semantic image segmentation with deep convolutional nets, atrous convolution, and fully connected crfs. IEEE Trans. Pattern Anal. Mach. Intell. 2017, 40, 834–848. [Google Scholar] [CrossRef] [PubMed] [Green Version]
  26. Zhao, H.; Shi, J.; Qi, X.; Wang, X.; Jia, J. Pyramid scene parsing network. In Proceedings of the IEEE Conference on Computer Vision and Pattern Recognition, San Juan, PR, USA, 17–19 June 1997; pp. 2881–2890. [Google Scholar]
  27. Chen, L.C.; Zhu, Y.; Papandreou, G.; Schroff, F.; Adam, H. Encoder-decoder with atrous separable convolution for semantic image segmentation. In Proceedings of the European Conference on Computer Vision (ECCV), Munich, Germany, 8–14 September 2018; pp. 801–818. [Google Scholar]
  28. Chen, J.; Lu, Y.; Yu, Q.; Luo, X.; Adeli, E.; Wang, Y.; Lu, L.; Yuille, A.L.; Zhou, Y. Transunet: Transformers make strong encoders for medical image segmentation. arXiv 2021, arXiv:2102.04306. [Google Scholar]
  29. Liu, Y.; Wang, Z.; Yang, X.; Zhang, Y.; Yang, F.; Liu, B.; Cai, P. Satellite-based monitoring and statistics for raft and cage aquaculture in China’s offshore waters. Int. J. Appl. Earth Obs. Geoinf. 2020, 91, 102118. [Google Scholar] [CrossRef]
  30. Cheng, B.; Liang, C.; Liu, X.; Liu, Y.; Ma, X.; Wang, G. Research on a novel extraction method using Deep Learning based on GF-2 images for aquaculture areas. Int. J. Remote Sens. 2020, 41, 3575–3591. [Google Scholar] [CrossRef]
  31. Su, H.; Wei, S.; Qiu, J.; Wu, W. RaftNet: A New Deep Neural Network for Coastal Raft Aquaculture Extraction from Landsat 8 OLI Data. Remote Sens. 2022, 14, 4587. [Google Scholar] [CrossRef]
  32. Ottinger, M.; Clauss, K.; Kuenzer, C. Large-scale assessment of coastal aquaculture ponds with Sentinel-1 time series data. Remote Sens. 2017, 9, 440. [Google Scholar] [CrossRef] [Green Version]
  33. Cui, B.; Fei, D.; Shao, G.; Lu, Y.; Chu, J. Extracting raft aquaculture areas from remote sensing images via an improved U-net with a PSE structure. Remote Sens. 2019, 11, 2053. [Google Scholar] [CrossRef] [Green Version]
  34. Fu, Y.; Ye, Z.; Deng, J.; Zheng, X.; Huang, Y.; Yang, W.; Wang, Y.; Wang, K. Finer resolution mapping of marine aquaculture areas using worldView-2 imagery and a hierarchical cascade convolutional neural network. Remote Sens. 2019, 11, 1678. [Google Scholar] [CrossRef] [Green Version]
  35. Cui, B.G.; Zhong, Y.; Fei, D.; Zhang, Y.H.; Liu, R.J.; Chu, J.L.; Zhao, J.H. Floating raft aquaculture area automatic extraction based on fully convolutional network. J. Coast. Res. 2019, 90, 86–94. [Google Scholar] [CrossRef]
  36. Lin, H.; Shi, Z.; Zou, Z. Maritime semantic labeling of optical remote sensing images with multi-scale fully convolutional network. Remote Sens. 2017, 9, 480. [Google Scholar] [CrossRef] [Green Version]
  37. Feng, Q.; Yang, J.; Zhu, D.; Liu, J.; Guo, H.; Bayartungalag, B.; Li, B. Integrating multitemporal Sentinel-1/2 data for coastal land cover classification using a multibranch convolutional neural network: A case of the Yellow River Delta. Remote Sens. 2019, 11, 1006. [Google Scholar] [CrossRef] [Green Version]
  38. Ferriby, H.; Nejadhashemi, A.P.; Hernandez-Suarez, J.S.; Moore, N.; Kpodo, J.; Kropp, I.; Eeswaran, R.; Belton, B.; Haque, M.M. Harnessing machine learning techniques for mapping aquaculture waterbodies in Bangladesh. Remote Sens. 2021, 13, 4890. [Google Scholar] [CrossRef]
  39. Zhang, Y.; Wang, C.; Ji, Y.; Chen, J.; Deng, Y.; Chen, J.; Jie, Y. Combining segmentation network and nonsubsampled contourlet transform for automatic marine raft aquaculture area extraction from sentinel-1 images. Remote Sens. 2020, 12, 4182. [Google Scholar] [CrossRef]
  40. Liu, S.; Gao, K.; Qin, J.; Gong, H.; Wang, H.; Zhang, L.; Gong, D. SE2Net: Semantic segmentation of remote sensing images based on self-attention and edge enhancement modules. J. Appl. Remote Sens. 2021, 15, 026512. [Google Scholar]
  41. Wang, Y.; Aubrey, D.G. The characteristics of the China coastline. Cont. Shelf Res. 1987, 7, 329–349. [Google Scholar] [CrossRef]
  42. Agency, C.I. The World Factbook 2011; Central Intelligence Agency: McLean, VI, USA, 2011. [Google Scholar]
  43. Li, W.; Zhao, S.; Chen, Y.; Wang, L.; Hou, W.; Jiang, Y.; Zou, X.; Shi, S. State of China’s climate in 2021. Atmos. Ocean. Sci. Lett. 2022, 15, 100211. [Google Scholar] [CrossRef]
  44. Boulay, S.; Colin, C.; Trentesaux, A.; Pluquet, F.; Bertaux, J.; Blamart, D.; Buehring, C.; Wang, P. Mineralogy and sedimentology of Pleistocene sediment in the South China Sea (ODP Site 1144). Proc. Ocean. Drill. Program Sci. Results 2003, 184, 1–21. [Google Scholar]
  45. Achanta, R.; Shaji, A.; Smith, K.; Lucchi, A.; Fua, P.; Süsstrunk, S. SLIC superpixels compared to state-of-the-art superpixel methods. IEEE Trans. Pattern Anal. Mach. Intell. 2012, 34, 2274–2282. [Google Scholar] [CrossRef] [Green Version]
  46. Paszke, A.; Gross, S.; Massa, F.; Lerer, A.; Bradbury, J.; Chanan, G.; Killeen, T.; Lin, Z.; Gimelshein, N.; Antiga, L.; et al. PyTorch: An imperative style, high-performance deep learning library. In Proceedings of the Advances in Neural Information Processing Systems, Vancouver, BC, Canada, 8–14 December 2019; pp. 8024–8035. [Google Scholar]
  47. He, K.; Zhang, X.; Ren, S.; Sun, J. Deep residual learning for image recognition. In Proceedings of the IEEE Conference on Computer Vision and Pattern Recognition, Las Vegas, NV, USA, 26 June–1 July 2016; pp. 770–778. [Google Scholar]
  48. Loshchilov, I.; Hutter, F. Decoupled weight decay regularization. arXiv 2017, arXiv:1711.05101. [Google Scholar]
  49. Chen, L.C.; Papandreou, G.; Schroff, F.; Adam, H. Rethinking atrous convolution for semantic image segmentation. arXiv 2017, arXiv:1706.05587. [Google Scholar]
  50. Kirillov, A.; Girshick, R.; He, K.; Dollár, P. Panoptic feature pyramid networks. In Proceedings of the IEEE/CVF Conference on Computer Vision and Pattern Recognition, Long Beach, CA, USA, 16–17 June 2019; pp. 6399–6408. [Google Scholar]
  51. Li, H.; Xiong, P.; An, J.; Wang, L. Pyramid attention network for semantic segmentation. arXiv 2018, arXiv:1805.10180. [Google Scholar]
Figure 1. The overall framework of coastal aquaculture extraction.
Sustainability 15 05332 g001
Figure 2. Sample database visualization for (a) cage culture, (b) raft culture, and (c) background.
Sustainability 15 05332 g002
Figure 3. The visualized results when a different number of superpixel blocks are set in an image. (a) Remote sensing image. (b) Superpixel blocks set as 64. (c) Superpixel blocks set as 128. (d) Superpixel blocks set as 256.
Sustainability 15 05332 g003
Figure 4. The network detail diagram of the coastal aquaculture network.
Sustainability 15 05332 g004
Figure 5. Visual comparison of the results of ablation learning of the different modules of the CANet. (a) Remote sensing image. (b) Label for coastal aquaculture. Results of (c) the baseline DeepLabV3+, (d) baseline with the negative sample technology, (e) baseline with the superpixel optimization module, and (f) baseline with the negative sample technology and superpixel optimization module (proposed CANet).
Sustainability 15 05332 g005
Figure 6. Visual comparison of the results between our proposed CANet and the other mainstream networks. (a) Remote sensing images. (b) Labels for coastal aquaculture. The results of (c) UNet, (d) DeepLabV3, (e) FPN, (f) PAN, (g) PSPNet, and (h) our proposed CANet.
Sustainability 15 05332 g006
Figure 7. The coastal aquaculture mapping of the coastline in mainland China.
Sustainability 15 05332 g007
Table 1. The latitude, average water depth, climate, and average annual sunshine hours of the bays used for sample labelling.
AreaLatitudeAverage
Water Depth
ClimateAverage Annual
Sunshine Hours
Jinzhou Bay in Liaoning 39 N 3∼9 mtemperate monsoon climate2200∼3000
Sanggou Bay & Allen Bay in Shandong 37 N 5∼10 mtemperate marine monsoon climate2200∼3000
Haizhou Bay in Jiangsu 34 N 5∼10 mtemperate monsoon climate2200∼3000
Sansha Bay in Fujian 26 N >10 msubtropical monsoon climate2200∼3000
Zhenhai Bay in Guangdong 21 N 5∼7 msubtropical monsoon climate2200∼3000
Leizhou Bay in Guangdong 20 N 5∼7 mtropical monsoon climate1400∼2000
Qinzhou Bay in Guangxi 20 N 2∼18 msubtropical marine monsoon climate2400∼2600
South Bay in Hainan 18 N 2∼10 mtropical marine monsoon climate2400∼2600
Table 2. Quantitative comparison of the accuracy of ablation learning in different modules of the CANet. “Baseline” represents the baseline DeepLabV3+; “+ns” represents the negative sample technology; “+sp” represents the superpixel optimization module; “+ns+sp” represents our proposed CANet with the negative sample technology and superpixel optimization module. Bold values indicate best precision.
MethodsBackgroundCage CultureRaft CultureMean F1Mean IoU
baseline92.7190.7292.5191.9888.66
+ns93.9191.9193.8593.2289.86
+sp93.3991.7693.6692.9489.78
+ns+sp95.4992.5595.8794.6490.91
Table 3. Quantitative comparison of the accuracy between our proposed CANet and other mainstream networks. Bold values indicate best precision.
MethodsBackgroundCage CultureRaft CultureMean F1Mean IoU
UNet92.3889.6692.7191.5886.77
DeepLabV392.7789.5592.9791.7686.82
FPN93.0986.1994.0891.1285.88
PAN93.6692.1792.6692.8387.92
PSPNet94.2191.1594.4793.2888.43
CANet95.4992.5595.8794.6490.91
Table 4. The area of aquaculture areas and the number of aquaculture targets in each province.
ProvinceAquaculture Area ( km 2 )Number of Aquaculture Targets
CageRaftTotalCageRaftTotal
Liaoning3.99671.20675.1994751,28552,232
Hebei & Tianjin0.070.010.089237129
Shandong6.79564.16570.95290659,64362,549
Jiangsu2.29653.93656.21201888,04590,063
Zhejiang & Shanghai1.8954.7856.671708955211,260
Fujian54.46462.28516.7421,99079,348101,338
Guangdong42.41189.43231.8446,301115,965162,266
Guangxi24.6118.2142.8221,99215,46637,458
Hainan3.130.733.8625905773167
Disclaimer/Publisher’s Note: The statements, opinions and data contained in all publications are solely those of the individual author(s) and contributor(s) and not of MDPI and/or the editor(s). MDPI and/or the editor(s) disclaim responsibility for any injury to people or property resulting from any ideas, methods, instructions or products referred to in the content.

