Abstract
This paper aims to identify the groundwater-potential zones in coastal zones of the Cuddalore district by integrating remote sensing, Geographic Information System (GIS), and Analytical Hierarchy Process (AHP) techniques. The thematic layers such as geomorphology, landuse/land cover, lineament density, geology, soil, drainage density, rainfall, and slope are considered for the identification of groundwater-potential zones. The groundwater-potential zones are categorized into five zones as ‘very good’, ‘good’, ‘moderate’, ‘poor’, and ‘very poor’. From the study, it is observed that the rainwater/surface water infiltration to the aquifer is high in the eastern region due to flat topography, and thus, these zones possess ‘very good’ and ‘good’ groundwater-potential zones. The groundwater potential in the central region of the study area possesses moderate infiltration capacity, which is suitable for agricultural practices. Moreover, it is also observed that the groundwater potential is ‘poor’ and ‘very poor’ in the northwest region due to steep slopes in which suitable recharge structures should be constructed in these zones to harvest the rainwater. Eventually, the obtained results are validated with existing bore wells in the study area, and it reveals that a GIS-based integrated method is an effective tool for the exploration of groundwater resources with high accuracy.
1. Introduction
Groundwater is an important natural resource that plays a vital role in the existence of human life. The availability of groundwater is dynamic, and it is influenced by rainfall recharge [1] topographic features, pores of the soil, lithologic conditions, geologic formation, drainage pattern, land use pattern, and rock features such as fractures, folds, and joints [2,3]. There has been an increase in demand for groundwater in the last few decades due to the rapid growth of population, increased industrialization, and agricultural intensification [4]. Domestic and industrial needs in semiarid regions are largely met through groundwater [5,6]. Notable scholars [7,8] have pointed out that groundwater in India accounts for 65% of agricultural activities. This increased use of groundwater results in the depletion of its level [9], enhanced geochemical process in aquifers, and deterioration of groundwater quality [10,11]).
Groundwater users often overlook groundwater problems until they are well advanced. During the initial stages of development, when the abstraction of water is less than the natural recharge, groundwater management is fairly simple. However, the management problems increase significantly as the development reaches a stage where the abstraction is equal to or exceeds the natural recharge. Therefore, groundwater-potential zone identification is of paramount importance for the safe withdrawal of groundwater and effective management [12]. Researchers have pointed out that the groundwater-potential zones can be delineated by different traditional methods such as water table fluctuation [13,14], geophysical survey [15,16,17] and determination of aquifer properties [18,19]. Traditional methods require skilled labor and are time-consuming and uneconomic [20]. Remote sensing and GIS techniques have emerged, in recent decades, as a modern method to explore groundwater resources [21]. The factors involved in traditional and modern methods of exploring the groundwater-potential zones are different, and hence the outcomes may vary consequently [22].
Geospatial technologies are widely used by various researchers across the world to identify groundwater-potential zones [23,24] by incorporating geo-environmental factors such as geomorphology, land use/land cover, lineament density, geology, lithology, soil, drainage density, rainfall and slope [25,26]. This technique is a time-consuming but cost-effective, robust, and effective tool to decipher the groundwater-potential zones [27,28]. Integration of satellite data, convention maps, and rectified ground truth data serve as guidelines for the exploration of groundwater resources. Substantial investigations [29,30,31,32,33,34,35,36,37,38] have been conducted on hydrogeochemical characteristics of groundwater in Cuddalore District, Tamil Nadu State, India. Ref. [39] investigated groundwater discharges in coastal zones of the Cuddalore district. The electrical resistivity method is used to identify the source of groundwater pollution in the study region [40]. The hydrogeophysical investigation is carried out by [41] to study the subsurface conditions. Geospatial technology is used to demarcate the zones of groundwater potential [42]. However, no studies have been carried out in the study region to delineate the groundwater-potential zones by incorporating geo-environmental factors using the integration of remote sensing, GIS, and AHP techniques. Therefore, the primary objective of this research work is to delineate the groundwater-potential zones through the integration of remote sensing, GIS, and AHP techniques for the effective management of groundwater resources in the study area.
2. Study Area
The study area is set in the eastern part of Cuddalore district, Tamil Nadu, India, between latitudes 11°20′ N to 11°50′ N and longitudes 79°20′ E to 79°50′ E (Figure 1) with an aerial extent of 1258.46 km2. The average altitude of the study region is 6 m. The average temperature ranges between 20 °C and 38 °C. The normal annual rainfall varies from 1050 to 1400 mm, a large of which is contributed by the northeast monsoon (57%) followed by the southwest monsoon (31%), summer (7%), and winter (5%). The rainfall in the northern region is drained through Gadilam and Pennaiyaar rivers, whereas the southern region is drained by Vellar and Coleroon rivers. The rivers flow from west to east toward the coast, and the coastal part is covered by lagoons and backwaters [43]. Geologically, the region comprises sedimentary strata of tertiary and quaternary deposits belonging to the age of Mio Pliocene and sub-recent age, respectively [36]. The tertiary formation consists of sandstone; however, the quaternary formation encompasses soils, coastal sand, clay, and alluvium [44]. The sandstones are interposed with clay lenses at a few locations below the alluvial formation. The Quaternary deposit is found at a depth of less than 30 m, and the tertiary deposit occurs at a larger depth. The quality of groundwater in the eastern part is poor due to the intrusion of seawater and lagoons during high tides. The occurrence and movement of the groundwater in sedimentary formation depend on the rate of transmissivity, permeability, specific capacity, specific yield, and grain size of the particles. Three types of aquifers such as phreatic, semi-confined-to-confined, and alluvial found in the study region. The phreatic aquifer occurs in sandstone formation, and alluvial formation occurs at shallow depths. The confined aquifer extends to a greater depth between 100 and 450 m below the ground level.
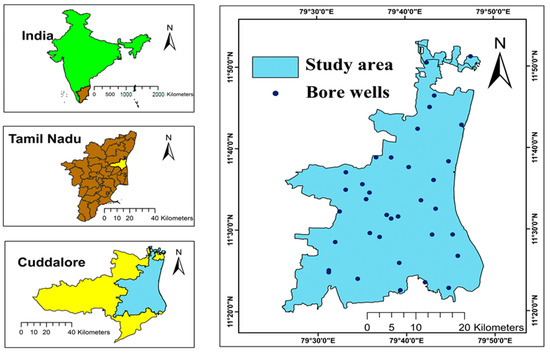
Figure 1.
Location of study area.
3. Materials and Methods
3.1. Thematic Layer
In order to delineate groundwater-potential zones in the study area, eight thematic maps such as geomorphology (GM), land use/land cover (LULC), lineament density (LD), geology (GE), soil (SO), drainage density (DD), rainfall (RF), slope (SL) are prepared using ArcGIS pro software (Figure 2). The geology, geomorphology, and soil details are obtained from Public Works Department (PWD). Linear Imaging and Self Scanning Sensor (LISS-III with 24 m spatial resolution) acquired in April 2017 (Bhuvan) is used to derive the LULC map [28,45] using the supervised classification technique. Lineaments are interpreted by automatic line extraction in PCI (Peripheral Component Interconnect) Geomatica, and lineament density map (km/km2) is prepared using line density (spatial analysis tool). The drainage density (km/km2) and slope (degree) are derived from DEM with 30 m resolution using spatial analysis tool [46,47,48]. The rainfall data are obtained from Indian Meteorological Department (IMD), and rainfall map is prepared from average annual rainfall using inverse distance weightage through spatial interpolation techniques. The above-said thematic maps are integrated after assigning proper weightage using weighted overlay analysis.
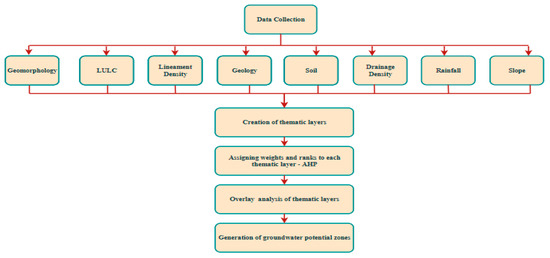
Figure 2.
Methodology of proposed study.
3.2. Assignment of Weights and Rankings
The weights assigned to these eight parameters are determined based on past studies, field experience, and opinion of experts [49]. The groundwater storage and flow are mainly controlled by these eight parameters. The high and low weights are assigned to the parameters which play a major and minor role in groundwater potential, respectively. Researchers [49,50,51] have used the Analytical Hierarchy Process (AHP) in solving the multi-parameter assessment. The relative importance of individual classes within the same map and thematic maps are compared to each other using pairwise comparison matrices. Moreover, the pairwise comparison matrix is created for eight layers by comparing the given scores for each layer (Table 1).

Table 1.
Pairwise comparison matrix for the Analytical Hierarchy Process (AHP).
The relative importance of a set of criteria over another is decided based on Saaty’s scale from 1 to 9. As pointed out in (Dar et al., 2021 [49]), a score 1 refers to equal accounts, and a score 9 means one factor has greater importance over other. The eigenvector approach is used to generate the normalized weights of each thematic layer (Table 2). The existence of subjectivity due to weights assigned to each thematic layer is reduced by the normalization process [52]. From the pairwise comparison matrix, the maximum eigenvalue in the normalized eigenvalue is used to derive the final weights of each thematic layer, and in order to obtain the same, Ref. [50] suggested computing consistency ratio as explained below. Thus, the uncertainty encountered in AHP assessment is identified through calculation of consistency ratio (CR).
Table 2.
Normalized Pairwise comparison matrix and weights obtained for the AHP process.
The consistency Index is calculated by Equation (1).
where, ‘λmax’ is the principal eigenvalue computed by eigenvector method and ‘n’ denotes the number of classes.
The consistency ratio (CR) refers to the consistency of the matrix. In the matrix with CR value greater than 0.1, the relative importance given is untrustworthy and needs to be reconsidered until the CR < 0.1 is achieved. The CR value is calculated by Equation (2).
RI is the Ratio Index.
In this case, consistency check of the layers is λmax = 8.258, n = 8, RI = 1.41, CI = 0.0369 and CR = 0.02. The calculated consistency value is less than the required value of 0.1 and hence a high level of consistency is reached.
Thus, the occurrence of groundwater potential depends on these eight parameters, and the appropriate weights are assigned to the parameters considered for this study for the overlay process (Table 3). The overlay analysis is carried out by integration of thematic maps using ArcGIS pro software. The thematic maps are converted into raster format, which consists of rank and weightage. The weighted overlay technique is used to calculate the groundwater-potential zones (GWP) using Equation (3) [53].
Table 3.
Weightage and rating of the factors influencing groundwater-potential zones.
The obtained groundwater-potential zones are validated with depth of water in the dug well.
4. Results and Discussion
4.1. Geomorphology
A Geomorphology map provides information about the origin, occurrence, and movement of groundwater [54,55]. In geomorphological landforms such as alluvial plains, flood plains, and pediplains, groundwater occurrence is mainly influenced by lithologic conditions, slope, drainage pattern, infiltration rate, and runoff [3]. The major portion of the study area is a flat plain, sloping gently from west to east and towards the sea. The observed geomorphologic unit consists of different landforms such as alluvial plains, coastal plains, flood plains, pediplains, and uplands (Figure 3a). The eastern region is covered with a coastal plain. Flood plains are noticed in the northern and southern parts of the study area. An alluvial plain is also found in the northern and southwestern regions. The western region is covered with pediplain and upland with undulating surfaces. The distribution and changes in morphological traits correlate with the variations in lithology [42]. Moreover, the alluvial plain, coastal plain, and flood plain are associated with high porosity [56], and groundwater potential is accumulated in these zones [49]. Thus, it can be concluded that the alluvial plain, coastal plain, and flood plain are categorized as ‘very good’, ‘good’, and ‘moderate’, respectively. The pediplain weathered formation is regarded as ‘poor’, and the upland category is considered as ‘very poor’ due to high runoff [57].
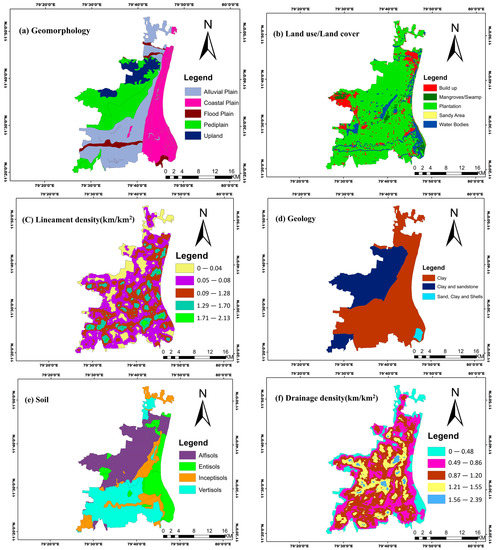
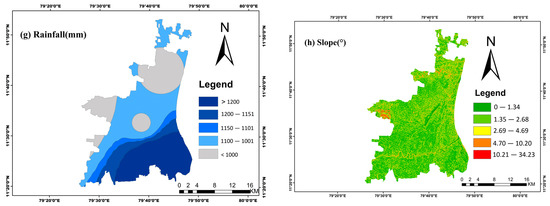
Figure 3.
(a) Geomorphology (b) land use/Land cover; (c) Lineament d ensity; (d) Geology; (e) Soil; (f) Drainage density; (g) Rainfall; (h) Slope.
4.2. Land Use/Land Cover (LULC)
The earth’s surface topographical conditions are reflected through the land use/land cover. The LULC maps are essential for the planning, development, and management of groundwater [58]. The LULC in semiarid regions changes quickly due to climate change and water scarcity. The recharge of surface water to the aquifer is mainly influenced by land use/land cover, and also it helps to identify the groundwater-potential zones [56,59]. The study area is covered by water bodies, sandy areas, plantations, forests, and built-up land (Figure 3b). The LULC classes, such as water bodies and sandy areas, hold a sufficient amount of groundwater than other LULC classes [28]. Moreover, the water bodies also serve as groundwater recharge zones, and the infiltration rate is high in the sandy area [60]. Thus water body and sandy area are grouped as ‘very good’ and ‘good’ categories, respectively. The plantation is considered as ‘medium’, and the forest is categorized as ‘poor’ [51]. Generally, it is observed that the infiltration is less in built-up land, resulting in a high runoff, and therefore, it is categorized as ‘very poor’ [28].
4.3. Lineament Density
Lineament density is the measure of different geological structures, and it represents the zones of faults and fractures [22]. Lineaments are created by tectonic activity, and it reveals information related to underlying structural features through surface topographic conditions [61]. Lineament density plays a key role in controlling the infiltration of surface water into the aquifer and thus leads to a direct relationship exists between lineament density and groundwater-potential zones [3,62]. The weightage assigned to lineament density is based on the lineament’s proximity. As seen in the study by [28], it is also observed that groundwater-potential decreases as the distance from the lineament increases. The high lineament density provides good porosity, and thus high weight is given to categories with high lineament density [63]. The lineament density in the study area ranges between 0 and 2.13 km/km2 (Figure 3c). Based on lineament density, the study area is categorized into five classes as ‘very good’ (2.13–1.71 km/km2), ‘good’ (1.70–1.29 km/km2), ‘moderate’ (1.28–0.09 km/km2), ‘poor’ (0.08–0.05 km/km2), and ‘very poor’ (0.04–0 km/km2). The results confirm that the high lineament density regions are associated with good groundwater-potential zones and are favorable for groundwater development.
4.4. Geology
The movement of groundwater is mainly influenced by rock parameters such as porosity and permeability, and these parameters differ for different types of rock [64]. The sedimentary formation is highly influenced by primary porosity [57]. The geological formation of the study region comprises sand/clay/shells admixture, clay/sandstone admixture, and clay (Figure 3d). Sand/clay/shells admixture is observed in the southeastern region. The western and a few parts of the southern region are covered with clay/sandstone formations. The clay formation is observed in the eastern, northern, and southern parts of the study area. Sand/clay/shells admixture possesses high infiltration [65], and thus it is categorized as ‘good’. The permeability is medium in clay/sandstone admixture [66], and consequently, it is categorized as ‘moderate’. The clay formation possesses low permeability [67], and thus, low weightage ‘poor’ is assigned to this formation.
4.5. Soil
The interaction between surface water and groundwater depends on the permeability and porosity of the soil [58]. Soil infiltration capacity directly depends on its composition, and also it influences groundwater availability [49]. The infiltration of water into the aquifer is highly influenced by the texture and hydraulic characteristics of the soil. The soil unit of the study area comprises inceptisols, entisols, aflisols, and vertisols, as shown in Figure 3e. The northern and middle regions of the study area are covered with alfisols. The entisols are mainly observed in the eastern region and also in the western region. The inceptisols spread throughout the study; however, the vertisols are noticed in the southern region and some parts of the northern region. The weightage for each class is assigned based on their degree of infiltration. The high weightage is assigned to inceptisols and entisols since the alfisols and vertisols consist of clay particles [56]. The alfisols play a moderate impact on groundwater potential [68]. The highest weight of ‘very good’ is assigned to inceptisols as it has a high degree of infiltration, followed by ‘good’ (entisols), ‘moderate’ (alfisols), and ‘poor’ (vertisols).
4.6. Drainage Density
Drainage density is the ratio of the total length of stream channels to the total catchment area of the basin [69]. It is the quantitative measurement of the stream channel length of the entire basin [70], and it is a function of physical characteristics and climatic conditions [61,71]. Drainage density is influenced by geologic conditions, geomorphologic features, and the amount of rainfall [72]. It also resembles the runoff in the catchment as well as the amount of rainwater infiltrated into the aquifer [73]. Ref. [22] found that drainage density is inversely related to permeability, and thus inverse relationship exists between drainage density and groundwater-potential zones. The zones with high drainage density are associated with high runoff [68], and thus it results in less percolation. Thus, high and low drainage density zones are associated with low and high groundwater-potential zones, respectively [67]. From the study, it was found that drainage density ranges between 0–2.39 km/km2, and it is a mixed pattern in the study area (Figure 3f). It is categorized as ‘very good’ (0–0.48 km/km2), ‘good’ (0.49–0.86 km/km2), ‘moderate’ (0.87–1.20 km/km2), ‘poor’ (1.21–1.55 km/km2), and ‘very poor’ (1.56–2.39 km/km2). The high weight is assigned to low drainage density and low weight to high drainage density [52,60].
4.7. Rainfall
The major source of groundwater in the study area is contributed by the strong rainfall relationship that exists between rainfall and groundwater [74]. Rainfall intensity and duration play a significant role in infiltration and surface runoff [75]. The recharge of groundwater is maximum in high-intensity rainfall than in low-intensity rainfall [57]. The average annual rainfall in the study area ranges between 1050 and 1400 mm. Even though average annual rainfall is high, water scarcity is observed in a few regions of the study area due to erratic patterns of rainfall and topography conditions. From Figure 3g, it can be seen that a high amount of rainfall is observed in the southeastern region, and a low amount of rainfall is observed in the northern, middle, and western regions of the study area. This shows that there is a direct relationship exists between rainfall and groundwater availability, and thus, greater weightage is assigned to high rainfall [65,76]. The rainfall is classified into five categories on the basis of minimum and maximum average annual rainfall [28] as ‘very good’ (>1200 mm), ‘good’ (1200–1151 mm), ‘moderate’ (1150–1101 mm), ‘poor’ (1100–1000 mm) and ‘very poor’ (<1000 mm). From the obtained results, it can be concluded that the high rainfall zones are associated with flat slope conditions, which possess a high rate of infiltration, and these zones serve as augmentation of groundwater resources.
4.8. Slope
Groundwater recharge and catchment runoff are highly influenced by the slope [72,77]. The slope is an important factor in the discharge of groundwater, and it helps to identify the sites for constructing the artificial recharge structures [51]. The slope is an essential factor in evaluating groundwater availability. The study area covers a gentle flat slope, whereas the slope of a high degree is observed in the western region due to the presence of upland (Figure 3h). A high slope is observed in the western region, which possesses high runoff [78]. This indicates that the infiltration of surface water into the aquifer is relatively lesser than in other locations. The eastern region encompasses a gentle slope, and these zones are associated with a high rate of infiltration. High degrees and low degrees of slopes are associated with high and low runoff, respectively. Thus high weightage is assigned to a low slope degree and low weightage to a high slope degree, as given in the research works of [67] and [79]. The slope of the study area varies between 0–34.23° (Figure 3h), and it is grouped into five classes as ‘very good’ (0–1.34°), ‘good’ (1.35–2.68°), ‘moderate’ (2.69–4.69°), ‘poor’ (4.70–10.20°) and ‘very poor’ (10.21–34.23°). From the results, it can be concluded that the low degree of slope is associated with the accumulation of groundwater resources; however, the high degree of slope is related to the shrinkage of groundwater resources [80].
4.9. Groundwater-Potential Zones
The groundwater-potential zones are obtained as a result of the weighted overlay of all the thematic layers based on the individual and layer class weightage of the thematic layers such as geomorphology, landuse/landcover, lineament density, geology, soil, drainage density, rainfall, and slope. The obtained groundwater-potential map is categorized into five zones as ‘very good’, ‘good’, ‘moderate’, ‘poor’, and ‘very poor’ (Figure 4). The result reveals that 15.83% (199.32 km2) and 28.35% (356.78 km2) of the total study area fall under very good and good, respectively. A total of 29.31% (368.98 km2) of the study area possess ‘moderate’ groundwater-potential zones. The ‘poor’ and ‘very poor’ groundwater-potential zones of the study area constitute around 15.53% (195.51 km2) and 10.95% (137.87 km2), respectively. The ‘very good’ and ‘good’ groundwater-potential zones are concentrated along the coastal plain in the eastern region and around water bodies. These zones must be protected from contamination as it is associated with high infiltration capacity and high permeability [43]. The flat topography of these zones is favorable for rainwater/surface water to infiltrate into the aquifer. The ‘moderate’ groundwater-potential zones are located in the central to the southern region, and these zones are associated with alluvial plains [77]. The infiltration capacity is moderate in these zones and suitable for agricultural practices. The ‘very poor’ and ‘poor’ groundwater-potential zones are noted in the northwestern region, and these zones are associated with both pediplain and upland [80]. The uneven topography and high slope of these zones result in a high runoff, and thus, infiltration capacity is very low. The surplus water in monsoon seasons should be properly stored by constructing the recharge structures such as check dams, percolation ponds, and recharge shafts.
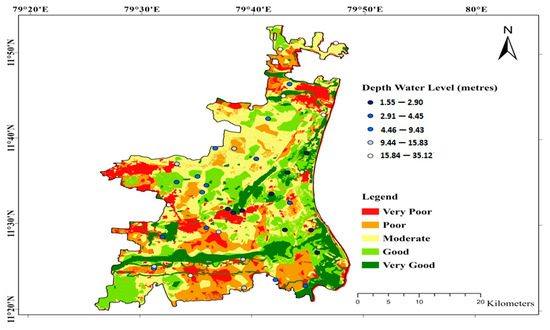
Figure 4.
Groundwater-potential zones.
In ‘very poor’ and ‘poor’ groundwater-potential zones, groundwater utilization should be minimized by changing the cropping pattern. Surface water and rainwater should be used as alternative sources to meet the demand. The water management policies should be strictly implemented in these zones to augment the groundwater resources.
4.10. Validation of Obtained Groundwater-Potential Zones
The groundwater-potential map is overlaid with 35 observation bore wells data for validation. The groundwater level data are obtained from the Central Ground Water Board (CGWB) and Public Works Department (PWD) for pre- and post-monsoons during the year 2018–2019. On the basis of maximum and minimum water depth in the wells, the observed wells are categorized into five categories as ‘very good’ (1.55–2.90 m), ‘good’ (2.91–4.45 m), ‘moderate’ (4.46–9.43 m), ‘poor’ (9.44–15.83 m), ‘very poor’ (15.84–35.12 m). Table 4 shows the error matrix of groundwater-potential zones. The error matrix is developed by correlating obtained a groundwater-potential map and observed wells data using accuracy assessment [61].
Table 4.
Error matrix of groundwater-potential zones.
The overall accuracy is the ratio of the number of correct observation wells to the total number of wells [61,81]. The Kappa coefficient (K) is another indicator of accuracy, whereas its value ranges between 0 and 1. The results also confirm that a high and low Kappa coefficient is associated with good and no agreement, respectively.
The Kappa coefficient is calculated by Equation (4) [61,82].
The overall accuracy obtained by the error matrix is 77.14%, and the Kappa coefficient is 0.71. This result shows that a good correlation exists between groundwater-potential maps and observation bore wells data.
5. Conclusions
The groundwater-potential zones are identified using the integration of GIS, remote sensing, and AHP techniques by considering the factors such as geomorphology, land use/land cover, lineament density, geology, soil, drainage density, rainfall, and slope, which influence the availability of groundwater. The results show that 15.83% (199.32 km2), 28.35% (356.78 km2), and 29.31% (368.98 km2) of the study area are associated with ‘very good’, ‘good’ and ‘moderate’ groundwater-potential zones respectively. The 15.53% (195.51 km2) and 10.95% (137.87 km2) of the study region consist of ‘poor’ and ‘very poor’ groundwater-potential zones, respectively. The ‘very good’ and ‘good’ groundwater-potential zones are detected in the eastern region, and these zones are accompanied by a high infiltration rate and high permeability. The central to southern region of the study area exhibits ‘moderate’ groundwater-potential zones, which are suitable for agricultural practices. The infiltration capacity of the northwestern region is low due to high runoff, and these zones are associated with ‘poor’ and ‘very poor’ groundwater-potential zones where suitable groundwater recharge structures should be constructed to augment the groundwater resources. The results are validated with the existing groundwater level in the study area, and it is identified that a good correlation exists between the groundwater-potential map and observation bore wells data. The results will serve as guidelines for drilling new boreholes and supports in assigning input parameters to groundwater modeling studies. The output of this research work will serve as guidelines for planning the artificial recharge structures such as check dams, percolation ponds, and recharge shafts in the study area’s sustainable utilization of groundwater resources.
Author Contributions
Conceptualization, M.S., A.A.C., H.M. and U.S.M.; methodology, M.S., U.S.M., S.D.G., M.A. and P.S.; software, J.P.; validation, A.A.C., S.D.G. and M.A.; data analysis, S.S., U.R.; formal analysis, A.A.C., J.P., S.S., A.K.S. and H.M.; investigation, U.S.M., U.R. and B.K.; resources, M.S. and J.P.; data curation, A.K.S. and M.S.; writing—original draft preparation, M.S. and U.S.M.; writing—review and editing, P.S., A.A.C. and U.R.; supervision, M.S.; project administration, B.K. and H.M. All authors have read and agreed to the published version of the manuscript.
Funding
This research received no external funding.
Institutional Review Board Statement
Not applicable.
Informed Consent Statement
Not applicable.
Data Availability Statement
Data available upon written request to mahenthiran.s@vit.ac.in.
Conflicts of Interest
The authors declare no conflict of interest.
References
- Chowdhury, M.; Paul, P.K. Quantification of groundwater resource of Kandi subdivision of Murshidabad district, West Bengal. Environ. Dev. Sustain. 2020, 22, 5849–5871. [Google Scholar] [CrossRef]
- Mukherjee, S. Targeting saline aquifer by remote sensing and geophysical methods in a part of Hamirpur-Kanpur, India. Hydrogeol. J. 1996, 19, e64. [Google Scholar]
- Kanagaraj, G.; Suganthi, S.; Elango, L.; Magesh, N.S. Assessment of groundwater potential zones in Vellore district, Tamil Nadu, India using geospatial techniques. Earth Sci. Inform. 2019, 12, 211–223. [Google Scholar] [CrossRef]
- Pande, C.B.; Moharir, K.N.; Singh, S.K.; Varade, A.M. An integrated approach to delineate the groundwater potential zones in Devdari watershed area of Akola district, Maharashtra, Central India. Environ. Dev. Sustain. 2020, 22, 4867–4887. [Google Scholar] [CrossRef]
- Rodell, M.; Velicogna, I.; Famiglietti, J.S. Satellite-based estimates of groundwater depletion in India. Nature 2009, 460, 999–1002. [Google Scholar] [CrossRef]
- Velis, M.; Conti, K.I.; Biermann, F. Groundwater and human development: Synergies and trade-offs within the context of the sustainable development goals. Sustain. Sci. 2017, 12, 1007–1017. [Google Scholar] [CrossRef] [PubMed]
- Mall, R.K.; Gupta, A.; Singh, R.; Singh, R.S.; Rathore, L.S. Water resources and climate change: An Indian perspective. Curr. Sci. 2006, 90, 1610–1626. [Google Scholar]
- Siebert, S.; Burke, J.; Faures, J.M.; Frenken, K.; Hoogeveen, J.; Döll, P.; Portmann, F.T. Groundwater use for irrigation—A global inventory. Hydrol. Earth Syst. Sci. 2010, 14, 1863–1880. [Google Scholar] [CrossRef]
- Asoka, A.; Gleeson, T.; Wada, Y.; Mishra, V. Relative contribution of monsoon precipitation and pumping to changes in groundwater storage in India. Nat. Geosci. 2017, 10, 109–117. [Google Scholar] [CrossRef]
- Das, B.; Pal, S.C. Assessment of groundwater recharge and its potential zone identification in groundwater-stressed Goghat-I block of Hugli District, West Bengal, India. Environ. Dev. Sustain. 2020, 22, 5905–5923. [Google Scholar] [CrossRef]
- Saba, U.S.; Umar, R. Identification of the processes controlling groundwater quality in shallow aquifers of Moradabad city, west Uttar Pradesh, India. Environ. Dev. Sustain. 2021, 23, 12994–13015. [Google Scholar] [CrossRef]
- Boughariou, E.; Allouche, N.; Ben Brahim, F.; Nasri, G.; Bouri, S. Delineation of groundwater potentials of Sfax region, Tunisia, using fuzzy analytical hierarchy process, frequency ratio, and weights of evidence models. Environ. Dev. Sustain. 2021, 23, 14749–14774. [Google Scholar] [CrossRef]
- Ahmadi, S.H.; Sedghamiz, A. Geostatistical Analysis of Spatial and Temporal Variations of Groundwater Level. Environ. Monit. Assess. 2007, 129, 277–294. [Google Scholar] [CrossRef]
- Kanoua, W.; Merkel, B.J. Groundwater recharge in Titas Upazila in Bangladesh. Arab. J. Geosci. 2015, 8, 1361–1371. [Google Scholar] [CrossRef]
- Rashid, M.; Lone, M.A.; Ahmed, S. Integrating geospatial and ground geophysical information as guidelines for groundwater potential zones in hard rock terrains of south India. Environ. Monit. Assess. 2012, 184, 4829–4839. [Google Scholar] [CrossRef] [PubMed]
- Rao, G.T.; Rao, V.V.S.; Padalu, G.; Dhakate, R.; Sarma, V.S. Application of electrical resistivity tomography methods for delineation of groundwater contamination and potential zones. Arab. J. Geosci. 2014, 7, 1373–1384. [Google Scholar] [CrossRef]
- Nugraha, G.U.; Nur, A.A.; Pranantya, P.A.; Lubis, R.F.; Bakti, H. Analysis of groundwater potential zones using Dar-Zarrouk parameters in Pangkalpinang city, Indonesia. Environ. Dev. Sustain. 2002, 25, 1–23. [Google Scholar] [CrossRef]
- Masoud, M.H.Z.; Basahi, J.M.; Zaidi, F.K. Assessment of artificial groundwater recharge potential through estimation of permeability values from infiltration and aquifer tests in unconsolidated alluvial formations in coastal areas. Environ. Monit. Assess. 2019, 191, 1–16. [Google Scholar] [CrossRef] [PubMed]
- Bhuiyan, C. Application of different aquifer parameters for groundwater potential evaluation—Implications for resources development. Arab. J. Geosci. 2020, 13, 752. [Google Scholar] [CrossRef]
- Maity, D.K.; Mandal, S. Identification of groundwater potential zones of the Kumari river basin, India: An RS & GIS based semi-quantitative approach. Environ. Dev. Sustain. 2019, 21, 1013–1034. [Google Scholar]
- Surinaidu, L.; Rahman, A.; Ahmed, S. Distributed groundwater recharge potentials assessment based on GIS model and its dynamics in the crystalline rocks of South India. Sci. Rep. 2021, 11, 1–16. [Google Scholar]
- Magesh, N.S.; Chandrasekar, N.; Soundranayagam, J.P. Morphometric evaluation of Papanasam and Manimuthar watersheds, parts of Western Ghats, Tirunelveli district, Tamil Nadu, India: A GIS approach. Environ. Earth Sci. 2011, 64, 373–381. [Google Scholar] [CrossRef]
- Jaafarzadeh, M.S.; Tahmasebipour, N.; Haghizadeh, A.; Pourghasemi, H.R.; Rouhani, H. Groundwater recharge potential zonation using an ensemble of machine learning and bivariate statistical models. Sci. Rep. 2021, 11, 5587. [Google Scholar] [CrossRef] [PubMed]
- Sahani, N. Application of analytical hierarchy process and GIS for ecotourism potentiality mapping in Kullu District, Himachal Pradesh, India. Environ. Dev. Sustain. 2020, 22, 6187–6211. [Google Scholar] [CrossRef]
- Hinton, J.C. GIS and remote sensing integration for environmental applications. Int. J. Geogr. Inf. Syst. 1996, 10, 877–890. [Google Scholar] [CrossRef]
- Jha, M.K.; Chowdhury, A.; Chowdary, V.M.; Peiffer, S. Groundwater management and development by integrated remote sensing and geographic information systems: Prospects and constraints. Water Resour. Manag. 2007, 21, 427–467. [Google Scholar] [CrossRef]
- Gnanachandrasamy, G.; Zhou, Y.; Bagyaraj, M.; Venkatramanan, S.; Ramkumar, T.; Wang, S. Remote Sensing and GIS Based Groundwater Potential Zone Mapping in Ariyalur District, Tamil Nadu. J. Geol. Soc. India 2018, 92, 484–490. [Google Scholar] [CrossRef]
- Arulbalaji, P.; Padmalal, D.; Sreelash, K. GIS and AHP Techniques Based Delineation of Groundwater Potential Zones: A case study from Southern Western Ghats, India. Sci. Rep. 2019, 9, 2082. [Google Scholar] [CrossRef]
- Ayyandurai, R.; Venkateswaran, S.; Karunanidhi, D. Hydrogeochemical assessment of groundwater quality and suitability for irrigation in the coastal part of Cuddalore district, Tamil Nadu, India. Mar. Pollut. Bull. 2022, 174, 113258. [Google Scholar] [CrossRef]
- Chockalingam, K.; Mohan, R.; Palusamy, A. Hydro geochemical study of groundwater in eastern part of Vellar River, Chidambaram Taluk, Cuddalore District, Tamil Nadu. Arab. J. Geosci. 2021, 14, 1128. [Google Scholar] [CrossRef]
- Sajil Kumar, P.J.; Jose, A.; James, E.J. Spatial and Seasonal Variation in Groundwater Quality in Parts of Cuddalore District, South India. Natl. Acad. Sci. Lett. 2013, 36, 167–179. [Google Scholar] [CrossRef]
- Chidambaram, S.; Sarathidasan, J.; Srinivasamoorthy, K.; Thivya, C.; Thilagavathi, R.; Prasanna, M.V.; Singaraja, C.; Nepolian, M. Assessment of hydrogeochemical status of groundwater in a coastal region of Southeast coast of India. Appl. Water Sci. 2018, 8, 27. [Google Scholar] [CrossRef]
- Kumar, X.R.A.; Giridharan, L.; Shyamala, J.; Velmurugan, P.; Jayaprakash, M. Urbanisation impact of groundwater quality in Cuddalore District, East Coast of India. J. Environ. Chem. Ecotoxicol. 2013, 5, 63–73. [Google Scholar]
- Srinivasamoorthy, K.; Vasanthavigar, M.; Vijayaraghavan, K.; Sarathidasan, R.; Gopinath, S. Hydrochemistry of groundwater in a coastal region of Cuddalore district, Tamilnadu, India: Implication for quality assessment. Arab. J. Geosci. 2013, 6, 441–454. [Google Scholar] [CrossRef]
- Jeevanandam, M.; Nagarajan, R.; Manikandan, M.; Senthilkumar, M.; Srinivasalu, S.; Prasanna, M.V. Hydrogeochemistry and microbial contamination of groundwater from Lower Ponnaiyar Basin, Cuddalore District, Tamil Nadu, India. Environ. Earth Sci. 2012, 67, 867–887. [Google Scholar] [CrossRef]
- Srinivasamoorthy, K.; Vasanthavigar, M.; Chidambaram, S.; Anandhan, P.; Sarma, V.S. Characterisation of groundwater chemistry in an eastern coastal area of Cuddalore district, Tamil Nadu. J. Geol. Soc. India 2011, 78, 549–558. [Google Scholar] [CrossRef]
- Senthilkumar, G.; Ramanathan, A.L.; Nainwal, H.C.; Chidambaram, S. Evaluation of the hydro geochemistry of groundwater using factor analysis in the Cuddalore coastal region, Tamil Nadu, India. Int. J. Mol. Sci. 2008, 37, 181–185. [Google Scholar]
- Jeevanandam, M.; Kannan, R.; Srinivasalu, S.; Rammohan, V. Hydrogeochemistry and Groundwater Quality Assessment of Lower Part of the Ponnaiyar River Basin, Cuddalore District, South India. Environ. Monit. Assess. 2007, 132, 263–274. [Google Scholar] [CrossRef]
- Chawla, D.; Jacob, N.; Mohokar, H.V. Identification of groundwater discharge in Cuddalore coast, Tamil Nadu using radium isotopes. J. Radioanal. Nucl. Chem. 2014, 300, 29–32. [Google Scholar] [CrossRef]
- Sonkamble, S. Electrical resistivity and hydrochemical indicators distinguishing chemical characteristics of subsurface pollution at Cuddalore coast, Tamil Nadu. J. Geol. Soc. India 2014, 83, 535–548. [Google Scholar] [CrossRef]
- Senthilkumar, G.; Ramanathan, A.L.; Nainwal, H.C.; Chidambarm, S. Hydrogeophysical investigation of groundwater in Cuddalore coastal area, Tamilnadu, India. Geosciences 2012, 2, 133–139. [Google Scholar]
- Ayyandurai, R.; Venkateswaran, S. Appraisal of groundwater potential zonation mapping in coastal track of Cuddalore district using geospatial techniques in Tamil Nadu India. Indian J. Ecol. 2021, 48, 1011–1018. [Google Scholar]
- Dinagaran, V. District Groundwater Brochure Cuddalore District, Tamil Nadu Government of India Ministry of Water Resources Central Ground Water Board South Eastern Coastal Region Chennai. Tech. Rep. Ser. 2009. [Google Scholar]
- Prasanna, M.V.; Chidambaram, S.; Senthil Kumar, G.; Ramanathan, A.L.; Nainwal, H.C. Hydrogeochemical assessment of groundwater in Neyveli Basin, Cuddalore District, South India. Arab. J. Geosci. 2011, 4, 319–330. [Google Scholar] [CrossRef]
- Anbarasu, S.; Brindha, K.; Elango, L. Multi-influencing factor method for delineation of groundwater potential zones using remote sensing and GIS techniques in the western part of Perambalur district, southern India. Earth Sci. Inform. 2020, 13, 317–332. [Google Scholar] [CrossRef]
- Kumar, V.A.; Mondal, N.C.; Ahmed, S. Identification of Groundwater Potential Zones Using RS, GIS and AHP Techniques: A Case Study in a Part of Deccan Volcanic Province (DVP), Maharashtra, India. J. Indian Soc. Remote Sens. 2020, 48, 497–511. [Google Scholar] [CrossRef]
- Saravanan, S.; Saranya, T.; Abijith, D.; Jacinth, J.J.; Singh, L. Delineation of groundwater potential zones for Arkavathi sub-watershed, Karnataka, India using remote sensing and GIS. Environ. Challenges 2021, 5, 100380. [Google Scholar] [CrossRef]
- Kumar, M.; Singh, P.; Singh, P. Integrating GIS and remote sensing for delineation of groundwater potential zones in Bundelkhand Region, India. Egypt. J. Remote Sens. Space Sci. 2022, 25, 387–404. [Google Scholar] [CrossRef]
- Dar, T.; Rai, N.; Bhat, A. Delineation of potential groundwater recharge zones using analytical hierarchy process (AHP). Geol. Ecol. Landsc. 2021, 5, 292–307. [Google Scholar] [CrossRef]
- Saaty, T.L. The Analytic Hierarchy Process; McGraw-Hill: New York, NY, USA, 1980. [Google Scholar]
- Rajasekhar, M.; Raju, G.S.; Sreenivasulu, Y.; Raju, R.S. Delineation of groundwater potential zones in semi-arid region of Jilledubanderu river basin, Anantapur District, Andhra Pradesh, India using fuzzy logic, AHP and integrated fuzzy-AHP approaches. Hydroresearch 2019, 2, 97–108. [Google Scholar] [CrossRef]
- Mohammadi-Behzad, H.R.; Charchi, A.; Kalantari, N.; Nejad, A.M.; Vardanjani, H.K. Delineation of groundwater potential zones using remote sensing (RS), geographical information system (GIS) and analytic hierarchy process (AHP) techniques: A case study in the Leylia–Keynow watershed, southwest of Iran. Carbonates Evaporites 2019, 34, 1307–1319. [Google Scholar] [CrossRef]
- Al-Djazouli, M.O.; Elmorabiti, K.; Rahimi, A.; Amellah, O.; Fadil, O.A.M. Delineating of groundwater potential zones based on remote sensing, GIS and analytical hierarchical process: A case of Waddai, eastern Chad. Geojournal 2021, 86, 1881–1894. [Google Scholar] [CrossRef]
- Karanth, K.R. Ground Water Assessment: Development and Management; Tata McGraw-Hill Education: New York, NY, USA, 1987. [Google Scholar]
- Machiwal, D.; Jha, M.K.; Mal, B.C. Assessment of Groundwater Potential in a Semi-Arid Region of India Using Remote Sensing, GIS and MCDM Techniques. Water Resour. Manag. 2011, 25, 1359–1386. [Google Scholar] [CrossRef]
- Saranya, T.; Saravanan, S. Groundwater potential zone mapping using analytical hierarchy process (AHP) and GIS for Kancheepuram District, Tamilnadu, India. Model. Earth Syst. Environ. 2020, 6, 1105–1122. [Google Scholar] [CrossRef]
- Arunbose, S.; Srinivas, Y.; Rajkumar, S.; Nair, N.C.; Kaliraj, S. Remote sensing, GIS and AHP techniques based investigation of groundwater potential zones in the Karumeniyar river basin, Tamil Nadu, southern India. Groundw. Sustain. Dev. 2021, 14, 100586. [Google Scholar] [CrossRef]
- Rajesh, J.; Pande, C.B.; Kadam, S.A.; Gorantiwar, S.D.; Shinde, M.G. Exploration of groundwater potential zones using analytical hierarchical process (AHP) approach in the Godavari river basin of Maharashtra in India. Appl. Water Sci. 2021, 11, 182. [Google Scholar] [CrossRef]
- Ibrahim-Bathis, K.; Ahmed, S.A. Geospatial technology for delineating groundwater potential zones in Doddahalla watershed of Chitradurga district, India. Egypt. J. Remote Sens. Space Sci. 2016, 19, 223–234. [Google Scholar] [CrossRef]
- Bhadran, A.; Girishbai, D.; Jesiya, N.; Gopinath, G.; Krishnan, R.G.; Vijesh, V. A GIS based Fuzzy-AHP for delineating groundwater potential zones in tropical river basin, southern part of India. Geosyst. Geoenviron. 2022, 1, 100093. [Google Scholar] [CrossRef]
- Raju, R.S.; Raju, G.S.; Rajasekhar, M. Identification of groundwater potential zones in Mandavi River basin, Andhra Pradesh, India using remote sensing, GIS and MIF techniques. Hydroresearch 2019, 2, 1–11. [Google Scholar] [CrossRef]
- Golla, V.; Etikala, B.; Veeranjaneyulu, A.; Subbarao, M.; Surekha, A.; Narasimhlu, K. Data sets on delineation of groundwater potential zones identified by geospatial tool in Gudur area, Nellore district, Andhra Pradesh, India. Data Brief 2018, 20, 1984–1991. [Google Scholar] [CrossRef]
- Hussein, A.-A.; Govindu, V.; Nigusse, A.G.M. Evaluation of groundwater potential using geospatial techniques. Appl. Water Sci. 2017, 7, 2447–2461. [Google Scholar] [CrossRef]
- Ghasemizadeh, R.; Hellweger, F.; Butscher, C.; Padilla, I.; Vesper, D.; Field, M.; Alshawabkeh, A. Groundwater flow and transport modeling of karst aquifers, with particular reference to the North Coast Limestone aquifer system of Puerto Rico. Hydrogeol. J. 2012, 20, 1441–1461. [Google Scholar] [CrossRef] [PubMed]
- Senapati, U.; Das, T.K. GIS-based comparative assessment of groundwater potential zone using MIF and AHP techniques in Cooch Behar district, West Bengal. Appl. Water Sci. 2022, 12, 43. [Google Scholar] [CrossRef]
- Sener, E.; Davraz, A. Assessment of groundwater vulnerability based on a modified DRASTIC model, GIS and an analytic hierarchy process (AHP) method: The case of Egirdir Lake basin (Isparta, Turkey). Hydrogeol. J. 2013, 21, 701–714. [Google Scholar] [CrossRef]
- Doke, A.B.; Zolekar, R.B.; Patel, H.; Das, S. Geospatial mapping of groundwater potential zones using multi-criteria decision-making AHP approach in a hardrock basaltic terrain in India. Ecol. Indic. 2021, 127, 107685. [Google Scholar] [CrossRef]
- Muniraj, K.; Jesudhas, C.J.; Chinnasamy, A. Delineating the Groundwater Potential Zone in Tirunelveli Taluk, South Tamil Nadu, India, Using Remote Sensing, Geographical Information System (GIS) and Analytic Hierarchy Process (AHP) Techniques. Proc. Natl. Acad. Sci. India Sect. A Phys. Sci. 2020, 90, 661–676. [Google Scholar] [CrossRef]
- Kaliraj, S.; Chandrasekar, N.; Magesh, N.S. Identification of potential groundwater recharge zones in Vaigai upper basin, Tamil Nadu, using GIS-based analytical hierarchical process (AHP) technique. Arab. J. Geosci. 2014, 7, 1385–1401. [Google Scholar] [CrossRef]
- Singh, P.; Gupta, A.; Singh, M. Hydrological inferences from watershed analysis for water resource management using remote sensing and GIS techniques. Egypt. J. Remote Sens. Space Sci. 2014, 17, 111–121. [Google Scholar] [CrossRef]
- Krishnamurthy, J.; Mani, A.; Jayaraman, V.; Manivel, M. Groundwater resources development in hard rock terrain—An approach using remote sensing and GIS techniques. Int. J. Appl. Earth Obs. Geoinf. 2000, 2, 204–215. [Google Scholar] [CrossRef]
- Shailaja, G.; Kadam, A.K.; Gupta, G.; Umrikar, B.N.; Pawar, N.J. Integrated geophysical, geospatial and multiple-criteria decision analysis techniques for delineation of groundwater potential zones in a semi-arid hard-rock aquifer in Maharashtra, India. Hydrogeol. J. 2019, 27, 639–654. [Google Scholar] [CrossRef]
- Venkateswaran, S.; Deepa, S. Assessment of Groundwater Quality using GIS Techniques in Vaniyar Watershed, Ponnaiyar River, Tamil Nadu. Aquat. Procedia 2015, 4, 1283–1290. [Google Scholar] [CrossRef]
- Das, S. Comparison among influencing factor, frequency ratio, and analytical hierarchy process techniques for groundwater potential zonation in Vaitarna basin, Maharashtra, India. Groundw. Sustain. Dev. 2019, 8, 617–629. [Google Scholar] [CrossRef]
- Abuzied, S.M.; Yuan, M.; Ibrahim, S.K.; Kaiser, M.F.; Seleem, T.A. Delineation of Groundwater Potential Zones in Nuweiba Area (Egypt) Using Remote Sensing and GIS Techniques. Int. J. Signal Process. Syst. 2016, 4, 109–117. [Google Scholar] [CrossRef]
- Agarwal, E.; Agarwal, R.; Garg, R.D.; Garg, P.K. Delineation of groundwater potential zone: An AHP/ANP approach. J. Earth Syst. Sci. 2013, 122, 887–898. [Google Scholar] [CrossRef]
- Sridhar, N.; Poongothai, S. Delineation of Groundwater Potential Zones in Lower Ponnaiyar Rural Watershed, Cuddalore District, Tamilnadu, India. Int. J. Civ. Eng. 2017, 6, 15–26. [Google Scholar]
- Gupta, D.; Yadav, S.; Tyagi, D.; Tomar, L. Multi-criteria decision analysis for identifying of groundwater potential sites in Haridwar, India. Eng. J. Appl. Scopes 2018, 3, 9–15. [Google Scholar]
- Raj, S.; Rawat, K.S.; Singh, S.K.; Mishra, A.K. Groundwater potential zones identification and validation in Peninsular India. Geol. Ecol. Landsc. 2022, 1–15. [Google Scholar] [CrossRef]
- Patra, S.; Mishra, P.; Mahapatra, S.C. Delineation of groundwater potential zone for sustainable development: A case study from Ganga Alluvial Plain covering Hooghly district of India using remote sensing, geographic information system and analytic hierarchy process. J. Clean. Prod. 2018, 172, 2485–2502. [Google Scholar] [CrossRef]
- Jensen, J.R. Introductory Digital Image Processing: A Remote Sensing Perspective; University of South Carolina: Columbus, OH, USA, 1986. [Google Scholar]
- Usman, M.; Liedl, R.; Shahid, M.A.; Abbas, A. Land use/land cover classification and its change detection using multi-temporal MODIS NDVI data. J. Geogr. Sci. 2015, 25, 1479–1506. [Google Scholar] [CrossRef]


Disclaimer/Publisher’s Note: The statements, opinions and data contained in all publications are solely those of the individual author(s) and contributor(s) and not of MDPI and/or the editor(s). MDPI and/or the editor(s) disclaim responsibility for any injury to people or property resulting from any ideas, methods, instructions or products referred to in the content. |
© 2023 by the authors. Licensee MDPI, Basel, Switzerland. This article is an open access article distributed under the terms and conditions of the Creative Commons Attribution (CC BY) license (https://creativecommons.org/licenses/by/4.0/).