Article

Analyzing the Effects of Governmental Policy and Solar Power on Facilitating Carbon Neutralization in the Context of Energy Transition: A Four-Party Evolutionary Game Study

School of Energy and Power Engineering, Northeast Electric Power University, Jilin 132012, China
*
Author to whom correspondence should be addressed.
Sustainability 2023, 15(6), 5388; https://doi.org/10.3390/su15065388
Submission received: 17 February 2023 / Revised: 15 March 2023 / Accepted: 16 March 2023 / Published: 17 March 2023
(This article belongs to the Special Issue Critical Issues in Solar Power Generation Technology)

Abstract

:
For achieving carbon neutralization and promoting the coordinated development of solar and coal-fired power generations in the context of energy transition, this paper develops a public–private partnership project including the government, carbon exchange enterprise, solar thermal power plant and a coal-fired thermal power plant. Using the four-party evolutionary game theory method, the evolutionary stable strategies are evaluated. The influence estimate results of key factors show that a higher carbon emission penalty and a green electricity subsidy as well as a lower carbon trading tax rate will be beneficial to the carbon trading market, as well as facilitate carbon neutralization. In most instances, the government and carbon exchange enterprise can hold acceptable participating intention. For relatively suitable reference value ranges, the carbon emission quota sale price range of the solar thermal power plant sold to the carbon exchange enterprise is 5.5~6.0 USD/t, that of the carbon exchange enterprise sold to the coal-fired thermal power plant is 5.0~6.5 USD/t, that of the solar thermal power plant sold to the coal-fired thermal power plant is 5.0~5.5 USD/t, that sold to the coal-fired thermal power plant by outside organizations is 9.0~10.5 USD/t, and the carbon trading tax rate range is 6.0~6.2%.

1. Introduction

The large consumption of fossil energies has led to massive carbon emissions [1]. According to the report published by BP in 2021, the global total carbon dioxide emissions was approximately 56.93 Mt [2]. In the issue of carbon emissions, coal-fired thermal power plants play an important role. How to continuously reduce carbon emissions while maintaining the economic growth has become a serious issue which must be considered. Some technologies have been proposed and developed for reducing carbon emissions, such as carbon capture and storage (CCS) [3,4,5] and carbon capture and utilization (CCU) [6]. Many countries (e.g., those in the European Union [7], US [8], China [9,10,11]) have carried out extensive discussions and cooperation initiatives to resolve the carbon emission problem.
China is now the largest energy consumer in the world and a major carbon dioxide emitter [12]. Figure 1 illustrates the total carbon dioxide emissions of China from 2009 to 2021 [2]. For reducing the carbon emissions, China has adopted a series of measures and issued a series of policy documents. In 2017, the carbon emission trading market started. In 2021, the “Measures for the Management of Carbon Emissions Trading (Trial)” began to be implemented. The construction of the carbon trading market is constantly improved by the Chinese government so that high-quality economic development can be promoted. Recently, China has announced its efforts to achieve carbon neutralization by 2060.
The evolutionary game theory (EGT) is a multi-disciplinary integration theory which has been well-developed and widely employed in various research fields. Many researchers have carried out studies on the issues of reducing carbon emissions and carbon trading using different EGT methods [13,14,15,16]. Xu et al. [17] developed a new method integrating an evolutionary mechanism and improved particle swarm optimization (IPSO) to solve construction supply planning problems and found that if the new method could be widely and well used, the carbon emissions from China’s construction industry may be reduced to a certain degree. Considering the market regulated by a trading system with lower price limits and based on the EGT, Antoci et al. [18] conducted a tripartite EGT study on non-polluting, pollution-compliant and non-polluting companies. They found that under certain conditions, the three types of companies can achieve a balanced coexistence. Zhao and Liu [19] studied the carbon capture and storage issue from the micro level based on an evolutionary game model comprising the government and enterprises, which was a two-party EGT research. Shi et al. [20] used the two-party EGT method to study the dilemma behavior of low-carbon technology diffusion systems for companies. Rocha and Salomão [21] analyzed the interaction between the corporate environmental compliance promoted by decision makers and enforcement by employing the two-party EGT method. Some other typical studies can be seen in the relevant literature [22,23,24,25,26,27].
Solar energy is a type of typical new energy resource which can reduce carbon emissions effectively [28,29,30,31]. Solar energy utilizations lead to no emissions of harmful gases and dust, and are thus valued by many researchers. Solar energy resources can be used in many application fields, for instance, heat storage [32,33,34], thermal power generation [35,36], photovoltaic electricity production [37,38], hybrid photovoltaic-thermal utilization [39,40,41], freshwater production [42,43,44,45], multi-energy complementary utilization [46,47,48,49] and hydrogen production [50,51,52].
It can be observed from the above literature review that carbon trading is an effective method for achieving the energy structure transformation, and most EGT-based studies on carbon trading employ the two-party or tripartite evolutionary game model. However, in the real world, the carbon trading issue is affected by many different aspects. A carbon trading study based on more participators will be more meaningful and have more reference value. However, as far as the authors know, no carbon trading study based on the EGT model comprising more than three participators has been conducted and reported. This is an important research gap in the EGT-based study field of energy application and development.
In contrast with previous research works, the main innovation and contribution of this study is that a novel four-party EGT-based study on carbon trading among the carbon exchange enterprise (CEE), solar thermal power plant (STPP) and coal-fired thermal power plant (CTPP) under the background of government control is carried out. For the first time, the four-party evolutionary game model including the government (GOVT), CEE, STPP and CTPP is developed and used to analyze the carbon trading issue. That will provide a significant contribution for enriching the basis theory system of EGT modeling.
In addition, in this study, the effects of some key factors on the cooperation intention of the four participators are investigated. Moreover, the future developments of STPPs and CTPPs under the background of a government control carbon trading market are forecasted, and suggested methods and policies to facilitate the developments of STPPs and CTPPs in the context of energy transition are provided. The analysis results of this study also have certain practical reference value for facilitating actual carbon trading projects.

2. Modeling Method

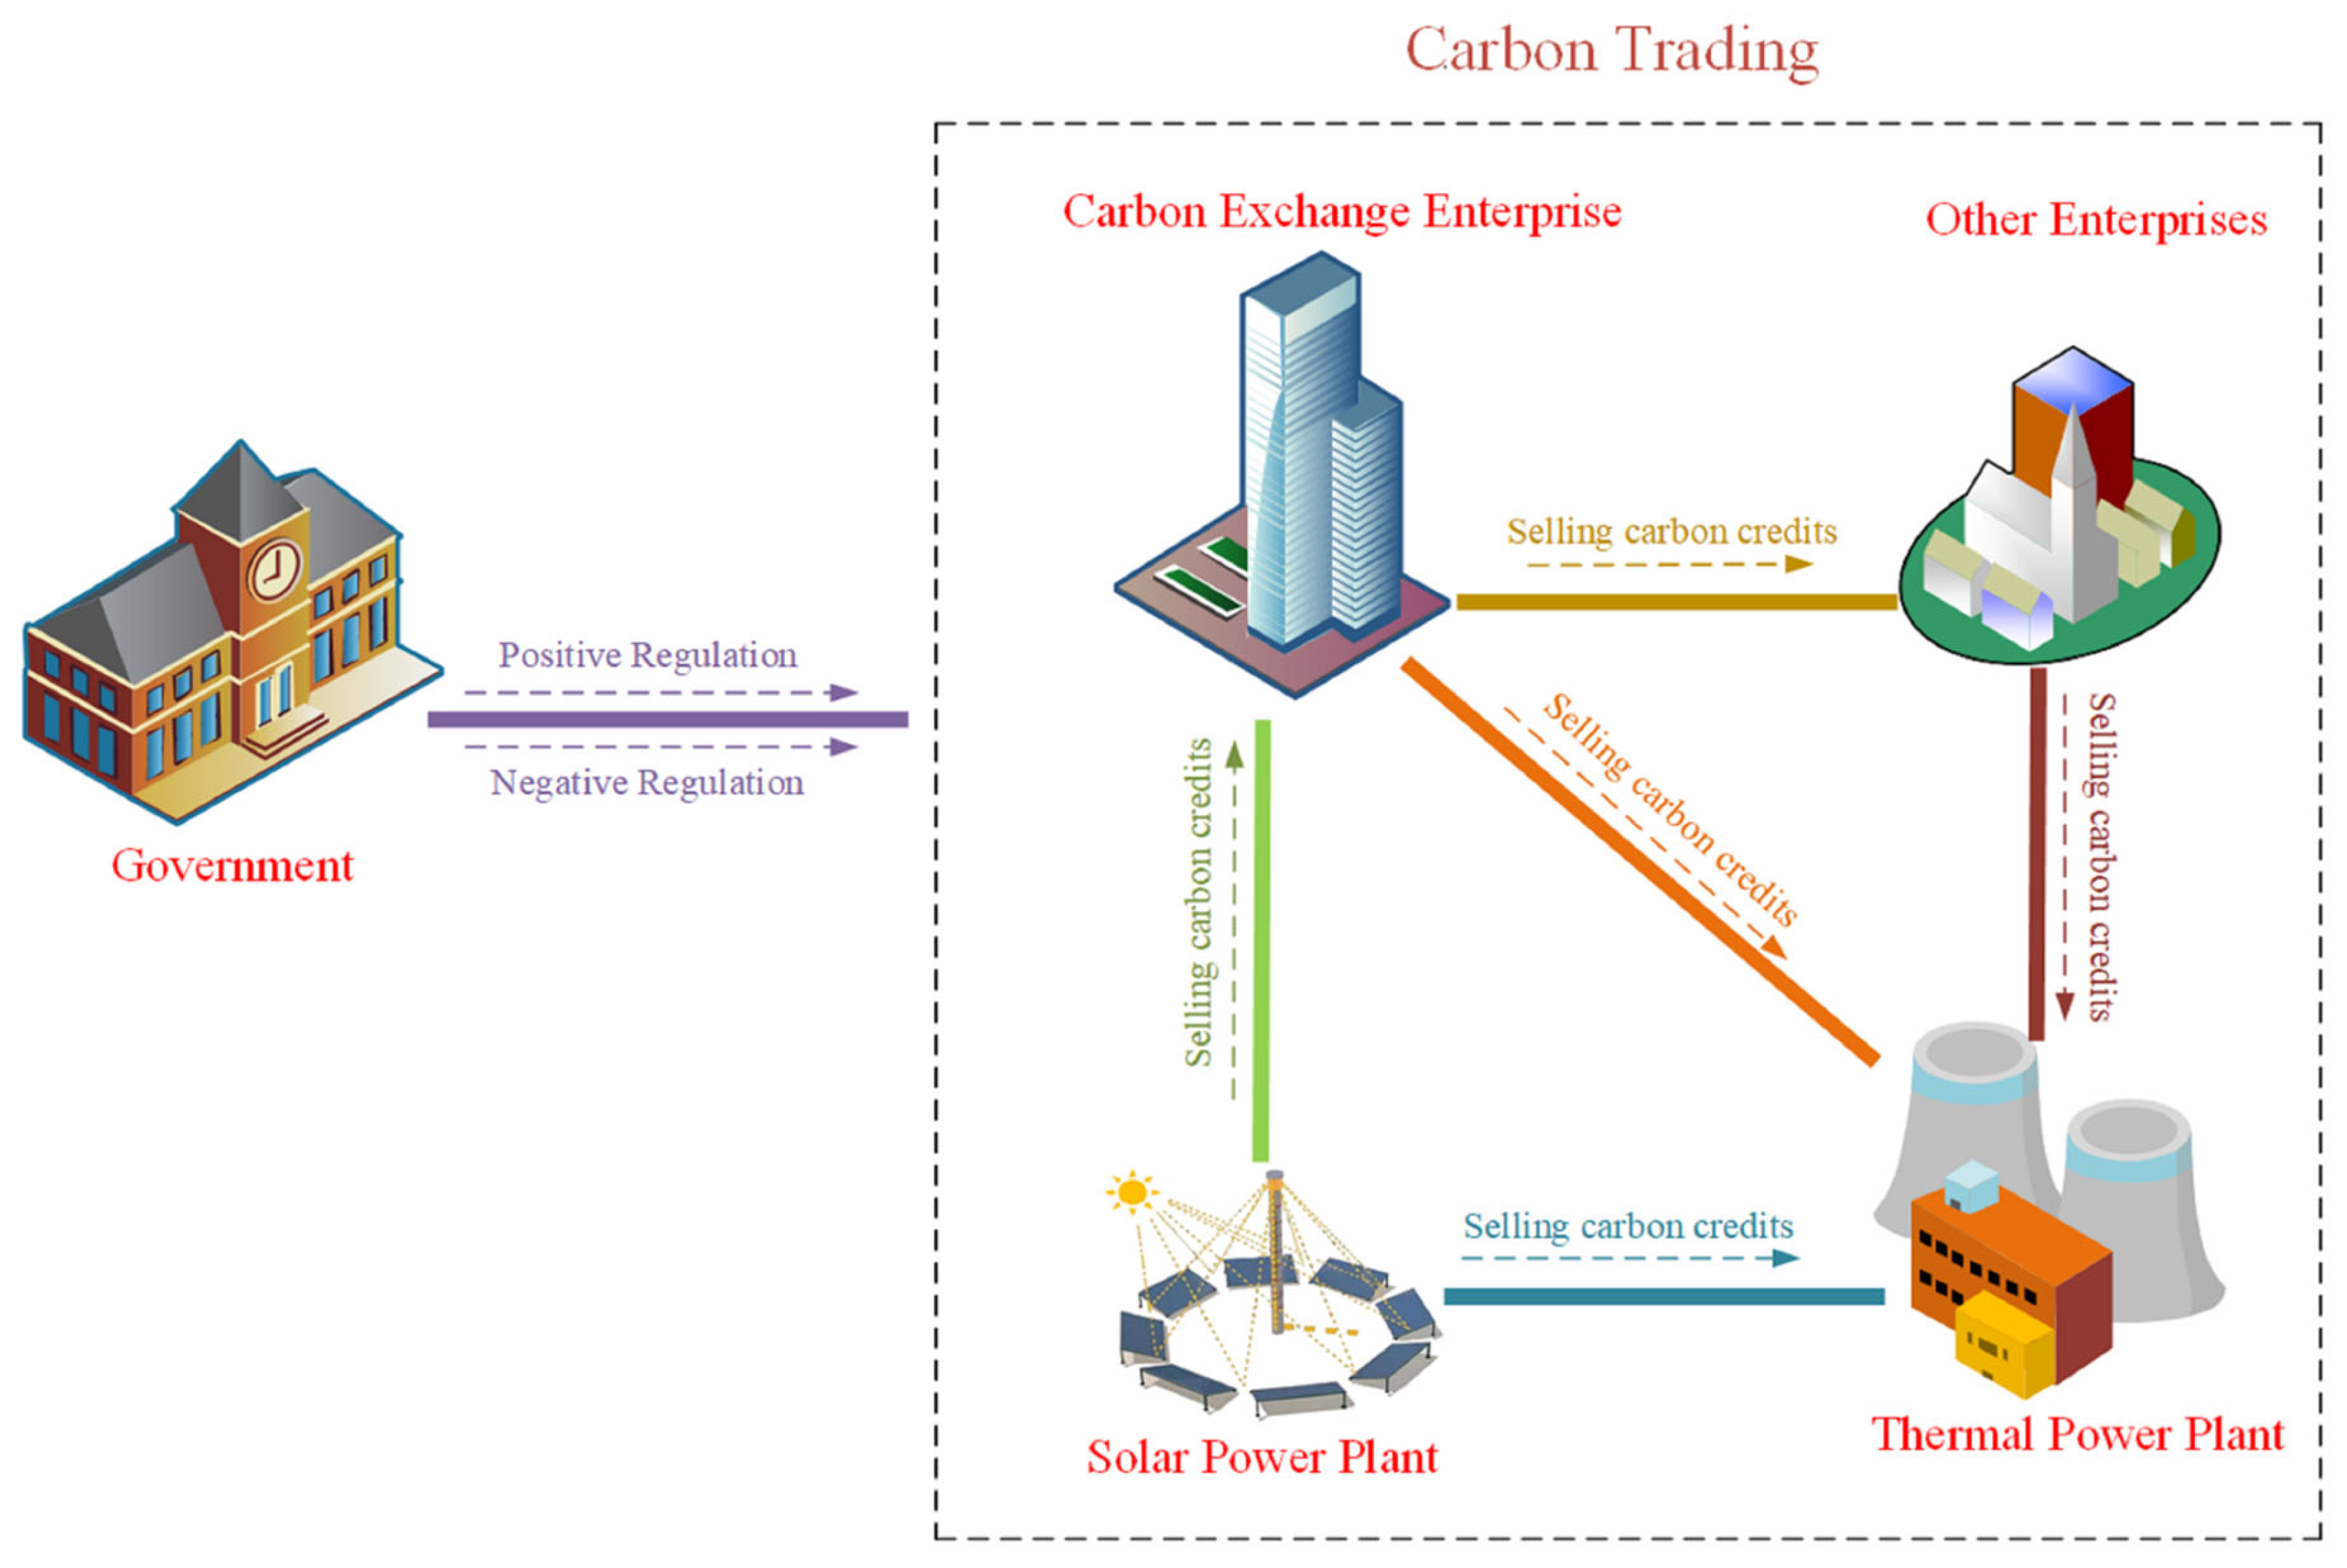
2.1. Problem Introduction

In the current study, the public–private partnership (PPP) project [53,54] focuses on the energy structure transformation as well as the achievement of China’s carbon neutralization target. It aims at enhancing the effect of solar power in the energy structure transformation and promoting the coordinated development of solar power and coal-fired electricity production. There are four participators in the current public–private partnership project, including the government, CEE, STPP and CTPP. It is assumed that the STPP and CTPP are the private participators, and the government and CEE are the public ones.
Figure 2 illustrates the problem model, which includes the government, CEE, STPP and CTPP. This model only considers the benefits and expenditures related to carbon emissions, and the profits generated by selling electricity are not taken into account. When the four participators all select to cooperate, the government will regulate positively, that is, the government will provide the green electricity subsidy to the STPP as well as give the zero carbon emission rewards to the CTPP. The STPP can obtain the subsidy, and sell its carbon emission quota (CEQ) to the CEE. The CEE will buy the CEQ from the STPP, and then sell its CEQ to the CTPP. The CTPP will buy the CEQ from the CEE, and obtains the zero carbon emission rewards. The total CEQ bought by the CTPP should be equal to the total carbon emission quantity of the CTPP. This cooperative relationship is (1, 1, 1) and can be referred to as Case 1.
In general, there are sixteen possible cooperative relationships among the four participators, which are all presented in Table 1. For this public–private partnership project, when the government chooses to cooperate, it will regulate positively. If the government chooses not to cooperate, it will conduct negative regulation, under which both the green electricity subsidy to the STPP and the zero carbon emission rewards to the CTPP will be cancelled. In addition to choosing whether to purchase CEQ from the STPP, the CEE itself holds a certain CEQ.
When the government, CEE and STPP choose to cooperate and the CTPP chooses not to cooperate (i.e., the case of (1, 1, 1, 0)), the CEE will buy the CEQ from the STPP and then sell all its CEQ to the outside organizations (e.g., enterprises which need CEQs). The government will provide the green electricity subsidy to the STPP. As the CTPP selects not to cooperate, it does not buy CEQs from any organization, and will thus be fined by the government.
When the government, CEE and CTPP cooperate and the STPP does not, the cooperative relationship is (1, 1, 0, 1). For this condition, the government will regulate positively. The CEE will sell its CEQ to the CTPP. In addition to buying CEQ from the CEE, the CTPP will also buy some other CEQ from some outside organizations (e.g., enterprises which can provide CEQs) to achieve the carbon neutralization, and the CTPP can thus obtain the zero carbon emission rewards from the government. The STPP will not sell its CEQ; rather, it will only obtain the governmental subsidy.
When the government chooses not to cooperate and the other three participators select to cooperate (i.e., the case of (0, 1, 1, 1)), the government will regulate negatively and will not provide any subsidy or rewards. The STPP will sell its CEQ to the CEE, and then the CEE will sell its all CEQ to the CTPP. Though the CTPP achieves its carbon neutralization, it cannot obtain the zero carbon emission rewards from the government. Moreover, the STPP will also receive no green electricity subsidy.

2.2. Formulas for the EGT Modeling

The four-party EGT method is used in this study for relevant simulations. The EGT was developed by Smith and Price on the basis of the classic game theory [55]. Compared with the classical game theory, the participators, strategies and benefits studied in the EGT have changed, and the assumption of the individual’s complete rationality is not required. It can explain some phenomena in the biologic evolution as well as deal with the economic and management issues in reality successfully [56]. In recent years, relevant researchers have paid more attention to the EGT method, making the EGT one the most popular research topics.
As mentioned above, the EGT model proposed in this study only considers the benefits and expenditures related to carbon emissions, and the profits generated by selling electricity are not taken into account. There are sixteen sets of benefit matrices for the sixteen cooperative relationships. For the cooperative relationship of (1, 1, 1, 1), there is:
a 1 = C 1 i 1 k 1 + ( C 2 + C 1 ) i 2 k 2 + C 1 i 1 k 3 + ( C 1 + C 2 ) i 2 k 4 C 1 g S 1 G a 2 = ( C 1 + C 2 ) i 2 C 1 i 1 ( C 2 + C 1 ) i 2 k 2 C 1 i 1 k 3 a 3 = C 1 i 1 + C 1 g C 1 i 1 k 1 a 4 = G ( C 1 + C 2 ) i 2 ( C 1 + C 2 ) i 2 k 4
where a1, a2, a3 and a4 are the annual carbon trading incomes of the government, CEE, STPP and CTPP. C1 is the original annual CEQ held by the CEE. C2 is the annual CEQ of the STPP due to the green electricity production. i1 is the sale price of CEQ of the STPP sold to the CEE. i2 is the sale price of CEQ of the CEE sold to the CTPP. g is the green power generation subsidy coefficient of the STPP. G is the annual zero carbon emission rewards of the CTPP. k1 is the CEQ sales tax rate of the STPP. k2 and k3 are the CEQ sales tax rate and CEQ purchase tax rate of the CEE, respectively. k4 is the CEQ purchase tax rate of the CTPP. S1 is the annual positive regulation costs of the government.
For the cooperative relationship of (1, 1, 1, 0), there is:
a 1 = C 1 i 1 k 1 + ( C 2 + C 1 ) i 3 k 2 + C 1 i 1 k 3 + C 3 R C 1 g S 1 a 2 = ( C 1 + C 2 ) i 3 ( C 2 + C 1 ) i 3 k 2 C 1 i 1 k 3 C 1 i 1 a 3 = C 1 i 1 + C 1 g C 1 i 1 k 1 a 4 = C 3 R
where C3 is the annual carbon emission quantity of the CTPP. R is the carbon emission penalty coefficient of the CTPP. i3 is the sale price of CEQ of the CEE or STPP sold to other outside organizations.
For Case 3 of (1, 1, 0, 1), there is:
a 1 = C 2 i 2 k 2 + ( C 3 C 2 ) i 5 k 4 C 1 g S 1 G a 2 = C 2 i 2 C 2 i 2 k 2 a 3 = C 1 g a 4 = G C 2 i 2 C 2 i 2 k 4 ( C 3 C 2 ) i 5 ( C 3 C 2 ) i 5 k 4
where i4 is the sale price of CEQ of the STPP sold to the CTPP. i5 is the sale price of CEQ sold to the CTPP by outside organizations.
For the cooperative relationship of (1, 1, 0, 0), there is:
a 1 = C 2 i 3 k 2 + C 3 R C 1 g S 1 a 2 = C 2 i 3 C 2 i 3 k 2 a 3 = C 1 g a 4 = C 3 R
For Case 5 of (1, 0, 1, 1), there is:
a 1 = C 1 i 4 k 1 + C 2 i 3 k 2 + C 1 i 4 k 4 + ( C 3 C 1 ) i 5 k 4 C 1 g S 1 G a 2 = C 2 i 3 C 2 i 3 k 2 a 3 = C 1 i 4 + C 1 g C 1 i 4 k 1 a 4 = G C 1 i 4 ( C 3 C 1 ) i 5 C 1 i 4 k 4 ( C 3 C 1 ) i 5 k 4
For Case 6 of (1, 0, 1, 0), there is:
a 1 = C 1 i 3 k 1 + C 2 i 3 k 2 + C 3 R C 1 g S 1 a 2 = C 2 i 3 C 2 i 3 k 2 a 3 = C 1 i 3 + C 1 g C 1 i 3 k 1 a 4 = C 3 R
For Case 7 of (1, 0, 0, 1), there is:
a 1 = C 2 i 3 k 2 + C 3 i 5 k 4 C 1 g S 1 G a 2 = C 2 i 3 C 2 i 3 k 2 a 3 = C 1 g a 4 = G C 3 i 5 C 3 i 5 k 4
For Case 8 of (1, 0, 0, 0), there is:
a 1 = C 2 i 3 k 2 + C 3 R C 1 g S 1 a 2 = C 2 i 3 C 2 i 3 k 2 a 3 = C 1 g a 4 = C 3 R
For Case 9 of (0, 1, 1, 1), there is:
a 1 = C 1 i 1 k 1 + ( C 2 + C 1 ) i 2 k 2 + C 1 i 1 k 3 + ( C 1 + C 2 ) i 2 k 4 S 2 a 2 = ( C 1 + C 2 ) i 2 C 1 i 1 ( C 2 + C 1 ) i 2 k 2 C 1 i 1 k 3 a 3 = C 1 i 1 C 1 i 1 k 1 a 4 = ( C 1 + C 2 ) i 2 ( C 1 + C 2 ) i 2 k 4
where S2 is the annual negative regulation costs of the government.
For Case 10 of (0, 1, 1, 0), there is:
a 1 = C 1 i 1 k 1 + ( C 2 + C 1 ) i 3 k 2 + C 1 i 1 k 3 + C 3 R S 2 a 2 = ( C 1 + C 2 ) i 3 C 1 i 1 ( C 2 + C 1 ) i 3 k 2 C 1 i 1 k 3 a 3 = C 1 i 1 C 1 i 1 k 1 a 4 = C 3 R
For Case 11 of (0, 1, 0, 1), there is:
a 1 = C 2 i 2 k 2 + C 2 i 2 k 4 + ( C 3 C 2 ) i 5 k 4 S 2 a 2 = C 2 i 2 C 2 i 2 k 2 a 3 = 0 a 4 = C 2 i 2 ( C 3 C 2 ) i 5 C 2 i 2 k 4 ( C 3 C 2 ) i 5 k 4
For Case 12 of (0, 1, 0, 0), there is:
a 1 = C 2 i 3 k 2 + C 3 R S 2 a 2 = C 2 i 3 C 2 i 3 k 2 a 3 = 0 a 4 = C 3 R
For Case 13 of (0, 0, 1, 1), there is:
a 1 = C 1 i 4 k 1 + C 2 i 3 k 2 + C 1 i 4 k 4 + ( C 3 C 1 ) i 5 k 4 S 2 a 2 = C 2 i 3 C 2 i 3 k 2 a 3 = C 1 i 4 C 1 i 4 k 1 a 4 = C 1 i 4 C 1 i 4 k 4 ( C 3 C 1 ) i 5 ( C 3 C 1 ) i 5 k 4
For Case 14 of (0, 0, 1, 0), there is:
a 1 = C 1 i 3 k 1 + C 2 i 3 k 2 + C 3 R S 2 a 2 = C 2 i 3 C 2 i 3 k 2 a 3 = C 1 i 3 C 1 i 3 k 1 a 4 = C 3 R
For Case 15 of (0, 0, 0, 1), there is:
a 1 = C 2 i 3 k 2 + C 3 i 5 k 4 S 2 a 2 = C 2 i 3 C 2 i 3 k 2 a 3 = 0 a 4 = C 3 i 5 C 3 i 5 k 4
For Case 16 of (0, 0, 0, 0), there is:
a 1 = C 2 i 3 k 2 + C 3 R S 2 a 2 = C 2 i 3 C 2 i 3 k 2 a 3 = 0 a 4 = C 3 R
The replicator dynamic formulas (RDFs) of the government, CEE, STPP and CTPP are:
f govt ( x ) = d x d t = x ( 1 x ) C 2 ( i 2 K 4 + i 3 K 2 ) C 1 i 3 K 1 y z w + ( G ) w + ( S 2 C 1 g S 1 ) + C 3 i 5 K 4 + S 2 C 2 ( i 2 K 4 + i 3 K 2 ) y w + ( C 3 R C 3 i 5 K 4 ) z w + ( S 2 C 3 R C 1 i 3 K 1 C 2 i 3 K 2 ) y z
f cee ( y ) = d y d t = y ( 1 y ) C 1 ( 1 K 2 ) ( i 2 i 3 ) x z w + C 1 ( 1 K 2 ) i 3 C 1 i 1 ( 1 K 3 ) z + C 2 ( 1 K 2 ) ( i 2 i 3 ) w + C 2 ( i 3 + i 2 ) ( 1 K 2 ) ( K 2 1 )
f stpp ( z ) = d z d t = z ( 1 z ) C 1 ( K 1 1 ) ( i 4 i 3 ) y w + C 1 ( i 4 i 3 ) ( 1 K 1 ) w + C 1 ( i 1 i 3 ) ( 1 K 1 ) y + C 1 g + C 1 i 3 ( K 1 1 )
f ctpp ( w ) = d w d t = w ( 1 w ) ( K 4 + 1 ) ( C 1 i 4 + C 3 i 5 C 1 i 2 C 2 i 5 ) + ( K 4 1 ) C 1 i 5 y z + C 1 ( 1 + K 4 ) ( i 5 i 4 ) z + C 2 ( i 5 i 2 ) ( 1 + K 4 ) y + C 1 i 3 ( K 1 1 ) C 3 i 5 ( 1 + K 4 ) C 3 R
The RDFs above are derived from the benefit matrices of the sixteen different cases. They are equations for solving the Nash equilibrium.

3. Results and Discussion

3.1. Assumptions and Initial Parameters

China has set its goal of achieving carbon neutralization by 2060. To realize this object, the energy structure transformation will be necessary. Under this background, this paper presents the study on carbon trading of solar thermal power and coal-fired thermal power based on the EGT approach. Therefore, the initial parameters for EGT simulations in this study are determined or calculated according to the relevant policies and current situations of China, which are shown in Table 2.
For the current study, the output electric powers of the STPP and CTPP are both assumed to 300.0 MWe. C3 is calculated according to the output power of the CTPP. It is assumed that i3 is 7.5 USD/t [57], and i1, i2, i4 and i5 are all assumed according to i3. The green electricity subsidy coefficient g for the STPP is assumed to be 30.0 USD/t [58], the carbon emission penalty coefficient R is 10.0 USD/t, and the annual zero carbon emission rewards G is 80,000.0 USD/t [59]. The annual CEQ C1 of the STPP due to the green electricity production is 33.0 t [60], and C3 of the CTPP is 180.0 t [61]. According to the regulations of the State Administration of Taxation of China, there is k1 = k2 = k3 = k4 = K = 6.0% [62].

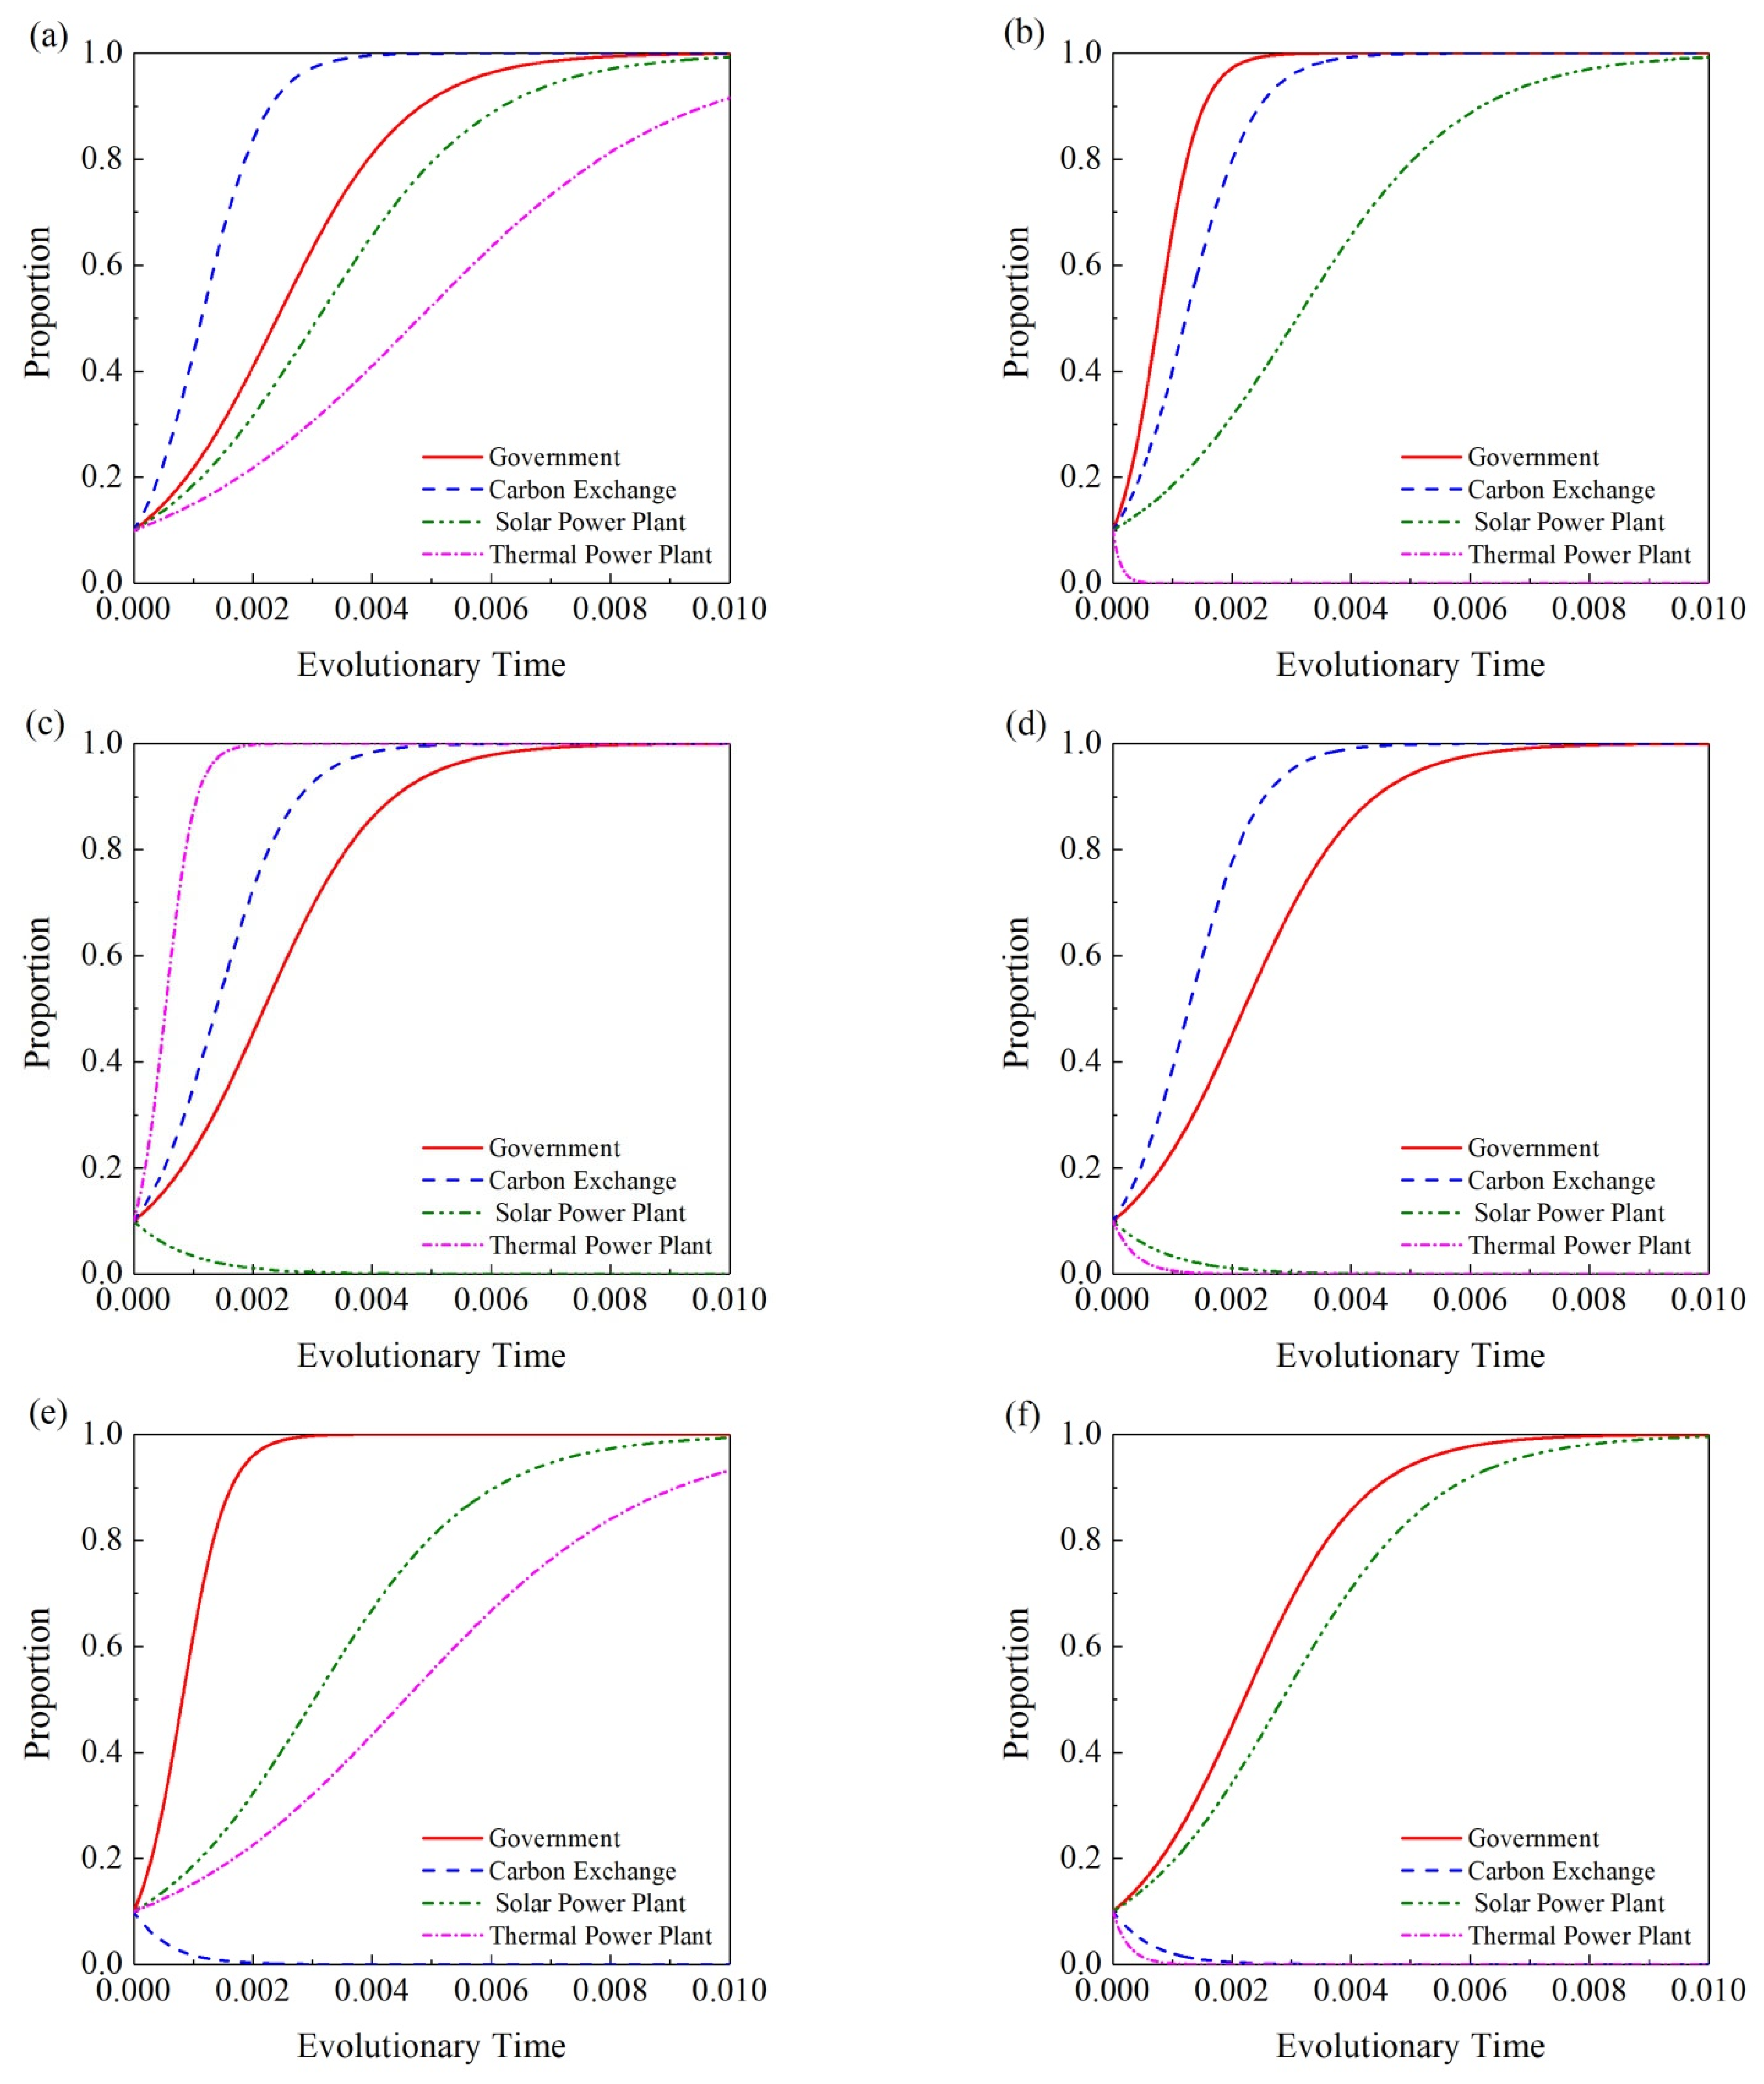
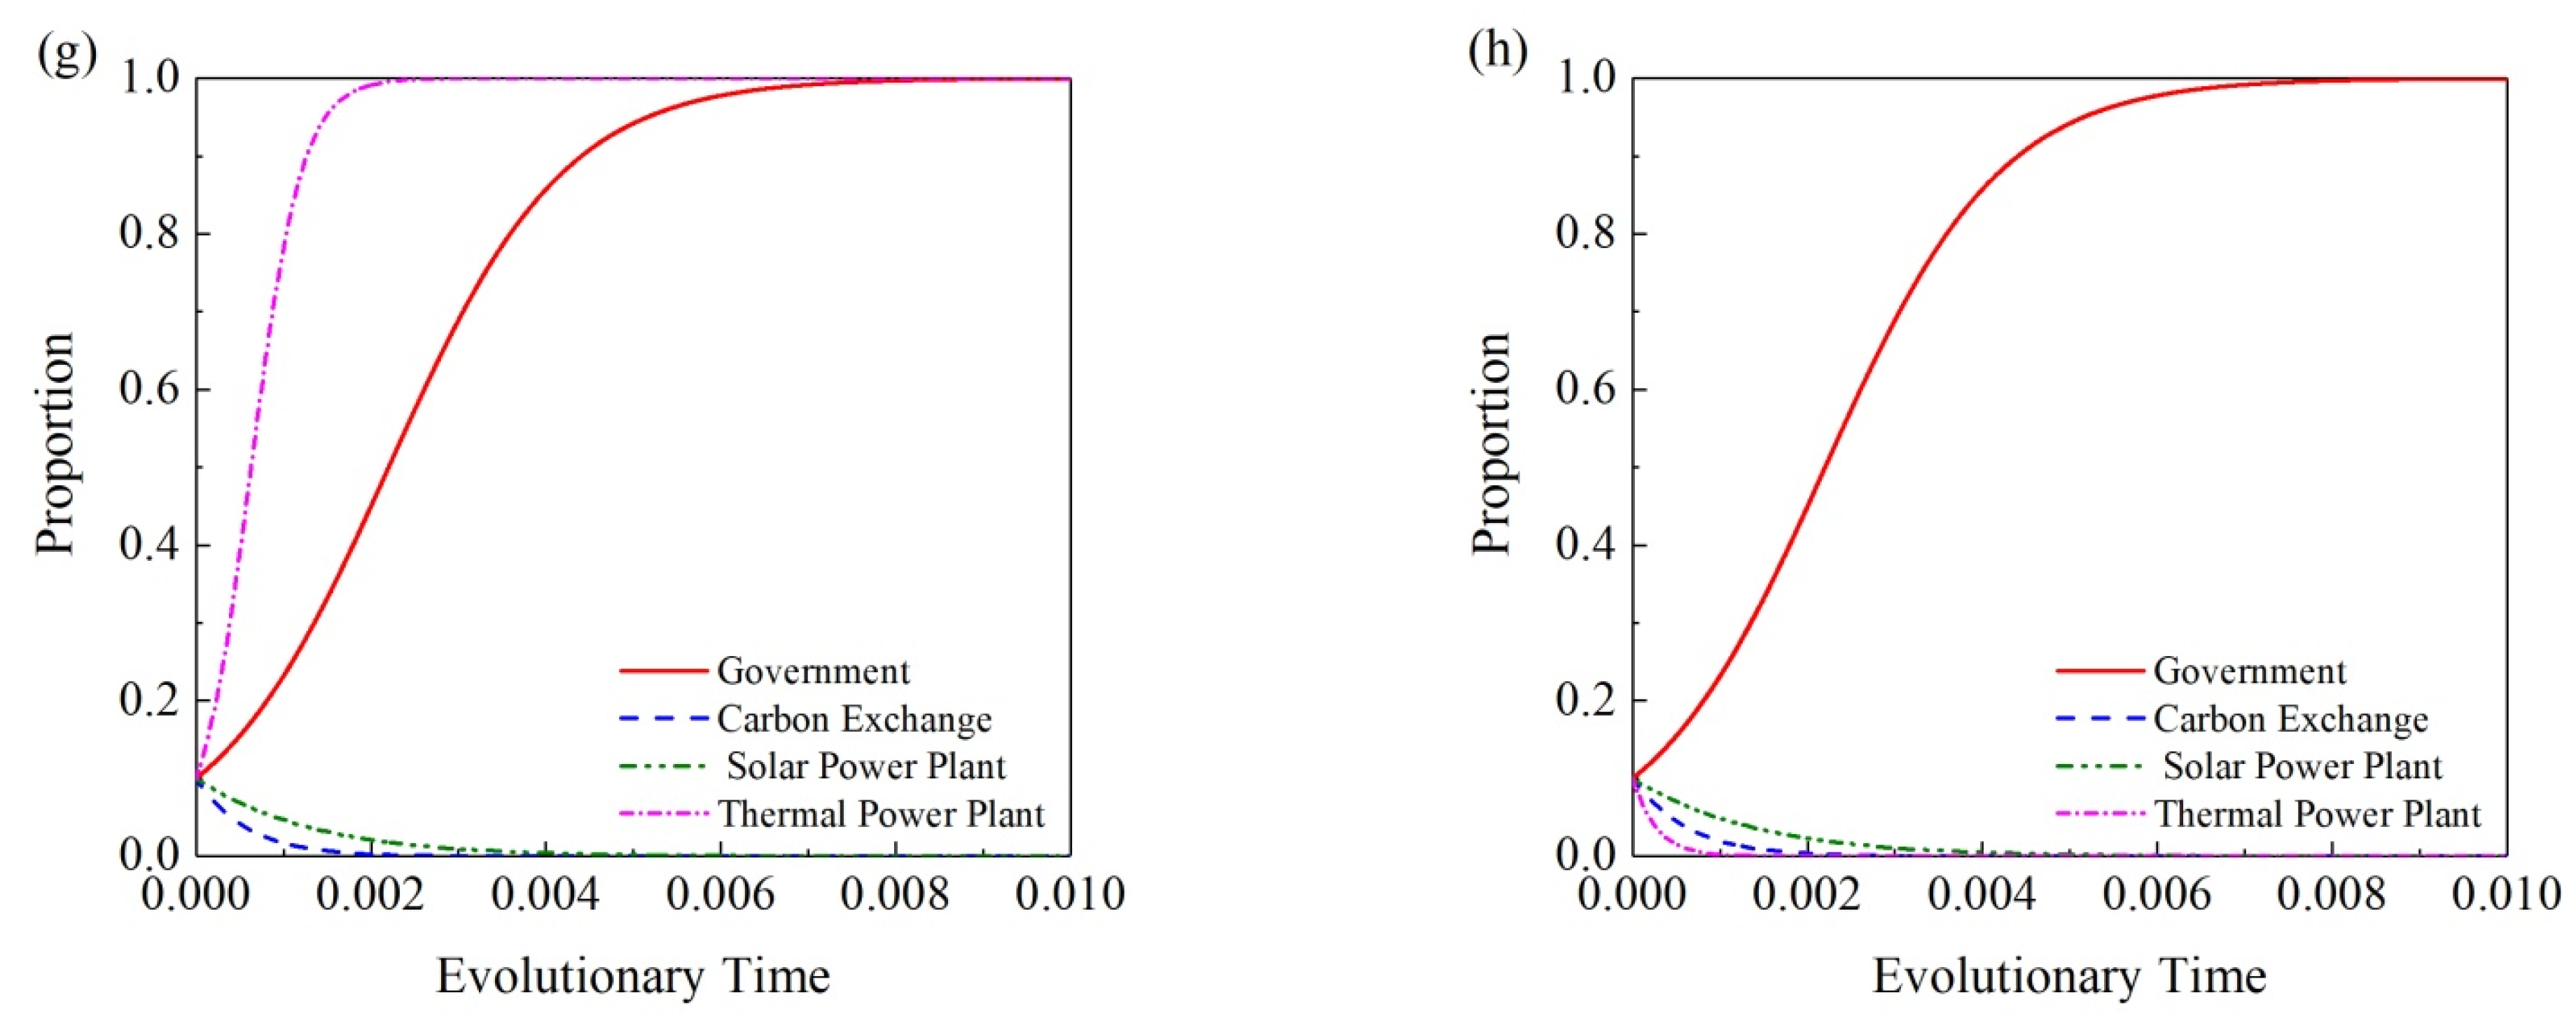
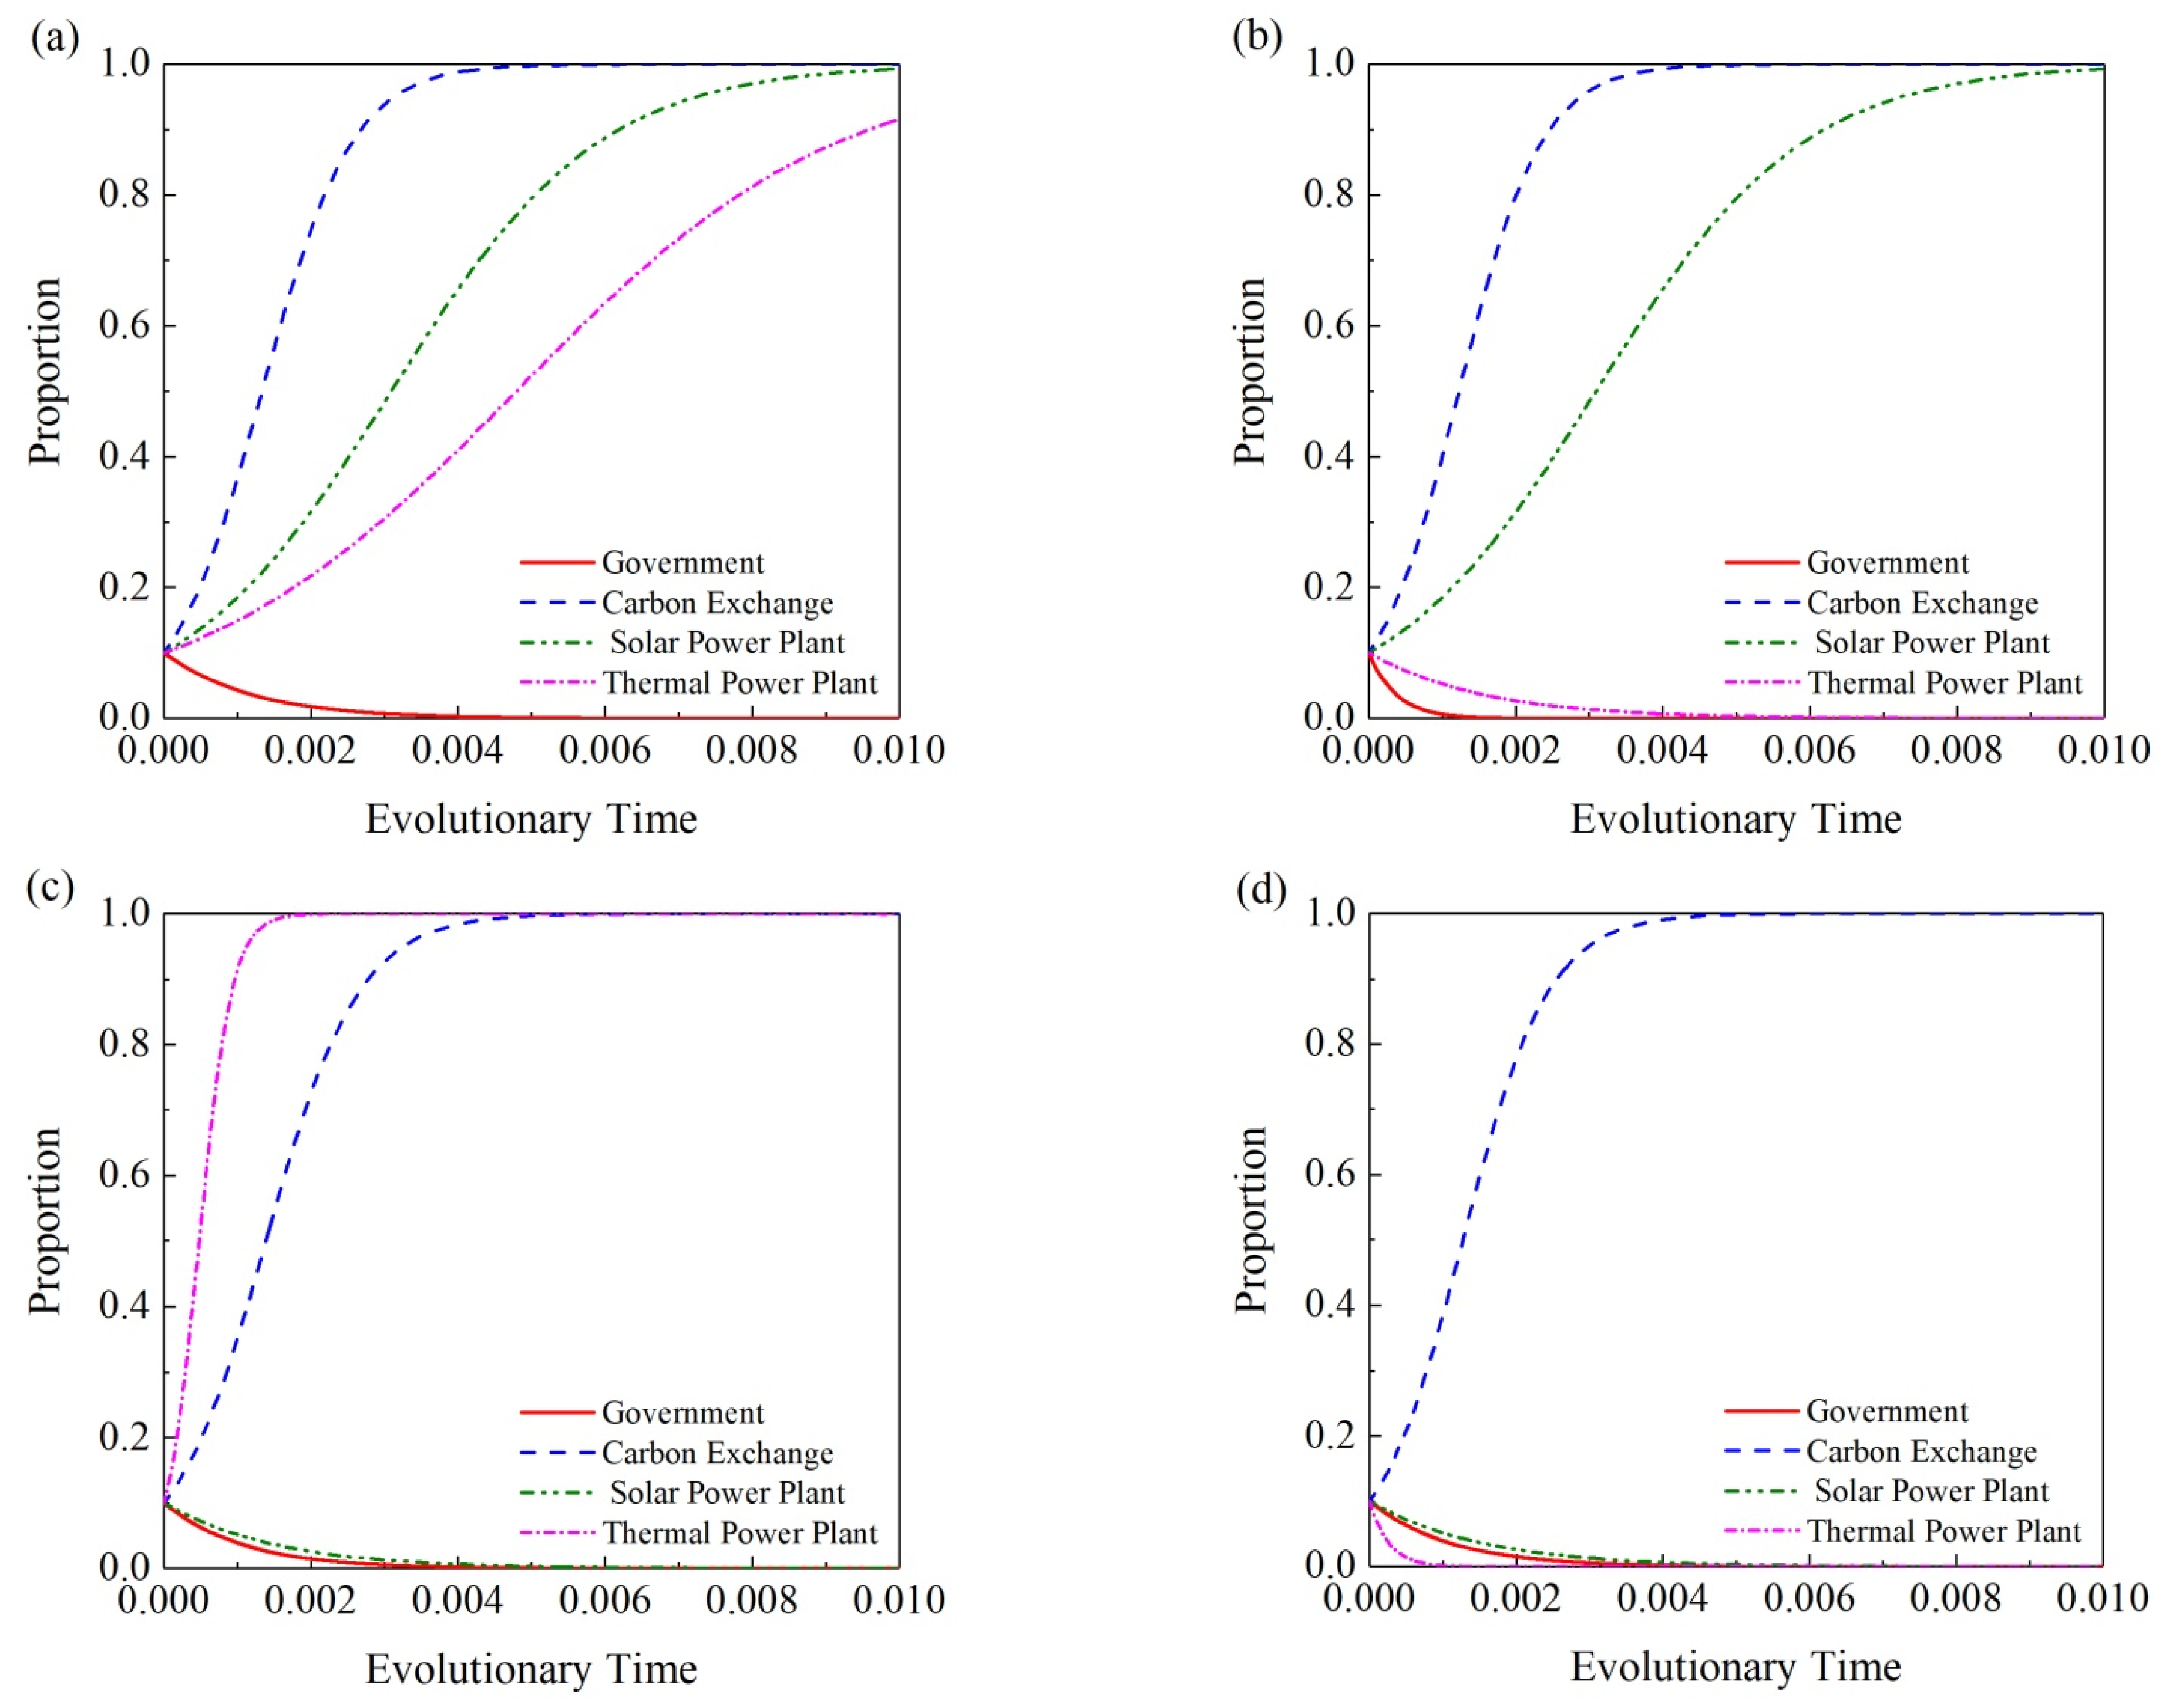
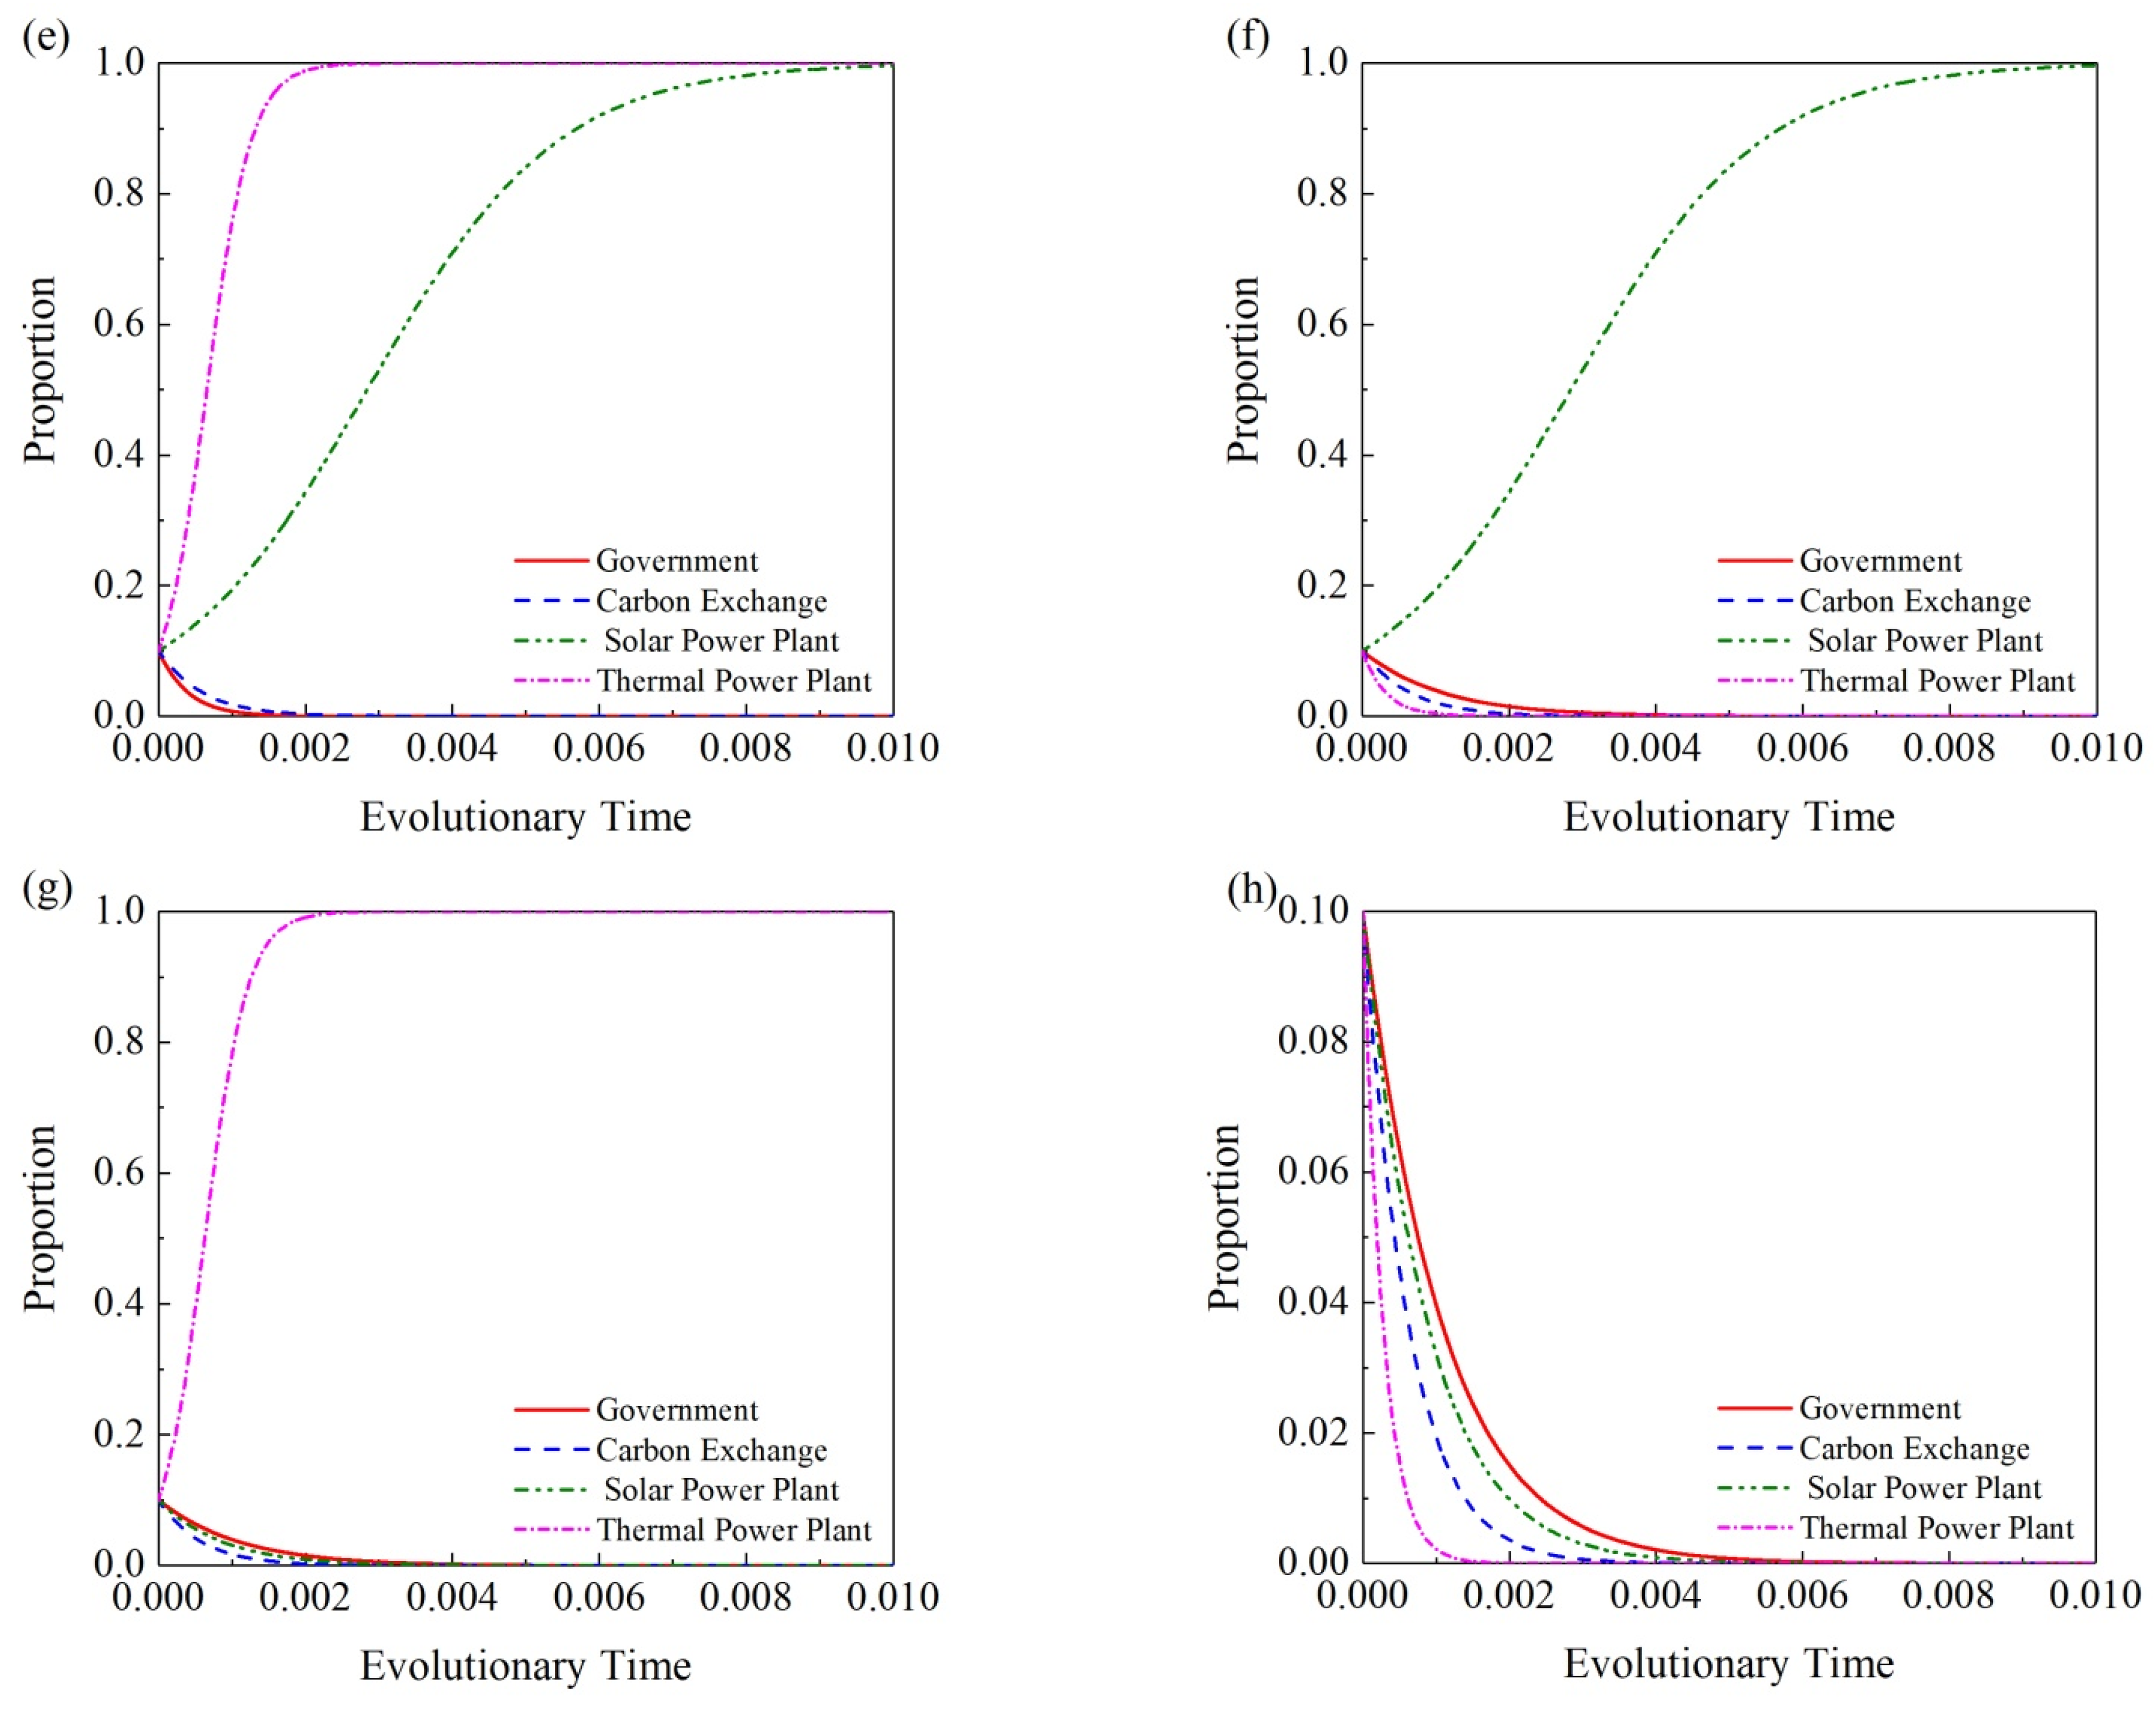
3.2. Evolutionary Stable Strategy Analysis

In this paper, an effect evaluation study based on the four-party EGT approach is conducted. Firstly, the evolutionary processes of the government, CEE, STPP and CTPP under different cooperative relationships are simulated, and Figure 3 and Figure 4 show the relevant results. In Figure 3 and Figure 4, the y axis stands for the proportion of a participator’s participating intention, and the evolutionary time (x axis) is the normalized development time of a certain case, which is a normalized time parameter with no unit. The results of Figure 3 and Figure 4 show that for all evolutionary stable strategies (ESSs), due to different benefits and expenditures conditions created by carbon trading, the final stable states of the government, CEE, STPP and CTPP can all match the pre-set cooperation choosing conditions of the four participators under sixteen cooperative relationships. That means the RDFs of the government, CEE, STPP and CTPP derived in this study are effective and can be used in the following simulations.

3.3. Influence Analysis Results of Key Factors

The influences of eight factors on the evolutionary processes of the government, CEE, STPP and CTPP are evaluated, including the governmental carbon trading tax, green electricity subsidy for the STPP, carbon emission penalty for the CTPP, and various sale prices of CEQ. The influences of the eight factors will be evaluated for the four participators under different typical cooperative relationships.

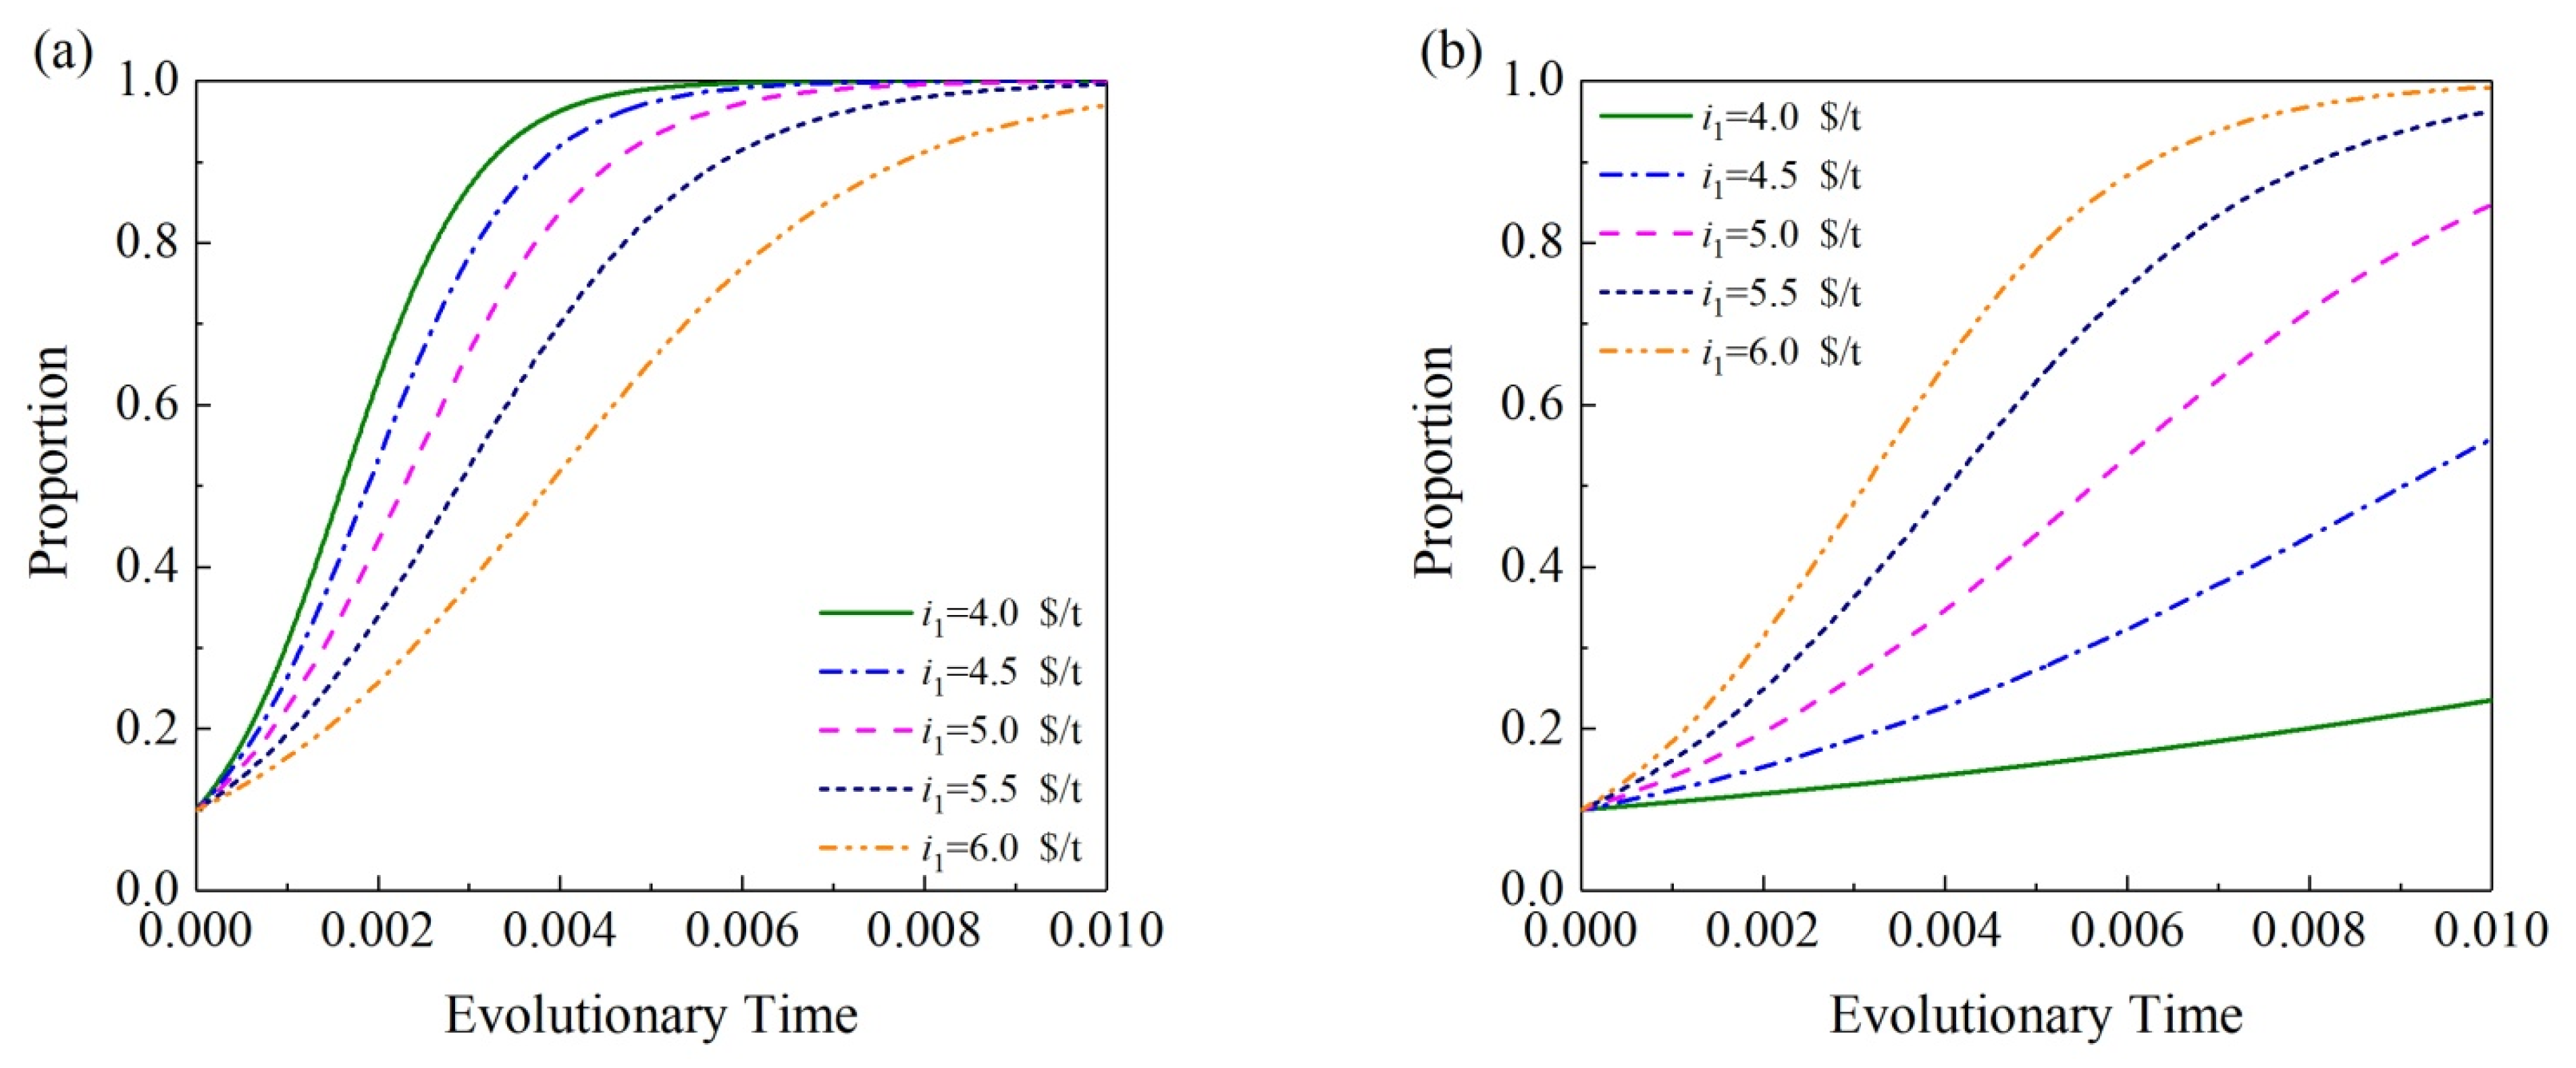
3.3.1. Sale Prices of CEQ of the STPP Sold to the CEE

The influence evaluation of sale prices of CEQ of the STPP sold to the CEE (i.e., i1) is conducted in this sub-section. For different sale prices of CEQ of the STPP sold to the CEE, the evolutionary trajectories of CEE and STPP under (1, 1, 1, 1) are illustrated in Figure 5. The results demonstrate that i1 has obvious effects on the CEE and STPP. With i1 augmented from 4.0 USD/t to 6.0 USD/t, the participating intention of the STPP increases rapidly, while that of the CEE decreases. In order to ensure a relatively acceptable participating intention of the CEE and STPP synchronously, the appropriate value range of i1 should be adopted. According to Figure 5, the price range of 5.5~6.0 USD/t is relatively suitable for the CEE and STPP at the same time.

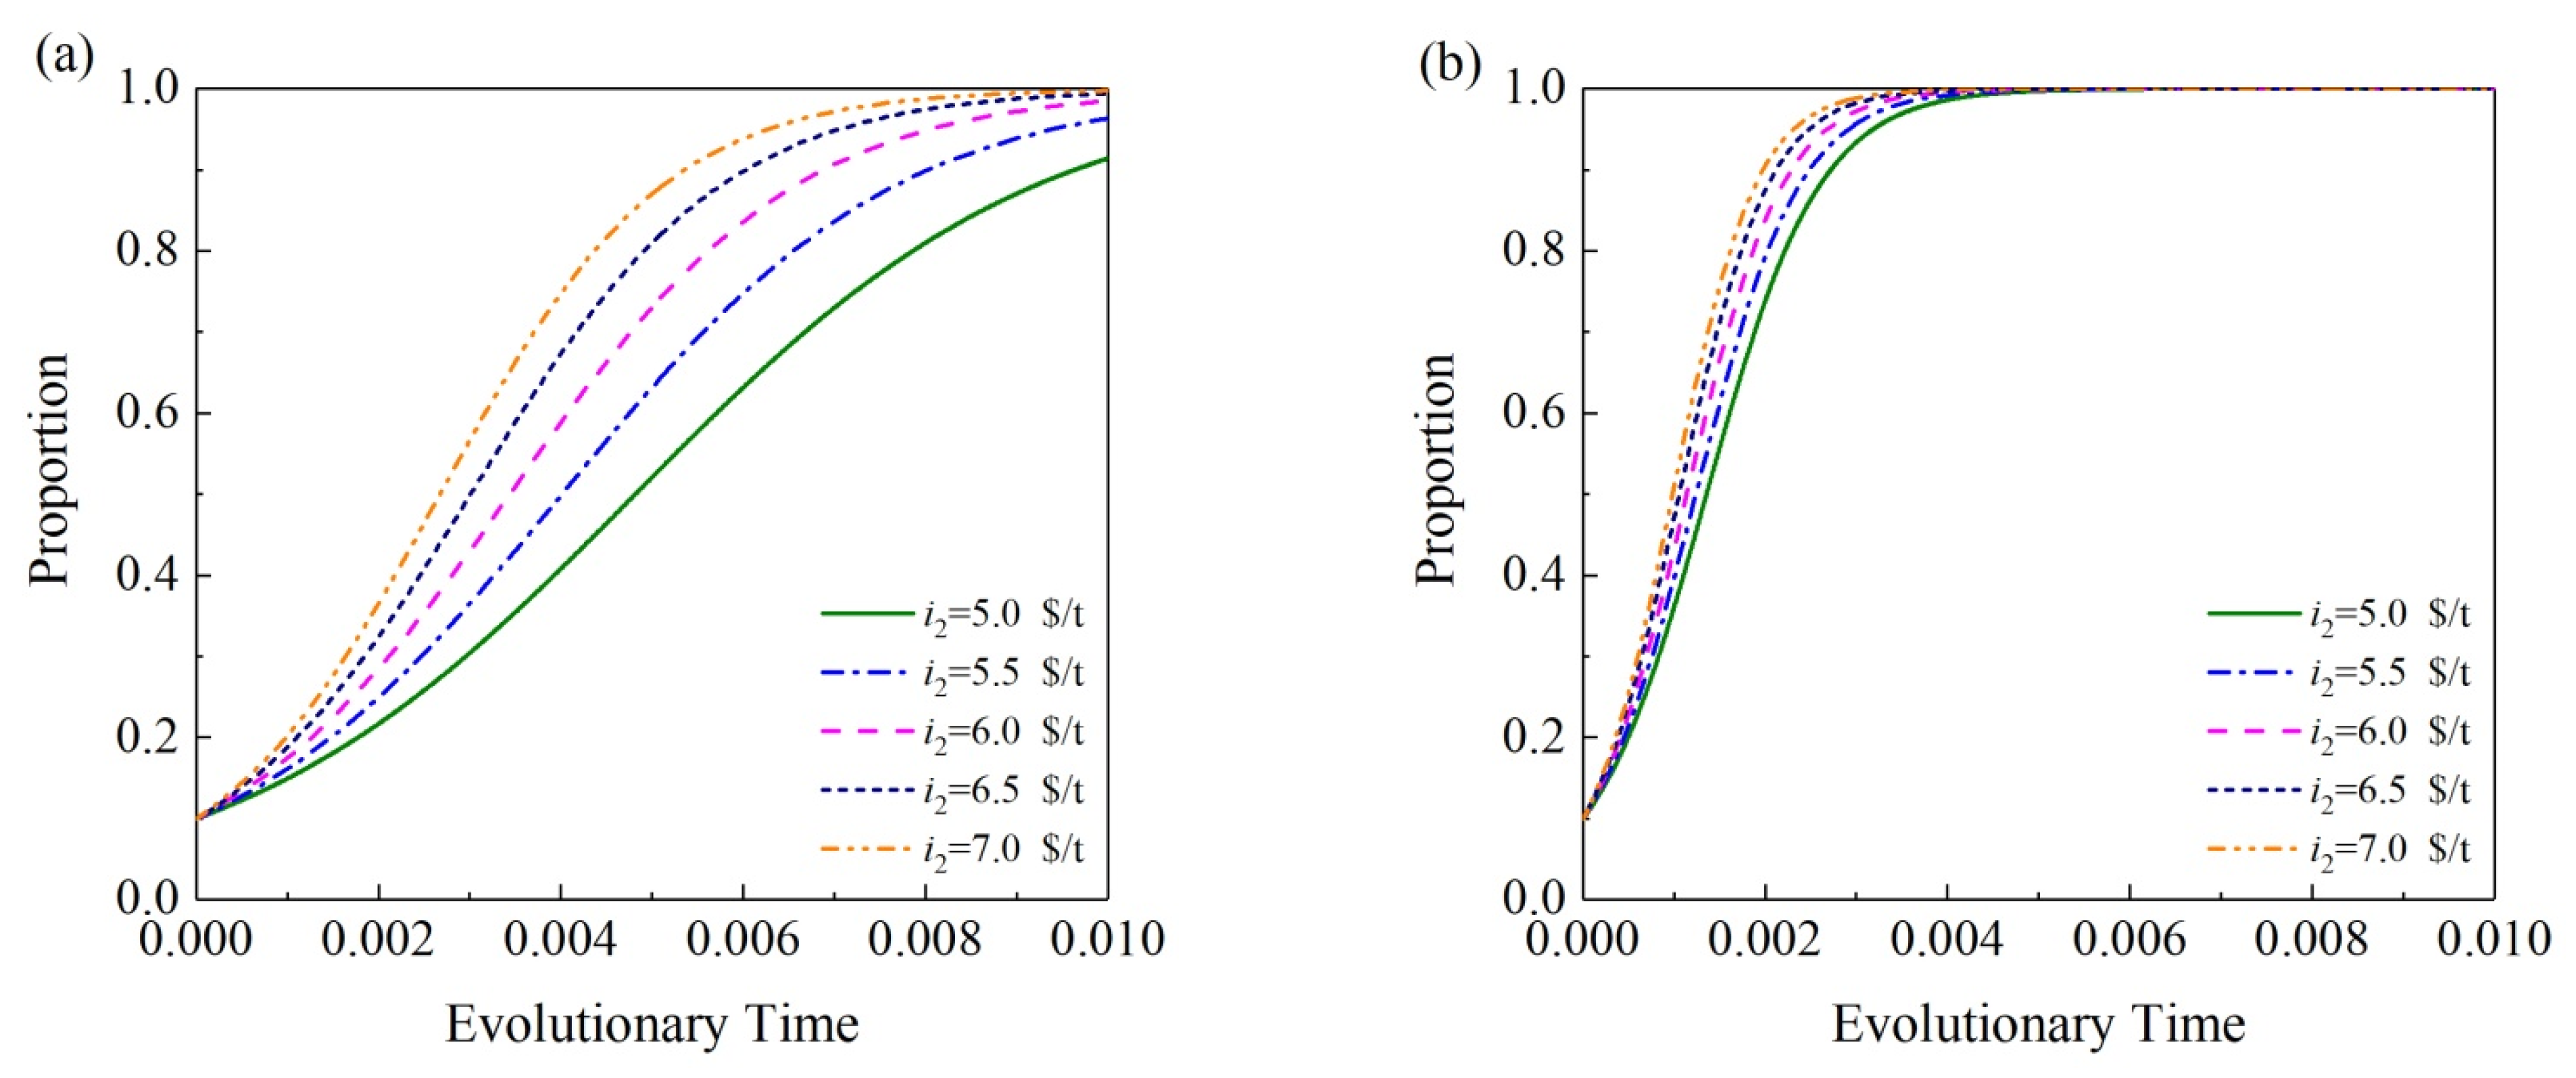
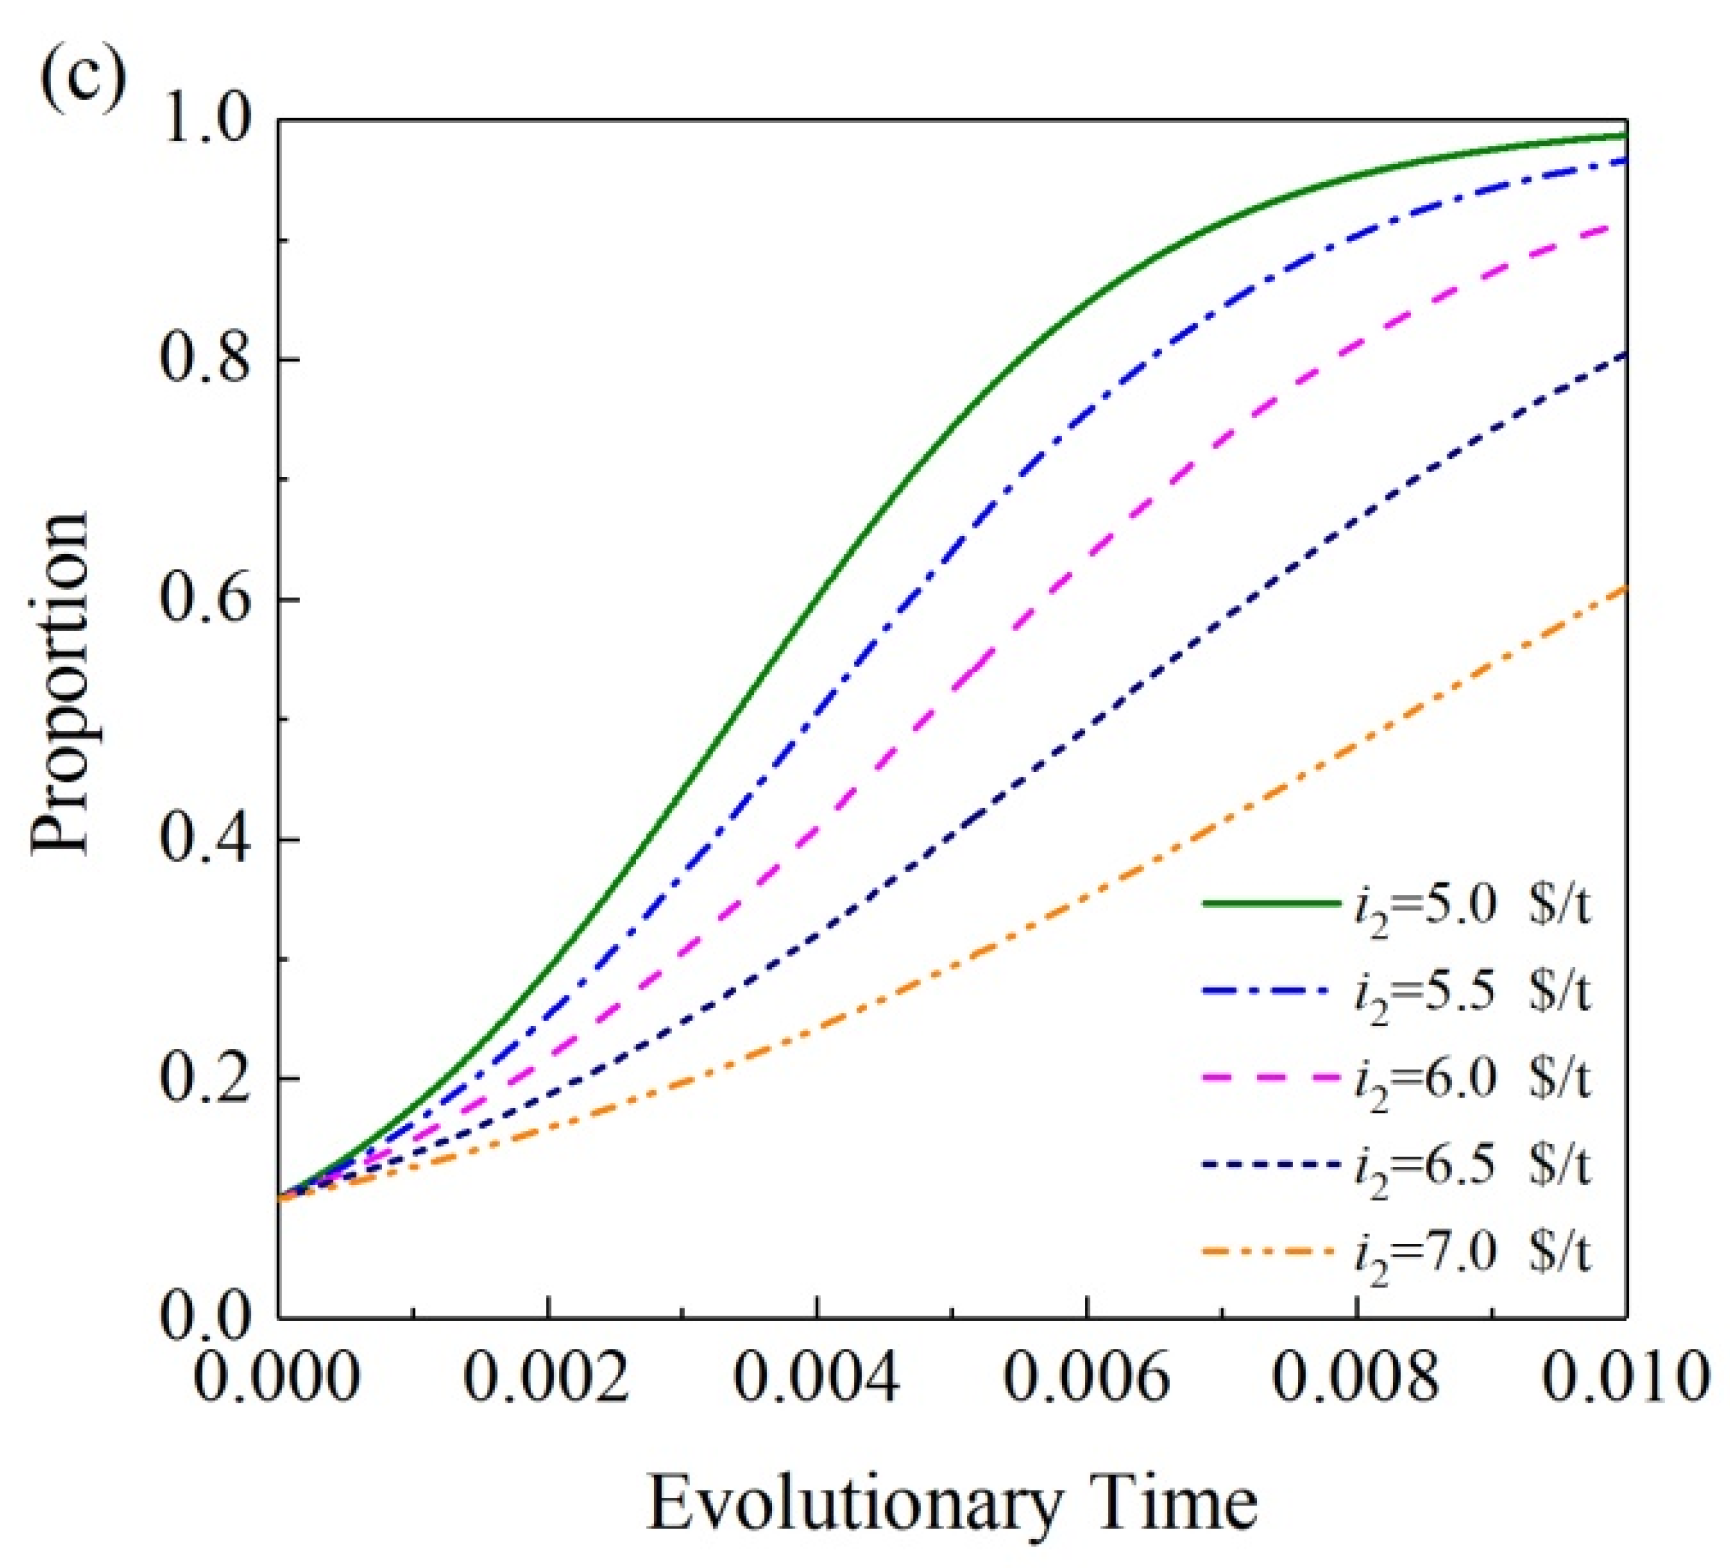
3.3.2. Sale Prices of CEQ of the CEE Sold to the CTPP

In this sub-section, the impact of sale prices of CEQ of the CEE sold to the CTPP (i.e., i2) is estimated. When the sale prices of CEQ of the CEE sold to the CTPP changes, the evolutionary processes of the government, CEE and CTPP under (1, 1, 1, 1) are presented in Figure 6, respectively. The results reveal that i2 has obvious impacts on both the government and CTPP, and has a relatively smaller impact on the CEE. With i2 increased, the participating intention of government increases rapidly, and that of CEE increases slightly. That is due to the benefit increase of the two participators. When i2 increases, the CTPP’s participation intention decreases as the CTPP will pay more for the carbon neutralization. However, with i2 increased from 5.0 USD/t to 7.0 USD/t, the increasing rate of participating intention of CTPP is always positive. According to Figure 6, the price range of 5.0~6.5 USD/t is relatively appropriate for all three participators.

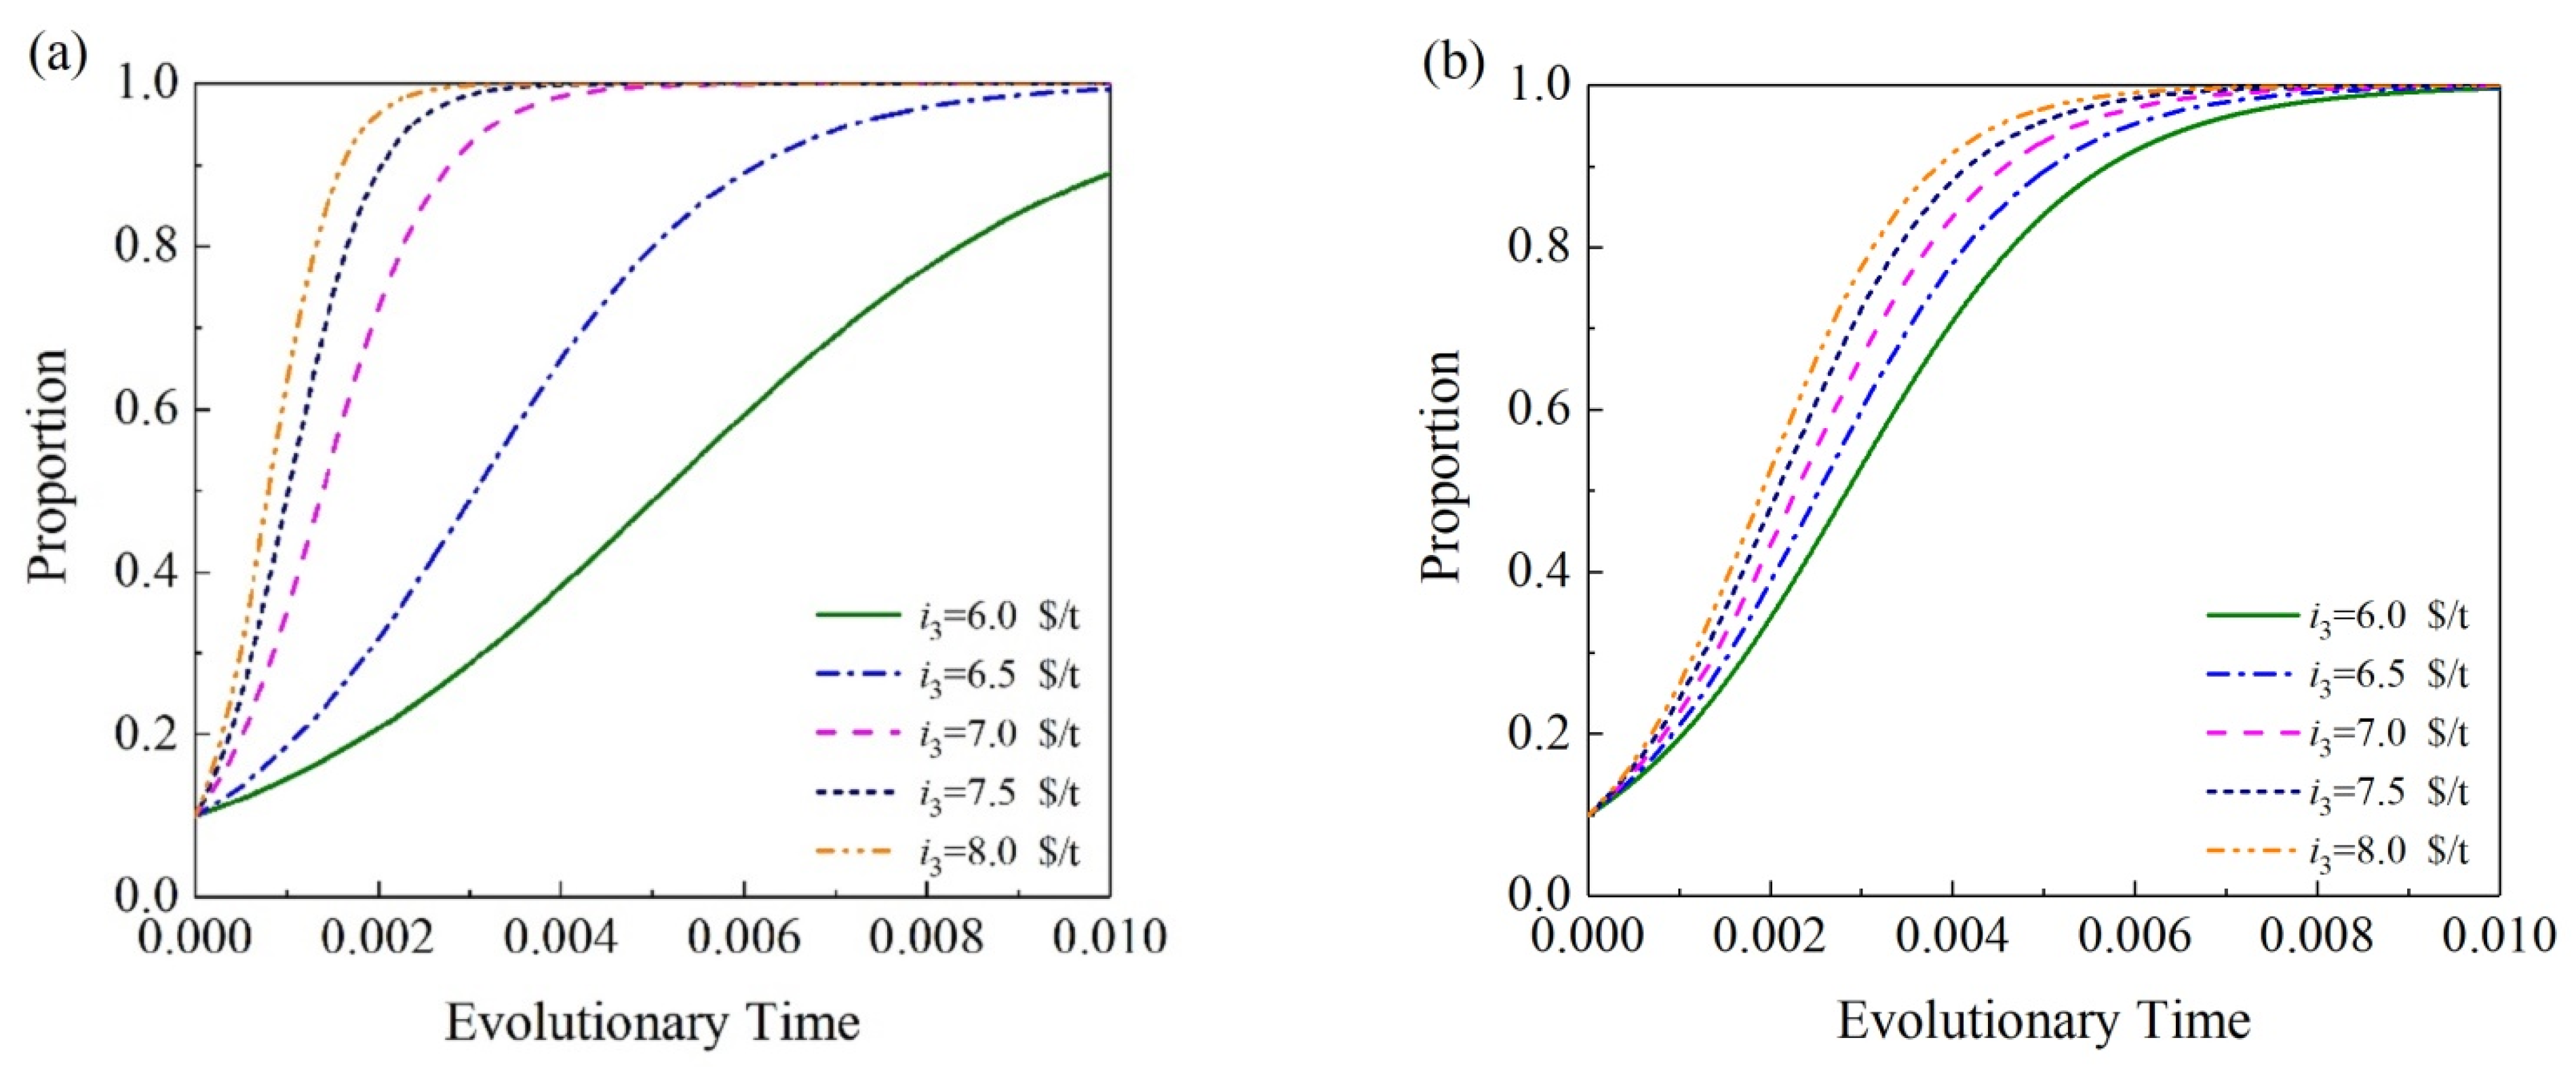
3.3.3. Sale Prices of CEQ of the CEE Sold to Outside Organizations

The influence investigation results of sale prices of CEQ of the CEE (or STPP) sold to outside organizations (i.e., i3) are shown in Figure 7. According to Figure 7, i3 has obvious effects on the government, CEE and STPP under the cooperative relationship of (1, 1, 1, 0). With i3 increased from 6.0 USD/t to 8.0 USD/t, the participating intention of all three participators increases. This is because when i3 increases, the profits generated by selling CEQs of the CEE and STPP will augment, and the corresponding carbon trading tax revenue of the government will also augment. Those strengthen the participating intention of the three participators.

3.3.4. Sale Prices of CEQ of the STPP Sold to the CTPP

The influence evaluation of sale prices of CEQ of the STPP sold to the CTPP (i.e., i4) is carried out in this sub-section. Figure 8 presents the evolutionary trajectories of the STPP and CTPP under (1, 0, 1, 1) for different sale prices of CEQ of the STPP sold to the CTPP. According to Figure 8, i4 has obvious influences on both the STPP and CTPP. With the decrease of i4 from 6.5 USD/t to 4.5 USD/t, the participating intention of the STPP decreases, while that of the CTPP increases. That is caused by the income decrease in the STPP as well as the expenditure reduction in the CTPP. However, an appropriate i4 should be selected to make the STPP and CTPP both maintain relatively higher participating intention. It can be concluded that the price range of 5.0~5.5 USD/t may be relatively appropriate for both the STPP and CTPP.

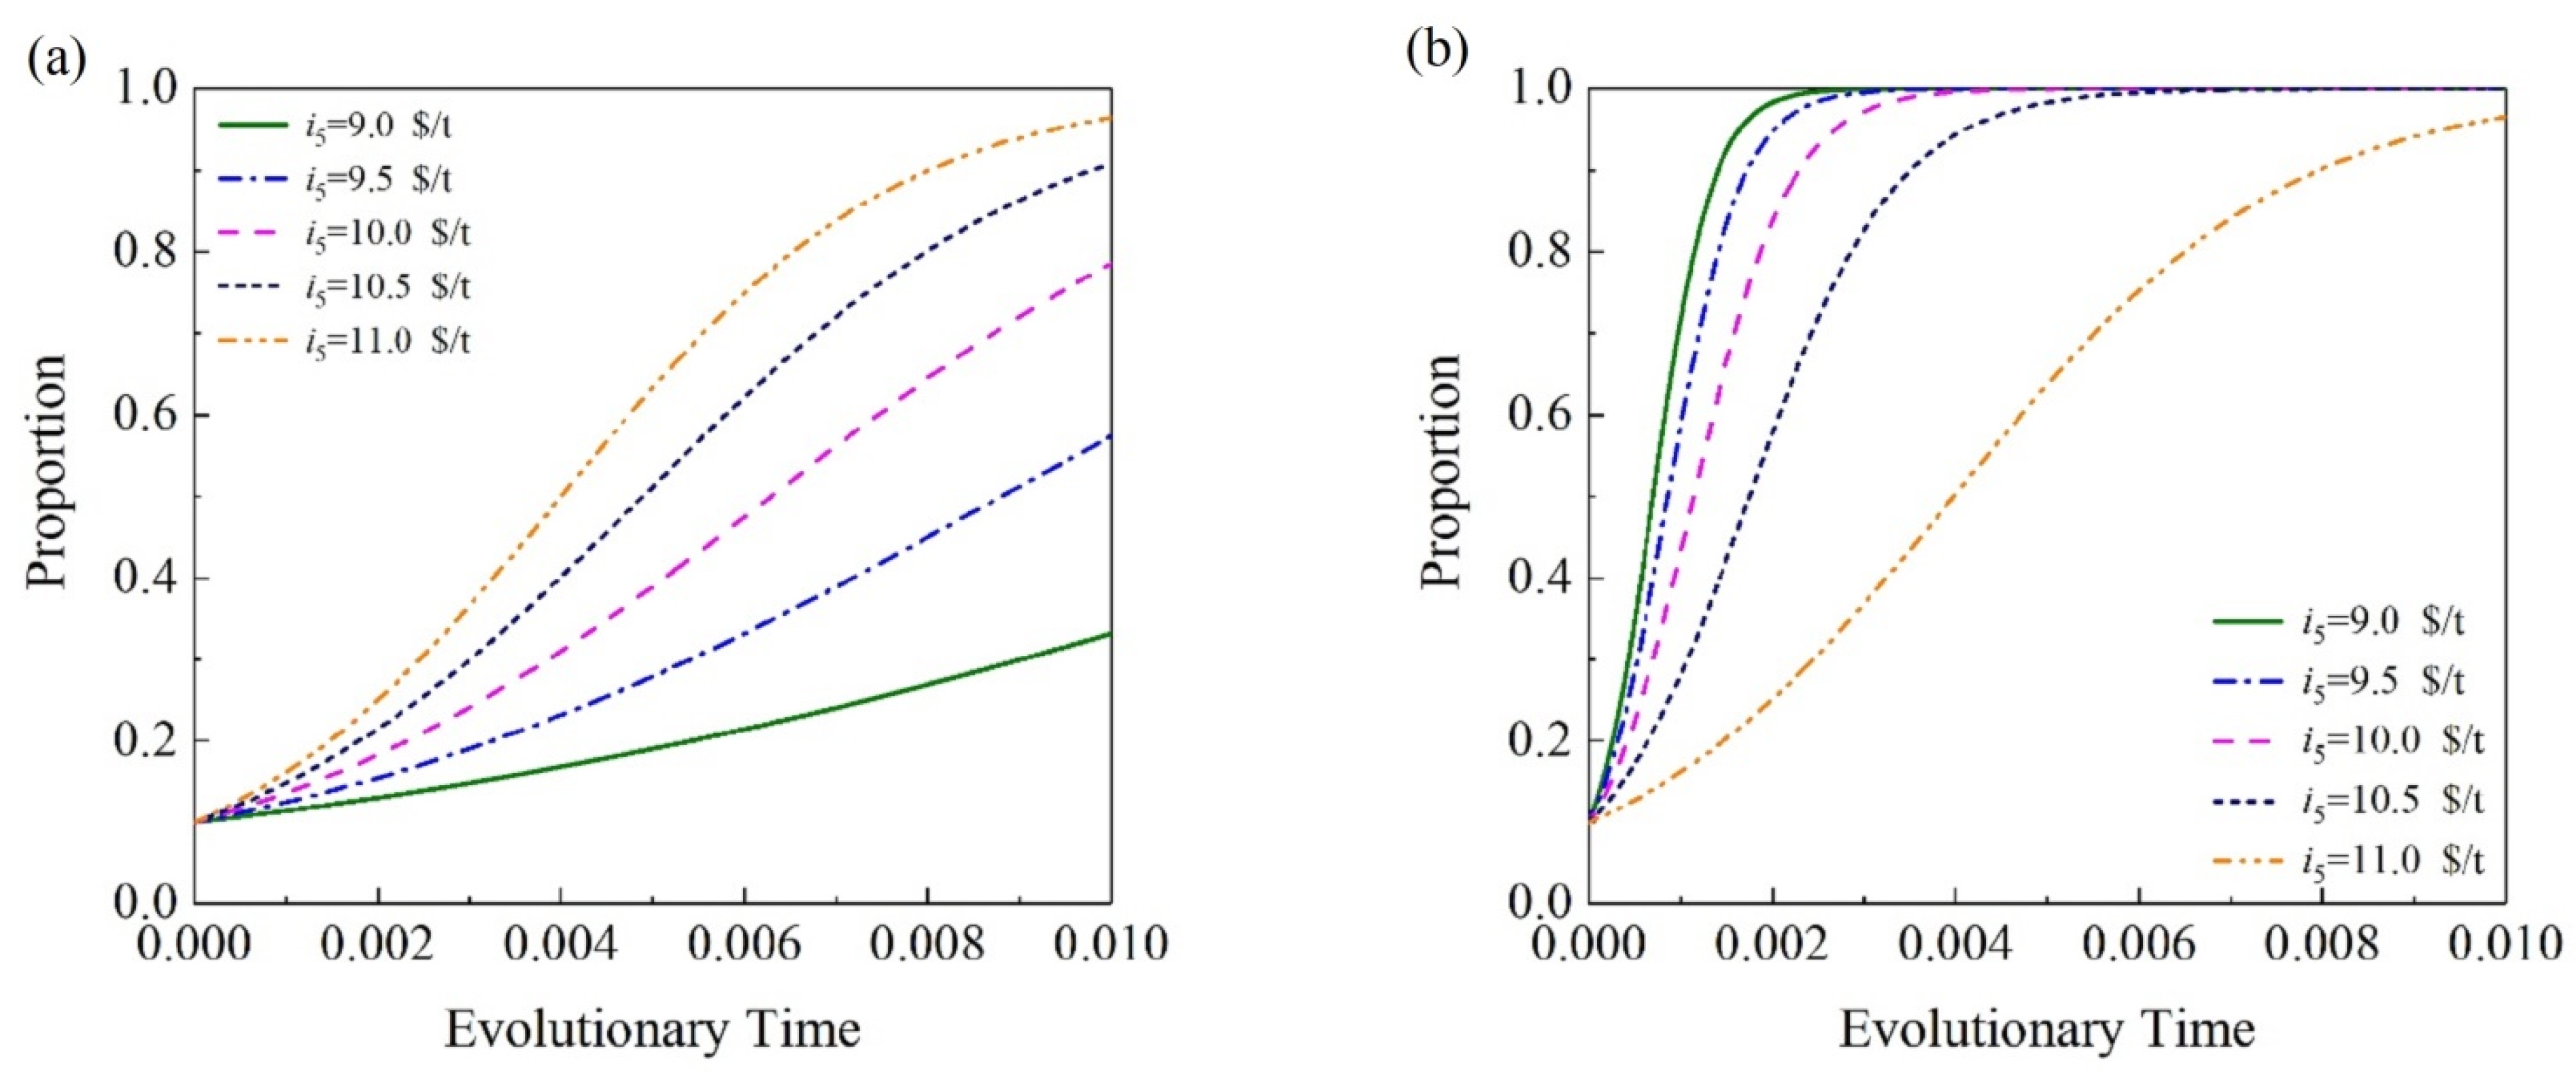
3.3.5. Sale Prices of CEQ Sold to the CTPP by Outside Organizations

The current sub-section estimates the impact of sale prices of CEQ sold to the CTPP by outside organizations (i.e., i5). At different sale prices of CEQ sold to the CTPP by outside organizations, the evolutionary trajectories of the government and CTPP under (1, 0, 0, 1) are provided in Figure 9. The results of Figure 9 show that under the cooperative relationship of (1, 0, 0, 1), i5 has inverse relationships with the participating intention of the CTPP.
When i5 is greater than 10.5 USD/t, the participating intention of the CTPP decreases sharply. In contrast, with i5 increased, the government is encouraged as its carbon trading tax revenue increases. As the public–private partnership project can be considered to be mainly initiated by the government, the price range of 9.0~10.5 USD/t can be reasonable for both the government and CTPP under (1, 0, 0, 1).

3.3.6. Carbon Emission Penalty

Figure 10 illustrates the evolutionary processes of the government and CTPP under (1, 1, 1, 1) at different carbon emission penalty coefficient (R) values. The results reveal that the influences of carbon penalty on the government and CTPP are very obvious. With the carbon emission penalty coefficient increased, the participating intention of the government increases quickly. That is due to the income increase caused by the increase in carbon emission penalty coefficient.
When the carbon emission penalty coefficient decreases, the participating intention of the CTPP decreases rapidly. Even under the cooperative relationship of (1, 1, 1, 1), when the carbon emission penalty coefficient is 6.0 USD/t, the participating intention of the CTPP begins to decrease. In that condition, the CTPP will withdraw from the public–private partnership project gradually. As the carbon emission penalty coefficient increases from 6.0 USD/t to 14.0 USD/t, the participating intention of the CTPP augments sharply. Hence, it can be concluded that a higher carbon emission penalty coefficient will be beneficial to improving the participations of the government and CTPP.

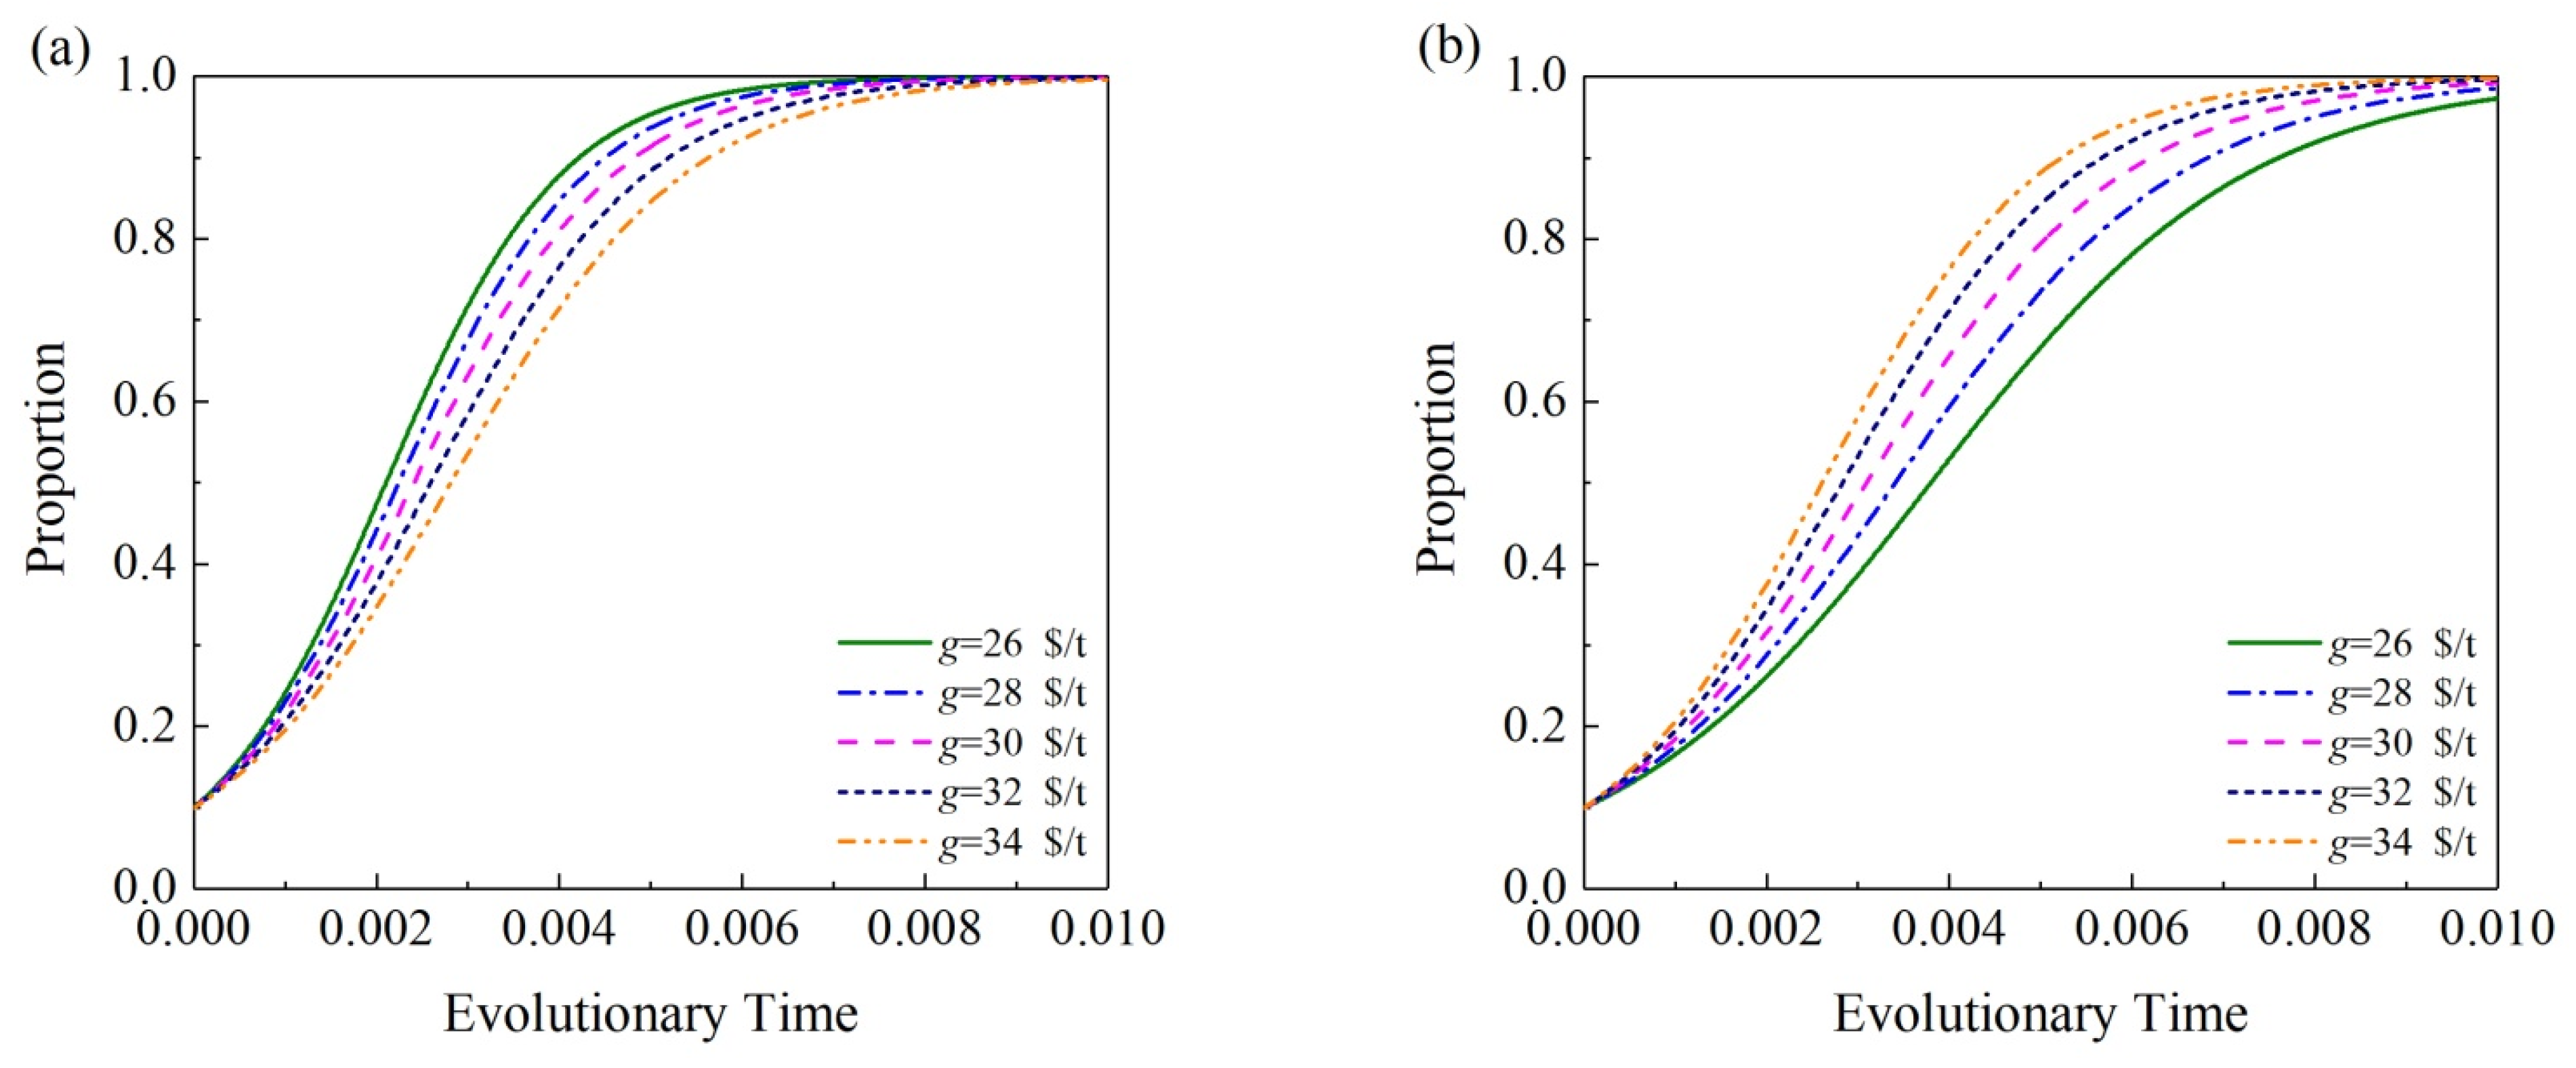
3.3.7. Green Electricity Subsidy

The impact evaluation results of green electricity subsidy coefficient g on the government and STPP under (1, 1, 1, 1) are presented in Figure 11. The results show that the governmental green electricity subsidy coefficient has a proportional relationship with the participating intention of the STPP but an inverse relationship with that of the government. However, when g changes from 26.0 USD/t to 34.0 USD/t, the decrease in the participating intention of the government is relatively small. Thus, increasing the green electricity subsidy appropriately can promote the participation of the STPP.

3.3.8. Carbon Trading Tax

In this study, the four carbon trading tax rates are assumed to be the same and can be denoted as K. Figure 12 illustrates the impact evaluation results of K on the four participators under (1, 1, 1, 1). The results reveal that with K decreased from 6.4% to 5.6%, the participating intention of the government decreases, while that of the CEE, STPP and CTPP increases. Taking into account the positive attitude of the government in promoting carbon neutralization, the carbon trading tax rate range of 6.0~6.2% may be suitable for all four participators.

4. Brief Summary

This paper mainly proposes a new PPP project comprising the GOVT, CEE, STPP and CTPP for achieving carbon neutralization and conducts the effect evaluations of eight typical factors on the PPP project. The analysis results may be meaningful for the coordinated developments of multi-energy power generation. For the future, some possible further research works are listed below:
(a)
Effect evaluations of typical factors on the PPP project considering the influences of dynamic government policies;
(b)
Feasibility investigation of the PPP project considering the governmental negative regulation on the developments of solar and coal-fired electricity production;
(c)
Study on the PPP project considering both the electric and carbon trading markets.

5. Conclusions

For reducing carbon dioxide emissions, achieving carbon neutralization and facilitating the coordinated development of solar and coal-fired thermal power generations, this paper proposes a public–private partnership project including the government, CEE, STPP and CTPP. On the basis of China’s policies and current situations, the ESSs are simulated using the four-party EGT method. The results show that the steady states of the four participators can be achieved for all the sixteen cooperative relationships. When all participators cooperate, the participating intention of the CEE is the highest, followed by that of the government, STPP and CTPP orderly.
The influences of eight factors on the four participators under typical cooperative relationships were evaluated. The results demonstrate that the participating intention of the STPP can be improved by increasing the sale prices of CEQs of the STPP and green electricity subsidy. To encourage the participation of the CTPP, the sale prices of CEQs sold to the CTPP should be reduced, and the carbon emission penalty coefficient should be increased. By decreasing the carbon trading tax, the participating intentions of the CEE, STPP and CTPP can all be improved. In most instances, the government and CEE can hold acceptable participating intention. For relatively suitable reference value ranges, the sale price range of CEQ of the STPP sold to the CEE is 5.5~6.0 USD/t, that of the CEE sold to the CTPP is 5.0~6.5 USD/t, that of the STPP sold to the CTPP is 5.0~5.5 USD/t, that sold to the CTPP by outside organizations is 9.0~10.5 USD/t, and the carbon trading tax rate range is 6.0%~6.2%. Higher carbon emission penalty, higher green electricity subsidy and lower carbon trading tax rate will be beneficial to the carbon trading market, and thus facilitate the coordinated development of solar and coal-fired electricity production.

Author Contributions

Writing–original draft, Y.C.; Writing–review & editing, G.W. All authors have read and agreed to the published version of the manuscript.

Funding

This research received no external funding.

Institutional Review Board Statement

Not applicable.

Informed Consent Statement

Not applicable.

Data Availability Statement

Not applicable.

Conflicts of Interest

The authors declare no conflict of interest.

Nomenclature

C1carbon emission quota held by the CEE (t)
C2annual free carbon emission quota held by the STPP (t)
C3annual carbon emission quantity of the CTPP (t)
ggreen electricity subsidy coefficient of the STPP (USD/t)
Gannual zero carbon emission rewards of the CTPP (USD)
i1sale prices of carbon emission quota of the STPP sold to the CEE (USD/t)
i2sale prices of carbon emission quota of the CEE sold to the CTPP (USD/t)
i3sale prices of carbon emission quota of the CEE or STPP sold to outside organizations (USD/t)
i4sale prices of carbon emission quota of the STPP sold to the CTPP (USD/t)
i5sale prices of carbon emission quota sold to the CTPP by outside organizations (USD/t)
kcarbon trading tax coefficient (%)
Kcarbon trading tax coefficient (%)
Rcarbon emission penalty coefficient (USD/t)
Subscripts
ceecarbon exchange enterprise
govtgovernment
stppsolar thermal power plant
ctppcoal-fired thermal power plant
Abbreviations
CEEcarbon exchange enterprise
CEQcarbon emission quota
EGTevolutionary game theory
ESSevolutionary stable strategy
GOVTgovernment
IPSOimproved particle swarm optimization
PPPpublic–private partnership
RDFreplicator dynamic formula
STPPsolar thermal power plant
CTPPcoal-fired thermal power plant

References

  1. Liu, Q.; Chen, Y.; Tian, C.; Zheng, X.-Q.; Li, J.-F. Strategic deliberation on development of low-carbon energy system in China. Adv. Clim. Chang. Res. 2016, 7, 26–34. [Google Scholar] [CrossRef]
  2. BP. Energy Institute Statistical Review of World Energy, 71st ed.; BP Company: London, UK, 2022. [Google Scholar]
  3. Cachola, C.D.S.; Ciatta, M.; Santos, A.A.D.S.; Peyerl, D. Deploying of the carbon capture technologies for CO2 emission mitigation in the industrial sectors. Carbon Capture Sci. Technol. 2023, 7, 100102. [Google Scholar] [CrossRef]
  4. Ketabchi, M.R.K.; Babamohammadi, S.; Davies, W.G.; Gorbounov, M.; Soltani, S.M. Latest advances and challenges in carbon capture using bio-based sorbents: A state-of-the-art review. Carbon Capture Sci. Technol. 2023, 6, 100087. [Google Scholar] [CrossRef]
  5. Chen, J.; Xu, Y.; Liao, P.; Wang, H.; Zhou, H. Recent Progress in Integrated CO2 Capture and Conversion Process Using Dual Function Materials: A State-of-the-Art Review. Carbon Capture Sci. Technol. 2022, 4, 100052. [Google Scholar] [CrossRef]
  6. Shu, Z.; Sun, H.; Williams, P.T.; Wu, C. Recent advances in integrated CO2 capture and utilization: A review. Sustain. Energy Fuels 2021, 5, 4546–4559. [Google Scholar]
  7. Kijewska, A.; Bluszcz, A. Research of varying levels of greenhouse gas emissions in European countries using the k-means method. Atmos. Pollut. Res. 2016, 7, 935–944. [Google Scholar] [CrossRef] [Green Version]
  8. Fell, H.; Johnson, J.X. Regional disparities in emissions reduction and net trade from renewables. Nat. Sustain. 2021, 4, 358–365. [Google Scholar] [CrossRef]
  9. Xue, P.; Liu, J.; Liu, B.; Zhu, C. Impact of Urbanisation on the Spatial and Temporal Evolution of Carbon Emissions and the Potential for Emission Reduction in a Dual-Carbon Reduction Context. Sustainability 2023, 15, 4715. [Google Scholar] [CrossRef]
  10. Wang, L. Low Carbon Management of China’s Hotel Tourism through Carbon Emission Trading. Sustainability 2023, 15, 4622. [Google Scholar] [CrossRef]
  11. Wang, Z.; Zhou, X. Can Innovation-Driven Policy Reduce Chinaʹs Carbon Emission Intensity?—A Quasi-Natural Experiment Based on the National Innovative City Pilot Policy. Sustainability 2023, 15, 4383. [Google Scholar] [CrossRef]
  12. Zhang, C.; Su, B.; Zhou, K.; Yang, S. Decomposition analysis of China’s CO2 emissions (2000–2016) and scenario analysis of its carbon intensity targets in 2020 and 2030. Sci. Total Environ. 2019, 668, 432–442. [Google Scholar] [CrossRef]
  13. Zhang, S.; Wang, C.; Yu, C. The evolutionary game analysis and simulation with system dynamics of manufacturer’s emissions abatement behavior under cap-and-trade regulation. Appl. Math. Comput. 2019, 355, 343–355. [Google Scholar] [CrossRef]
  14. Wang, G.; Chao, Y.; Jiang, T.; Lin, J.; Peng, H.; Chen, H.; Chen, Z. Analyzing the effects of government policy and solar photovoltaic hydrogen production on promoting CO2 capture and utilization by using evolutionary game analysis. Energy Strategy Rev. 2023, 45, 101044. [Google Scholar] [CrossRef]
  15. Wang, G.; Chao, Y.; Cao, Y.; Jiang, T.; Han, W.; Chen, Z. A comprehensive review of research works based on evolutionary game theory for sustainable energy development. Energy Rep. 2022, 8, 114–136. [Google Scholar] [CrossRef]
  16. Kang, K.; Zhao, Y.; Zhang, J.; Qiang, C. Evolutionary game theoretic analysis on low-carbon strategy for supply chain enterprises. J. Clean. Prod. 2019, 230, 981–994. [Google Scholar] [CrossRef]
  17. Xu, J.; Zhu, M.; Zhao, S.; Xie, Y. Leader-follower game-theoretic method towards carbon-economy trade-off in a key construction project group. J. Environ. Manag. 2019, 233, 499–512. [Google Scholar] [CrossRef]
  18. Antoci, A.; Borghesi, S.; Iannucci, G.; Russu, P. Emission permits, innovation and sanction in an evolutionary game. Econ. Politica 2020, 37, 525–546. [Google Scholar] [CrossRef]
  19. Zhao, T.; Liu, Z. A novel analysis of carbon capture and storage (CCS) technology adoption: An evolutionary game model between stakeholders. Energy 2019, 189, 116352. [Google Scholar] [CrossRef]
  20. Shi, Y.; Han, B.; Zeng, Y. Simulating policy interventions in the interfirm diffusion of low-carbon technologies: An agent-based evolutionary game model. J. Clean. Prod. 2020, 250, 119449. [Google Scholar] [CrossRef]
  21. Rocha, A.; Salomão, G. Environmental Policy Regulation and Corporate Compliance in Evolutionary Game Models with Well-mixed and Structured Populations. Eur. J. Oper. Res. 2019, 279, 486–501. [Google Scholar] [CrossRef]
  22. Ghazi, S.; Dugdale, J.; Khadir, T. A Multi-Agent based Approach for Simulating the Impact of Human Behaviours on Air Pollution. Informatica 2015, 39, 501–505. [Google Scholar]
  23. Zhao, R.; Zhou, X.; Han, J.; Liu, C. For the sustainable performance of the carbon reduction labeling policies under an evolutionary game simulation. Technol. Forecast. Soc. Chang. 2016, 112, 262–274. [Google Scholar] [CrossRef]
  24. Fan, R.; Dong, L. The dynamic analysis and simulation of government subsidy strategies in low-carbon diffusion considering the behavior of heterogeneous agents. Energy Policy 2018, 117, 252–262. [Google Scholar] [CrossRef]
  25. Halat, K.; Hafezalkotob, A. Modeling carbon regulation policies in inventory decisions of a multistage green supply chain: A game theory approach. Comput. Ind. Eng. 2019, 128, 807–830. [Google Scholar] [CrossRef]
  26. Zhao, R.; Gareth, N.; Han, J.; Neighbour, G.; McGuire, M.; Deutz, P. Using game theory to describe strategy selection for environmental risk and carbon emissions reduction in the green supply chain. J. Loss Prev. Process Ind. 2012, 25, 927–936. [Google Scholar] [CrossRef]
  27. Cui, H.; Zhao, T.; Wu, R. CO2 emissions from China’s power industry: Policy implications from both macro and micro perspectives. J. Clean. Prod. 2018, 200, 746–755. [Google Scholar] [CrossRef]
  28. Barone, G.; Buonomano, A.; Forzano, C.; Palombo, A.; Panagopoulos, O. Solar thermal collectors. Energy Convers. Manag. 2019, 195, 1079–1097. [Google Scholar] [CrossRef]
  29. Wang, G.; Chao, Y.; Jiang, T.; Chen, Z. Facilitating developments of solar thermal power and nuclear power generations for carbon neutral: A study based on evolutionary game theoretic method. Sci. Total Environ. 2022, 814, 151927. [Google Scholar] [CrossRef]
  30. Wang, G.; Wang, S.; Cao, Y.; Chen, Z. Design and performance evaluation of a novel hybrid solar-gas power and ORC-based hydrogen-production system. Energy 2022, 251, 123945. [Google Scholar] [CrossRef]
  31. Wang, G.; Wang, B.; Yuan, X.; Lin, J.; Chen, Z. Novel design and analysis of a solar PVT system using LFR concentrator and nano-fluids optical filter. Case Stud. Therm. Eng. 2021, 27, 101328. [Google Scholar] [CrossRef]
  32. Fang, J.; Liu, Q.; Guo, S.; Lei, J.; Jin, H. Spanning solar spectrum: A combined photochemical and thermochemical process for solar energy storage. Appl. Energy 2019, 247, 116–126. [Google Scholar] [CrossRef]
  33. Wang, G.; Wang, T.; Han, W. Cyclic and standby behavior evaluations of liquid lead-bismuth eutectic thermal energy storage tank for concentrated solar power. Case Stud. Therm. Eng. 2022, 29, 101729. [Google Scholar] [CrossRef]
  34. Muhammad, M.D. Review of PCMS and heat transfer enhancement methods applied in parabolic trough solar plants thermal storage systems. Niger. J. Technol. 2018, 37, 96–107. [Google Scholar] [CrossRef]
  35. Zhang, H.L.; Baeyens, J.; Degrève, J.; Cacères, G. Concentrated solar power plants: Review and design methodology. Renew. Sustain. Energy Rev. 2013, 22, 466–481. [Google Scholar] [CrossRef]
  36. Pramanik, S.; Ravikrishna, R.V. A review of concentrated solar power hybrid technologies. Appl. Therm. Eng. 2017, 127, 602–637. [Google Scholar] [CrossRef]
  37. Singh, G.K. Solar power generation by PV (photovoltaic) technology: A review. Energy 2013, 53, 1–13. [Google Scholar] [CrossRef]
  38. Wang, G.; Shen, F.; Wang, F.; Chen, Z. Design and experimental study of a solar CPV system using CLFR concentrator. Sustain. Energy Technol. Assess. 2020, 40, 100751. [Google Scholar] [CrossRef]
  39. Wang, G.; Zhang, Z.; Chen, Z. Design and performance evaluation of a novel CPV-T system using nano-fluid spectrum filter and with high solar concentrating uniformity. Energy 2023, 267, 126616. [Google Scholar] [CrossRef]
  40. Liu, Y.; Hu, P.; Zhang, Q.; Chen, Z. Thermodynamic and optical analysis for a CPV/T hybrid system with beam splitter and fully tracked linear Fresnel reflector concentrator utilizing sloped panels. Sol. Energy 2014, 103, 191–199. [Google Scholar] [CrossRef]
  41. Wang, G.; Wang, F.; Shen, F.; Chen, Z.; Hu, P. Novel design and thermodynamic analysis of a solar concentration PV and thermal combined system based on compact linear Fresnel reflector. Energy 2019, 180, 133–148. [Google Scholar] [CrossRef]
  42. Wang, G.; Dong, B.; Chen, Z. Design and behaviour estimate of a novel concentrated solar-driven power and desalination system using S-CO2 Brayton cycle and MSF technology. Renew. Energy 2021, 176, 555–564. [Google Scholar] [CrossRef]
  43. Khawaji, A.; Kutubkhanah, I.; Wie, J. Advances in seawater desalination technologies. Desalination 2008, 221, 47–69. [Google Scholar] [CrossRef]
  44. Charcosset, C. A review of membrane processes and renewable energies for desalination. Desalination 2009, 245, 214–231. [Google Scholar] [CrossRef]
  45. Mohammadi, K.; Saghafifar, M.; Ellingwood, K.; Powell, K. Hybrid concentrated solar power (CSP)-desalination systems: A review. Desalination 2019, 468, 114083. [Google Scholar] [CrossRef]
  46. Wang, G.; Wang, C.; Chen, Z.; Hu, P. Design and performance evaluation of an innovative solar-nuclear complementarity power system using the S-CO2 Brayton cycle. Energy 2020, 197, 117282. [Google Scholar] [CrossRef]
  47. Garcia, H.E.; Chen, J.; Kim, J.S.; Vilim, R.B.; Binder, W.R.; Sitton, S.M.B.; Boardman, R.D.; McKellar, M.G.; Christiaan, J.J.; Paredis, C.J. Dynamic performance analysis of two regional Nuclear Hybrid Energy Systems. Energy 2016, 107, 234–258. [Google Scholar] [CrossRef] [Green Version]
  48. Wang, G.; Yin, J.; Lin, J.; Chen, Z.; Hu, P. Design and economic analysis of a novel hybrid nuclear-solar complementary power system for power generation and desalination. Appl. Therm. Eng. 2021, 187, 116564. [Google Scholar] [CrossRef]
  49. Wang, G.; Cao, Y.; Wang, S.; Chen, Z.; Hu, P. Design and preliminary performance analysis of a novel solar-gas combined cycle system. Appl. Therm. Eng. 2020, 172, 115184. [Google Scholar] [CrossRef]
  50. Kodama, T.; Gokon, N. Thermochemical cycles for high-temperature solar hydrogen production. Chem. Rev. 2010, 72, 119–128. [Google Scholar]
  51. Li, Z.; Luo, W.; Zhang, M.; Feng, J.; Zhou, Z. Photoelectrochemical cells for solar hydrogen production: Current state of promising photoelectrodes, methods to improve their properties, and outlook. Energy Environ. Sci. 2013, 6, 347–370. [Google Scholar] [CrossRef]
  52. Wang, G.; Chao, Y.; Chen, Z. Promoting developments of hydrogen powered vehicle and solar PV hydrogen production in China: A study based on evolutionary game theory method. Energy 2021, 237, 121649. [Google Scholar] [CrossRef]
  53. Batidzirai, B.; Trotter, P.A.; Brophy, A.; Stritzke, S.; Moyo, A.; Twesigye, P.; Puranasamriddhi, A.; Madhlopa, A. Towards people-private-public partnerships: An integrated community engagement model for capturing energy access needs. Energy Res. Soc. Sci. 2021, 74, 101975. [Google Scholar] [CrossRef]
  54. Shrimali, G.; Sen, V. Scaling reliable electricity access in India: A public-private partnership model. Energy Sustain. Dev. 2020, 55, 69–81. [Google Scholar] [CrossRef]
  55. Smith, J. Evolution and the Theory of Games; Cambridge University Press: Cambridge, UK, 1982. [Google Scholar]
  56. Allen, B.; Lippner, G.; Chen, Y.; Fotouhi, B.; Momeni, N.; Yau, S.-T.; Nowak, M.A. Evolutionary dynamics on any population structure. Nature 2017, 544, 227–230. [Google Scholar] [CrossRef] [Green Version]
  57. Seven Carbon Markets in China. Available online: http://www.tanpaifang.com/tanhangqing/ (accessed on 1 February 2023).
  58. Chen, W.; Hu, Z. Using evolutionary game theory to study governments and manufacturers’ behavioral strategies under various carbon taxes and subsidies. J. Clean. Prod. 2018, 201, 123–141. [Google Scholar] [CrossRef]
  59. Administrative Committee of Beijing Economic and Technological Development Zone. Several Measures to Implement the New Development Concept and Accelerate the High-Quality Development of Yizhuang New Town, Ver. 3.0; Administrative Committee of Beijing Economic and Technological Development Zone: Beijing, China, 2021.
  60. China Association for Comprehensive Utilization of Resources. Research Report on Clean Production of China’s Photovoltaic Industry; China Association for Comprehensive Utilization of Resources: Beijing, China, 2020. [Google Scholar]
  61. Ministry of Ecology and Environment of the People’s Republic of China. Implementation Plan for Total Quota Setting and Allocation of National Carbon Emission Trading in 2019–2020 (Power Generation Industry); Ministry of Ecology and Environment of the People’s Republic of China: Beijing, China, 2020.
  62. State Administration of Taxation. Notice of the Ministry of Finance and the State Administration of Taxation on Vat Policies such as Input Tax Deduction of Leased Fixed Assets; State Administration of Taxation: Beijing, China, 2017.
Figure 1. Total carbon dioxide emissions of China from 2009 to 2021.
Sustainability 15 05388 g001
Figure 2. Problem model including the government, CEE, STPP and CTPP.
Sustainability 15 05388 g002
Figure 3. Evolutionary processes of the government, CEE, STPP and CTPP under different cooperative relationships: (a) (1, 1, 1, 1), (b) (1, 1, 1, 0), (c) (1, 1, 0, 1), (d) (1, 1, 0, 0), (e) (1, 0, 1, 1), (f) (1, 0, 1, 0), (g) (1, 0, 0, 1) and (h) (1, 0, 0, 0).
Sustainability 15 05388 g003aSustainability 15 05388 g003b
Figure 4. Evolutionary processes of the government, CEE, STPP and CTPP under different cooperative relationships: (a) (0, 1, 1, 1), (b) (0, 1, 1, 0), (c) (0, 1, 0, 1), (d) (0, 1, 0, 0), (e) (0, 0, 1, 1), (f) (0, 0, 1, 0), (g) (0, 0, 0, 1) and (h) (0, 0, 0, 0).
Sustainability 15 05388 g004aSustainability 15 05388 g004b
Figure 5. Influences of i1 under (1, 1, 1, 1): (a) on the CEE, (b) on the STPP.
Sustainability 15 05388 g005
Figure 6. Influences of i2 under (1, 1, 1, 1): (a) on the GOVT, (b) on the CEE, and (c) on the CTPP.
Sustainability 15 05388 g006aSustainability 15 05388 g006b
Figure 7. Impacts of i3 under (1, 1, 1, 0): (a) on the GOVT, (b) on the CEE, and (c) on the STPP.
Sustainability 15 05388 g007aSustainability 15 05388 g007b
Figure 8. Influences of i4 under (1, 0, 1, 1): (a) on the STPP, (b) on the CTPP.
Sustainability 15 05388 g008
Figure 9. Influences of i5 under (1, 0, 0, 1): (a) on the GOVT, (b) on the CTPP.
Sustainability 15 05388 g009
Figure 10. Influences of R under (1, 1, 1, 1): (a) on the GOVT, (b) on the CTPP.
Sustainability 15 05388 g010
Figure 11. Impacts of g under (1, 1, 1, 1): (a) on the GOVT, (b) on the STPP.
Sustainability 15 05388 g011
Figure 12. Influences of K under (1, 1, 1, 1): (a) on the GOVT, (b) on the CEE, (c) on the STPP, and (d) on the CTPP.
Sustainability 15 05388 g012
Table 1. Introduction of sixteen cooperative relationships.
CaseModeGOVT TeamworkCEE TeamworkSTPP TeamworkCTPP Teamwork
1(1, 1, 1, 1)YesYesYesYes
2(1, 1, 1, 0)YesYesYesNo
3(1, 1, 0, 1)YesYesNoYes
4(1, 1, 0, 0)YesYesNoNo
5(1, 0, 1, 1)YesNoYesYes
6(1, 0, 1, 0)YesNoYesNo
7(1, 0, 0, 1)YesNoNoYes
8(1, 0, 0, 0)YesNoNoNo
9(0, 1, 1, 1)NoYesYesYes
10(0, 1, 1, 0)NoYesYesNo
11(0, 1, 0, 1)NoYesNoYes
12(0, 1, 0, 0)NoYesNoNo
13(0, 0, 1, 1)NoNoYesYes
14(0, 0, 1, 0)NoNoYesNo
15(0, 0, 0, 1)NoNoNoYes
16(0, 0, 0, 0)NoNoNoNo
Table 2. Initial parameters for the EGT analysis.
ParticipantsParametersValues
GOVTk16.0%
k26.0%
k36.0%
k46.0%
S1USD 50,000.0
S2USD 25,000.0
CEEi15.0 USD/t
i26.0 USD/t
i37.0 USD/t
C2150.0 t
STPPi45.5 USD/t
g30.0 USD/t
C133.0 t
CTPPi510.0 USD/t
GUSD 80,000.0
C3180.0 t
R10.0 USD/t
Disclaimer/Publisher’s Note: The statements, opinions and data contained in all publications are solely those of the individual author(s) and contributor(s) and not of MDPI and/or the editor(s). MDPI and/or the editor(s) disclaim responsibility for any injury to people or property resulting from any ideas, methods, instructions or products referred to in the content.

