Abstract
In this study, two different cooling systems for the thermal management of a photovoltaic (PV) module were developed. A PV/thermoelectric generator (TEG) and PV/TEG-mini-channel cooling systems were considered; in the later system, water and water-based nanofluids were used in the cooling channel. The effective cooling of the PV module was achieved by using higher-loading nanoparticles in the base fluid, while the nanofluid exhibited a non-Newtonian behavior. The PV/TEG with a cooling channel system was numerically assessed with respect to various values of Reynolds numbers (between 5 and 250), inlet nanofluid temperatures (between 288.15 K and 303.15 K), and nanoparticle volume fractions in the base fluid (between 1% and 5%). Variations in average cell temperature, PV power, TEG power, and efficiencies were computed by varying the pertinent parameters of interest with Galerkin’s weighted residual finite element method. The most favorable case for cooling was obtained with TEG-cooling channel at = 5% and Re = 250. In this case, PV electrical power increased by about 8.1% and 49.2% compared to the PV/TEG and PV system without cooling, respectively. The TEG output power almost doubled when compared to the PV/TEG system for all channel models at Re = 250. The inlet temperature of the nanofluid has a profound impact on the overall efficiency and power increment of the PV module. The use of the PV/TEG-cooling channel with the lowest fluid inlet temperature (288.15 K) and nanofluid at the highest particle loading ( = 5%) resulted in a PV efficiency increment of about 52% and 10% compared to the conventional PV system without cooling and the PV/TEG system. In this case, the TEG efficiency rises by about 51% in the PV/TEG nanofluid model compared to the PV/TEG model.
1. Introduction
New energy technologies have been developed and implemented to solve the current energy problem. This is extremely important due to the need for cheaper energy sources and environmental concerns. With the awareness of environmental pollution, clean sources are being sought for use in energy technologies. The exploitation of solar energy, which is among these sources, is more attractive than other clean energy sources. Photovoltaic (PV) technology enables us to produce electrical energy from solar energy. PV systems, which produce electrical energy directly from the radiation emitted by the sun, are attracting attention as very environmentally friendly applications. Although such systems constitute very useful technology, there is a decrease in performance and energy efficiency in PV systems with a rising cell temperature. Many passive and active methods have been developed over the years to control the temperature of PV systems [1,2,3,4,5,6]. Heat pipes, fins of various types, and phase change materials are considered to be some of the available passive methods [7,8]. Mini-channel cooling and impingent jets are some of the available active methods [9,10,11,12]. Compared to the passive methods, active ones provide higher cooling rates [13]. In some studies, both methods are considered together to achieve higher cooling efficiencies [14,15].
A thermoelectric generator (TEG), which is a clean system very similar to PV technology, can also be included in solar energy technologies. The conversion of the waste heat energy generated during the conversion of light energy from the sun into electrical power in PV systems using a TEG allows for the simultaneous production of electricity from the two systems. Unlike the PV effect, a TEG uses thermoelectric effects for electrical power generation. In energy conversion (from heat to electricity), where the Seebeck effect, which is a thermoelectric effect, is dominant, the temperature difference required for the operation of a TEG can be provided by PV/TEG integration. In addition, this integration helps to prevent the loss of efficiency caused by the overheating of the PV cell.
In studies on PV/TEG systems, the heat source component of the temperature difference, which is an important factor for the operation of a TEG, consists of the PV system, while the heat sink component differs in this respect. Systems that provide a heat sink function with the help of a channel have drawn the most attention among these models. The integration of a TEG with a channel has been considered in many studies [16,17,18,19]. The power generated by a TEG module depends upon the construction material used, the geometry of the TEG, the operating conditions in the channel (such as the flow rate), thermal boundary conditions, and others. Many different methods have proposed to increase the effectiveness of a TEG with respect to channel flow, such as using obstacles in channels, flow pulsations, rotating objects, and many more [20,21]. Since the selection of the fluid in the channel offers us many options, it can provide convenience in terms of obtaining the optimum model. In this study, water and water-based nanofluids were used to cool a TEG and a PV system. Nanofluids, which were introduced in the context of nanotechnology, constitute a new type of engineered fluid that has favorable properties as a result of the dispersal of very small nano-sized solid particles into a base fluid. Nanofluids are included in many renewable energy technologies, especially because of their favorable thermophysical properties that are ideal for improving cooling performance [22,23,24,25]. Over the years, many advancements have been achieved in nanofluid technology and in its implementation in different renewable energy systems [26,27,28]. Many advanced simulation tools have been developed to more comprehensively understand the role nanofluids in energy systems [29,30,31].
There are also many studies that include nanofluid applications in PV/TEG systems. Rajaee et al. [32] investigated the application of a nanofluid (with 0.25, 0.5, and 1% volume fractions) and water in a PV/TEG system. They concluded that a 10.91% higher level of electric power generation was achieved with the nanofluid (1% volume fraction) compared to water. Kolahan et al. [33] used an /water nanofluid (0.2 wt%) in Photovoltaic thermal (PVT) generator and a PVT–TEG. They achieved the best energy efficiency ratio at the lowest mass flow rate of 0.001 kg/s (laminar flow). Although the electrical power produced in the PV cell was the same in both systems examined, the PVT–TEG hybrid system showed an enhancement of approximately 2.5–4% in electrical energy efficiency compared to the PVT system. Soltani et al. [34] investigated the effect of water-based and Si nanofluids on a PV/TEG. The best results were obtained with the water-based Si nanofluid. Rajeb et al. [35] compared a concentrated photovoltaic thermal (CPVT)/TE nanofluid (0.5% water-based graphene) with CPVT/TE, CPVT/TE-water, and CPVT systems. They concluded that the exergy production with the CPVT/TE nanofluid and CPVT/TE-water systems increased by 4.88% and 0.68% compared to the CPVT system in summer conditions. Akbar et al. [36] compared the natural air flow properties using water, water-based Ag, and Si nanofluids in a PV/TE system. They achieved increases of 40.54%, 50.53%, and 18.23% in the total power of the PVT/TE compared to natural air flow with water-based Si, water-based Ag, and water, respectively. Some other studies that consider the effectiveness of using nanofluids for TEG, PV, and compound TEG + PV systems can be found in various sources [37,38,39,40]. The increment in the overall system performance depends upon the type of nanoparticle and its shape, the type of base fluid, and, more importantly, the loading amount in the base fluid.
In this study, the cooling of a 3D PV with a mounted TEG unit is analyzed by using computational fluid dynamics (CFD). In the cooling channels, alumina-water is considered as the heat transfer medium while the fluid is considered non-Newtonian (i.e., the type of power law). As the nanoparticle loading increases, more effective cooling is achieved and the non-Newtonian behavior of the nanofluid is observed. PV systems with a TEG and with a cooling channel +TEG are compared by using the reference case of an uncooled PV system in the numerical model. The impacts of using different flow rates in the cooling channel and loading concentrations of nanoparticles in the cooling fluid on the average cell temperature, generated output powers, and efficiency are numerically assessed. To the best of the authors’ knowledge, PV thermal management using channel flow with a power law nanofluid at higher nanoparticle loadings influenced by a TEG has never been considered. The outcomes of the current work are helpful for the design and development of cooling systems and the achievement of optimal PV properties in related studies. As the CFD offers many flexibilities in terms of the parametric design of PV systems and their cooling systems, such as variations in the geometric, material, and operating parameters, the current work can be extended to address the needs of other applications.
2. System Design
The PV system consists of a polycrystalline silicon cell and EVA (ethylene vinyl acetate) placed on the top and bottom of this cell, for which the top layer is glass, and the bottom layer is TPT (tedlar polyester tedlar), thus amounting to a total of five components [41]. Figure 1. presents the schematic diagram of the designed PV module.
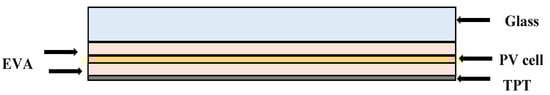
Figure 1.
Schematic diagram of the PV module.
EVA acts as an adhesive for TPT in the bottom layer, while the glass in the top layer and silicon cell in the middle layer of the system acts as layers with high permeability and resistance to UV light [42]. The PV cell, which is composed of semiconductor material, enables the generation of electrical energy directly from solar radiation by absorbing photons and creating current [43,44]. The glass layer, which provides mechanical strength and safety to the PV system, provides protection against adverse environmental effects [45]. In addition, solar radiation first contacts the glass layer, where, after the radiation is absorbed, some of it is reflected and the rest is transmitted to other PV layers [46]. TPT, located in the bottom layer, protects the PV layers against dust, wind, and harmful substances [47]. The CPV system, which facilitates greater electricity production by concentrating solar light in the PV cells, unlike a conventional PV system, has been applied in this study [48].
Material properties are an important factor with respect to PV performance. In this study, the properties of the materials that constitute the PV system are presented in Table 1.

Table 1.
Thermophysical properties of PV system’s components [49].
A TEG is mounted on the back surface of the TPT layer, and the waste heat released from the PV module provides the temperature difference that allows the TEG to perform thermoelectric energy conversion at this point. The Seebeck effect, whose discovery dates back to the 1820s, explains that voltage is produced by the formation of a certain temperature difference, and with the development of this discovery, the design of the TEG, whose operation is achieved through this effect, was facilitated [50]. To realize the Seebeck effect, p- and n-type semiconductor materials are used. These materials form thermoelectric legs in the design of a TEG, and the conversion of heat to electricity is carried out through these legs. In the design of a TEG, the semiconductor legs are connected electrically in series and thermally in parallel, thereby allowing higher electrical potential values to be achieved [51]. While conductors provide the electrical connection between the thermoelectric legs, insulation is achieved by placing the leg conductors between two ceramic plates (hot and cold side) [52]. Current flow occurs through this system, which is connected to an external circuit load as shown in Figure 2.
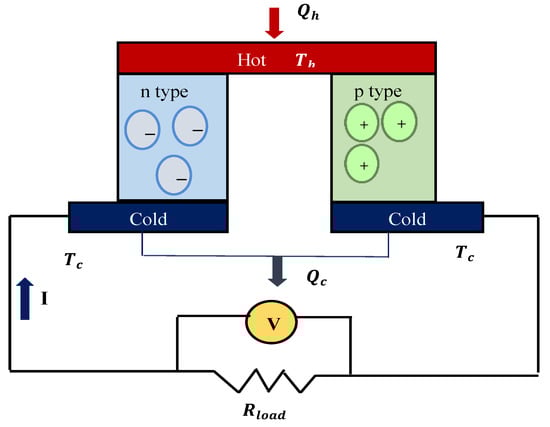
Figure 2.
Schematic diagram of the TEG.
Material properties constitute a significant factor in thermoelectric energy conversion. In particular, the figure of merit (ZT) values of the semiconductor legs determine the TEG’s efficiency. The temperature-dependent ZT value of the semiconductor legs [53] and the Seebeck coefficient (S) of the semiconductor material are as follows [54]:
where k, S, and denote thermal conductivity, the Seebeck coefficient, and electrical conductivity, respectively. In this study, bismuth telluride ( was chosen as the material used for the thermoelectric legs. It is widely used in TEG applications and can perform energy conversion at low temperatures. Its large ZT demonstrates its high thermoelectric quality factor.
Since the electrical connection between the thermoelectric legs occurs via the electrodes, the electrodes are expected to have high electrical conductivity. In the model, we designed, copper (Cu), with high electrical conductivity, was considered the preferred choice of material for the electrodes. In the modeling of a TEG, the electrical conductivity of the ceramic layers providing electrical insulation should be low. In addition, these layers are in contact with the heat sink and heat source, rendering heat transfer performance an important parameter; accordingly, the materials must exhibit high thermal conductivity. Considering all these features, aluminum oxide ( was used for the ceramic plates. The thermophysical properties of the materials that constitute TEG are presented in Table 2.
Table 2.
Material properties of TEG system components [55].
In the TEG model, the ceramic plates on the bottom and top sides are placed between the PV module as the heat source and between the channels where fluid flow takes place as the heat sink, and the temperature difference is converted into electrical power. When the previous studies were examined, an absorbent layer was placed between the TEG and the channels to ensure that the cooling process reached the desired levels. In addition, the channels are covered with an insulating material and the losses are minimized. In the modeling of the PV/TEG system, the temperature difference was precipitated by positioning the TEG on the copper base. The copper base acted as a heat sink. The design of the PV/TEG and PV/TEG–channel model is shown in Figure 3.
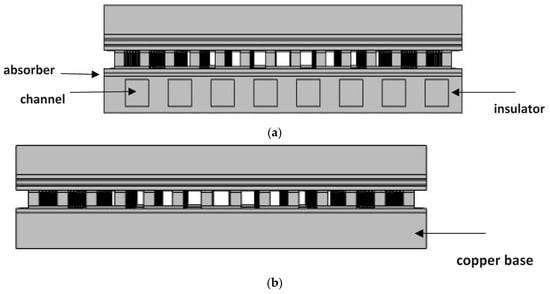
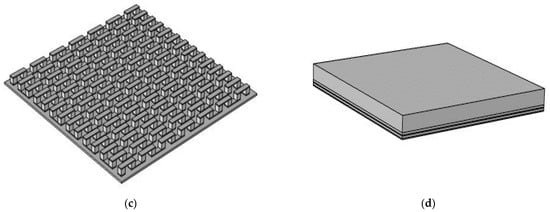
Figure 3.
(a) PV/TEG–channel, (b) PV/TEG, (c) TEG, and (d) PV configurations.
The surface areas of the components that constitute the PV system are equal. A total of 196 p- and n-type thermoelectric legs were used. The dimensions of the p- and n-type thermoelectric legs are equal, and the legs consist of the same material. Table 3 contains the dimensions of the PV/TEG system’s components.
Table 3.
Dimensions of PV/TEG system’s components.
In the PV/TEG–channel model, water and water-based nanofluids were used as the cooling fluids. The effects of these fluids on the PV system and TEG were investigated. Nanofluids have applications in many renewable energy systems. A nanofluid, which is frequently encountered, especially in cooling applications, enables the improvement of the performance of systems. Mixing solid particles with high thermal conductivity (usually a metal or metal oxide) and a base fluid creates these nanofluids. The volume fraction of solid particles () is an important factor with respect to the thermal performance of nanofluids. Therefore, in this study, the effects of three different volume fractions on PV/TEG performance were observed. Performance enhancement through the use of Newtonian nanofluids has been shown in previous studies for energy systems including PVs and TEGs. When nanoparticles with higher loading amounts are added to the base fluid, more effective cooling can be achieved, while a non-Newtonian behavior of the fluid can be observed. In this work, an alumina-water nanofluid exhibiting non-Newtonian nanofluid behavior is considered, for which the empirical constants for the description of the power law nanofluid were obtained from experimental study.
3. Mathematical Model
In a hybrid design, PV, TEG, and nanofluid systems are mathematically modeled in accordance with their respective roles. The photovoltaic effect offered by solar panels, the thermoelectric and thermodynamic processes of the TEG, the flow behavior of the nanofluid in the channel, and the heat transfer properties of the whole system will be formulated in this section. In addition, electrical models for the PV system and TEG will also be discussed in this section.
3.1. PV System
The governing equations that provide the temperature distributions of the glass, EVA, silicon cell, and TPT layers of the PV system are as follows [56]:
where , , and denote the density, thermal conductivity, and heat capacity of the PV layers, respectively. The electrical power produced per unit volume is expressed in and only pertains to the polycrystalline silicon cell layer of the PV system. Electrical power generation is realized by the volumetric solar energy absorption of the PV layers, , and this value is calculated for each layer.
To calculate the volumetric energy absorption in the PV layers, the solar radiation intensity () must first be determined. By determining the value, the amount of solar energy absorbed for each PV layer can be obtained. These calculated values are employed as the internal heat amounts of the PV layers. The amount of volumetric energy absorbed by each layer and, accordingly, the volumetric electrical power produced by the silicon solar cell is obtained through the following equations [57,58,59]:
where and are the area and volume of lth layer, respectively, and and are its absorptivity and reflectivity, respectively. is the internal heat source of the lth layer, and is the solar radiation intensity of each layer. Table 4 presents the optical properties of the PV components.
where and describe the efficiency of the PV system and the reference efficiency of the polycrystalline silicon layer, respectively. is the average temperature of the silicon cell, while is the reference temperature. is the temperature coefficient and is related to the reference temperature.
Table 4.
Optical properties of PV components [60].
3.2. TEG System
Although the working mechanism of a TEG is fundamentally related to the Seebeck effect, which is based on the generation of an electromotive force via the temperature gradient, this system is created when two other thermoelectric effects (Thomson and Peltier) accompany the Seebeck effect. These relationships are defined by the following equations [61]:
where , S, T, and describe the Peltier, Seebeck, temperature, and Thomson coefficients, respectively. Heat transfer via conduction for solids developed for a TEG can be described by Fourier’s law:
where ∇T is the temperature gradient, k is the thermal conductivity, and q is the heat flux through conduction.
Total heat flux and current density are represented as follows [62,63]:
where , and are total heat flux, current density, and electrical conductivity, respectively.
The amount of heat produced per unit volume is represented as follows:
The current density continuity equation is defined as follows:
According to the Seebeck effect and Ohm’s law, the electric field under the action of current and temperature is represented as follows [64,65]:
The extended energy conservation equation, including the Joule effect and Fourier’s law, is stated as:
The TEG takes advantage of the temperature difference for energy conversion produced via the Seebeck effect. The p- and n-type thermoelectric legs exposed to the temperature difference constitute the Seebeck open circuit voltage. The difference of the Seebeck coefficients of the negatively and positively charged semiconductor legs and the temperature gradient allow us to characterize the Seebeck voltage, which is described as follows [66]:
where is the Seebeck voltage, and and are the hot and cold side temperatures, respectively. The coupling of this simple thermoelectric process with external load resistance facilitates current flow, resulting in the following output voltage [67]:
where , , and are the output voltage, load resistance, and internal resistance, respectively. A relationship can be established between the obtained equation and the Joule heating law, and the current value of the TEG can be reached with the following relationship [68]:
where I denotes current. The relationship between open circuit voltage and output voltage can be represented as follows:
The output power of the TEG system can be described as follows:
The output power and the amount of heat absorbed on the hot side are used to calculate the TEG’s efficiency, which is represented as follows [69]:
3.3. Nanofluid
Nanofluid technology, which is developed through the use of nano-sized solid materials, provides a new type of fluid with superior thermophysical properties. Through its use, thermal conductivity, which is the determining factor of the thermal performance of these fluids, can reach higher values. Generally, the distribution of metal or metal oxide group solid materials into conventional fluids is preferred. In this work, an alumina-water nanofluid with different solid volume fractions of alumina is used. In addition, a non-Newtonian nanofluid model is considered.
The equations used to calculate the density and specific heat capacity of the nanofluid are represented below [70,71]:
The thermal conductivity of the water-based [72] can be represented as
where , , and are the density, specific heat capacity, and thermal conductivity of water, respectively, while , and, are the density, specific heat capacity, and volume fraction of the solid particle, respectively. In the present work, a power law nanofluid model is used.
In the channel flow where the alumina-water nanofluid is used as the cooling medium, 2D laminar flow equations are used. The fluid model is non-Newtonian (power-law-type) and a single-phase model of the nanofluid is used.
The dimensional equations that account for momentum, continuity, and energy are formulated for a steady, non-Newtonian, and laminar nanofluid are as follows [73]:
Continuity
x-Momentum
y-Momentum
z-Momentum
Energy equation
For non-Newtonian nanofluids, the Ostwald-de-Waele model is used, while the shear stress is represented as follows:
, which determines the apparent viscosity, is represented as follows [74]:
where m and n are the consistency and behavior index factor, respectively.
The relevant non-dimensional numbers are the Reynolds number (Re) and Prandtl number (Pr), which are represented as follows:
where H is the hydraulic diameter and is the inlet fluid velocity. The consistency and behavior index factor values according to the solid particle volume fraction are given in Table 5, and the nanofluid properties obtained with these values are given in Table 6 [75].
Table 5.
Values of the parameters m and n [75].
Table 6.
Thermophysical properties of water-based nanofluid at different volume fractions [75].
In this study, solid particles were used in three different volume fractions: 1%, 3%, and 5%.
3.4. Boundary Conditions
The assumptions used in the numerical analysis of the TEG integrated in the bottom surface of the PV system and the channel system acting as a heat sink on the bottom surface of the TEG are as follows:
- Heat transfer by radiation and convection takes place at the bottom (TPT) and top (glass) surfaces of the PV system.
Heat transfer via radiation and convection at the top and bottom surfaces of the PV [76,77,78] can be represented as follows:
where σ is the Stefan–Boltzmann constant, ε is the emissivity, T is the temperature of the PV, is the temperature of the surrounding air, and A is the surface area of the PV system.
- The radiative heat loss on the upper and back/lower surfaces of the PV system are considered to be the sky and ground, respectively.
Accordingly, the sky temperature used in the calculation of the radiative heat loss on the upper surface [79] can be represented as
- In heat transfer by convection, the heat transfer coefficient is twice as high on the upper surface than that on the lower surface [80]:
h = 5.82 + 4.07 v
- The polycrystalline silicon cell’s conversion efficiency and temperature coefficient at 298.15 K were defined as 16.8% and 0.0044 K−1, respectively [81].
- In all models, the concentration ratio value is fixed at C = 2.
- The surface areas of all the components constituting the PV system are equal.
- In the TEG, the electrical potential is equal to zero at the ground (n-type leg) boundary, and the current is equal to zero at the terminal (p-type leg).
- The dimensions of the p- and n-type thermoelectric legs are equal.
- In the PV/TEG system, the TEG is placed on the copper base. The copper base is subject to heat transfer via natural convection.
- The fluids in the channel are non-Newtonian nanofluids or water, which operate as a heat sink, while laminar flow conditions are considered at a Reynolds number ranging between 5 and 250.
- A water-based Al2O3 nanofluid exhibiting non-Newtonian fluid characteristics is used in three different volume fractions, namely, 1%, 3%, and 5%.
- The fluids in the cooling channel have six different inlet temperatures between 288.15 K and 303.15 K.
3.5. Solution Method
In this study, the Galerkin weighted residual finite element method (FEM) is employed as the solution method. The theory and basics for the problem formulation and solution steps in convective heat transfer problems have been well established and can be found in several sources [82,83]. In this method, field variable approximation is performed using different ordered Lagrange-type FEs. When they are used in the governing equations, the resulting residual (R) is zero:
where W denotes the weight function. We adopted the commercial Multiphysics software COMSOL [84] for the solution of the governing equations described above. To handle the numerical instability problem, the Streamline Upwind Petrov–Galerkin (SUPG) method is used, while the biconjugate gradient stabilized method (BIGCSTAB) is considered in the heat transfer and flow modules of the software. Conjugate heat transfer and AC/DC modules are used in the analysis of the models via COMSOL Multiphysics. A value of 10−7 is used as the convergence criterion when converged results are achieved.
3.6. Mesh Independence and Code Validation
Grid independence tests were performed to assure the mesh independence of the solution. In this case, since the computational cost is high, an optimal grid size is required for the multi-parametric multiphase 3D-CFD simulations. Figure 4a shows the average cell temperature variations considering various grid sizes from GR1 (coarse) to GR6 (finest) (for fixed values of Re = 250; Tg = 290.75 K). Grid system GR4 with 4,146,128 tetrahedral elements is selected, and its distribution is shown in Figure 4b.
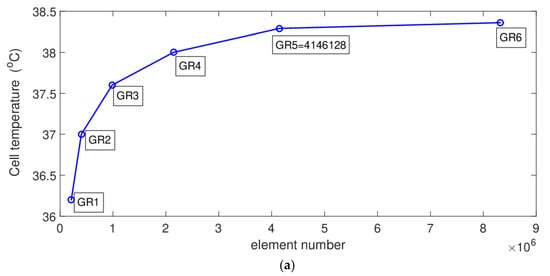
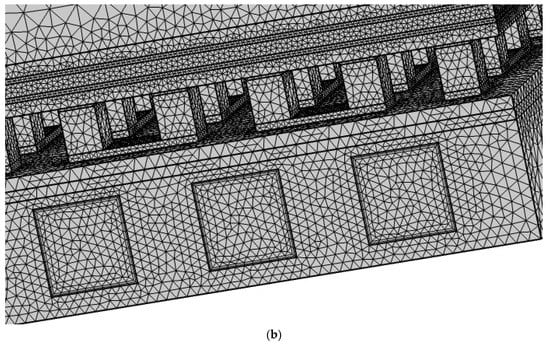
Figure 4.
(a) Mesh independence test: average cell temperature for different gird sizes (a) and grid distributions (b).
Validation of the code was performed by considering simulations of the PV and TEG systems. In the first study, the experimental results obtained by Ref. [85] are used. In the mentioned work, a PV module with porous fins was examined, and experimental results from un-finned configurations were used. The average cell temperature from 9:00 to 15:00 is shown in Figure 5. The maximum temperature obtained was 50 °C at 13:00, while this value is 48 °C in the current study; thus, the overall agreement is satisfactory. In another validation test, the experimental data from Ref. [86] are used when thermo-electric energy conversion is studied. Figure 6 presents the comparison results of the generated TEG power with a varying hot side temperature. The cold side was kept at 303 K. A maximum difference below 8% was obtained between the results.
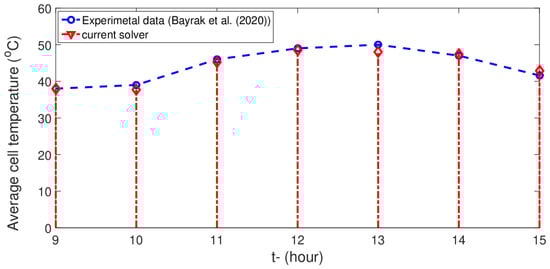
Figure 5.
Average PV cell temperature comparisons between the results available in Ref. [85].
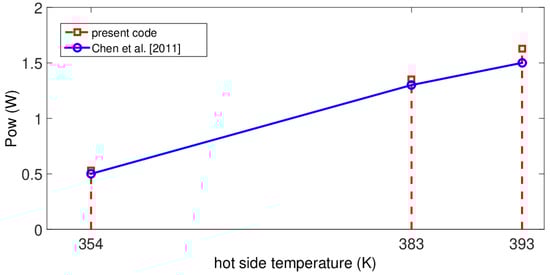
Figure 6.
Comparison of TEG power (using results in Ref. [86]) with varying hot side temperature wherein cold side is kept at 303 K.
As for the other validation, the results of Shittu et al. [79] were used, wherein PV-TEG cooling was considered. In the referenced study, the effects of the concentration ratio, outdoor temperature, and wind speed factors on a PV/TEG’s temperature distribution and electrical power were examined. The temperature and electrical potential distributions of the referenced model (C = 6) of the TEG-PV and the current work are shown in Figure 7. The overall level of agreement between the results is adequate.
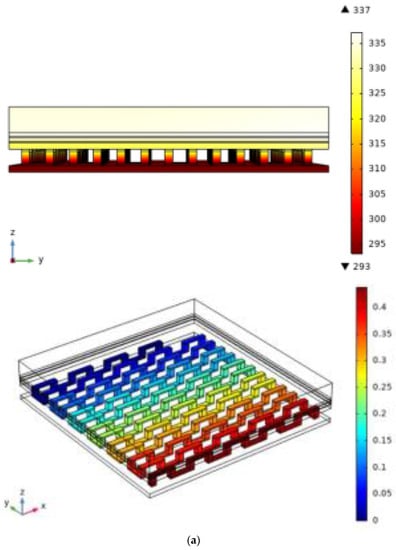
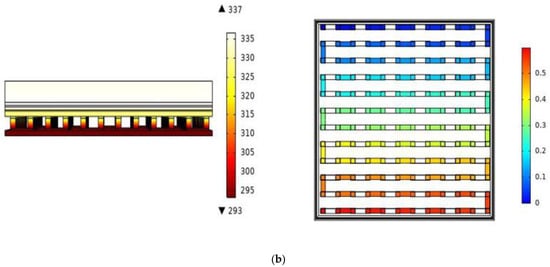
Figure 7.
PV/TEG temperature distribution (in K) and electric potential distribution (in V) for (a) reference model (Ref. [79]) and (b) model designed in this study.
4. Results and Discussion
An analysis of the PV/TEG–nanofluid hybrid system was performed, and the results are reported in this section. Accordingly, the variation in temperature, which is an important factor affecting the operating performance of the PV and TEG systems, with the fluid type and varying operating parameters will be investigated. In addition, the effects of the inlet temperature of the nanofluid flowing in the cooling channel are numerically assessed. Water and water-based nanofluids are used as the cooling fluid. The volume fraction of the water-based nanofluid has three different values in terms of (%): 1, 3, and 5.
When water is used as the cooling fluid at a 293.15 K inlet temperature, seven different Reynolds numbers (between 5 and 250) are considered, and variations in the temperature and TEG voltage distribution are assessed. The temperature distribution and TEG electrical potential distribution of the PV/TEG channel system solved with water and nanofluid ( = 5%) are presented in Figure 8. An increase in the Re has a positive effect on the temperature drop and, therefore, on the PV and TEG systems’ electrical potential values. The degree of thermal transport is enhanced by increasing the nanofluid and water velocity, while the cold side temperature of the TEG decreases with a higher Re. When nanofluid is used as the cooling medium in the channel, the temperature decrements become even lower. This is attributed to the favorable features of using nanofluid, for which a viscosity increment results in a higher fluid velocity and a higher level of thermal conductivity results in a colder temperature of the TEG–channel interface.
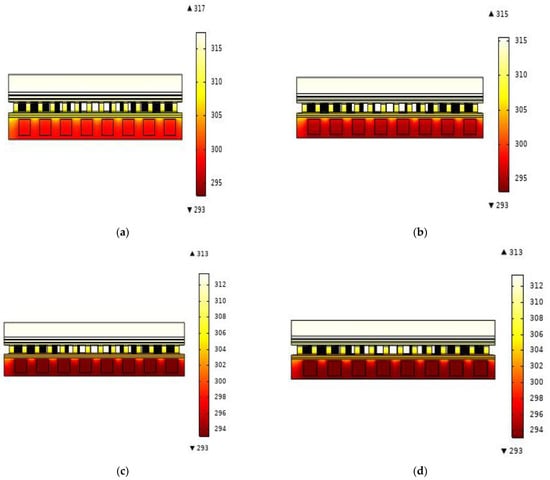
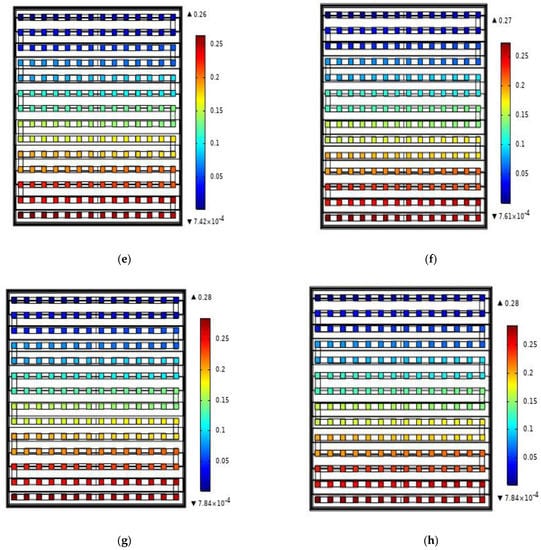
Figure 8.
Temperature (in K) distribution of PV/TEG–channel system at Re = 5 for (a) water and (b) nanofluid ( = 5%) and at Re = 250 for (c) water and (d) nanofluid ( = 5%). TEG electrical potential distribution at Re = 5 for (e) water and (f) nanofluid ( = 5%) and at Re = 250 for (g) water and (h) nanofluid ( = 5%).
When the Re was increased from Re = 5 to Re = 25, the maximum temperature of the system showed a decrease of about 2 °C when water was used, while the TEG electric potential increased from 0.264 V to 0.278 V. When the nanofluid is used, the potential of the temperature decrement and the increase in the TEG electric potential decrease compared to when water is used as the cooling medium in the channel. However, using the nanofluid results in a 4 °C temperature drop at Re = 5 and Re = 25, while the increments in the electric potentials become 0.2 V and 0.1 V. When the conventional PV and PV/TEG model systems are considered, the use of the water-cooled mini-channel at Re = 5 results in 45.63% and 5.51% PV electrical power increments. When the TEG powers are compared, the PV/TEG-water system presents an increase of approximately 35% in output power compared to the PV/TEG system. In addition, there is an increase of 45.7% and 7.7% in PV efficiency when the PV/TEG-water system is compared to the individual PV and PV/TEG systems, respectively.
In the PV/TEG–channel model, the TEG electric potential is calculated as 0.268 V and 0.285 V for Re = 5 and Re = 250 when the nanofluid volume fraction is = 1%. This 6.3% increase in TEG electrical potential results in a 13.2% increase in TEG output power at Re = 250 compared to Re = 5. When the solid volume fraction of the nanofluid is 1% at Re = 250, increases of 49% and 8.1% are obtained in PV electrical power compared to the PV and PV/TEG systems, respectively.
The temperature distribution of the PV/TEG–channel is an important parameter for both PV and TEG performance. Figure 9 shows the effect of water and nanofluids of different volume fractions on the electrical power of the system. The volume fraction of the water-based nanofluid has three different values in terms of (%): 1, 3, and 5. Considering all four fluid cases, the optimal cooling effect is achieved with the PV/TEG-nanofluid ( = 5%). The increase in the nanofluid volume fraction has lesser effects on the performance improvement of the system. However, when compared with the other PV/TEG–channel models, it can be seen that there are more significant differences (cell temperature) at Re = 5. At Re = 5, the effect of the fluids on the temperature distribution of the system differed, while at = 5% nanofluid, the system temperature drops to a greater degree compared to the other fluids.
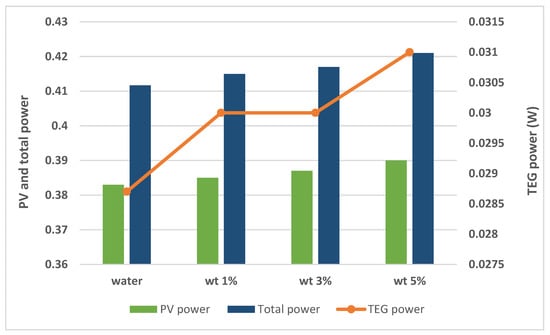
Figure 9.
The effect of water and nanofluid in different volume fractions on PV and TEG electrical power at Re = 5.
Figure 10 shows the effect of using different fluids in the PV/TEG–channel system on the average temperature variation of the silicon cell at different Reynolds numbers. At a higher Re, the discrepancy between the different fluid types’ effect on the average surface temperature becomes similar, while higher deviations are seen at the lower Re levels. Higher improvements are achieved when increasing the solid volume fractions of the nanofluid. Compared to using water at the lowest Re, the use of nanofluid with a 5% solid volume fraction results in a 4 °C temperature drop in the PV cell.
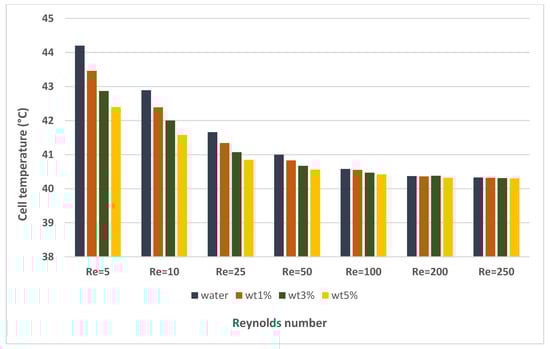
Figure 10.
Effect of fluids on cell temperature (in °C) at different Reynolds numbers.
Figure 11 presents the PV and TEG electrical power obtained for the PV/TEG–channel models at different Re values. The increase in Re enabled improvements in both PV and TEG performance, which were caused by the higher fluid velocities and increased transport capacities. This resulted in a lower cooling temperature of the TEG on the cold side, while its output power was higher.
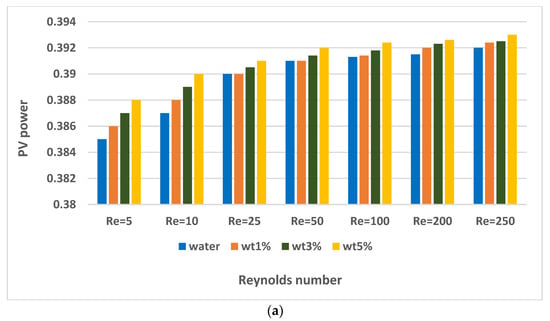
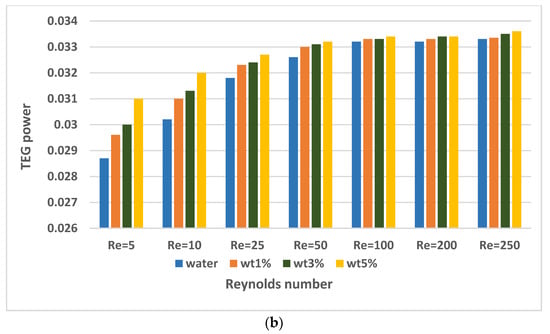
Figure 11.
Effect of water and nanofluid on (a) PV and (b) TEG electric power at different Reynolds numbers.
The PV and TEG electrical power values obtained from the PV, PV/TEG, and PV/TEG–channel models are shown in Figure 12. The highest total power was achieved when = 5% and Re = 250, followed by the PV/TEG-water, PV/TEG, and PV systems. The incorporation of the TEG in the PV system resulted in a 45.7% increase in total power. When the cooling mini-channel was introduced in the system, the power increments rose to 62.6% with water and 63.8% with nanofluid at the highest solid volume fraction.
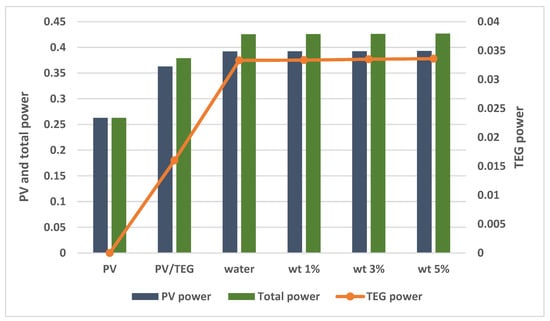
Figure 12.
Electrical power values obtained with PV/TEG–channel (at Re = 250), PV/TEG, and PV systems.
The efficiency levels of the TEG and PV systems are shown in Figure 13 in different Re and fluid cases. In the PV/TEG-water system, the PV and TEG efficiency are increased by 1.8% and 7.3%, respectively, when the Re is increased from Re = 5 to 250. In the PV/TEG-nanofluid system ( = 5%), these improvements were 1.1% and 4.1% for PV and TEG efficiency, respectively. Thus, the potential effect of using nanofluid at a low solid volume fraction or using only water at a lower Re on the increase in efficiency became greater. In the cases with a higher nanoparticle loading and higher Re, the average cell temperature variations decrease while the resulting mass flow rate increases. However, higher efficiency values were obtained at Re = 250 in the nanofluids used in other volume fractions ( = 1, 3%). A higher nanoparticle loading results in a lower cell temperature; therefore, the PV efficiency increases. The cell temperature is lower for higher increases in Re and PV efficiency. The thermal transport in the mini-channels that carry cold nanofluid increase when using a higher loading amount of nanoparticles and increasing the Re values, which results in higher efficiencies of the TEG module.
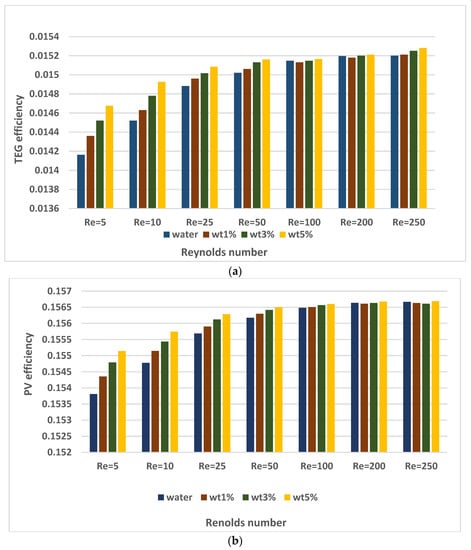
Figure 13.
(a) TEG and (b) PV efficiency at varying Reynolds number values.
The results regarding the different cases of cooling compared with the uncooled PV case in terms of efficiency are shown in Figure 14. Higher PV efficiencies are obtained when the cooling of the channel with either water or nanofluid is introduced along with the TEG module. Without cooling, the PV efficiency obtained is 0.105, while the use of the TEG and TEG-channel systems with nanofluid (Re = 250) results in efficiencies of 0.145 and 0.157.
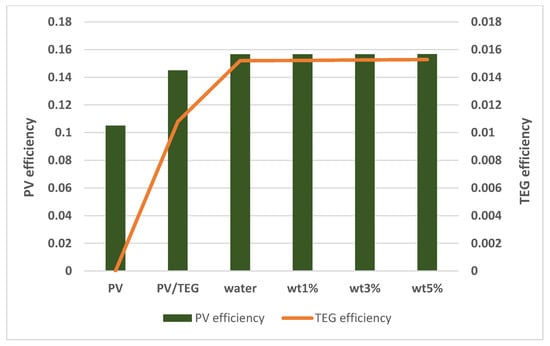
Figure 14.
PV and TEG efficiencies obtained with PV, PV/TEG, and PV/TEG–channel systems (at Re = 250).
Another parameter that can be considered an improvement of the PV system’s performance is the cooling fluid inlet temperature. The capacity of the PV/TEG–channel system with water and nanofluid (φ = 5%) is considered at six different inlet temperatures (between 288.15 K and 303.15 K). The inlet temperatures of 288.15 K, 290.65 K, 293.15 K, 295.65 K, 298.15 K, and 303.15 K are represented as , , , , ,, respectively. The solar cell temperatures obtained at these input temperatures are shown in Figure 15. The performance value of the PV/TEG–channel system reaches its maximum value at the lowest inlet temperature for both the water and nanofluid channel systems. There is an approximately 10.4 °C average cell temperature increase when the cooling channel cases with the lowest (T1) and highest (T6) values are compared with respect to their use of water or nanofluid. The water-based nanofluid exhibits better cooling performance than water at a lower Re. However, with the increase in Re, the performance difference between these two fluids decreases and they have almost the same effect on the PV and TEG power. Parallel to the increase in the fluid inlet temperature, the PV cell temperature also increases.
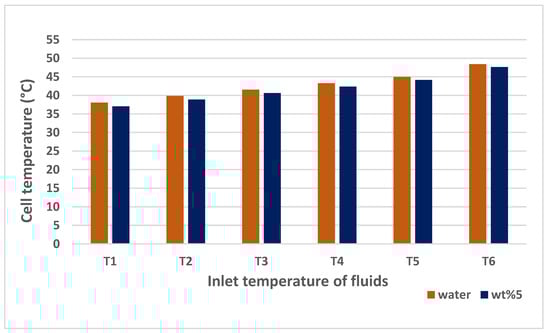
Figure 15.
Effect of different fluid inlet temperatures (in K) on PV cell temperature at Re = 25.
Figure 16 shows the temperature and voltage distributions of the PV/TEG-water system when using the lowest and highest fluid inlet temperatures. There is a significant drop in the maximum temperature of the systems of up to 12 °C when the fluid inlet temperatures and velocity are changed simultaneously. The TEG electrical potential values obtained at the and temperatures in the PV/TEG nanofluid system (at Re = 250) were calculated as 0.31 V and 0.246 V, respectively. Accordingly, the TEG output power was increased by 35.12% in compared to the case with an inlet temperature of .
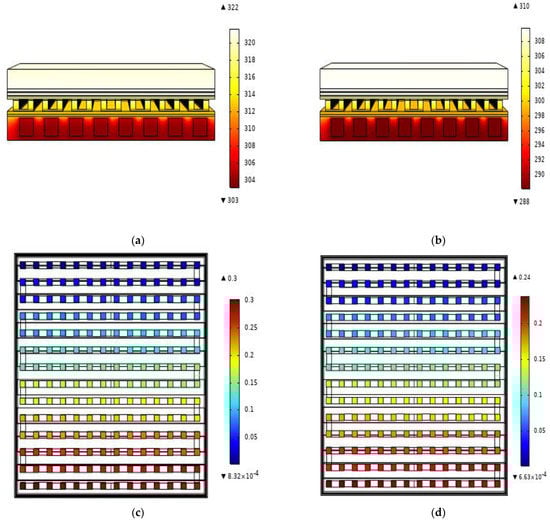
Figure 16.
The temperature (in K) distribution obtained with (a) at Re = 25, (b) at Re = 250, and voltage distribution obtained with (c) at Re = 25 and (d) at Re = 250.
When the PV/TEG-nanofluid system was used, TEG electrical potential increased by approximately 27.5% at Re = 250 with an inlet temperature of compared to the case at Re = 25 with a temperature of . Among the analyzed systems, the best performance values were obtained with the PV/TEG-nanofluid systems with lower inlet temperatures in the cooling channel.
The change in PV and TEG electrical power depending on the inlet temperature of the cooling fluid obtained from the water and nanofluid models is presented in Figure 17. When the water inlet temperature was increased from to at Re = 250, the PV electrical power decreased by 5.3%. The increase in the fluid inlet temperatures adversely affected PV and TEG performance. The use of nanofluid with higher inlet temperatures results in fewer cooling impacts of the channels, while the temperature difference for the TEG systems becomes greater and thus lower power generation from the TEG can be expected. As the cooling effect is reduced with a higher nanofluid inlet temperature, a higher cell temperature will be observed while the generated PV power will be reduced. When the analyses between the cases of water at a 288.15 K inlet temperature and the PV/TEG-water model (Re = 250) at a 293.15 K inlet temperature are compared, it is evident that an increase of approximately 6.5% in the TEG electrical potential was achieved. Under the same conditions, when nanofluid (φ = 5%) was used, this increase was approximately 8%. In the PV/TEG-water model (Re = 250), when the fluid inlet temperature of 288.15 K increased to 293.15 K, the PV and TEG electrical power decreased by 2% and 13.7%, respectively. In the PV/TEG-nanofluid (Re = 250 and φ = 5%) model, when the 288.15 K fluid inlet temperature increased to 293.15 K, the PV and TEG electrical power decreased by 2.3% and 15%, respectively.
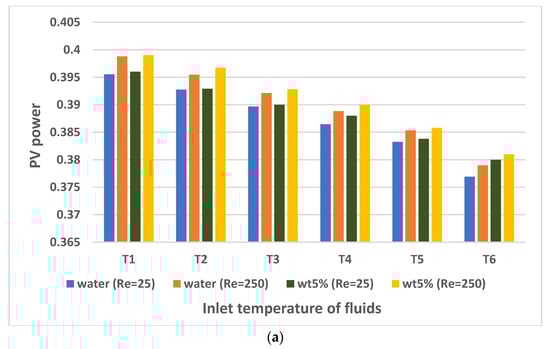
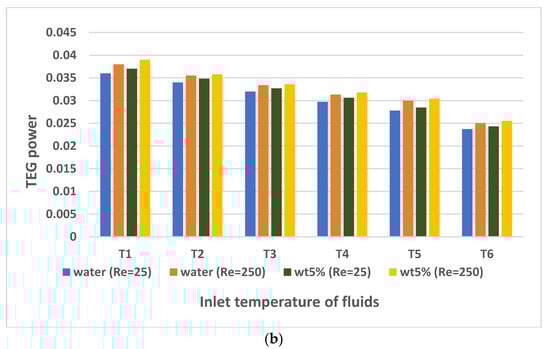
Figure 17.
Effect of different fluid inlet temperatures (in K) and Reynolds numbers on (a) PV and (b) TEG electrical power.
Figure 18 shows the effects of the inlet temperature of the fluids on PV efficiency. In the PV/TEG-water system at Re = 25, increasing the inlet temperature from 288.15 K to 303.15 K resulted in a reduction in PV efficiency of about 4.6%, which was 5.7% at Re = 250. The PV efficiency in the PV/TEG-nanofluid system is increased by 5.4% and 5.1% at Re = 25 and Re = 250, respectively, when the nanofluids with the highest and lowest inlet temperatures are compared.
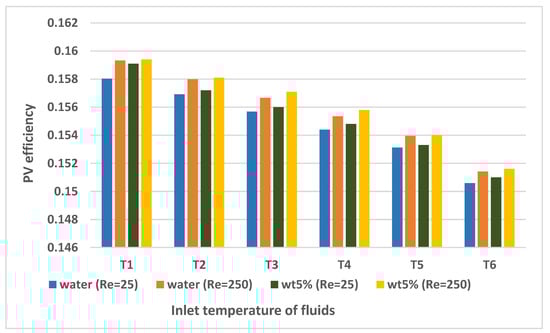
Figure 18.
The effect of fluids with different inlet temperatures (in K) and Reynolds numbers on PV efficiency.
When all the cases of different cooling systems are compared, it is clear that the best results were achieved through the use of the PV/TEG–channel models with a cooling channel and by incorporating the water-based nanofluid at the highest solid volume fraction. In terms of Re and inlet temperature, the best performance was obtained at Re = 250 and T = 288.15 K. In this model (PV/TEG + cooling channel system), the electrical potential value of the TEG was increased by about 54.6% compared to the PV/TEG system, while the maximum temperature decrement was 19 K. The PV/TEG-nanofluid model achieved 52.1% and 10.2% increases in PV electrical power compared to the conventional PV and PV/TEG system, while the PV efficiency was increased by 52% and 10%. In the literature, applications of nanofluids in PVT and PVT-TEG have been considered. As different nanoparticle types have been used, different degrees of improvement in efficiency were reported. An /water nanofluid (0.2 wt%) was used in [33] for PVT and PVT-TEG systems. They noted an increment of 2.5–4% in electrical energy efficiency when comparisons were made with a PVT system. In the work of Ref. [35], different nanoparticle types (0.5% water-based graphene) were used for a performance analysis of a CPVT/TE system. They obtained an exergy production increase of 4.88% for CPVT/TE-nanofluid compared to CPVT in summer conditions.
5. Conclusions
In this study, a PV cooling system was proposed using a TEG and a TEG + cooling channel. A non-Newtonian nanofluid, alumina-water, was employed in the cooling channel with various nanoparticle loadings in the base fluid. Some of the important outcomes of the analysis can be listed as follows:
- Among the PV, PV/TEG, and PV/TEG–channel models, the best performance was obtained with the channel model system. The PV/TEG–channel system enabled improvements in both PV and TEG performance.
- When different fluids were evaluated in the PV/TEG–channel model, the best cooling performance was obtained with the nanofluid at a φ = 5% volume fraction. The use of nanofluids facilitates better cooling performance compared to the use of only water in the channel.
- When the Re values were increased, the performance of both the PV and TEG systems was positively affected. However, after a certain value, the effect of this increase on performance gradually decreased.
- At Re = 250, the PV electrical power obtained with the PV/TEG-water system increased by 48.6% and 7.7% when compared to the conventional PV and PV/TEG systems, while these values were 8.1% and 49.2% when the PV/TEG-nanofluid (φ = 5%) system is considered.
- When the PV/TEG–channel systems were used, the TEG output power almost doubled compared to the PV/TEG system’s output power.
- In the PV/TEG-water system, the PV and TEG efficiency increased by 1.8% and 7.3%, from Re = 5 to 250, while these improvements were 1.1% and 4.1% for the PV/TEG-nanofluid system (φ = 5%).
- At Re = 250, the TEG efficiency in the PV/TEG-nanofluid (φ = 5%) system rose by about 39% compared to the PV/TEG system.
- Significant impacts of the inlet fluid temperatures in the cooling channel on the PV system’s performance were observed. The highest performance value among all models was obtained with the PV/TEG-nanofluid system at the lowest inlet temperature (288.15 K).
- For the nanofluid model with a temperature of 288.15 K, the TEG voltage value rose by 54.6% compared to the PV/TEG system. The PV efficiency increments obtained for the PV/TEG-nanofluid model with the lowest nanofluid inlet temperature were 52% and 10% greater than the conventional PV and PV/TEG systems.
- A possible extension of this work may include entropy generation and exergy analysis.
- Different TEG materials and nanomaterials can be used. It is also possible to include different environmental boundary conditions (e.g., solar radiation, wind velocity, and ambient temperature), and PV system performance in different regions can also be assessed.
- Failure and characteristics of crystalline PV modules under the impacts of high temperatures, low humidity conditions, and other extreme conditions can be considered in extensions of the current work [87,88].
Author Contributions
Conceptualization, F.S.; methodology, F.S. and D.O.; software, F.S. and H.F.Ö.; validation, D.O. and H.F.Ö.; formal analysis, F.S., D.O. and H.F.Ö.; investigation, F.S., D.O. and H.F.Ö.; writing—original draft preparation, F.S. and D.O.; writing—review and editing, F.S., D.O. and H.F.Ö.; visualization, F.S. and D.O.; supervision, F.S. and H.F.Ö. All authors have read and agreed to the published version of the manuscript.
Funding
This research received no external funding.
Institutional Review Board Statement
Not applicable.
Informed Consent Statement
Not applicable.
Data Availability Statement
Not applicable.
Conflicts of Interest
The authors declare no conflict of interest.
References
- Zhou, Y. Demand response flexibility with synergies on passive PCM walls, BIPVs, and active air-conditioning system in a subtropical climate. Renew. Energy 2022, 199, 204–225. [Google Scholar] [CrossRef]
- Khalid, M.; Shanks, K.; Ghosh, A.; Tahir, A.; Sundaram, S.; Mallick, T.K. Temperature regulation of concentrating photovoltaic window using argon gas and polymer dispersed liquid crystal films. Renew. Energy 2021, 164, 96–108. [Google Scholar] [CrossRef]
- Gholami, Z.; Rahmati, M.H.; Arabhosseini, A.; Gharzi, M. Combined cooling of photovoltaic module integrated with thermoelectric generators, by using earthenware water tank and ultrasonic humidifier: An experimental study. Sustain. Energy Technol. Assess. 2022, 53, 102601. [Google Scholar] [CrossRef]
- Homlakorn, S.; Suksri, A.; Wongwuttanasatian, T. Efficiency improvement of PV module using a binary-organic eutectic phase change material in a finned container. Energy Rep. 2022, 8, 121–128. [Google Scholar] [CrossRef]
- Elqady, H.I.; Radwan, A.; Ali, A.Y.M.; Rabie, M.; Abo-Zahhad, E.M.; Ookawara, S.; El-Shazly, A.H. Concentrator photovoltaic thermal management using a new design of double-layer microchannel heat sink. Sol. Energy 2021, 220, 552–570. [Google Scholar] [CrossRef]
- Mohammadpour, J.; Salehi, F.; Sheikholeslami, M.; Lee, A. A computational study on nanofluid impingement jets in thermal management of photovoltaic panel. Renew. Energy 2022, 189, 970–982. [Google Scholar] [CrossRef]
- Zaghloul, H.; Emam, M.; Abdelrahman, M.A.; Abd Rabbo, M.F. Optimization and parametric analysis of a multi-junction high-concentrator PV cell combined with a straight fins heat sink. Energy Convers. Manag. 2021, 243, 114382. [Google Scholar] [CrossRef]
- Amalu, E.H.; Fabunmi, O.A. Thermal control of crystalline silicon photovoltaic (c-Si PV) module using Docosane phase change material (PCM) for improved performance tempereature control. Sol. Energy 2022, 234, 203–221. [Google Scholar] [CrossRef]
- Javidan, M.; Moghadam, A.J. Effective cooling of a photovoltaic module using jet-impingement array and nanofluid coolant. Int. Commun. Heat Mass Transf. 2022, 137, 106310. [Google Scholar] [CrossRef]
- Ji, Y.; Artzt, L.E.; Adams, W.; Spitler, C.; Islam, K.; Codd, D.; Escarra, M.D. A transmissive concentrator photovoltaic module with cells directly cooled by silicone oil for solar cogeneration systems. Appl. Energy 2021, 288, 116622. [Google Scholar] [CrossRef]
- Chen, H.; Wang, Y.; Yang, H.; Badiei, A.; Li, G. Experimental investigation and exergy analysis of a high concentrating photovoltaic system integrated with spray cooling. Energy Convers. Manag. 2022, 268, 115957. [Google Scholar] [CrossRef]
- Su, Y.; Sui, P.; Davidson, J.H. A sub-continuous lattice Boltzmann simulation for nanofluid cooling of concentrated photovoltaic thermal receivers. Renew. Energy 2022, 184, 712–726. [Google Scholar] [CrossRef]
- Hadipour, A.; Zargarabadi, M.R.; Rashidi, S. An efficient pulsed- spray water cooling system for photovoltaic panels: Experimental study and cost analysis. Renew. Energy 2020, 164, 867–875. [Google Scholar] [CrossRef]
- Eid, A.F.; Lee, S.; Hong, S.; Choi, W. Hybrid cooling techniques to improve the performance of solar photovoltaic modules. Sol. Energy 2022, 245, 254–264. [Google Scholar] [CrossRef]
- Gad, R.; Mahmoud, H.; Ookawara, S.; Hassan, H. Energy, exergy, and economic assessment of thermal regulation of PV panel using hybrid heat pipe-phase change material cooling system. J. Clean. Prod. 2022, 364, 132489. [Google Scholar] [CrossRef]
- Selimefendigil, F.; Öztop, H.F. Performance of TEG integrated channel with area expansion by using advanced passive techniques. Int. J. Mech. Sci. 2020, 194, 106210. [Google Scholar] [CrossRef]
- Selimefendigil, F.; Öztop, H.F. Optimization assisted CFD for using double porous cylinders on the performance improvement of TEG mounted 3D channels. Sustain. Energy Technol. Assess. 2022, 52, 102303. [Google Scholar] [CrossRef]
- Negash, A.A.; Choi, Y.; Kim, T.Y. Experimental investigation of optimal location of flow straightener from the aspects of power output and pressure drop characteristics of a thermoelectric generator. Energy 2021, 219, 119565. [Google Scholar] [CrossRef]
- Yang, W.; Xie, H.; Sun, L.; Ju, C.; Li, B.; Li, C.; Zhang, H.; Liu, H. An experimental investigation on the performance of TEGs with a compact heat exchanger design towards low-grade thermal energy recovery. Appl. Therm. Eng. 2021, 194, 117119. [Google Scholar] [CrossRef]
- Selimefendigil, F.; Öztop, H.F. Performance assessment of a thermoelectric module by using rotating circular cylinders and nanofluids in the channel flow for renewable energy applications. J. Clean. Prod. 2020, 279, 123426. [Google Scholar] [CrossRef]
- Selimefendigil, F.; Öztop, H.F. Identification of pulsating flow effects with CNT nanoparticles on the performance enhancements of thermoelectric generator (TEG) module in renewable energy applications. Renew. Energy 2020, 162, 1076–1086. [Google Scholar] [CrossRef]
- Mahian, O.; Kianifar, A.; Kalogirou, S.A.; Pop, I.; Wongwises, S. A review of the applications of nanofluids in solar energy. Int. J. Heat Mass Transf. 2013, 57, 582–594. [Google Scholar] [CrossRef]
- Kakaç, S.; Pramuanjaroenkij, A. Single-phase and two-phase treatments of convective heat transfer enhancement with nanofluids–A state-of-the-art review. Int. J. Therm. Sci. 2016, 100, 75–97. [Google Scholar] [CrossRef]
- Mahian, O.; Bellos, E.; Markides, C.N.; Taylor, R.A.; Alagumalai, A.; Yang, L.; Qin, C.; Lee, B.J.; Ahmadi, G.; Safaei, M.R.; et al. Recent advances in using nanofluids in renewable energy systems and the environmental implications of their uptake. Nano Energy 2021, 86, 106069. [Google Scholar] [CrossRef]
- Gupta, M.; Singh, V.; Kumar, R.; Said, Z. A review on thermophysical properties of nanofluids and heat transfer applications. Renew. Sustain. Energy Rev. 2017, 74, 638–670. [Google Scholar] [CrossRef]
- Li, B.; Hong, W.; Li, H.; Lan, J.; Zi, J. Optimized energy distribution management in the nanofluid-assisted photovoltaic/thermal system via exergy efficiency analysis. Energy 2022, 242, 123018. [Google Scholar] [CrossRef]
- Aslfattahi, N.; Loni, R.; Bellos, E.; Najafi, G.; Kadirgama, K.; Harun, W.S.W.; Saidur, R. Efficiency enhancement of a solar dish collector operating with a novel soybean oil-based-MXene nanofluid and different cavity receivers. J. Clean. Prod. 2021, 317, 128430. [Google Scholar] [CrossRef]
- Olabi, A.G.; Elsaid, K.; Sayed, E.T.; Mahmoud, M.S.; Wilberforce, T.; Hassiba, R.J.; Abdelkareem, M.A. Application of nanofluids for enhanced waste heat recovery: A review. Nano Energy 2021, 84, 105871. [Google Scholar] [CrossRef]
- Ruan, H.; Xie, H.; Wang, J.; Liao, J.; Sun, L.; Gao, M.; Li, C. Numerical investigation and comparative analysis of nanofluid cooling enhancement for TEG and TEC systems. Case Stud. Therm. Eng. 2021, 27, 101331. [Google Scholar] [CrossRef]
- Sadeghi, G.; Pisello, A.L.; Nazari, S.; Jowzi, M.; Shama, F. Empirical data-driven multi-layer perceptron and radial basis function techniques in predicting the performance of nanofluid-based modified tubular solar collectors. J. Clean. Prod. 2021, 295, 126409. [Google Scholar] [CrossRef]
- Said, Z.; Sharma, P.; Tiwari, A.K.; Le, V.V.; Huang, Z.; Bui, V.G.; Hoang, A.T. Application of novel framework based on ensemble boosted regression trees and Gaussian process regression in modelling thermal performance of small-scale Organic Rankine Cycle (ORC) using hybrid nanofluid. J. Clean. Prod. 2022, 360, 132194. [Google Scholar] [CrossRef]
- Rajaee, F.; Rad, M.A.V.; Kasaeian, A.; Mahian, O.; Yan, W.-M. Experimental analysis of a photovoltaic/thermoelectric generator using cobalt oxide nanofluid and phase change material heat sink. Energy Convers. Manag. 2020, 212, 112780. [Google Scholar] [CrossRef]
- Kolahan, A.; Maadi, S.R.; Kazemian, A.; Schenone, C.; Ma, T. Semi-3D transient simulation of a nanofluid-base photovoltaic thermal system integrated with a thermoelectric generator. Energy Convers. Manag. 2020, 220, 113073. [Google Scholar] [CrossRef]
- Soltani, S.; Kasaeian, A.; Lavajoo, A.; Loni, R.; Najafi, G.; Mahian, O. Exergetic and enviromental assessment of a photovoltaic thermal-thermoelectric system using nanofluids: Indoor experimental tests. Energy Convers. Manag. 2020, 218, 112907. [Google Scholar] [CrossRef]
- Rejeb, O.; Shittu, S.; Li, G.; Ghenai, C.; Zhao, X.; Ménézo, C.; Jemni, A.; Jomaa, M.H.; Bettayeb, M. Comparative investigation of concentrated photovoltaic thermal-thermoelectric with nanofluid cooling. Energy Convers. Manag. 2021, 235, 113968. [Google Scholar] [CrossRef]
- Akbar, A.; Najafi, G.; Gorjian, S.; Kasaeian, A.; Mazlan, M. Performance enhancement of a hybrid photovoltaic-thermal-thermoelectric (PVT-TE) module using nanofluid-based cooling: Indoor experimental tests and multi-objective optimization. Sustain. Energy Technol. Assess. 2021, 46, 101276. [Google Scholar] [CrossRef]
- Maadi, S.R.; Navegi, A.; Solomin, E.; Ahn, H.S.; Wongwises, S.; Mahian, O. Performance improvement of a photovoltaic-thermal system using a wavy-strip insert with and without nanofluid. Energy 2021, 234, 121190. [Google Scholar] [CrossRef]
- Garud, K.S.; Lee, M. Thermodynamic, environmental and economic analyses of photovoltaic/thermal-thermoelectric generator system using single and hybrid particle nanofluids. Energy 2022, 255, 124515. [Google Scholar] [CrossRef]
- Gao, Y.; Chen, B.; Wu, D.; Dai, Z.; Wang, C.; Zhang, X. Comparative study of various solar power generation systems integrated with nanofluid-flat heat pipe. Appl. Energy 2022, 327, 120052. [Google Scholar] [CrossRef]
- Selimefendigil, F.; Öztop, H.F. The potential benefits of surface corrugation and hybrid nanofluids in channel flow on the performance enhancement of a thermo-electric module in energy systems. Energy 2020, 213, 118520. [Google Scholar] [CrossRef]
- Wu, J.; Zhang, X.; Shen, J.; Wu, Y.; Connelly, K.; Yang, T.; Tang, L.; Xiao, M.; Wei, Y.; Jiang, K.; et al. A review of thermal absorbers and their integration methods for the combined solar photovoltaic/thermal (PV/T) modules. Renew. Sustain. Energy Rev. 2017, 75, 839–854. [Google Scholar] [CrossRef]
- de Oliveira, M.C.C.; Cardoso, A.S.A.D.; Viana, M.M.; Lins, V.D.F.C. The causes and effects of degradation of encapsulant ethylene vinyl acetate copolymer (EVA) in crystalline silicon photovoltaic modules: A review. Renew. Sustain. Energy Rev. 2018, 81, 2299–2317. [Google Scholar] [CrossRef]
- Husain, A.A.F.; Hasan, W.Z.W.; Shafie, S.; Hamidon, M.N.; Pandey, S.S. A review of transparent solar photovoltaic technologies. Renew. Sustain. Energy Rev. 2018, 94, 779–791. [Google Scholar] [CrossRef]
- Zhou, B.; Pei, J.; Nasir, D.M.; Zhang, J. A review on solar pavement and photovoltaic/thermal (PV/T) system. Transp. Res. Part D: Transp. Environ. 2021, 93, 102753. [Google Scholar] [CrossRef]
- Nayshevsky, I.; Xu, Q.F.; Barahman, G.; Lyons, A.M. Fluoropolymer coatings for solar cover glass: Anti-soiling mechanisms in the presence of dew. Sol. Energy Mater. Sol. Cells 2019, 206, 110281. [Google Scholar] [CrossRef]
- Xie, P.; Wang, H. Potential benefit of photovoltaic pavement for mitigation of urban heat island effect. Appl. Therm. Eng. 2021, 191, 116883. [Google Scholar] [CrossRef]
- Gaddam, S.K.; Pothu, R.; Boddula, R. Advanced polymer encapsulates for photovoltaic devices−A review. J. Mater. 2021, 7, 920–928. [Google Scholar] [CrossRef]
- George, M.; Pandey, A.K.; Rahim, N.A.; Tyagi, V.; Shahabuddin, S.; Saidur, R. Concentrated photovoltaic thermal systems: A component-by-component view on the developments in the design, heat transfer medium and applications. Energy Convers. Manag. 2019, 186, 15–41. [Google Scholar] [CrossRef]
- Nahar, A.; Hasanuzzaman, M.; Rahim, N.A. Numerical and experimental investigation on the performance of a photovoltaic thermal collector with parallel plate flow channel under different operating conditions in Malaysia. Sol. Energy 2017, 144, 517–528. [Google Scholar] [CrossRef]
- Jouhara, H.; Żabnieńska-Góra, A.; Khordehgah, N.; Doraghi, Q.; Ahmad, L.; Norman, L.; Dai, S. Thermoelectric generator (TEG) technologies and applications. Int. J. Thermofluids 2021, 9, 100063. [Google Scholar] [CrossRef]
- Kinage, A.; Sahoo, S.; Chaudhuri, S. Effects of different electrical arrangements and Thomson effect on the system performance as well as the optimum allocation of thermocouples in a self-driven two-stage TEC & TEG. Therm. Sci. Eng. Prog. 2021, 25, 101035. [Google Scholar]
- Wang, P.; Wang, B.; Wang, K.; Gao, R.; Xi, L. An analytical model for performance prediction and optimization of thermoelectric generators with varied leg cross-sections. Int. J. Heat Mass Transf. 2021, 174, 121292. [Google Scholar] [CrossRef]
- Maksymuk, M.; Parashchuk, T.; Dzundza, B.; Nykyruy, L.; Chernyak, L.; Dashevsky, Z. Highly efficient bismuth telluride–based thermoelectric microconverters. Mater. Today Energy 2021, 21, 100753. [Google Scholar] [CrossRef]
- Burmistrov, I.; Gorshkov, N.; Kovyneva, N.; Kolesnikov, E.; Khaidarov, B.; Karunakaran, G.; Cho, E.-B.; Kiselev, N.; Artyukhov, D.; Kuznetsov, D.; et al. High seebeck coefficient thermo-electrochemical cell using nickel hollow microspheres electrodes. Renew. Energy 2020, 157, 1–8. [Google Scholar] [CrossRef]
- Selimefendigil, F.; Öztop, H.F. Thermoelectric generation in bifurcating channels and efficient modeling by using hybrid CFD and artificial neural networks. Renew. Energy 2021, 172, 582–598. [Google Scholar] [CrossRef]
- Motiei, P.; Yaghoubi, M.; GoshtashbiRad, E.; Vadiee, A. Two-dimensional unsteady state performance analysis of a hybrid photovoltaic-thermoelectric generator. Renew. Energy 2018, 119, 551–565. [Google Scholar] [CrossRef]
- Fallah Kohan, H.R.; Lotfipour, F.; Eslami, M. Numerical simulation of a photovoltaic thermoelectric hybrid power generation system. Sol. Energy 2018, 174, 537–548. [Google Scholar] [CrossRef]
- Al-Damook, M.; Khatir, Z.; Al Qubeissi, M.; Dixon-Hardy, D.; Heggs, P.J. Energy efficient double-pass photovoltaic/thermal air systems using a computational fluid dynamics multi-objective optimisation framework. Appl. Therm. Eng. 2021, 194, 117010. [Google Scholar] [CrossRef]
- Shittu, S.; Li, G.; Tang, X.; Zhao, X.; Ma, X.; Badiei, A. Analysis of thermoelectric geometry in a concentrated photovoltaic-thermoelectric under varying weather conditions. Energy 2020, 202, 117742. [Google Scholar] [CrossRef]
- Lamaamar, I.; Tilioua, A.; Alaoui, M.A. Thermal performance analysis of a poly c-Si PV module under semi-arid conditions. Mater. Sci. Energy Technol. 2022, 5, 243–251. [Google Scholar] [CrossRef]
- Ranjan, M.; Maiti, T. Device modeling and performance optimization of thermoelectric generators under isothermal and isoflux heat source condition. J. Power Sources 2020, 480, 228867. [Google Scholar] [CrossRef]
- Mahmoudinezhad, S.; Ahmadi Atouei, S.; Cotfas, P.A.; Cotfas, D.T.; Rosendahl, L.A.; Rezania, A. Experimental and numerical study on the transient behavior of multi-junction solar cell-thermoelectric generator hybrid system. Energy Convers. Manag. 2019, 184, 448–455. [Google Scholar] [CrossRef]
- Lv, S.; Liu, M.; He, W.; Li, X.; Gong, W.; Shen, S. Study of thermal insulation materials influence on the performance of thermoelectric generators by creating a significant effective temperature difference. Energy Convers. Manag. 2020, 207, 112516. [Google Scholar] [CrossRef]
- Rezania, A.; Atouei, S.A.; Rosendahl, L. Critical parameters in integration of thermoelectric generators and phase change materials by numerical and Taguchi methods. Mater. Today Energy 2020, 16, 100376. [Google Scholar] [CrossRef]
- Luo, D.; Yan, Y.; Wang, R.; Zhou, W. Numerical investigation on the dynamic response characteristics of a thermoelectric generator module under transient temperature excitations. Renew. Energy 2021, 170, 811–823. [Google Scholar] [CrossRef]
- He, H.; Liu, W.; Wu, Y.; Rong, M.; Zhao, P.; Tang, X. An approximate and efficient characterization method for temperature-dependent parameters of thermoelectric modules. Energy Convers. Manag. 2019, 180, 584–597. [Google Scholar] [CrossRef]
- Karthick, K.; Suresh, S.; Singh, H.; Joy, G.C.; Dhanuskodi, R. Theoretical and experimental evaluation of thermal interface materials and other influencing parameters for thermoelectric generator system. Renew. Energy 2018, 134, 25–43. [Google Scholar] [CrossRef]
- Tian, M.-W.; Mihardjo, L.W.W.; Moria, H.; Asaadi, S.; Sadighi Dizaji, H.; Khalilarya, S.; Thanh Nguyen, P. A comprehensive energy efficiency study of segmented annular thermoelectric generator; thermal, exergetic and economic analysis. Appl. Therm. Eng. 2020, 181, 115996. [Google Scholar] [CrossRef]
- Wang, X.; Qi, J.; Deng, W.; Li, G.; Gao, X.; He, L.; Zhang, S. An optimized design approach concerning thermoelectric generators with frustum-shaped legs based on three-dimensional multiphysics model. Energy 2021, 233, 120810. [Google Scholar] [CrossRef]
- Dinarvand, S.; Rostami, M.N. Three-dimensional squeezed flow of aqueous magnetite-graphene oxide hybrid nanofluid: A novel hybridity model with analysis of shape factor effects. Proc. Inst. Mech. Eng. Part E J. Process. Mech. Eng. 2020, 234, 193–205. [Google Scholar] [CrossRef]
- Izady, M.; Dinarvand, S.; Pop, I.; Chamkha, A.J. Flow of aqueous Fe2O3–CuO hybrid nanofluid over a permeable stretching/shrinking wedge: A development on Falkner–Skan problem. Chin. J. Phys. 2021, 74, 406–420. [Google Scholar] [CrossRef]
- Ying, Z.; He, B.; He, D.; Kuang, Y.; Ren, J.; Song, B. Comparisons of single-phase and two-phase models for numerical predictions of Al2O3/water nanofluids convective heat transfer. Adv. Powder Tech. 2020. [CrossRef]
- Sajadifar, S.A.; Karimipour, A.; Toghraie, D. Fluid flow and heat transfer of non-Newtonian nanofluid in a microtube considering slip velocity and temperature jump boundary conditions. Eur. J. Mech.-B/Fluids 2017, 61, 25–32. [Google Scholar] [CrossRef]
- Aboud, E.D.; Rashid, H.K.; Jassim, H.M.; Ahmed, S.Y.; Waheed Khafaji, S.O.; Hamzah, H.K.; Ali, F.H. MHD effect on mixed convection of annulus circular enclosure filled with Non-Newtonian nanofluid. Heliyon 2020, 6, e03773. [Google Scholar] [CrossRef]
- Lamraoui, H.; Mansouri, K.; Saci, R. Numerical investigation on fluid dynamic and thermal behavior of a non-Newtonian Al2O3–water nanofluid flow in a confined impinging slot jet. J. Non-Newton. Fluid Mech. 2018, 265, 11–27. [Google Scholar] [CrossRef]
- Du, Y.; Tao, W.; Liu, Y.; Jiang, J.; Huang, H. Heat transfer modeling and temperature experiments of crystalline silicon photovoltaic modules. Sol. Energy 2017, 146, 257–263. [Google Scholar] [CrossRef]
- Tao, M.; Zhenpeng, L.; Jiaxin, Z. Photovoltaic panel integrated with phase change materials (PV-PCM): Technology overview and materials selection. Renew. Sustain. Energy Rev. 2019, 116, 109406. [Google Scholar]
- Han, Z.; Liu, K.; Li, G.; Zhao, X.; Shittu, S. Electrical and thermal performance comparison between PVT-ST and PV-ST systems. Energy 2021, 237, 121589. [Google Scholar] [CrossRef]
- Shittu, S.; Li, G.; Zhao, X.; Akhlaghi, Y.G.; Ma, X.; Yu, M. Comparative study of a concentrated photovoltaic-thermoelectric system with and without flat plate heat pipe. Energy Convers. Manag. 2019, 193, 1–14. [Google Scholar] [CrossRef]
- Ali, A.Y.; Abo-Zahhad, E.M.; Elkady, M.; Ookawara, S.; El-Shazly, A.; Radwan, A. Temperature uniformity enhancement of densely packed high concentrator photovoltaic module using four quadrants microchannel heat sink. Sol. Energy 2020, 202, 446–464. [Google Scholar] [CrossRef]
- hou, J.; Zhang, Z.; Ke, H. PV module temperature distribution with a novel segmented solar cell absorbance model. Renew. Energy 2018, 134, 1071–1080. [Google Scholar]
- Lewis, R.W.; Nithiarasu, P.; Seetharamu, K.N. Fundamentals of the Finite Element Method for Heat and Fluid Flow; John Wiley and Sons: West Sussex, UK, 2004. [Google Scholar]
- Reddy, J.N.; Gartling, D.K. The Finite Element Method in Heat Transfer and Fluid Dynamics, 2nd ed.; CRC: Boca Raton, FL, USA, 2001. [Google Scholar]
- Comsol Multiphysics User Guide, 5.6; COMSOL AB: Stockholm, Sweden, 1998.
- Selimefendigil, F.; Bayrak, F.; Oztop, H.F. Experimental analysis and dynamic modeling of a photovoltaic module with porous fins. Renew. Energy 2018, 125, 193–205. [Google Scholar] [CrossRef]
- Chen, M.; Rosendahl, L.A.; Condra, T. A three-dimensional numerical model of thermoelectric generators in fluid power systems. Int. J. Heat Mass Transf. 2011, 54, 345–355. [Google Scholar] [CrossRef]
- Khan, F.; Rezgui, B.D.; Kim, J.H. Reliability Study of c-Si PV Module Mounted on a Concrete Slab by Thermal Cycling Using Electroluminescence Scanning: Application in Future Solar Roadways. Materials 2020, 13, 470. [Google Scholar] [CrossRef] [PubMed]
- Khan, F.; Alshahrani, T.; Fareed, I.; Kim, J.H. A comprehensive degradation assessment of silicon photovoltaic modules installed on a concrete base under hot and low-humidity environments: Building applications. Sustain. Energy Technol. Assess. 2022, 52, 102314. [Google Scholar] [CrossRef]


Disclaimer/Publisher’s Note: The statements, opinions and data contained in all publications are solely those of the individual author(s) and contributor(s) and not of MDPI and/or the editor(s). MDPI and/or the editor(s) disclaim responsibility for any injury to people or property resulting from any ideas, methods, instructions or products referred to in the content. |
© 2023 by the authors. Licensee MDPI, Basel, Switzerland. This article is an open access article distributed under the terms and conditions of the Creative Commons Attribution (CC BY) license (https://creativecommons.org/licenses/by/4.0/).