
Research on the Impact of Digital Empowerment on China’s Human Capital Accumulation and Human Capital Gap between Urban and Rural Areas

Abstract
:1. Introduction
2. Theoretical Explanation
2.1. Rural Sector
2.2. Urban Sector
2.3. Government Sector
2.4. Solution of Regional Economic Equilibrium and the Effect of Digitalization
3. Research Design
3.1. Model Parameters
3.2. Variable Design
- Explained variables. Based on the existing literature, the years of education were used to measure the human capital level of urban and rural residents in this paper [26,38]. Specifically, the years of education of all urban and rural samples were used as an explained variable in this paper for benchmark regression analysis. The highest degree completed by the respondents at the time of the survey was converted into the corresponding years of education to measure their human capital level through continuous variables. Then, the urban-rural human capital gap was used as an explained variable for robustness analysis. The urban-rural human capital gap is the actual value of the average years of education of urban samples minus the average years of education of rural samples, so as to obtain a continuous variable for the urban-rural human capital gap. The larger the net difference, the greater the urban-rural human capital gap, or the inverse of this is true.
- Main explanatory variables. In this paper, the level of digital development in China’s provinces and regions was taken as the main explanatory variable. Using the theory and index system of Fan Hejun et al. [39] to measure China’s regional digitalization degree, the digitalization level of an economy was considered from four aspects: production, distribution, exchange, and consumption. These comprise an organic system in social production and reproduction according to Marxist political economics. Therefore, the digital empowerment level of 25 Chinese provinces (autonomous regions and municipalities directly under the Central Government) was depicted and measured using 23 secondary indexes in total, from the four dimensions of production digitalization (production), circulation digitalization (exchange), consumption digitalization (consumption), and government digitalization (distribution) (For the specific index system, see the China Digital Index Report, Fan Hejun et al., Beijing; Economy & Management Publishing House, 2020). The measurement system fully considers all links of economic operation, social exchange, and resident life and can comprehensively and objectively measure the degree of digitalization in various regions of China. As the proxy variable of digital empowerment, it has good pertinence and credibility.
- Instrumental variables. Based on the research design of Nunn and Qian [40], Zhao Tao et al. [41], and Yuan Chun et al. [28], the interaction between the number of fixed-line telephones in China’s provinces and regions in 1984, and the number of internet users in China in a period behind in the sample observation period, was taken as the instrumental variable for regional digital development level in this paper. On the one hand, the development and application of digital technology began with the public switched telephone network (PSTN). The early level of telecommunication infrastructure construction in a region will affect the subsequent digital construction due to its technical basis and technical inertia. The number of fixed-line telephones reflects the early level of telecommunication infrastructure construction in each region and can better meet the correlation principle of instrumental variables. On the other hand, 1984 is far from the sample observation period, and the number of fixed-line telephones belongs to the category of communication. As fixed-line telephones mainly provide communication services for the public, this variable cannot have a direct impact on the years of education of urban and rural residents in the sample observation period from 2016 to 2018, and it can well meet the exogenous principle of instrumental variables. The CFPS data used in this paper include two periods of panel data. Therefore, based on the existing research and the number of fixed-line telephones in each region in 1984, the interaction for the numbers of internet users in 2015 and 2017 was introduced as an instrumental variable of the panel data. The instrumental variable formed using this method is called Shift-Share. Its exogenous nature is mainly provided by Share (the number of fixed-line telephones), while Shift (the number of Chinese internet users) provides a unified time change trend that is not at the same observation level as the Share portion, nor heterogeneous with the observation values of each sample. New endogenous factors will not be introduced, so as to form an effective instrumental variable [40,41,42].
- Control variables. The existing literature was first reviewed. Then, to better observe the impact of digitalization on the accumulation of human capital and the gap between urban and rural areas—while also trying to control factors that affect the explained variables—individual characteristics of respondents, their parents’ education levels, and family environment factors were introduced into the regression equation as control variables. These included the respondents’ sex, age, marital status, mother’s education level, father’s education level, family size, family economic status, etc. [43,44,45] Based on this, the individual effect and time effect were further controlled using a fixed effect model to minimize the estimation bias caused by missing variables.
3.3. Data Source and Descriptive Statistics
4. Empirical Test
4.1. Benchmark Regression Analysis
4.2. Robustness Test
- Substitution of the explained variable. In this paper, the years of education of all samples used in the benchmark regression analysis were substituted by the difference in years of education. Based on the rural samples, the impact of digitalization on the urban-rural human capital gap was estimated. The results are shown in Table 3. To ensure the validity of the estimated results, the Hausman test, overall significance test, and time trend test were carried out. The Hausman test results show that the Prob > chi2 test values of the two models were both contrary to the original hypothesis at the 1% statistical level. In the time trend test, the explained variable has a time effect that does change with the individual. Then, a fixed effect model was used to determine the estimate. The statistical values of Prob > F in the two models were both significant at the 1% statistical level, indicating that they passed the overall significance test and the estimated results had statistical significance.
- 2.
- Endogenous processing. In this paper, the instrumental variable method was used for endogenous processing. First, the instrumental variable test was conducted for the benchmark regression analysis, and the 2SLS and LIML models were used for estimation. The results are shown in Table 4. The impact of digitalization on the years of education of urban and rural residents is still significant at the 10% statistical level. The interaction between digitalization and urban/rural classification, and the interaction between digitalization2 and urban-rural classification are both positively and negatively correlated with the years of education at the 1% statistical level. The above results are consistent with the benchmark regression results, indicating that while digitalization significantly promotes the accumulation of human capital in urban and rural areas, its impact on the urban-rural human capital gap also presents an inverted U-shaped curve. The urban-rural human capital gap is expanding with digital development. The estimated regression coefficient and significance level results in the 2SLS model and LIML model are highly consistent, indicating that there is no weak instrumental variable problem and the instrumental variable test results are robust. In addition, the weak identification test for instrumental variables shows that the Kleibergen-Paap rk LM item is significant at the 1% statistical level, which is contrary to the original hypothesis: insufficient identification of instrumental variables. The Cragg-Donald Wald F item is greater than the critical value at the 10% level in the identification test of Stock-Yogo weak instrumental variables, which is contrary to the original hypothesis of weak instrumental variables. The above test results show that the selection and estimation of instrumental variables are reliable.
- 3.
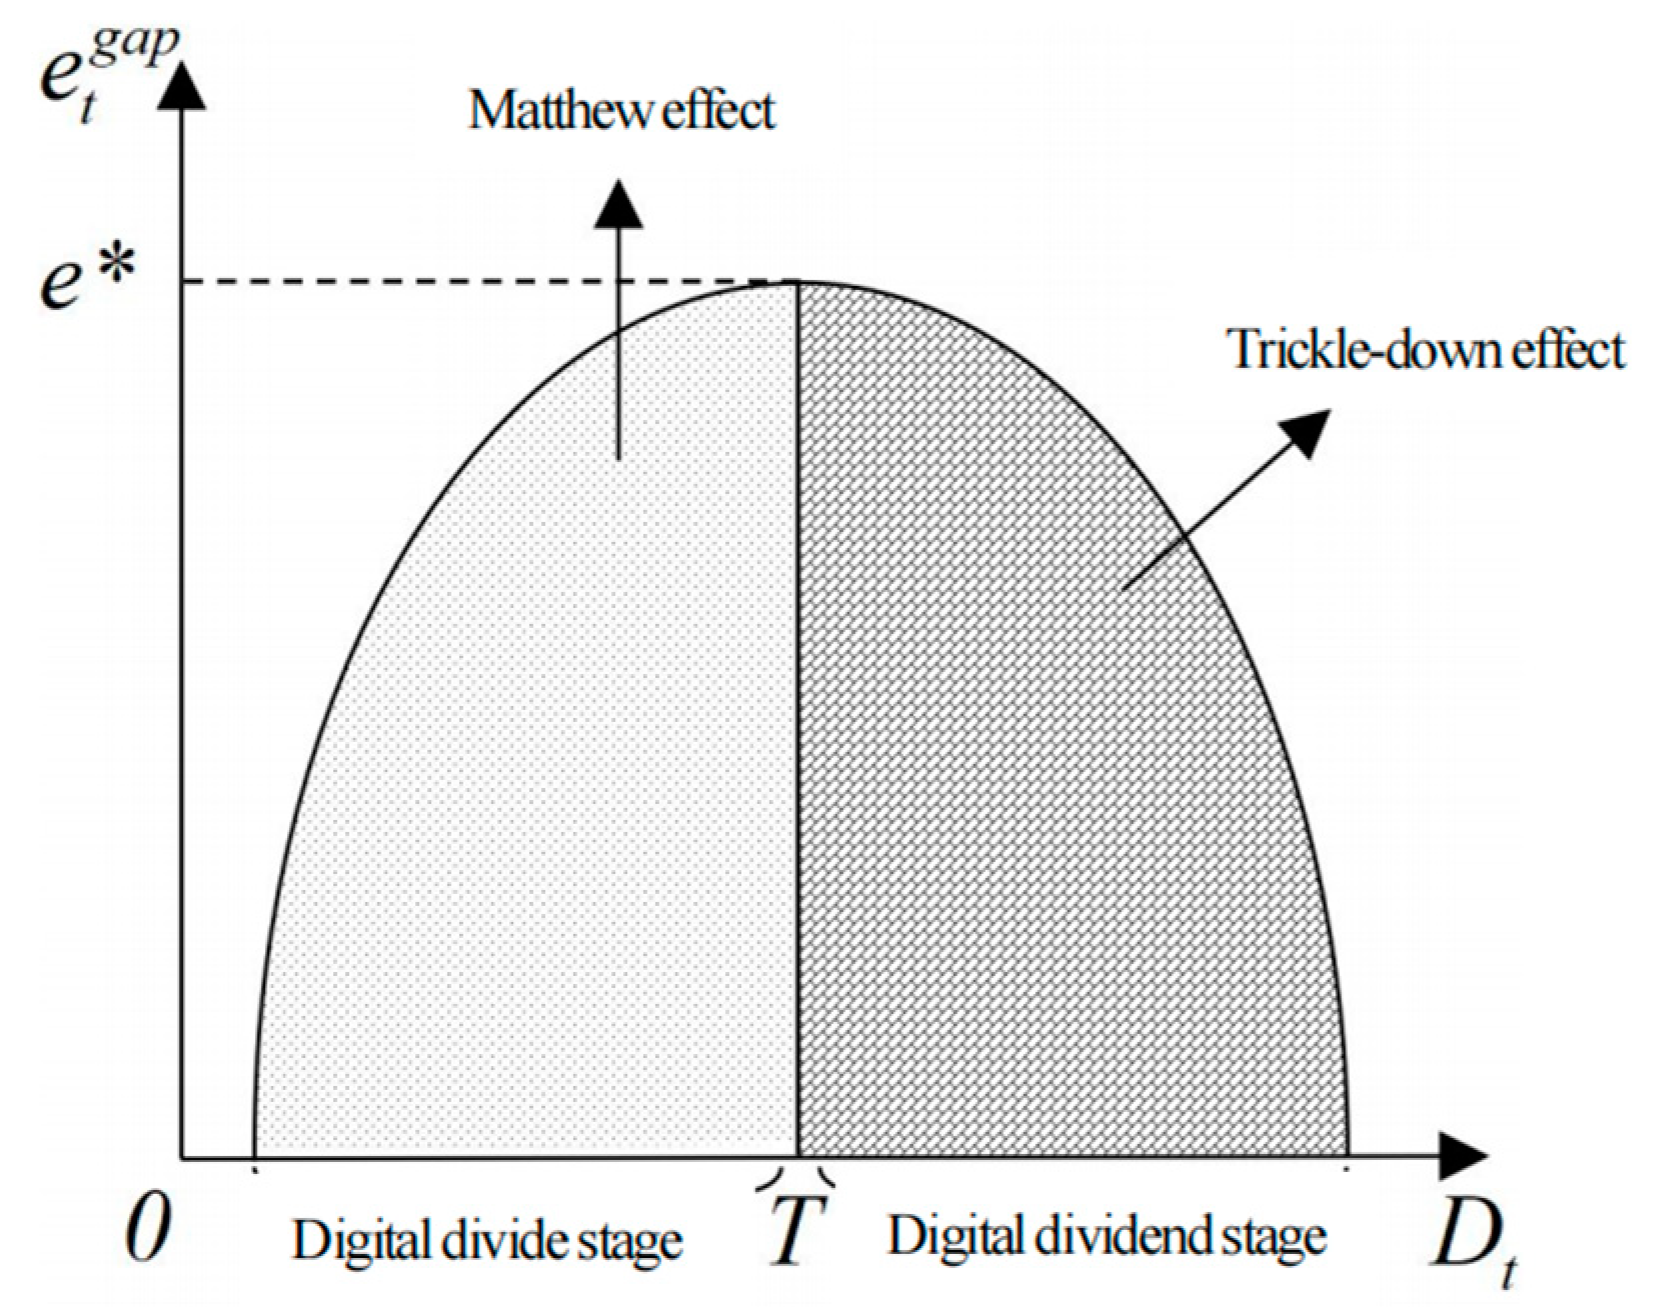
- Estimation by sample. The above test results show that the impact of digitalization on the urban-rural human capital gap currently presents a Matthew Effect trend, i.e., the urban-rural human capital gap is expanding with the development of digitalization. Based on this, the robustness of this conclusion was tested by grouping the estimation for urban and rural samples. The estimated results are shown in Table 6. First, in Model 11, the impact of digitalization on the years of education of rural residents is significant at the level of 10%, with an influence coefficient of about 1.37%, which indicates that the years of education of rural residents will increase by 1.37% for each index point of digitalization. In contrast, in Model 12, the impact of digitalization on the years of education of urban residents is significant at the level of 1%, with an influence coefficient of 3.07%, which indicates that the years of education of urban residents will increase by 3.07% for each index point of digitalization. The promotion effect of digital empowerment on human capital accumulation in urban areas is more than twice that of rural areas, and the significance level is relatively higher. It can be seen that the digital dividend enjoyed by urban residents in the current process of digital development is far higher than that enjoyed by rural residents, further widening the urban-rural human capital gap. Therefore, the impact of digital empowerment on the urban-rural human capital gap shows the Matthew Effect at this stage, and this estimation result is robust.
4.3. Heterogeneity Analysis
5. Conclusions and Enlightenment
Author Contributions
Funding
Institutional Review Board Statement
Informed Consent Statement
Data Availability Statement
Conflicts of Interest
References
- Zhang, J.; Gao, K.; Lu, W. Human Capital Accumulation, Innovation and Economic Growth. Dongyue Trib. 2020, 41, 39–48. [Google Scholar]
- Huang, M.; Mu, G.; Wang, X. Re-measurement of China’s Talent Contribution Rate in 1978–2017. Stat. Decis. 2020, 20, 39–43. [Google Scholar]
- Cheng, M.; Gai, Q.; Jin, Y.; Shi, Q. Human Capital Accumulation and Farmers’ Income Growth. Econ. Res. J. 2016, 1, 168–181+192. [Google Scholar]
- Guo, L.; Guo, X. Impact of the Duality of Human Capital Investment on the Income Gap between Urban and Rural Areas. J. Tech. Econ. Manag. 2017, 1, 96–101. [Google Scholar]
- Huang, Z.; Liu, Z. Capital Accumulation, Urban-Rural Income Gap and Rural Residents’ Investment in Education. Chin. J. Popul. Sci. 2019, 6, 71–83+127–128. [Google Scholar]
- Su, J.; Su, K.; Wang, S. Does the digital economy promote industrial structural upgrading?—A test of mediating effects based on heterogeneous technological innovation. Sustainability 2021, 18, 10105. [Google Scholar] [CrossRef]
- Xu, X.; Zhang, M. Research on the Scale Measurement of China’s Digital Economy—From the Perspective of International Comparison. China Ind. Econ. 2020, 5, 23–41. [Google Scholar]
- Song, P.; Bai, X.; Li, L. Digital empowerment, factor substitution and industrial structure transformation. J. Shanxi Univ. Financ. Econ. 2023, 1, 69–84. [Google Scholar]
- Cheng, M.; Zhang, J. Internet Popularization and Income Gap between Urban and Rural Areas: Theory and Demonstration. Chin. Rural Econ. 2019, 2, 19–41. [Google Scholar]
- Cheng, M.; Zhang, J. Internet Development and the Consumption Gap between Urban and Rural Residents in the New Era. J. Quant. Tech. Econ. 2019, 7, 22–41. [Google Scholar]
- Chen, W.; Wang, Q.; Zhou, H. Digital Rural Construction and Farmers’Income Growth: Theoretical Mechanism and Micro Experience Based on Data from China. Sustainability 2022, 18, 11679. [Google Scholar] [CrossRef]
- Zhang, X.; Wan, G.; Wu, H. Bridging the Digital Divide: Development of Digital Finance with Chinese Characteristics. Soc. Sci. China 2021, 8, 35–51+204–205. [Google Scholar]
- Xu, Y.; Yan, Q. Obstacles of technology embedding in the construction of digital government and its resolution path. Jianghai Acad. J. 2022, 6, 151–159. [Google Scholar]
- Liu, S.; Yan, J.; Zhang, S.; Lin, H. Can Digital Transformation of Enterprise Management Improve Input and Output Efficiency. Manag. World 2021, 5, 170–190+13. [Google Scholar]
- Qu, Y. The organizational basis of digital innovation and China’s heterogeneity. Manag. World 2022, 10, 158–174. [Google Scholar]
- Xie, X.; Zuo, Y.; Huang, Q. Human Resource Management in the Digital Era: From the Perspective of Interaction between Human and Technology. Manag. World 2021, 1, 200–216+13. [Google Scholar]
- Su, L.; Kong, R. Does Internet Use Promote Farmers’ Entrepreneurship Gain? An Empirical Analysis Based on Endogenous Transformation Regression Model. Chin. Rural Econ. 2020, 2, 62–80. [Google Scholar]
- Zhang, J.; Zhang, X. Research on the Impact and Mechanism of Internet Use on Farmland Transfer-out Decision—Micro-evidence from CFPS. Chin. Rural Econ. 2020, 3, 57–77. [Google Scholar]
- Zhu, Q.; Bai, J.; Peng, C.; Zhu, C. Does Informatization Improve Agricultural Productivity? Chin. Rural Econ. 2019, 4, 22–40. [Google Scholar]
- Liu, X.; Zhao, K. Research on the role of digital economy in promoting high-quality development of rural revitalization. Agric. Econ. 2023, 1, 42–44. [Google Scholar]
- Zhang, H.; Wu, J.; Liu, Y.; Song, N. The ‘Digital Divide’ of Basic Education in Urban and Rural Areas: Representation, Causes and Elimination Policies—An Empirical Research Based on Online Teaching. Educ. Econ. 2021, 4, 20–28. [Google Scholar]
- Zheng, L.; Zheng, Y. Digital Family Gap and Discipline Literacy Gap between Urban and Rural Students: A Study Based on PISA 2018 Data from Four Provinces and Cities in China. China Educ. Technol. 2021, 7, 43–51. [Google Scholar]
- Liu, J. Education Equity under the Digital Divide—An Analysis Based on PISA 2018 Data from Four Provinces and Cities in China. J. Natl. Acad. Educ. Adm. 2020, 9, 35–43. [Google Scholar]
- Lucas, R.E. On The Mechanics of Economic Development. J. Monet. Econ. 1988, 1, 3–42. [Google Scholar] [CrossRef]
- Romer, P.M. Increasing Returns and Long-run Growth. J. Political Econ. 1986, 5, 1002–1037. [Google Scholar] [CrossRef] [Green Version]
- Lucas, R.E. Human Capital and Growth. Am. Econ. Rev. 2015, 5, 85–88. [Google Scholar] [CrossRef] [Green Version]
- Zhao, G. Data Elements: New Dynamics of Global Economic and Social Development. Posts & Telecom Press: Beijing, China, 2021. [Google Scholar]
- Yuan, C.; Xiao, T.; Geng, C.; Sheng, Y. Digital Transformation and Division of Work in Enterprises: Specialization or Vertical Integration. China Ind. Econ. 2021, 9, 137–155. [Google Scholar]
- Han, W.; Chen, H. New Production Factors of Digitization and Income Distribution. Financ. Econ. 2021, 3, 56–68. [Google Scholar]
- Yang, Y. Educational Changes and Policy Responses Brought by ‘Internet + Education. Educ. Res. 2016, 6, 64–68. [Google Scholar]
- Jiang, F.; Wu, F. Internet Dividend and the Leap-forward Development of Human Resources in China. Educ. Res. 2018, 12, 118–126. [Google Scholar]
- Chen, W.; Cheng, Z.; Cai, Q. Education Equity from the Perspective of Family Education Expectations—The Mitigation Effect of Digital Inclusive Finance on Non-self-induced Family Factors. Educ. Res. 2021, 10, 122–137. [Google Scholar]
- Lv, P. Digital Village and Information Empowerment. Social Sciences in Chinese. High. Educ. Inst. 2020, 2, 69–79+158–159. [Google Scholar]
- Wei, K.K.; Teo, H.H.; Chan, H.C.; Tan, B. Conceptualizing and Testing a Social Cognitive Model of the Digital Divide. Inf. Syst. Res. 2011, 1, 170–187. [Google Scholar] [CrossRef] [Green Version]
- Scheerder, A.; Deursen, A.V.; Dijk, J.V. Determinants of Internet Skills, Uses and Outcomes. A Systematic Review of The Second-and Third-level Digital Divide. Telemat. Inform. 2017, 8, 1607–1624. [Google Scholar] [CrossRef]
- Xue, E.; Li, J.; Li, X. Sustainable development of education in rural areas for rural revitalization in China: A comprehensive policy circle analysis. Sustainability 2021, 23, 13101. [Google Scholar] [CrossRef]
- Yu, B.; Wang, Z.; Zhu, J.; Hou, Y. Assistance Structure, Leadership and Industrial Poverty Alleviation Performance. China Ind. Econ. 2021, 6, 23–41. [Google Scholar]
- Li, S.; Yin, H. Talent Allocation and Economic Growth between Government and Enterprises: An Empirical Study Based on the Data of China’s Prefecture-level Cities. Econ. Res. J. 2017, 4, 78–91. [Google Scholar]
- Fan, H.; Wu, T.; Wang, S.; Du, W. China Digital Index Report; Economy & Management Publishing House: Beijing, China, 2020. [Google Scholar]
- Nunn, N.; Qian, N. U.S. Food Aid and Civil Conflict. Am. Econ. Rev. 2014, 6, 1630–1666. [Google Scholar] [CrossRef] [Green Version]
- Zhao, T.; Zhang, Z.; Liang, S. Digital Economy, Entrepreneurial Activity and High-quality Development: Evidence from Chinese Cities. Manag. World 2020, 110, 65–76. [Google Scholar]
- Goldsmith-Pinkham, P.; Sorkin, I.; Swift, H. Baztik Instruments: What, When, Why and How. Am. Econ. Rev. 2020, 8, 2586–2624. [Google Scholar] [CrossRef]
- Hou, H.; Wu, Y.; Song, Y. Low-age Boarding and Human Capital Accumulation of Rural Primary School Students: Evidence from ‘Cancellation and Concentration. Chin. Rural Econ. 2018, 7, 113–129. [Google Scholar]
- Zhu, J.; Xu, L.; Wang, H. A Study of Urban-Rural Differences in the Intergenerational Transmission of Education—Verification Based on China’s Comprehensive Social Survey Data. Educ. Econ. 2018, 6, 45–55. [Google Scholar]
- Wu, Y. Unequal Educational Opportunities for Urban and Rural Residents in China and Their Evolution (1978–2008). Soc. Sci. China 2013, 3, 4–21+203. [Google Scholar]

| Variables | Definition | Mean | SD |
|---|---|---|---|
| Explained variables | |||
| Human capital accumulation | Measured by the number of years; the highest degree obtained by the respondent is converted into the corresponding number of years: Illiterate/Semi-illiterate = 1; Primary school = 6; Junior high school = 9; High school/Technical secondary school = 12; College = 15; Bachelor = 16; Master = 19; Doctorate = 22 | 10.27 | 3.51 |
| Urban-rural human capital gap | Net difference between the average years of education of urban residents and the average years of education of rural residents among all samples | 1.44 | 3.50 |
| Main explanatory variables | |||
| Digitalization | Digital development index, a continuous variable of 1–100 | 61.42 | 12.94 |
| Urban/rural classification | Actual residence of the respondent: Rural = 0; Urban = 1 | 0.45 | 0.50 |
| Control variables | |||
| Sex | Sex of the respondent: Female = 0; Male = 1 | 0.49 | 0.50 |
| Age | Actual age of the respondent | 23.03 | 4.44 |
| Marital status | Whether the respondent is married: No = 0; Yes = 1 | 0.36 | 0.48 |
| Mother’s education level | The highest degree obtained by the respondent’s mother: Illiterate = 1; Primary school = 6; Junior high school = 9; High school/Technical secondary school = 12; College = 15; Bachelor = 16; Master = 19; Doctorate = 22 | 4.92 | 4.13 |
| Father’s education level | The highest degree obtained by the respondent’s father: Illiterate = 1; Primary school = 6; Junior high school = 9; High school/Technical secondary school = 12; College = 15; Bachelor = 16; Master = 19; Doctorate = 22 | 6.26 | 4.23 |
| Family income | ln value of actual income of the respondent’s family in the past 12 months | 10.90 | 1.05 |
| Family size | Actual number of household population of the respondent’s family | 4.52 | 2.08 |
| Instrumental variable | |||
| Number of fixed-line telephones in 1984 | Interaction between the number of fixed-line telephones in 1984 and the number of Chinese internet users in 2015/2017 in the province where the respondent is located, as an instrumental variable of the digitalization level in 2015/2017 | 84.10 | 37.26 |
| Model 1 (Dependent Variable: Human Capital Level) (Regression of All Urban and Rural Samples) | Model 2 (Dependent Variable: Human Capital Level) (Regression of All Urban and Rural Samples) | |
|---|---|---|
| Urban/rural classification | 0.1391 (0.0640) ** | 0.1642 (0.0711) ** |
| Digitalization | -- | 0.0157 (0.0039) *** |
| Digitalization * urban/rural | -- | 0.0059 (0.0030) ** |
| Digitalization2 * urban/rural | -- | −0.0004 (0.0001) *** |
| Sex | 0.4428 (0.2634) * | 0.4347 (0.2631) * |
| Age | 0.0171 (0.0599) | 0.0151 (0.0598) |
| Marital status | −0.2233 (0.0472) *** | −0.2215 (0.0472) *** |
| Mother’s education level | 0.0258 (0.0124) ** | 0.0252 (0.0124) ** |
| Father’s education level | 0.0022 (0.0099) | 0.0032 (0.0099) |
| Family size | −0.0091 (0.0104) | −0.0026 (0.0106) |
| Family income | 0.0680 (0.0146) *** | 0.0662 (0.0146) *** |
| Time effect | 0.7924 (0.1209) *** | 0.6629 (0.1255) *** |
| Intercept term | 8.4425 (1.3364) *** | 7.5665 (1.3506) *** |
| Observed value | 17,558 | 17,558 |
| R2 | 0.225 | 0.227 |
| F value | 282.80 | 214.63 |
| Model 3 (Dependent Variable: Urban-Rural Human Capital Gap) (Regression of Rural Samples) | Model 4 (Dependent Variable: Urban-Rural Human Capital Gap) (Regression of Rural Samples) | |
|---|---|---|
| Digitalization | 0.0126 (0.0072) * | 0.0147 (0.0073) ** |
| Digitalization2 | -- | −0.0002 (0.0001) ** |
| Sex | −0.1289 (0.3565) | −0.1211 (0.3564) |
| Age | −0.0331 (0.0355) | −0.0438 (0.0359) |
| Marital status | 0.2198 (0.0645) *** | 0.2177 (0.0645) *** |
| Mother’s education level | −0.0514 (0.0179) *** | −0.0525 (0.0179) *** |
| Father’s education level | 0.0136 (0.0148) | 0.0129 (0.0148) |
| Family size | −0.0281 (0.0150) * | −0.0286 (0.0150) * |
| Family income | −0.0858 (0.0207) *** | −0.0872 (0.0207) *** |
| Intercept term | 2.6139 (0.5127) *** | 2.7958 (0.5195) *** |
| Observed value | 9426 | 9426 |
| R2 | 0.012 | 0.013 |
| F value | 7.09 | 6.81 |
| Model 5 (2SLS Estimation) (Regression of All Urban and Rural Samples) | Model 6 (LIML Estimation) (Regression of All Urban and Rural Samples) | |
|---|---|---|
| Urban/rural classification | 1.0085 (0.0649) *** | 1.0085 (0.0649) *** |
| Digitalization | 0.0056 (0.0032) * | 0.0056 (0.0032) * |
| Digitalization * urban/rural | 0.0249 (0.0047) *** | 0.0249 (0.0047) *** |
| Digitalization2 * urban/rural | −0.0026 (0.0003) *** | −0.0026 (0.0003) *** |
| Control variable | Controlled | Controlled |
| Time effect | Controlled | Controlled |
| Intercept term | −2.1425 (0.2922) *** | −2.1425 (0.2922) *** |
| Observed value | 17,558 | 17,558 |
| R2 | 0.2645 | 0.2645 |
| Wald test value | 6293.15 | 6293.15 |
| Model 7 (2SLS Estimation) (Regression of Rural Samples) | Model 8 (LIML Estimation) (Regression of Rural Samples) | Model 9 (2SLS Estimation) (Regression of Rural Samples) | Model 10 (LIML Estimation) (Regression of Rural Samples) | |
|---|---|---|---|---|
| Digitalization | 0.0825 (0.0073) *** | 0.0825 (0.0073) *** | 0.0322 (0.0093) *** | 0.0322 (0.0093) *** |
| Digitalization2 | −0.0036 (0.0003) *** | −0.0036 (0.0003) *** | −0.0015 (0.0006) *** | −0.0015 (0.0006) *** |
| Control variable | Controlled | Controlled | Controlled | Controlled |
| Time effect | Controlled | Controlled | Controlled | Controlled |
| Intercept term | 7.6525 (0.4935) *** | 7.6525 (0.4935) *** | 9.8281 (0.5626) *** | 9.8281 (0.5626) *** |
| Observed value | 9426 | 9426 | 9426 | 9426 |
| R2 | 0.1636 | 0.1636 | 0.1678 | 0.1678 |
| Wald test value | 1932.48 | 1932.48 | 1788.72 | 1788.72 |
| Model 11 (Dependent Variable: Years of Education of Rural Residents) (Regression of Rural Samples) | Model 12 (Dependent Variable: Years of Education of Urban Residents) (Regression of Urban Samples) | |
|---|---|---|
| Digitalization | 0.0137 (0.0078) * | 0.0307 (0.0069) *** |
| Control variable | Controlled | Controlled |
| Individual effect | Controlled | Controlled |
| Time effect | Controlled | Controlled |
| Intercept term | 5.5027 (1.7949) *** | 10.4111 (2.2056) *** |
| Observed value | 9704 | 7854 |
| R2 | 0.217 | 0.234 |
| F value | 139.29 | 122.76 |
| Dependent Variables: Years of Education among All Samples (Regression of All Urban and Rural Samples) | ||
|---|---|---|
| Digitalization * urban/rural | Digitalization2 * urban/rural | |
| Sex | ||
| Male | 0.0025 (0.0044) | −0.0001 (0.0002) |
| Female | 0.0089 (0.0041) ** | −0.0007 (0.0002) *** |
| Educational phase | ||
| Secondary education | −0.0039 (0.0094) | −0.0008 (0.0005) * |
| Higher education | 0.0095 (0.0031) *** | −0.0003 (0.0001) * |
| Family members | ||
| Three or less | 0.0177 (0.0065) *** | −0.0007 (0.0003) ** |
| Four | 0.0198 (0.0103) * | −0.0002 (0.0005) |
| Five | 0.0191 (0.0107) * | −0.0004 (0.0005) |
Disclaimer/Publisher’s Note: The statements, opinions and data contained in all publications are solely those of the individual author(s) and contributor(s) and not of MDPI and/or the editor(s). MDPI and/or the editor(s) disclaim responsibility for any injury to people or property resulting from any ideas, methods, instructions or products referred to in the content. |
© 2023 by the authors. Licensee MDPI, Basel, Switzerland. This article is an open access article distributed under the terms and conditions of the Creative Commons Attribution (CC BY) license (https://creativecommons.org/licenses/by/4.0/).
Share and Cite
Sun, D.; Yu, B.; Ma, J. Research on the Impact of Digital Empowerment on China’s Human Capital Accumulation and Human Capital Gap between Urban and Rural Areas. Sustainability 2023, 15, 5458. https://doi.org/10.3390/su15065458
Sun D, Yu B, Ma J. Research on the Impact of Digital Empowerment on China’s Human Capital Accumulation and Human Capital Gap between Urban and Rural Areas. Sustainability. 2023; 15(6):5458. https://doi.org/10.3390/su15065458
Chicago/Turabian StyleSun, Dapeng, Bintong Yu, and Jun Ma. 2023. "Research on the Impact of Digital Empowerment on China’s Human Capital Accumulation and Human Capital Gap between Urban and Rural Areas" Sustainability 15, no. 6: 5458. https://doi.org/10.3390/su15065458