Article

Mapping Impacts of Climate Change on the Distributions of Two Endemic Tree Species under Socioeconomic Pathway Scenarios (SSP)

by
Barham A. HamadAmin
and
Nabaz R. Khwarahm
*
Department of Biology, College of Education, University of Sulaimani, Sulaimani 334, Kurdistan Region, Iraq
*
Author to whom correspondence should be addressed.
Sustainability 2023, 15(6), 5469; https://doi.org/10.3390/su15065469
Submission received: 10 February 2023 / Revised: 1 March 2023 / Accepted: 17 March 2023 / Published: 20 March 2023
(This article belongs to the Section Sustainability, Biodiversity and Conservation)

Abstract

:
Pistacia eurycarpa Yalt and Pistacia khinjuk Stocks are two important endemic tree species inhabiting mountainous regions in Iraq. Their cultural, medical, and ecological benefits have captured the interest of this study. Numerous researchers have revealed how and to what extent global climate change alters species’ habitats and distribution. This approach aims to quantify the current and future distribution of these tree species in the region and to provide baseline data on how Pistacia respond to the changing environment. Three socioeconomic pathway scenarios (SSP 126, 245, and 585) in two general circulating models (GCMs), MIROC-ES2L and BCC-CSM2-MR, have been utilized to examine the probable future geographical shift of these species during different time periods (2041–2060, 2061–2080, and 2081–2100). This study used the MaxEnt model and geospatial techniques for: (i) anticipating the present level of distributions and assessing the impact of climate change on these species’ possible future distributions; (ii) estimating the areas of species overlap; and (iii) finding the most significant environmental variables shaping their distributions, according to 11 environmental variables and 161 known localities. The findings revealed that 30 out of 36 modeling results showed range expansion in both the MIROC-ES2L and BCC-CSM2-MR models with 16/18 for P. eurycarpa and 14/18 for P. khinjuk. The overall species range expansions and increase in habitat suitability (mainly in the north and northeast) were related to precipitation during the wettest months, topography, and soil type structure (i.e., Chromic Vertisols, Lithosols, and Calcic Xerosols). These recent discoveries provide priceless new information for forestry management efforts and the conservation plan in Iraq, particularly in the overlapping areas in the mountainous regions and highlands. Geospatial approaches and correlation-based modeling are effective tools for predicting the spatial pattern of tree species in the mountain environment.

1. Introduction

The genus Pistacia (Pistacia L. 1753) belongs to the order Sapindales and the Anacardiaceae family. The taxonomy of the genus’ eleven species is based on factors such as molecular analysis, morphology of the leaf, and floral structure [1]. Pistacia can be observed on sandstone and limestone hills with an elevation range of 30 to 2500 m, steep dry slopes, and rocky hillsides. The genus originated in Central Asia, and according to Mohannad G and Duncan M [2], it is distributed across southern Europe (the Mediterranean area), West and northern Africa, Central Asia, Central America, and the Middle East [3]. Its distribution in the Middle East is especially concentrated in the Kurdistan Region of Iraq (KRI), where it is located between the northeast of Iraq, southern Turkey, northeast Syria, and western Iran [4].
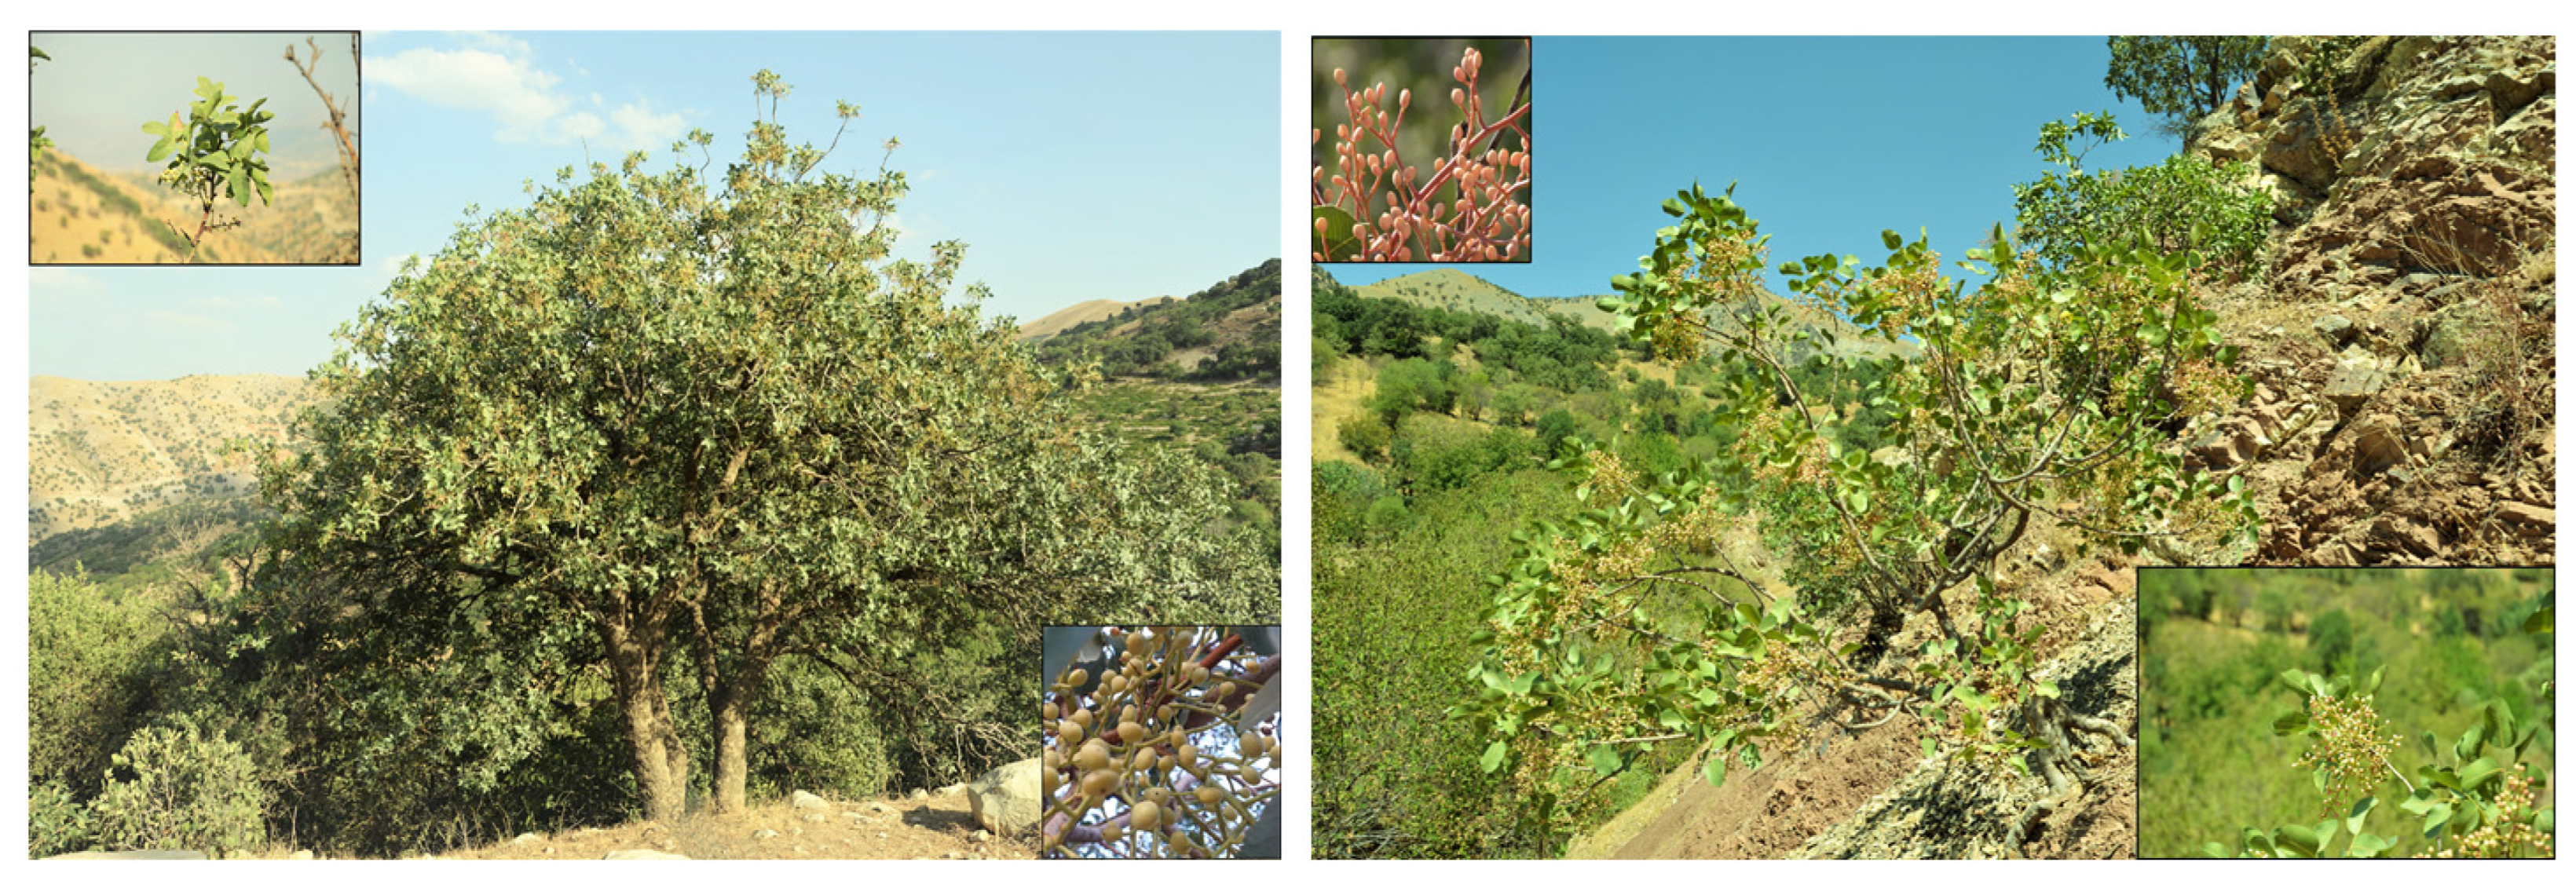
Only three Pistacia species, Pistacia eurycarpa Yalt, Pistacia vera L., and Pistacia khinjuk Stocks, have been described and well documented so far, in the KRI [2,3]. Only P. vera L., is grown in cultivation; while the other two species are endemic to the KRI’s Sulaimani, Erbil, Duhok, and Halabja Governorates (Figure 1). P. khinjuk and P. eurycarpa (Figure 2) reach heights of 3 to 7 m and 4 to 20 m, respectively. Additionally, P. eurycarpa according to the conclusion of Rankou, et al. [5] is the same as P. atlantica subsp. kurdica, which is a native Kurdish wild tree plant, which the locals call “Dar qezwan” or “Dareben” [4].
Currently, in Iraq, habitat degradation [6,7,8], overexploitation (ruthless collecting by people for domestic needs, such as firewood, medicine, and national trafficking), forest fires [9] and warfare [10] are some of the threats that significantly influence forest trees, including P. khinjuk and P. eurycarpa. These threats could increase as the climate changes. Global climate change and other factors, including elevation and soil properties, affect numerous types of plant species, particularly their spatial distributions [11]. Not only does climate change affect present plant phenology, physiology, or distribution, but it also affects how the species will fare in the future [11,12,13]. The target species of this study have remarkable cultural, ecological, and ethnobotanical values. For example, isolated compounds and crude extracts of such species, including flavonoids, oil, resin, tocopherols, fatty acids, phytosterols, and phenolic compounds, have remarkable pharmacological features and medicinal significance (e.g., analgesic, anti-inflammatory, antifungal, antimicrobial) [14], in addition to their important contribution to the stabilization and integration of the ecosystem of the forest and their nutritional qualities [15]. Moreover, locals consume the fruits of P. eurycarpa, which has considerable antibacterial action against Helicobacter pylori, as well as utilize the resin from the plant to manufacture chewing gum, jam, and food [16], and to aid digestion and stomach relief [17]. Animals in veterinary departments have been treated with the fruits and leaves from P. khinjuk, and the resin is used to alleviate nausea, motion sickness, and stomach pain [15].
Previous research on Pistacia has mostly concentrated on its medicinal features [16,18,19], ethnobotany [4,14,20], cytology [21,22], classification [2], molecular biology [23,24,25], morphology [24,26], anatomy [21,27], and to a limited extent, distributions [1,28]. Nevertheless, to the best of the researchers’ knowledge, no comprehensive studies about the geographic ranges of the Pistacia genus have ever been conducted in Iraq, and none have considered the present and future potential distributions of the P. eurycarpa and P. khinjuk species. Thus, gathering baseline data on these two tree species in Iraq’s mountain ecosystems will help us better understand how climate change is affecting the area and what management measures are working.
In terms of the current methodologies, the most extensively used methods for mapping and assessing species distributions in respect to environmental indicators are geographic information systems (GIS) and species distribution models (SDMs) [29]. Statistical methods are used in SDMs to assess and predict the species spatiotemporal occurrence [30,31]. SDMs estimate the species geographical distribution, namely, the probable locations where the species’ presence meets its environmental characteristics [32]. They can also be used to identify locations that might be used to organize future survey efforts, mark protected areas for conservation initiatives, reintroduce species, and provide important assistance in discovering previously undiscovered populations [33]. As a machine learning technique, maximum entropy (MaxEnt) is the least sensitive to small sample sizes that relies on presence-only data, and is one of the most extensively used and well-applied models among the SDMs [34].
In this study we aim to: (i) predict and map the present and future spatial distributions for these species in Iraq; (ii) estimate the distributional variations between the present and future statuses (loss and gain, shift of range); (iii) map areas where the two species’ ranges overlap; (iv) identify pertinent environmental factors affecting the species’ distribution; and (v) estimate the direction and magnitude of the region shift from the present to the future.

2. Materials and Methods

2.1. Study Area

Iraq is situated in the Middle East, covering an area of 438,320 km2, and is bordered by Iran to the east, and Jordan to the west, Turkey to the north, and the Arabian Gulf and the Kingdom of Saudi Arabia to the south (longitude: 38°45 to 48°45′ E and latitude: 29°15′ N to 38°15′ N) (Figure 1). Iraq is divided into four major physiographic regions: the northeastern highlands, the uplands (areas of undulating and hilly terrain in the north between the Euphrates and Tigris), the central and southeast plains of alluvial (marshlands), and the western and southern desert [35,36]. Additionally, it has four distinct seasons: fall (October to November), a hot and dry summer (July to October), spring (March to May), and a chilly and rainy winter (December to February). The driest seasons are summer and autumn, while winter and spring get around 90% of the yearly precipitation [37]. Most of Iraq’s Kurdish population lives in the northeast of the country, where the Zagros Mountains rise with several peaks. The mountains and highlands are often inaccessible with an elevation range from 800 to 3544 m [38]. In the desert of the southern region to the mountainous areas of the northeastern region, the average daily mean temperature during the past year and the precipitation ranges from 28 °C to 9.8 °C and below 100 mm/year to more than 900 mm/year, respectively. The country is prone to drought and heat wave calamities because of the exceptionally high temperatures and near nonexistent rainfall from May to October [37]. Erbil, Duhok, Sulaimani, and Halabja are the four governorates that make up the KRI, which is placed at 37°38′ N 46°35′ E and has an overall area of 51,173.65 km2. The KRI is dry and hot in the summer and wet and cold in the winter [39,40]. The KRI is used as the model boundary in this research due to the region’s similarity in terms of climate, physiography, and forest structure and composition [39].

2.2. Ground Data for P. eurycarpa Yalt and P. khinjuk Stock

Multiple surveys were carried out in the Sulaimani Governorate between 14 July and 25 December 2021 to obtain the presence data for both species. These data were gathered using the stratum sampling technique [41]. The villagers’ expertise and Flora of Iraq [3], together with a handbook guide, have all been crucial in identifying and gathering the data. Each sample record was visited, looked through, photographed, and herbarium-ready (Figure A1). Plant phenotypes (observable characteristics) were used in this research to recognize and classify both species. Moreover, 161 GPS ground records (P. eurycarpa = 89, P. khinjuk = 72) were initially collected as a result of the survey efforts. Based on Boakes, et al. [42], geographical filtering of 1 km was performed to the dataset to minimize the spatial autocorrelation between the sites. This resulted in a reduction of the points of sample to 135 records (n = 78 and n = 57, for both species). Applying the spatial filtering approach is beneficial in reducing sample error and improving the variability of the altitudinal differences among the sites [43]. For the spatial filtering and quality verification, the extended SDMtoolbox 2.5 and ArcGIS 10.3 (ESRI, Redland, CA, USA) software were used [44].

2.3. Environmental Datasets

According to Guest and Townsend [3], both species are frequently found in Iraq’s forest zones and sporadically in the forest-steppe transition and moist steppe zones. This is especially true in the northeastern regions, which primarily include the governorates of Duhok, Erbil, Sulaimani, and Halabja. Pistacia does not naturally exist in other regions of Iraq. The KRI’s geographical scope was thus, used for our modeling needs to extract the environmental variables, while clipping off the research region (Figure 1). Numerous research has emphasized the significance of a specified geographic range in SDM modeling [45,46]. Climate, topography, and edaphic environmental factors are some of the major factors affecting the species’ range [47,48]. Multiple environmental factors have been used to develop the model. To construct the model, 19 bioclimatic variables were taken into account for the present (from 1970 to 2000) and future climatic time frames (i.e., 2041–2060, 2061–2080, and 2081–2100), under three common socioeconomic pathways (SSP 585, 245 and 126) [49]. The present and future climate data were obtained from the world climate database (www.worldclim.org) [50]. The Earth System version 2 for long-term simulations (MIROC-ES2L) and the Beijing Climate Center Climate System Model (BCC-CSM2-MR), two models from the most recent sixth level of the Coupled Model Intercomparison Project (CMIP6), are included in the future climate models [51].
In comparison to earlier models (i.e., CMIP5), the CMIP6 models are very reflective of the concentrations of greenhouse gases (GHG) and provide superior simulations of temperature under atmosphere–biosphere transitions, complex topography, and an improvement in model resolution. In order to comprehend: (i) the future climate in the context of internal variability, predictability, and uncertainty, (ii) the Earth’s reaction to forcing, (iii), the origin of the models’ systematic biases, and (iv) the cause of the models’ systematic biases, the CMIP6 models include specific climatic issues. In CMIP6, the current analysis made use of the recently created future scenarios [52], known as shared socioeconomic pathways (SSPs) that upgrade the depiction of the expected socioeconomic and technological growth in the scenarios of future climatic conditions [53]. Only three of the five SSP scenarios, fossil fuel-based development (SSP5), middle-of-the-road development (SSP2), and sustainable development (SSP1), were actually employed [53].
The topographic variables were collected from the Shuttle Radar Topography Mission (SRTM) (http://srtm.csi.cgiar.org/srtmdata/ (accessed on 1 February 2022)), including the DEM (digital elevation model), aspect (estimated in degree from the DEM), and slope. The remaining edaphic factors, including the soil pH and soil moisture level, were also retrieved from the Center for Sustainability and the Global Environment (SAGE) (http://www.sage.wisc.edu/atlas/index.php (accessed on 10 February)) database. Additionally, the datasets for geology and soil type were obtained from the Food and Agriculture Organization of the United Nations (https://www.fao.org/soils-portal/data-hub/soil-maps-and-databases/ (accessed on 1 March 2022)) and the United States Geological Survey (https://certmapper.cr.usgs.gov/data/apps/world-maps/ (accessed on 1 March 2022)).
The ArcGIS 10.3 software was utilized to pre-process the data and spatially resample all the variables to a resolution of 1 km [54]. Due to the great spatial correlation (collinearity) among the variables, for both species, out of the 27 environmental parameters only 11 were involved in the model construction (Table 1). To keep predictors with a pairwise Pearson’s correlation of |r| 0.8, a conditional threshold technique was used in order to avoid collinearity [55]. For the predictors, the pairwise Pearson’s correlation analysis was performed using the SDMtoolbox extension and ArcGIS 10.3. (ESRI, Redland, CA, USA) [56].

2.4. Model Building

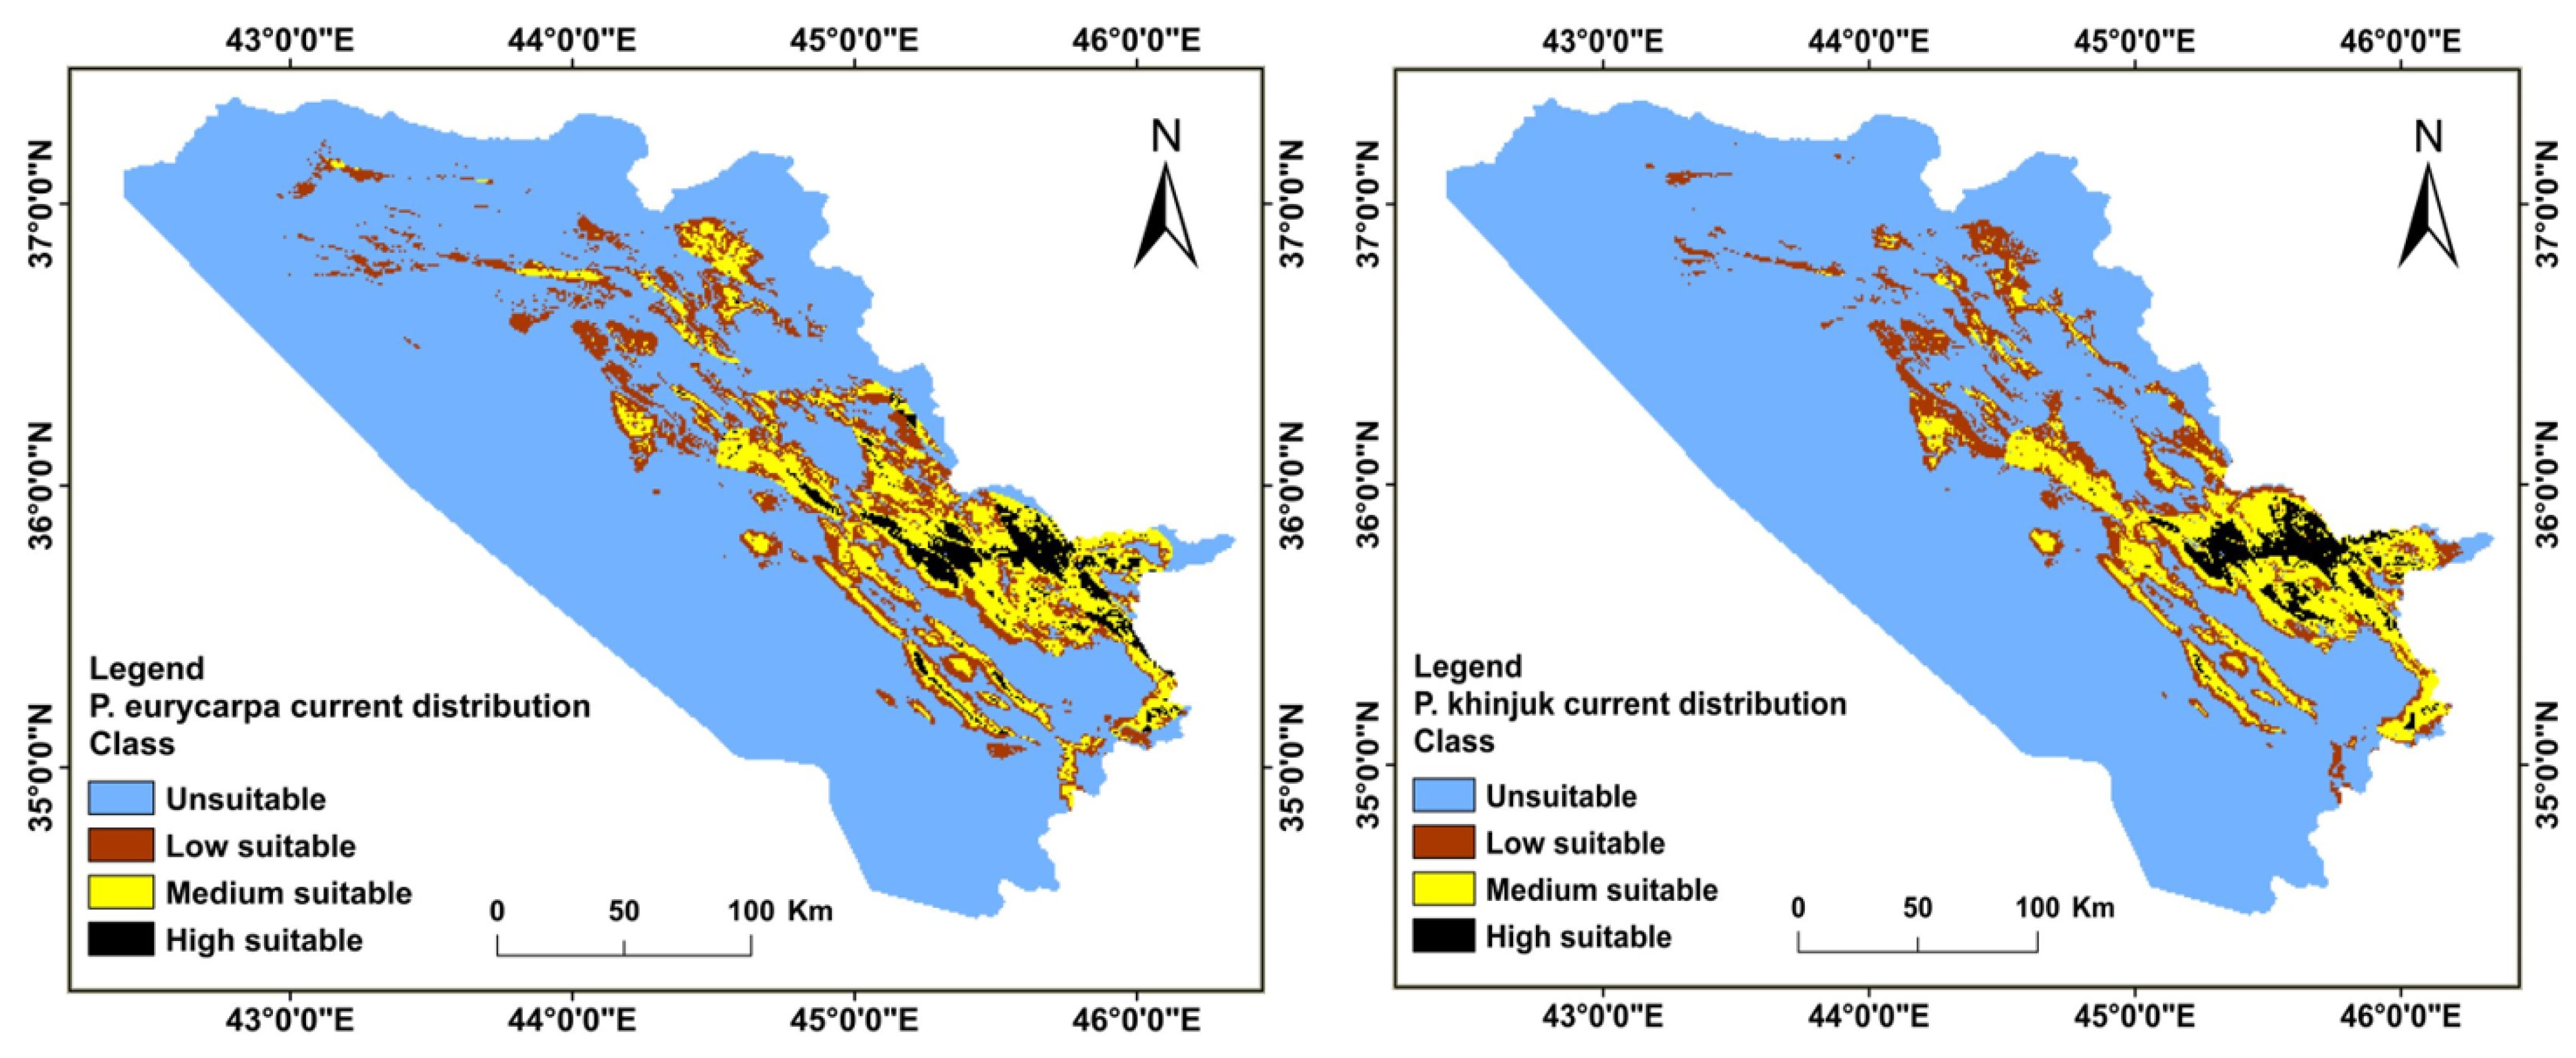
The MaxEnt model was chosen due to its ability to produce results that are comparable to those of presence–absence model approaches and presence-only dependent model types [34], as well as its superior predictive accuracy when compared with other approaches [32,57]. For P. eurycarpa and P. khinjuk, 70% of the presence data points were used to train the models, while the remaining 30% were used for model validation. In this investigation, the algorithm iterations maximum number was 500, with the choice of model replicate set to 10 (maximum entropy). The 10 model replicate option yields average habitat suitability maps for P. khinjuk and P. eurycarpa. To account for the species’ presence records (n = 78 and n = 57, respectively), the background points were adjusted to 570 [30]. The multiplier of regularization was adjusted to 1 [34]. Tuning the regularization multiplier may change how complicated or simple the model is. For example, raising the number above one makes the model simpler, while lowering the value below one makes the model more complex [58]. The jackknife test was also used, for assessing the factors’ relative significance and contributions to the likelihood of distribution of species’ habitats [59]. Additionally, from 10 model outputs (10 repetitions) the value of average (i.e., the value of the threshold) was utilized to define the likelihood of unsuitable distribution and habitat suitability for these species (occurrences probability) [60]. For P. eurycarpa and P. khinjuk distribution, pixels with values equal to or greater than 0.3 were deemed appropriate regions, whilst pixels with values lower than 0.3 were considered unsuitable areas. According to these threshold values, the suitability maps for the two species were classified as follows: high suitability (0.67–0.89), medium suitability (0.45–0.67), low suitability (0.3–0.45), and unsuitable (0–0.3) [61] (Figure 3). The ArcGIS 10.3 platform’s spatial analysis toolbox was employed to conduct these operations.

2.5. Model Evaluation

One of the most common evaluation metrics for the presence–dependent modeling approach is the area under the curve (AUC). The AUC is one of the most extensively utilized tools to evaluate a model’s discriminatory power that assesses how well the model outputs discriminate between locations where observations are present and absent [8]. The AUC values range from 0 to 1. The performance of the model has been divided into the following ranges: outstanding (0.9–1), very good (0.8–0.9), decent (0.7–0.8), acceptable (0.6–0.7), and bad (0.5–0.6) [62]. Other metrics, such as TSS [63], are often used in similar studies, however, TSS and AUC are highly correlated.

2.6. Analysis of the Distribution Change between the Habitat of the Present and Future for the Species

To estimate the transition between the present and future habitat distributions, several spatial techniques in the ArcGIS platform were deployed. Four categories were utilized to categorize the changes in distribution for the species in the KRI: (1) no change (i.e., it is inhabited by the species at the moment, and it is still occupied throughout time frames 2041–2060, 2061–2080, and 2081–2100 years); (2) no occupancy (i.e., the locations that are unsuitable now and that will remain unsuitable in the future); (3) expansion of the range (i.e., future habitats that will be suited to the species); and (4) contraction of the range (i.e., future regions that will be lost for every species). For the species over its range (i.e., geographical extent), the centroid was estimated to provide a clear understanding of the changes in distribution between the scenarios of the present and the future. Therefore, the study was carried out using SDMtoolbox, a GIS tool created by Brown, Bennett and French [56], to identify the centroid of the distribution changes in the suitable areas with attributes on the magnitude and direction, by condensing the geographical extent of the presence recordings to a single location (spatial mean).

3. Results

3.1. Performance of the Model

For P. khinjuk and P. eurycarpa, the AUC values of the model’s performance were 0.853 and 0.846, respectively, and the first species showed a stronger discriminatory power in the outputs of the model. Under the chosen environmental circumstances, for the two species, the likelihood of the distributions of habitat suitability as a whole showed a logical effectiveness.

3.2. Distributions of the Habitat in the Present and Future for P. khinjuk and P. eurycarpa

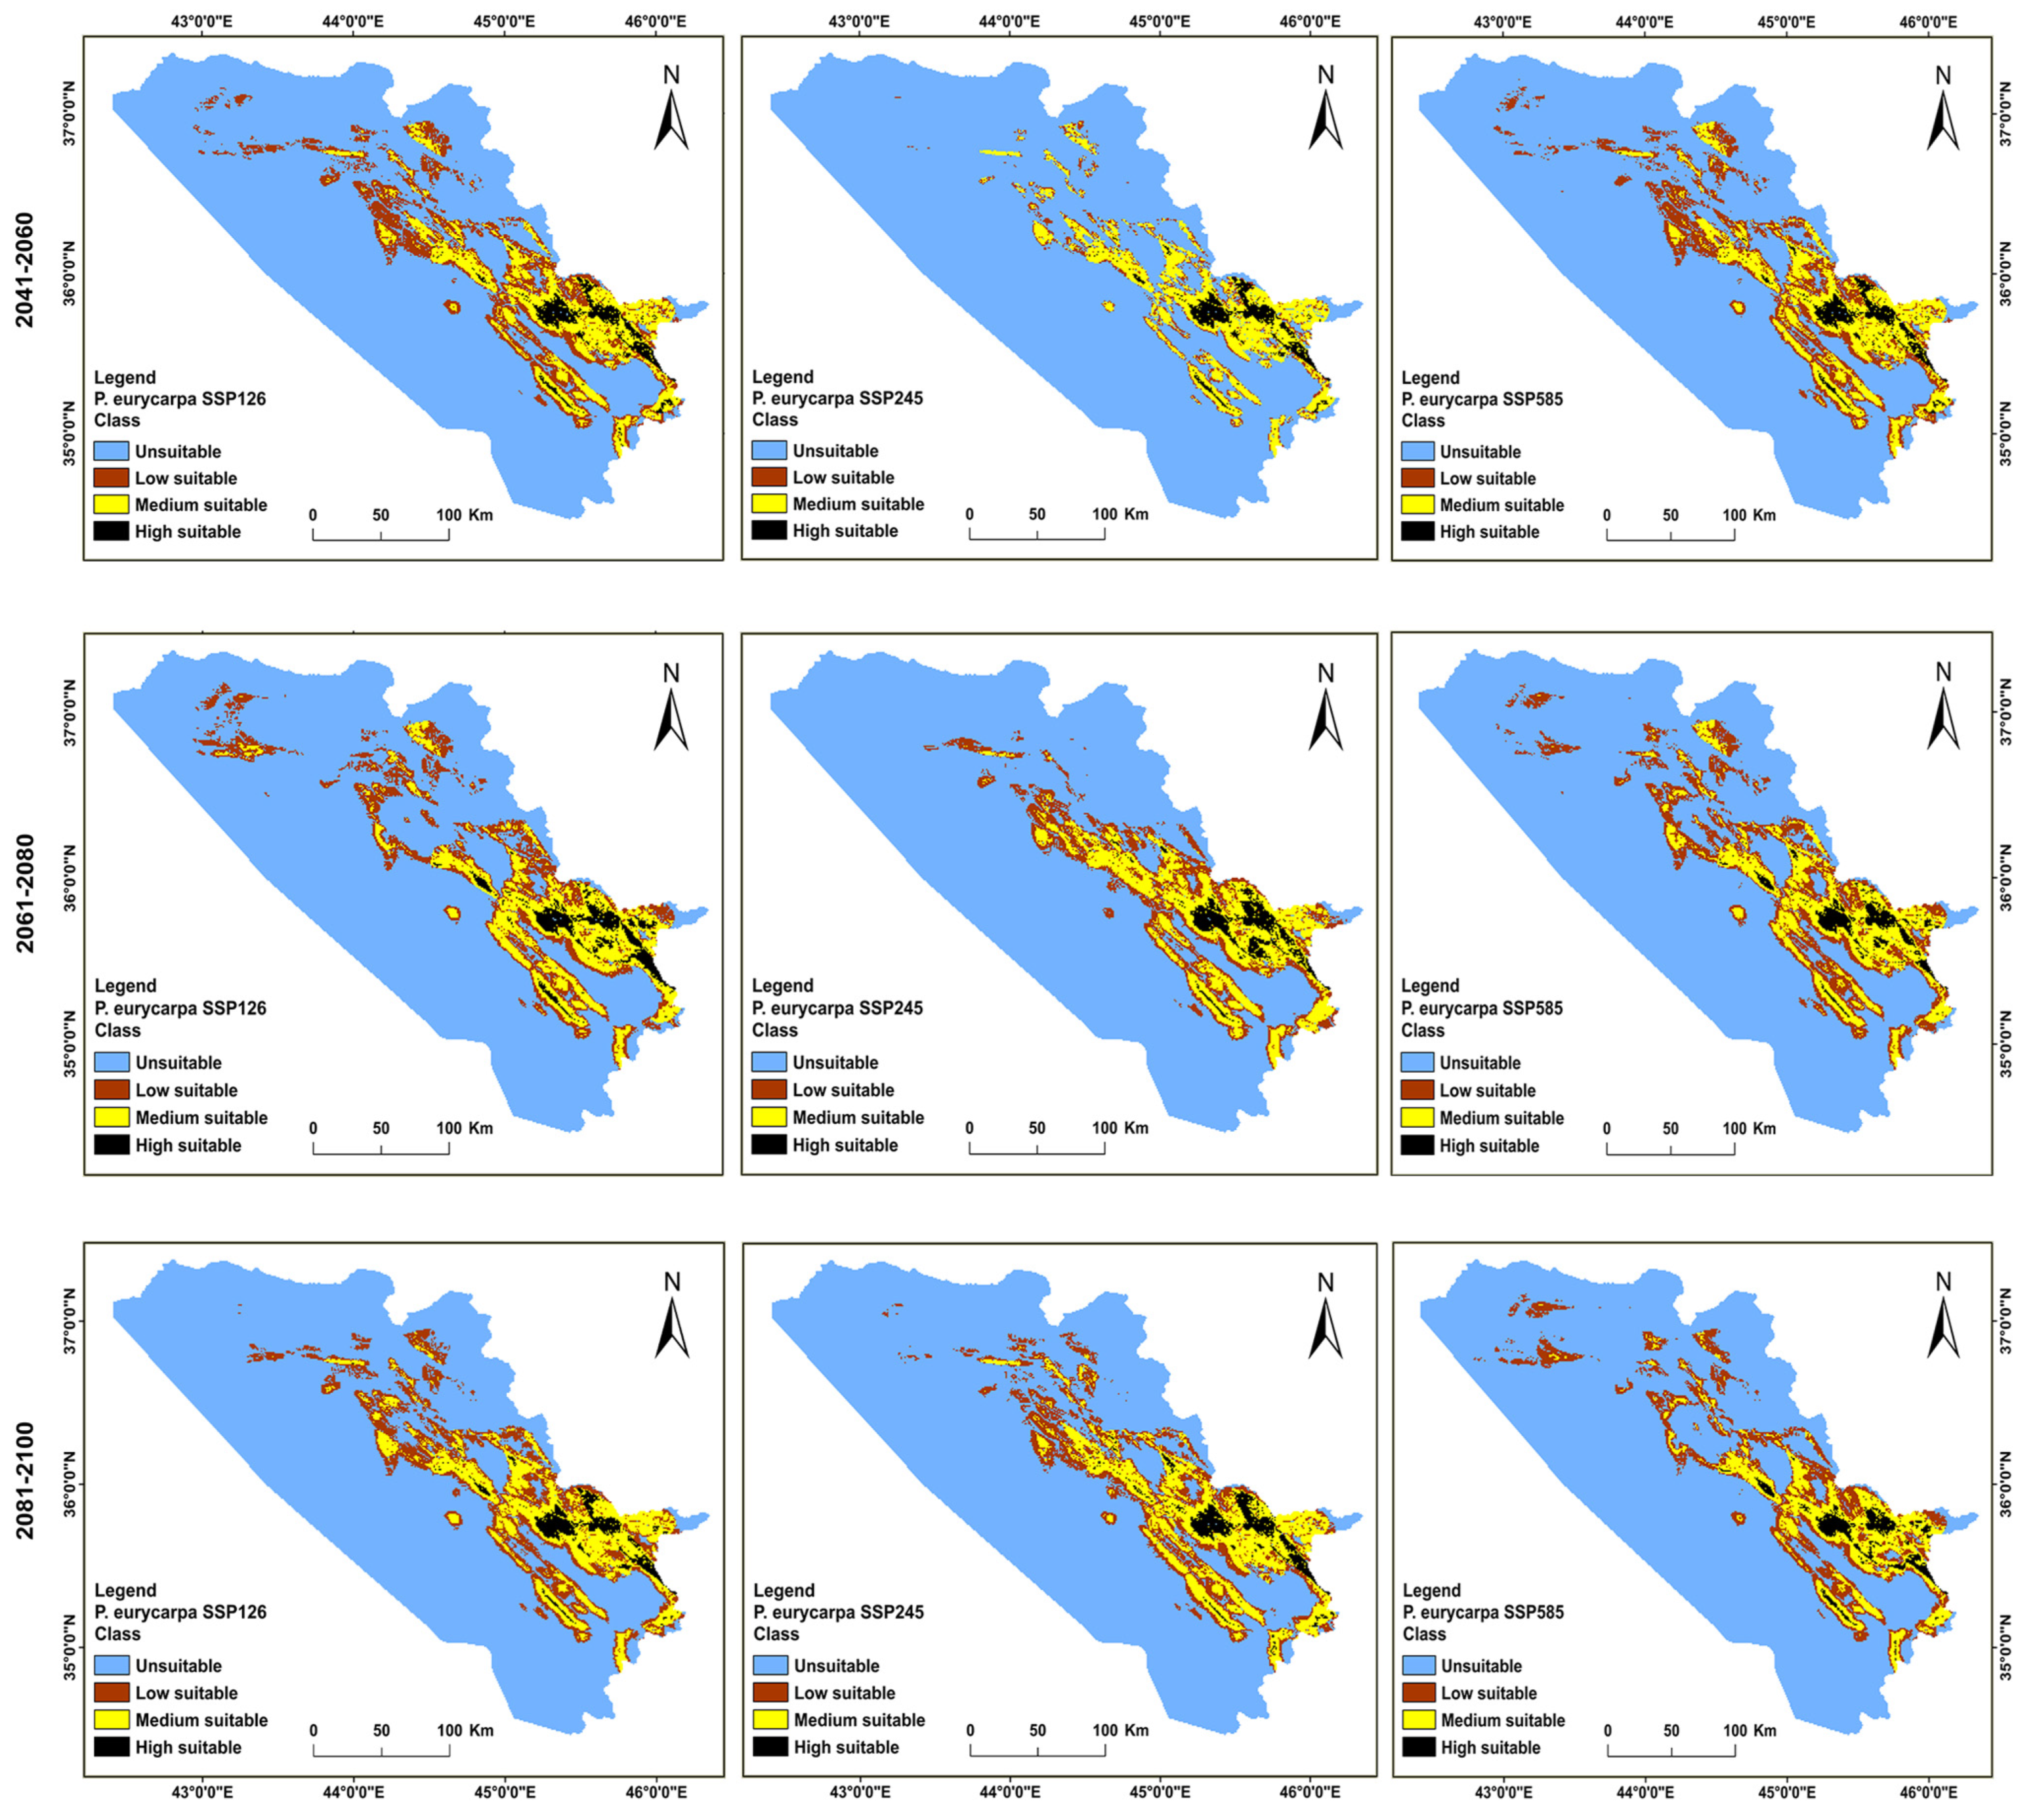
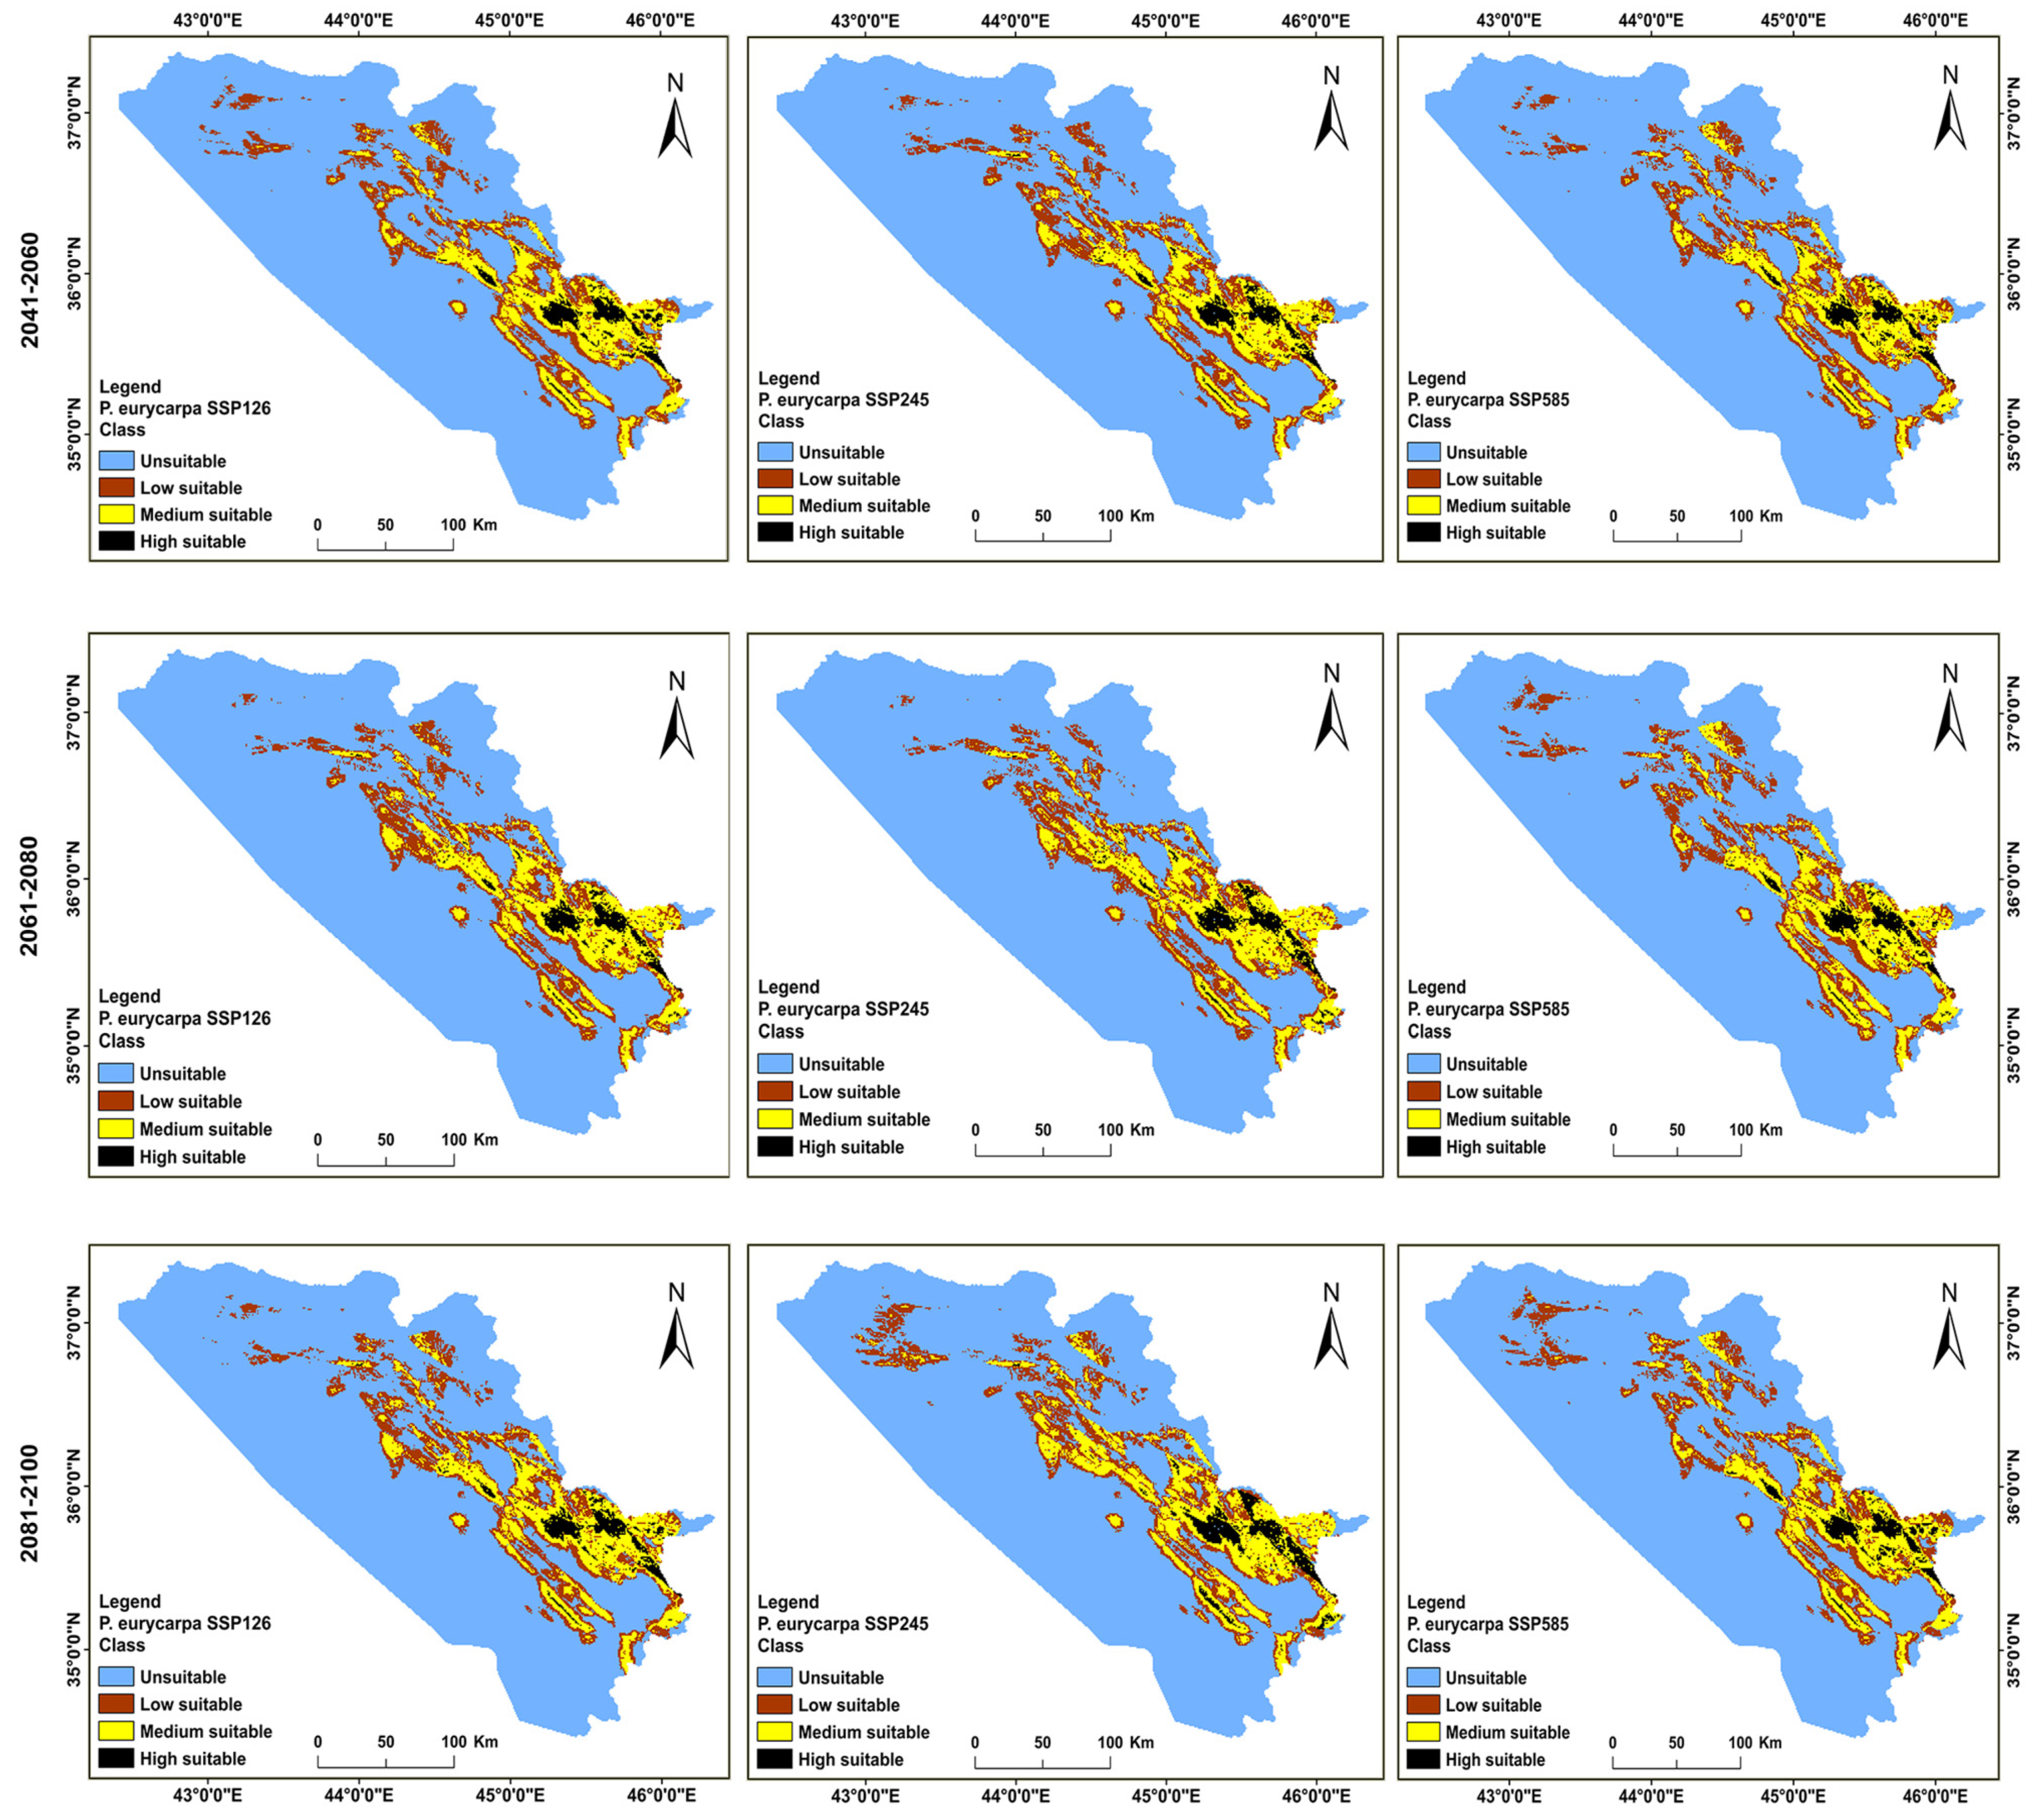
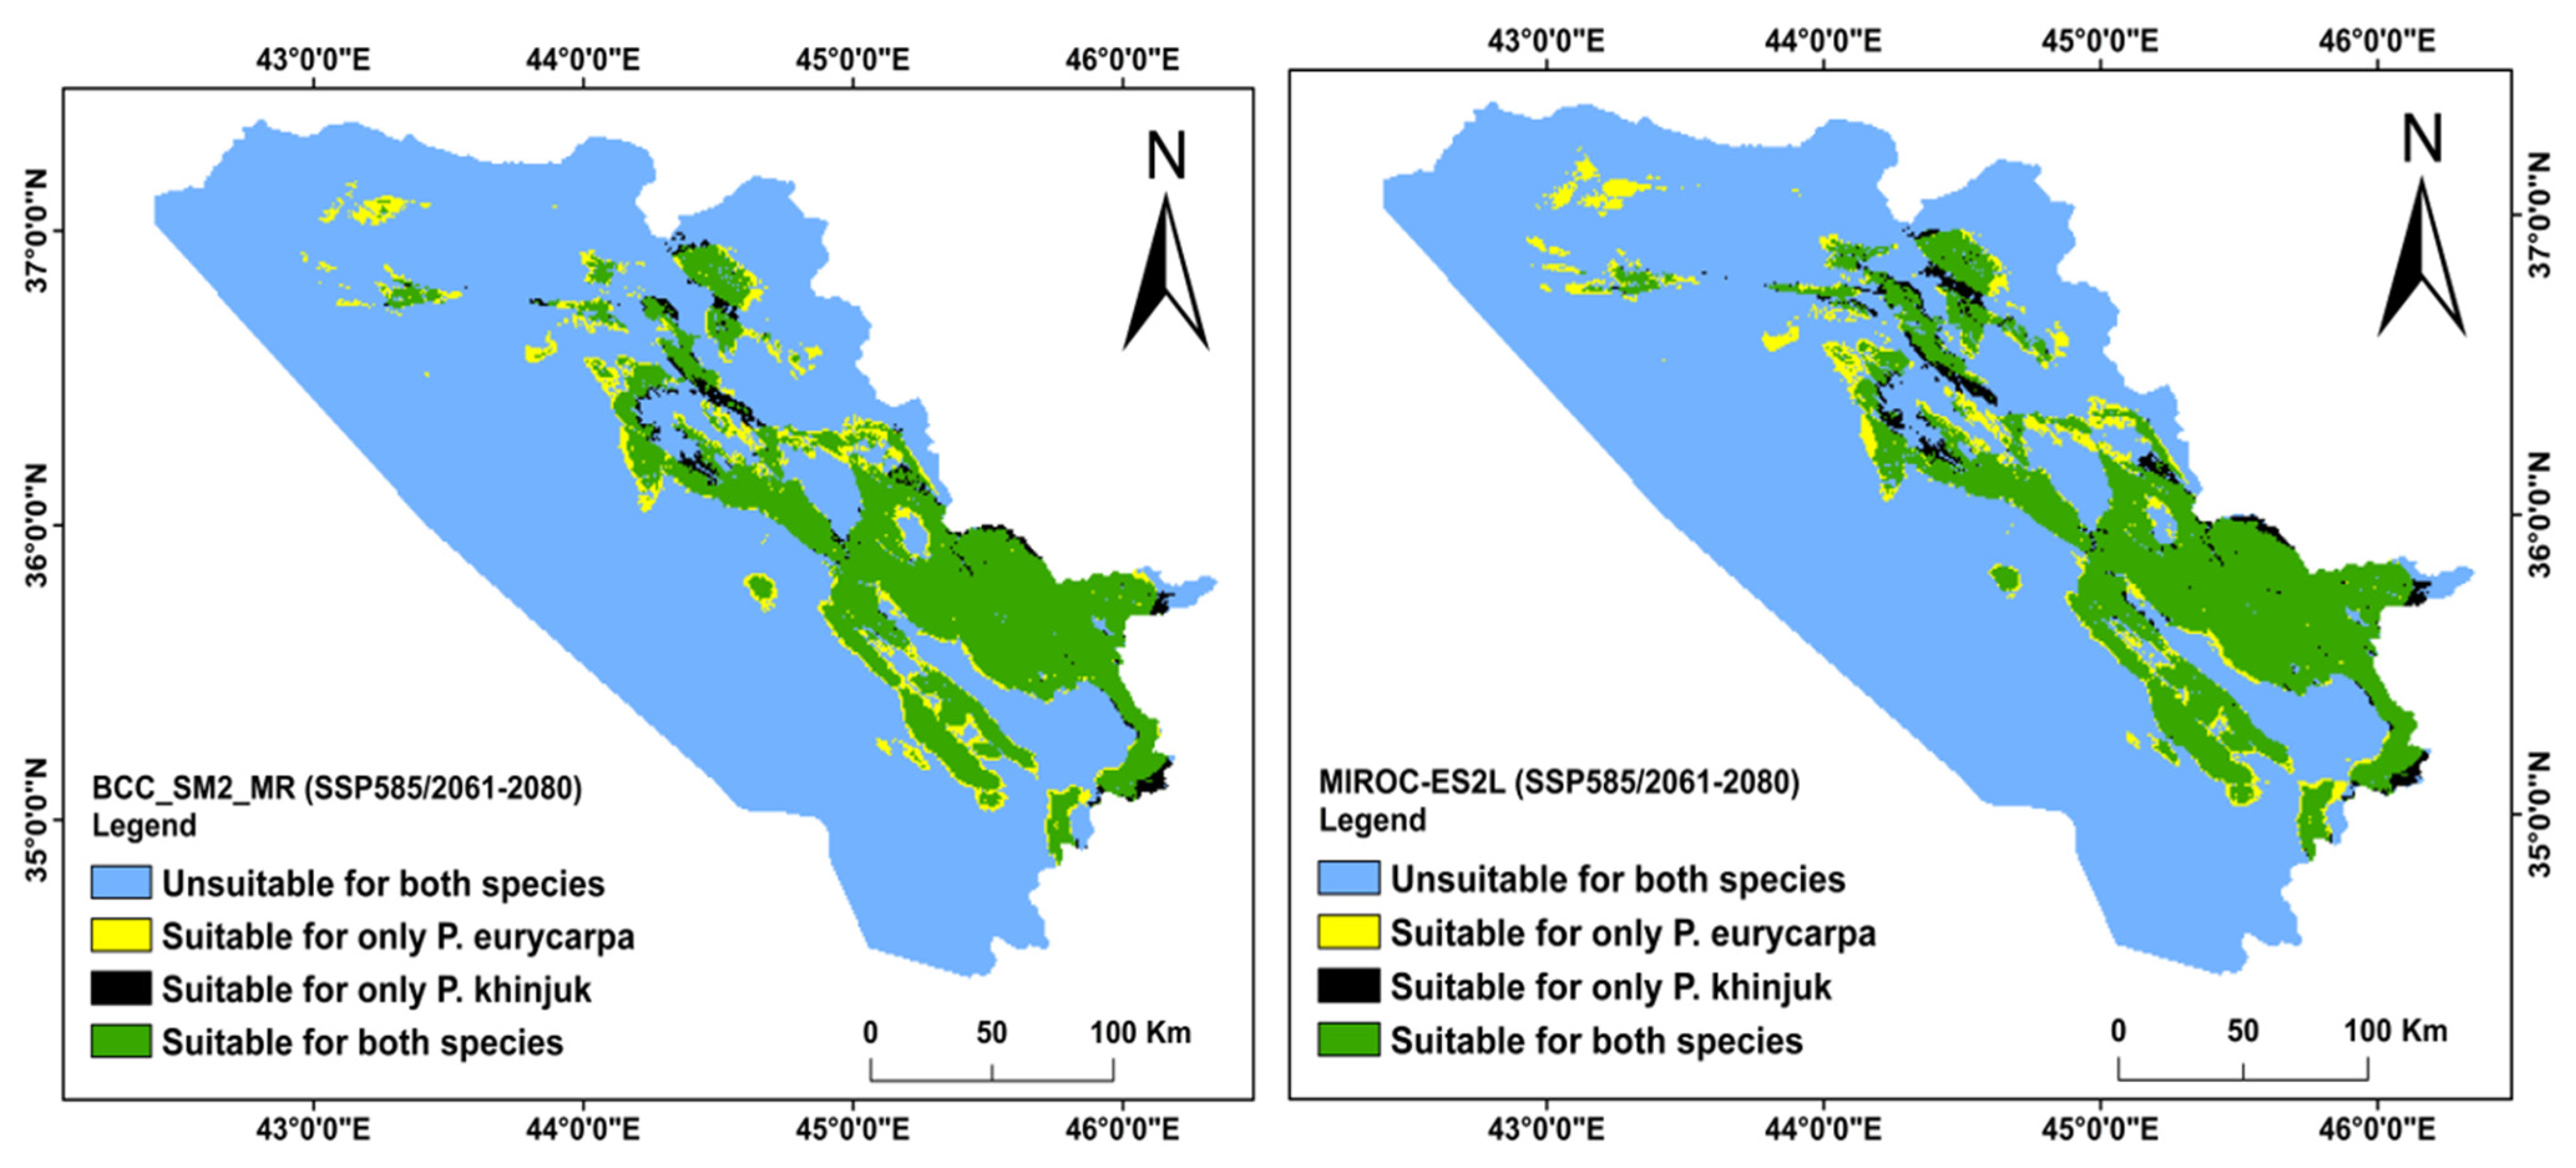
The simulations derived from the MIROC-ES2L and BCC-CSM2-MR climate models, for instance, reveal that the range of P. eurycarpa will change from its existing distribution under the SSP 585, 245 and 126 scenarios, during the periods 2041–2060, 2061–2080, and 2081–2100. Particularly, at the cost of the unsuitable sites, the species will gain some territory (grow in certain places). In the BCC-CSM2-MR models, the unsuitable regions grew the most by 3328 km2 (6.5%) under the SSP 245/2041–2060. While the SSP 585/2041–2060 had the largest area drop, by 605 km2 (1.18%). Additionally, it is anticipated that the previously acceptable regions will fluctuate in size depending on where they are located (habitat shift). For instance, it is predicted that the category of high suitability will decline in every utilized scenario, but that the overall classes of habitat suitability (i.e., high suitability, medium, and the sum of the low suitability areas) will enhance in all but the SSP245 scenario, which is predicted to decline in the 2041–2060 time period, from the recent 10,443 km2 (20.43%) to 7115 km2 (13.92%). However, it is anticipated that in all the applicable situations, employing the MIROC-ES2L models, both categories of high suitability and habitat unsuitability will diminish. However, for each scenario, the overall classes of suitability (i.e., the high suitability, medium, and the total of the low suitability areas) will rise (Table A2 and Table A3; Figure 4 and Figure 5).
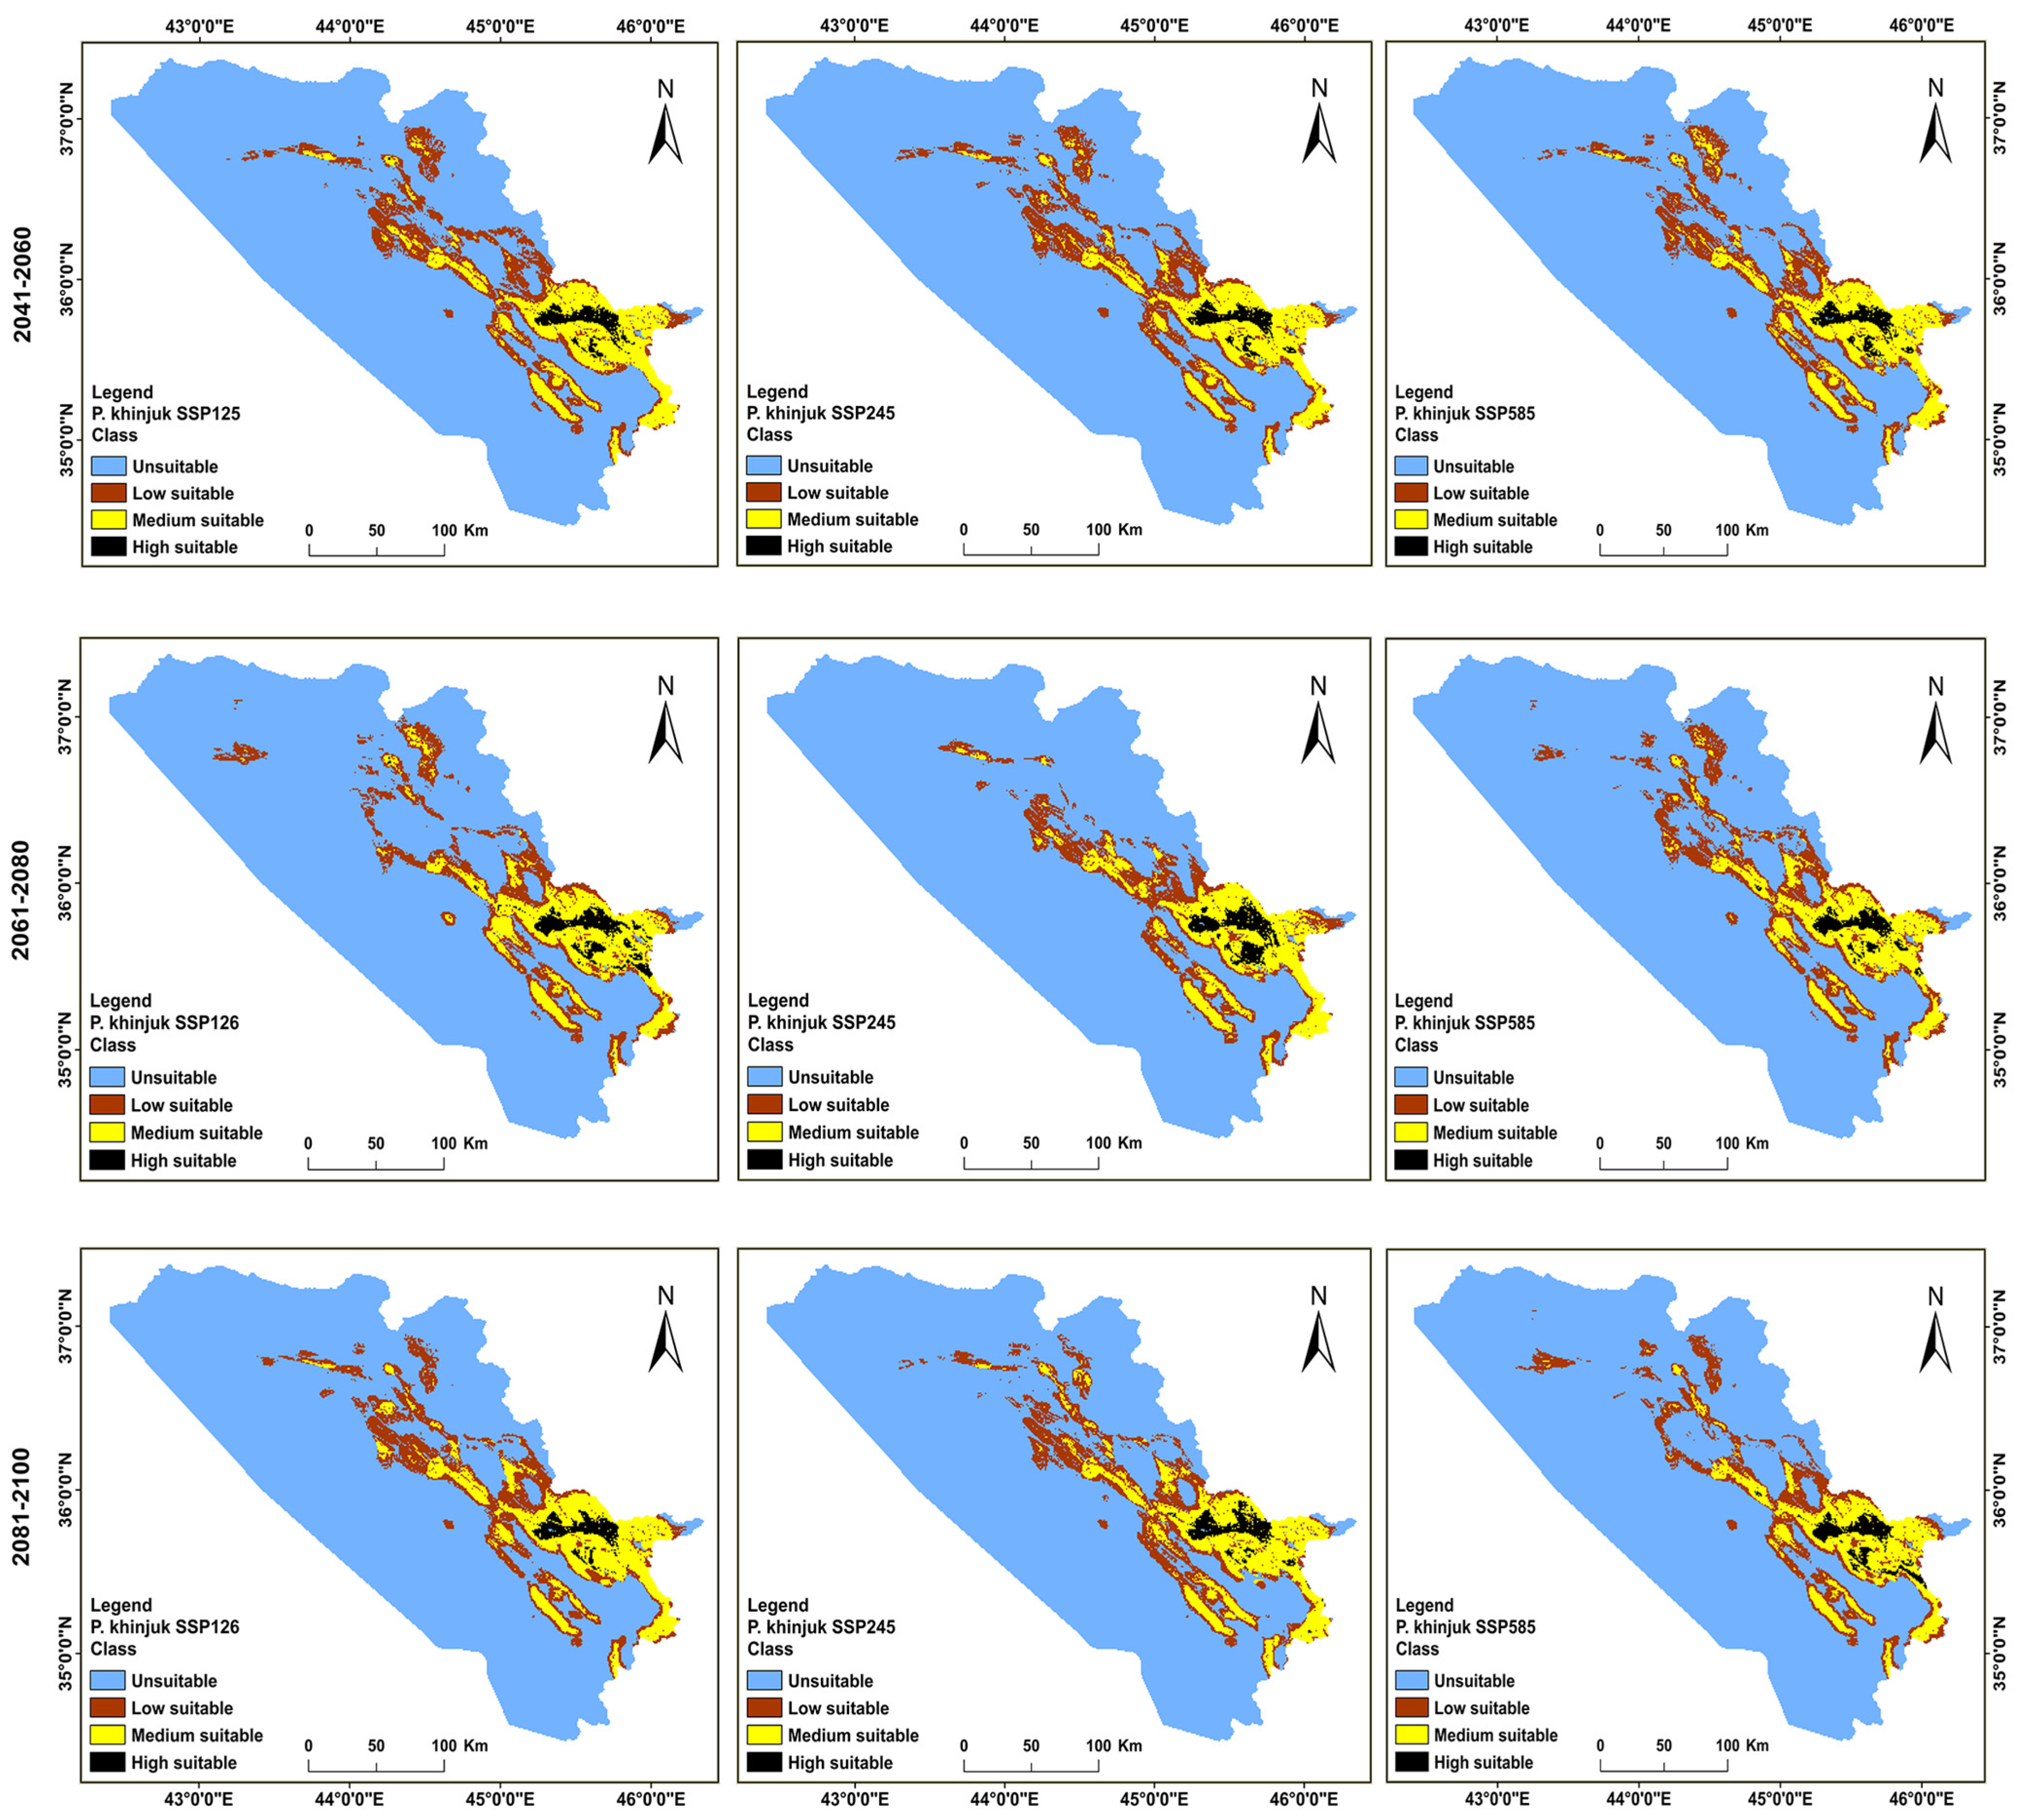
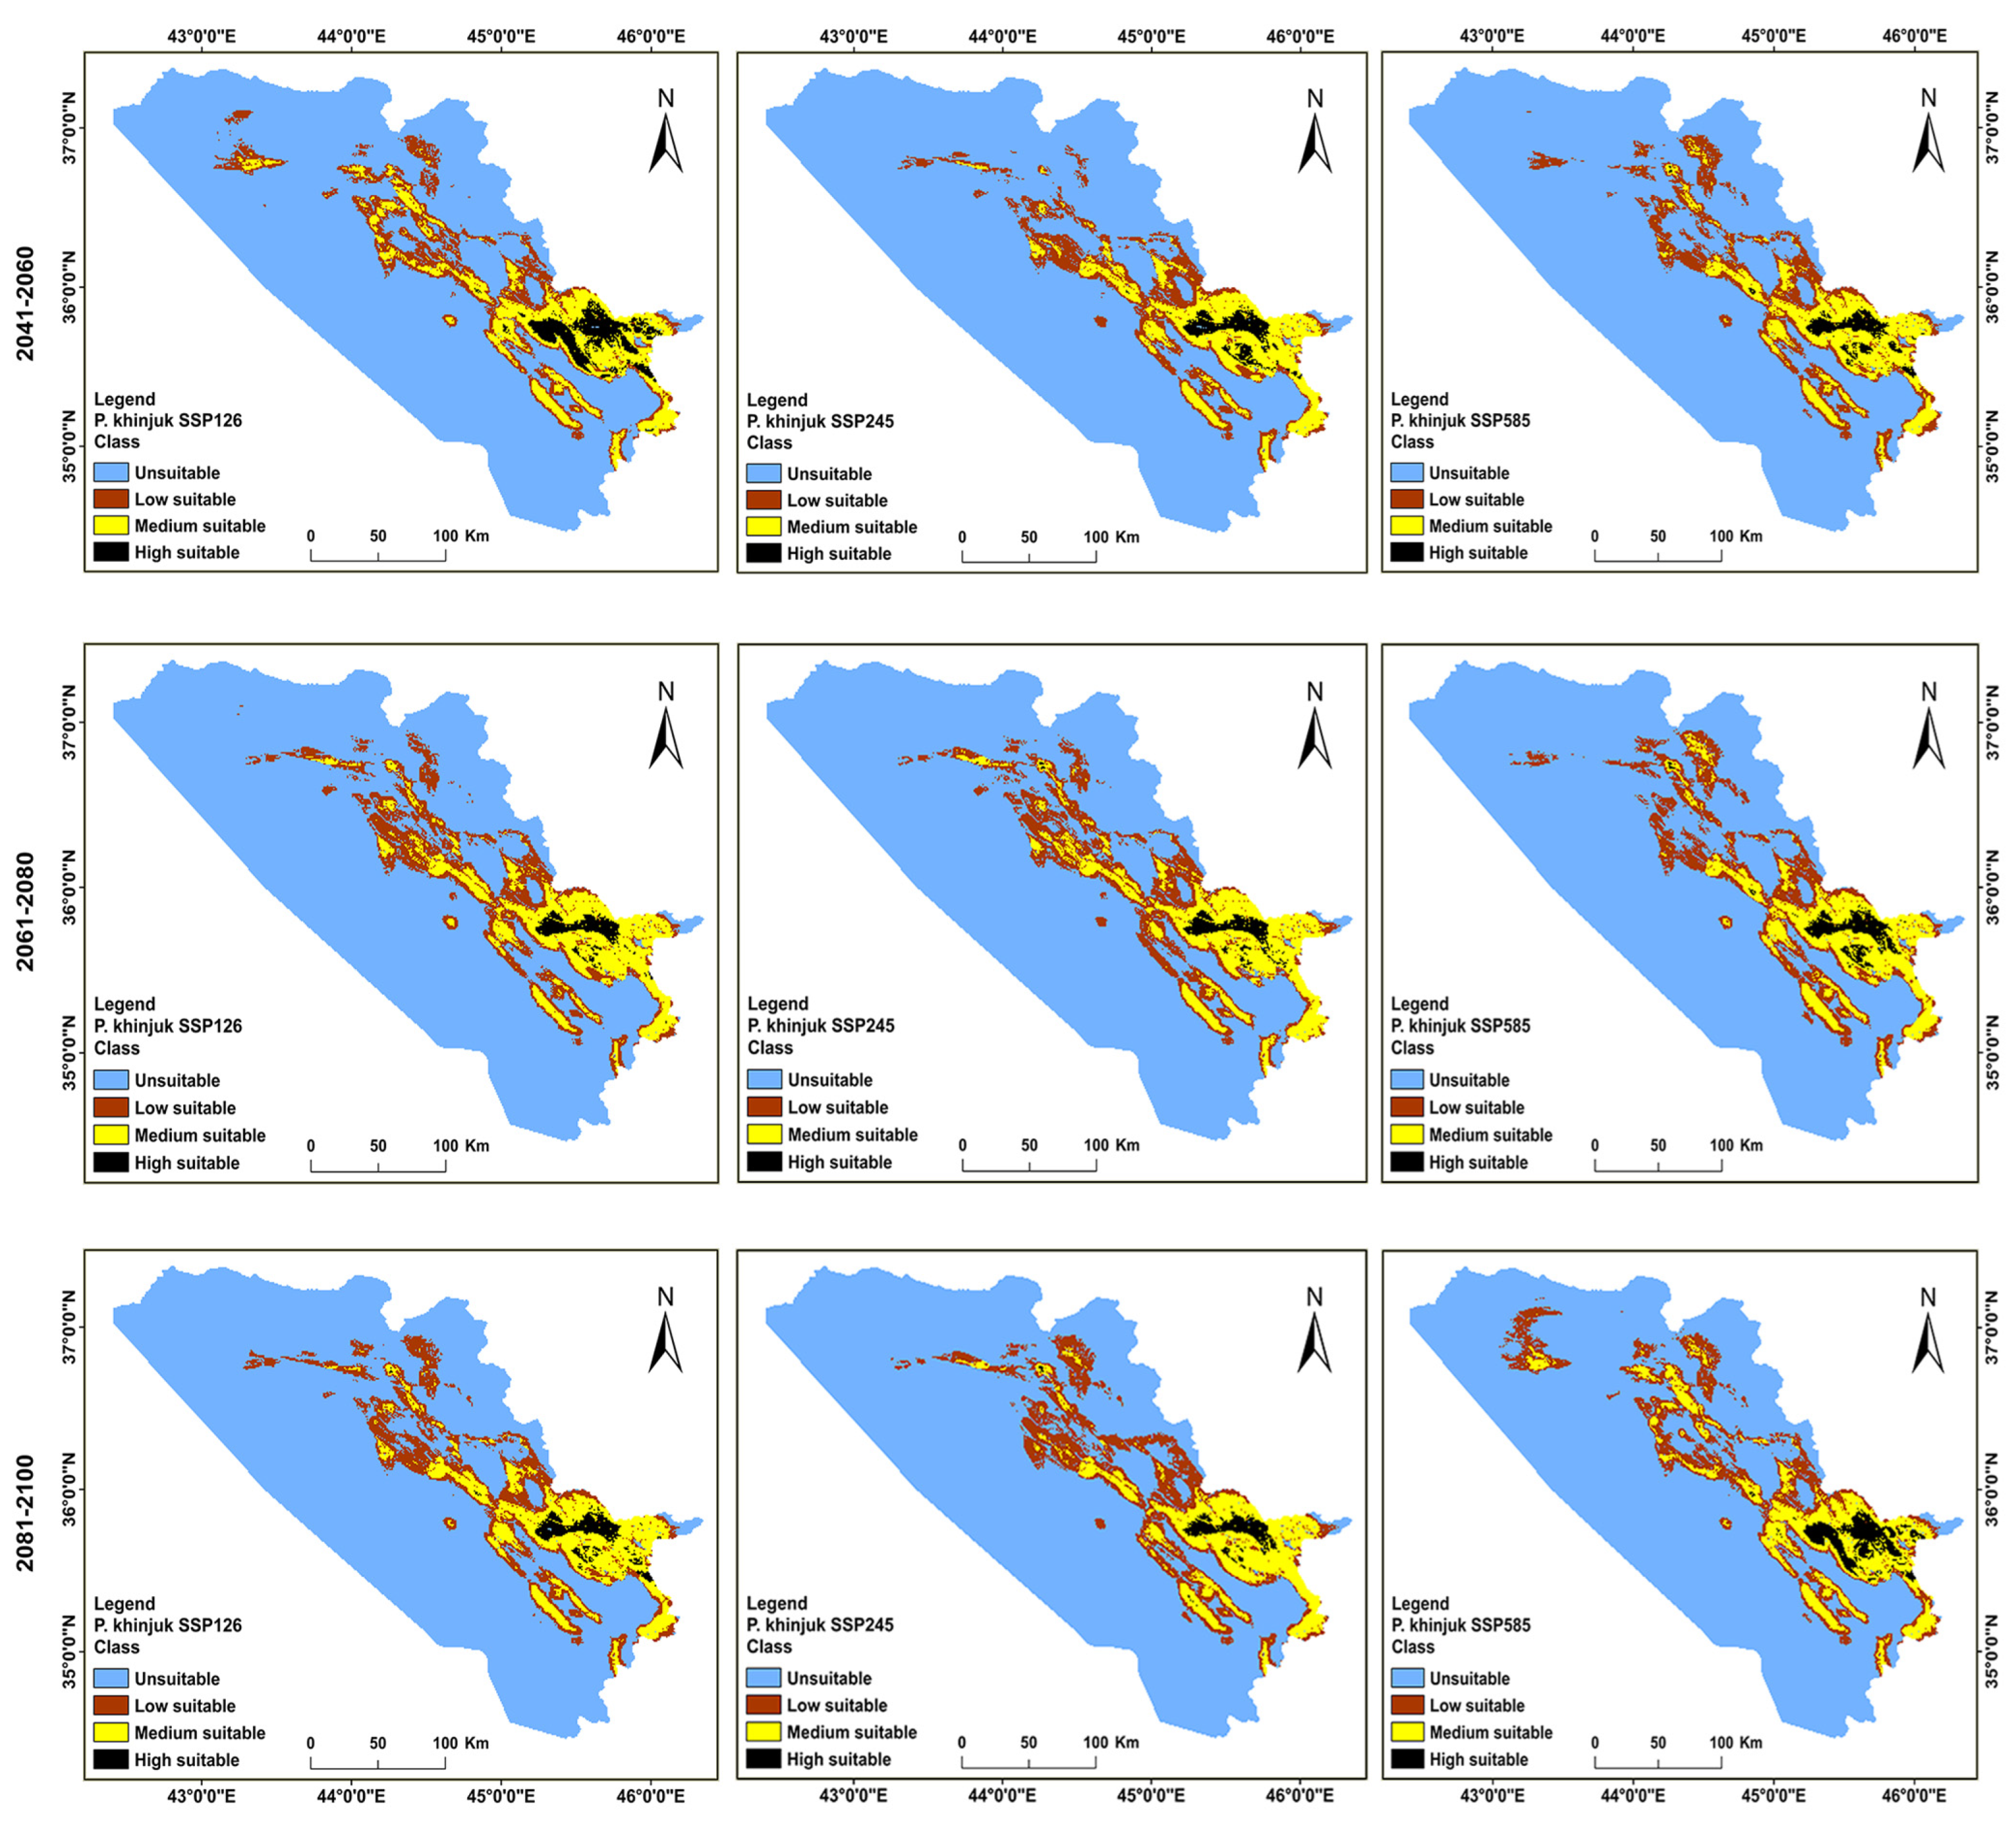
Both of the models of the climate show a dynamic shift in the ranges for P. khinjuk as well. The two models reveal shifts in the trend of habitat unsuitability, and most classes of overall suitability are anticipated to rise under future climate scenarios. For instance, SSP 245/2061–2080 shows the biggest rise in habitat unsuitability under the BCC-CSM2-MR models by 745 km2 (1.45%), whereas SSP 245/2041–2060 shows the greatest reduction in habitat unsuitability by 505 km2 (0.99%). With the exception of SSP 585/2081–2100, and SSP126, 245/2061–2080, all the applied scenarios predict an increase in the total suitability classes, whereas the former scenarios predicted a decrease from 9230 km2 (18.06%) in the present to 8799 km2 (0.84%), and 8986 km2 (0.47%) to 8484 km2 (1.45%), in the future. The modeling of the MIROC-ES2L results also revealed a progressive shift in P. khinjuk’s distribution. For instance, all of the applicable scenarios expect a reduction in habitat unsuitability, with the exception of SSP 245/2041–2060, which predicts an increase of 192 km2 (0.37%). However, all scenarios predict a rise in the overall classes of suitability (i.e., the total of the high, medium, and low suitability regions), with the exception of SSP 245/2041–2060, which predicts a decline from the present 9230 km2 (18.06%) to the future 9037 km2 (17.69%) (Table A7 and Table A8; Figure 6 and Figure 7). In conclusion, the BCC-CSM2-MR model shows that the mean of all the eligible habitats will grow for P. khinjuk, but contract for P. eurycarpa. The MIROC-ES2L model, however, shows that the mean of the total amount of habitat that is appropriate for both species will increase.

3.3. Analysis of the Distribution Change between the Present and Future Habitats for P. khinjuk and P. eurycarpa

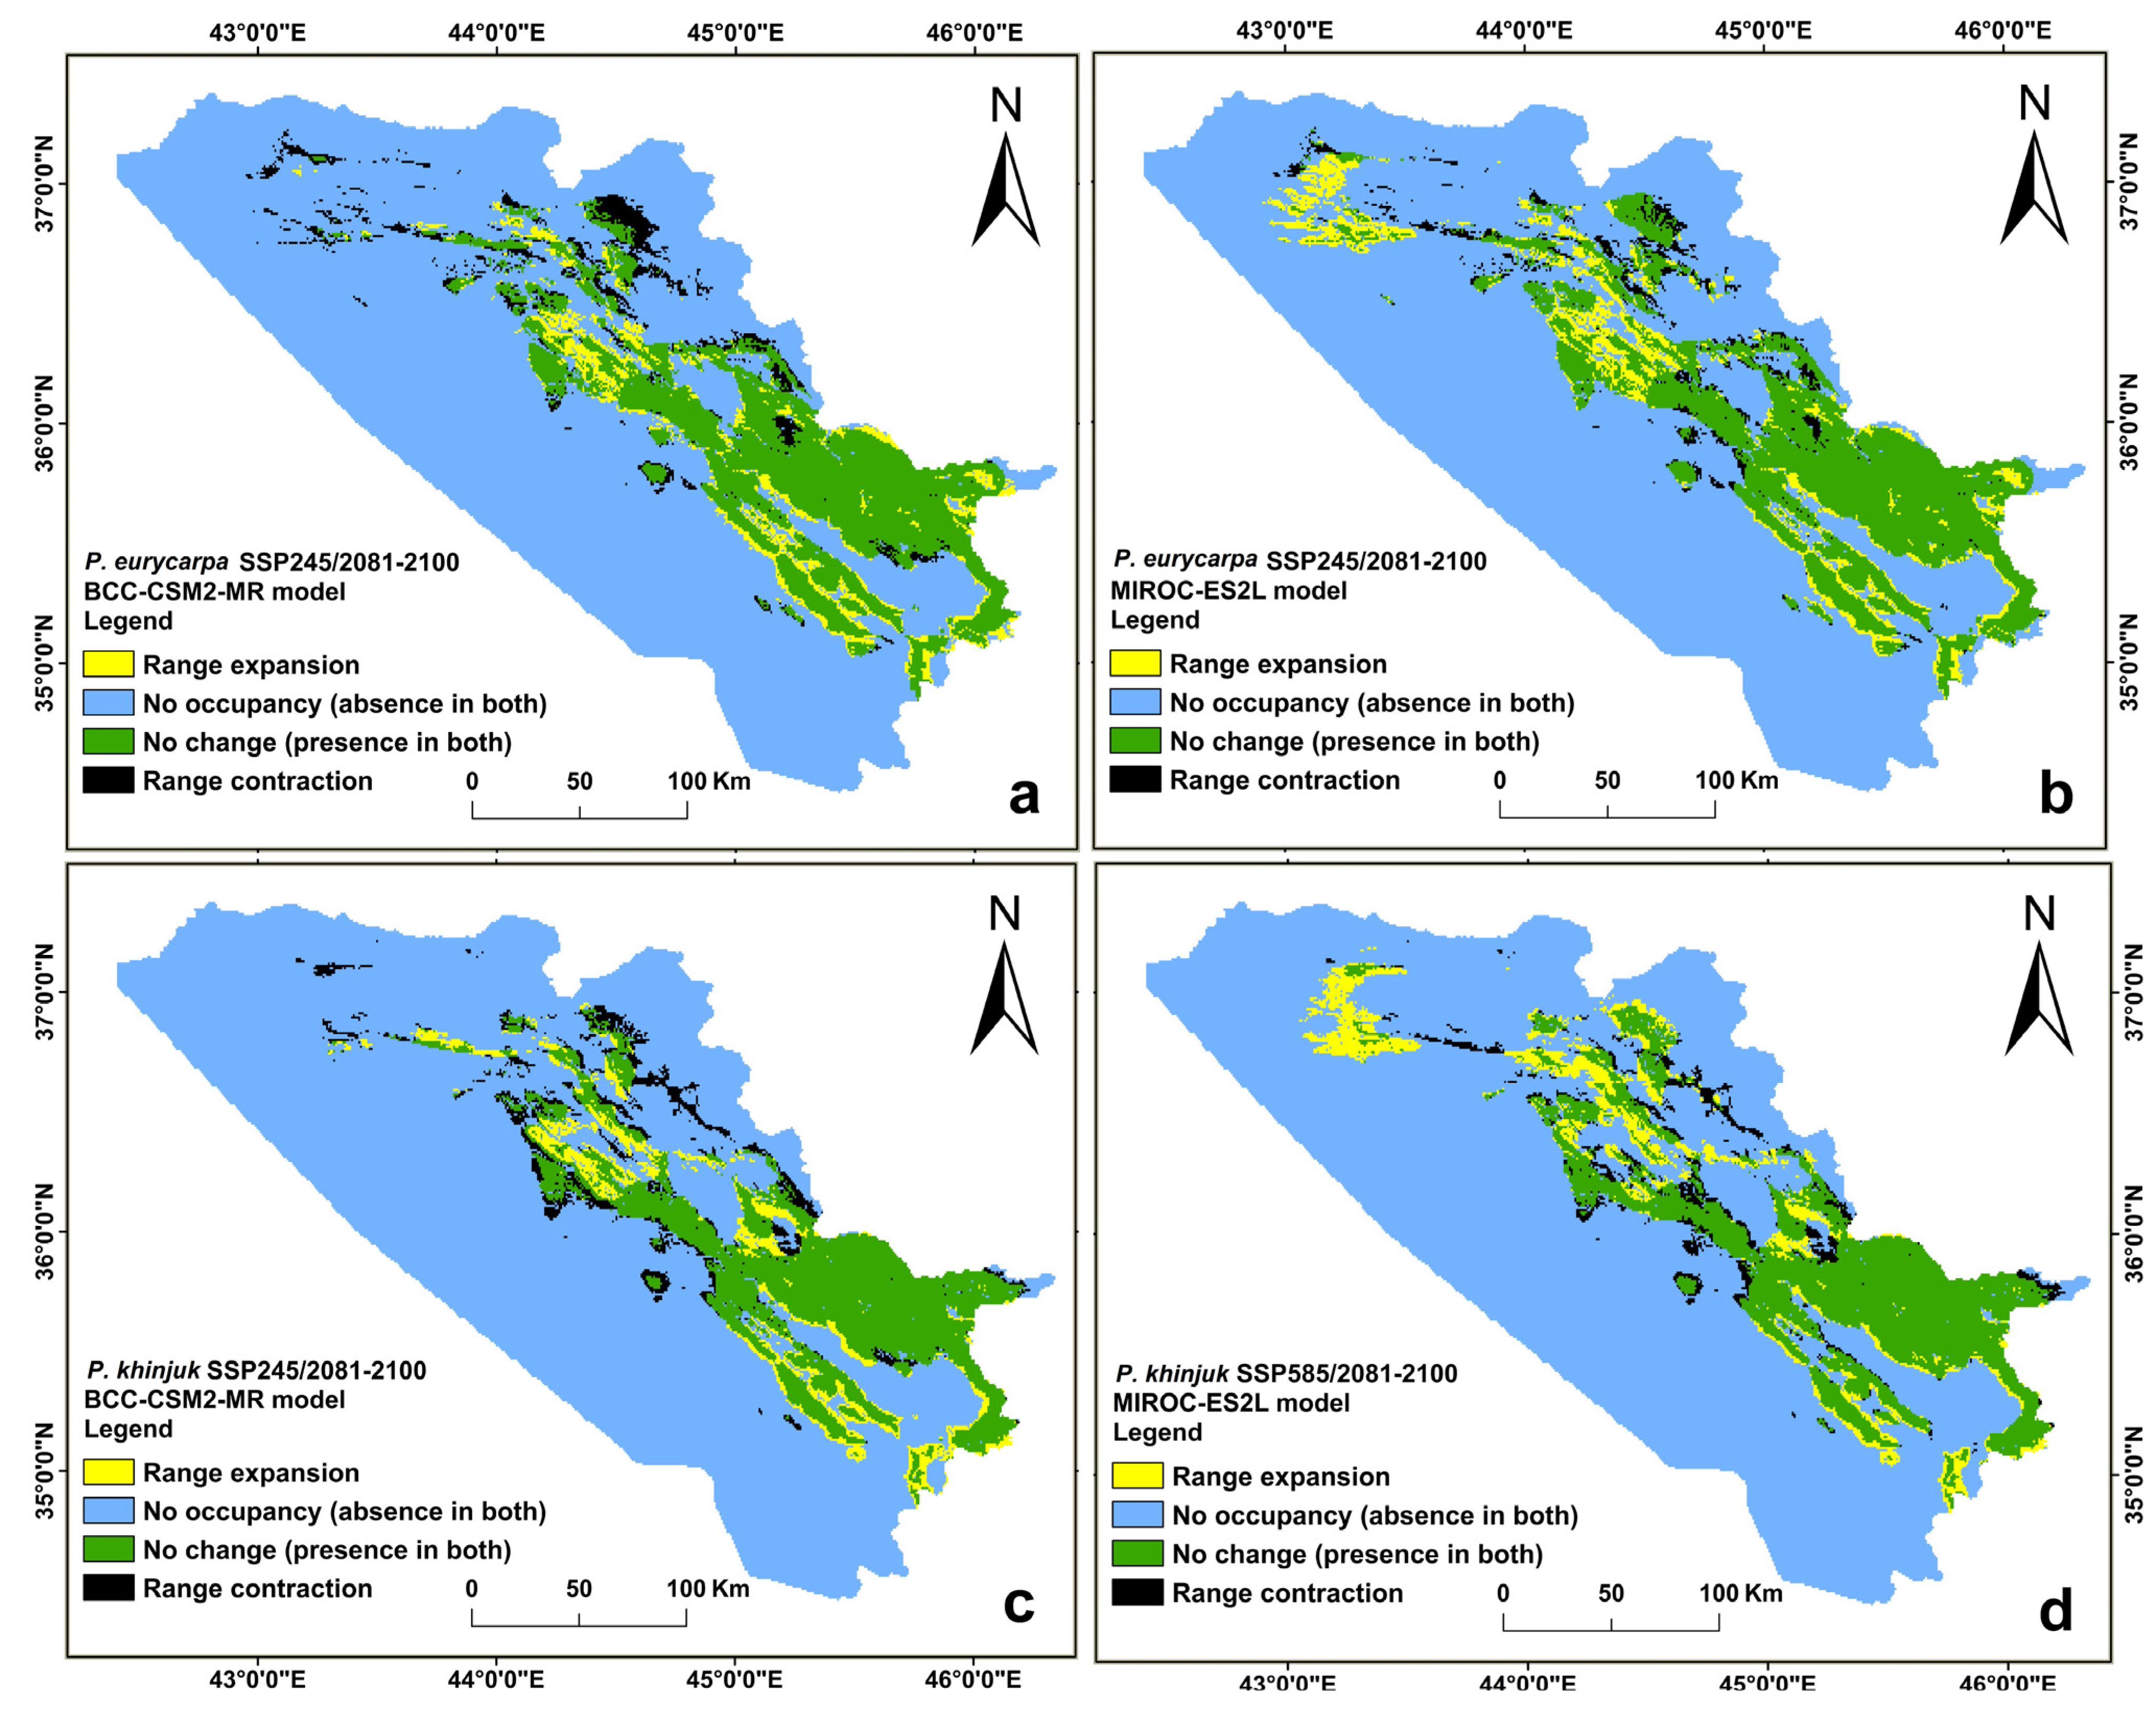
For both species, the habitat ranges were shown to undergo geographic distributional change (i.e., both expansion and contraction), as a result of climatic changes in the time frames 2041–2060, 2061–2080, and 2081–2100, using MIROC-ES2L and BCC-CSM2-MR models. Both models demonstrated that the total expansion magnitude was larger than the total contraction magnitude. The average expansion range for P. eurycarpa will be 1929 km2 (3.776%) and 1793 km2 (3.508%), under all the scenarios used. Additionally, for the two models, the average shrinkage is predicted to be 1304 km2 (2.553%) and 1657 km2 (3.244%), respectively (Table A1 and Table A2). The average expansion range for P. khinjuk will be 2084 km2 (4.079%) and 1783 km2 (3.49%), for all of the applicable scenarios, whereas the average contraction is anticipated to be 1354 km2 (2.65%) and 1698 km2 (3.325%), respectively, for both models (Table A3 and Table A4; Figure 8).

3.4. The Direction and Degree of the Distributional Change for P. eurycarpa and P. khinjuk

The geographic coordinates for the two species are now at 35°91′40″ north and 45°13′50″ east, and 35°95′40″ north and 45°06′40″ east. Nevertheless, this centroid alters in the following ways under the scenarios of climate change: for P. eurycarpa, all of the BCC-CSM2-MR scenarios predict a southeastward relocation of an average 8.51 km. This centroid, however, alters across the different climate change scenarios as follows: the majority of the MIROC-ES2L scenarios show a similar shift result toward the southeast, with the exception of SSP 585 (2061–2080), SSP 585 and SSP 245 (2081–2100), which are expected to shift 45°05′70″ east and 35°93′60″ north southwest, 44°97′80″ east and 35°96′90″ north northwest, and 45°02′20″ east and 35°96′40″ north northwest, respectively. However, P. khinjuk’s centroid change findings were not significantly different from P. eurycarpa’s. The centroid moved an average of 8.63 km toward the southeast, as predicted by the BCC-CSM2-MR scenarios. Except for SSP 126 (2041–2060), SSP 126 (2061–2080), and SSP 585 (2081–2100), which were relocated toward 35°92′90″ north and 45°06′80″ east northwest, 35°89′90″ north and 45°13′30″ east south, and 35°97′50″ north and 45°00′40″ east northwest, respectively, the majority of the MIROC-ES2L scenarios projected toward the southeast (Figure 9).

3.5. Environmental Factors’ Relative Relevance and Contribution to the Spread of P. eurycarpa and P. khinjuk

Four out of the five crucial factors that affect the likelihood of habitat distribution in the KRI are shared by both species. P. eurycarpa contributed to the following variables as follows: precipitation of the wettest month (Bio13) (32.2%), DEM (24.5%), soil type (16.2%), soil carbon (8.2%), and Geo (6.3%) (collectively 87.4). The least significant contributions were made by soil moisture, annual precipitation (Bio12), soil pH, temperature annual mean (Bio1), slope, and the range of mean diurnal (Bio2). Meanwhile, for P. khinjuk, the most significant variables were as follows: precipitation of the wettest month (Bio13) (35.2%), DEM (16.8%), soil type (i.e., Chromic Vertisols, lithosols, and Calcic Xerosols) (16.7%), the mean diurnal range (Bio2) (11.7%), and soil carbon (10.4%) (collectively 90.8). The maximum temperature of the hottest month (Bio5), the annual precipitation (Bio12), soil pH, soil moisture, slope, and geo made the lowest relative contributions.
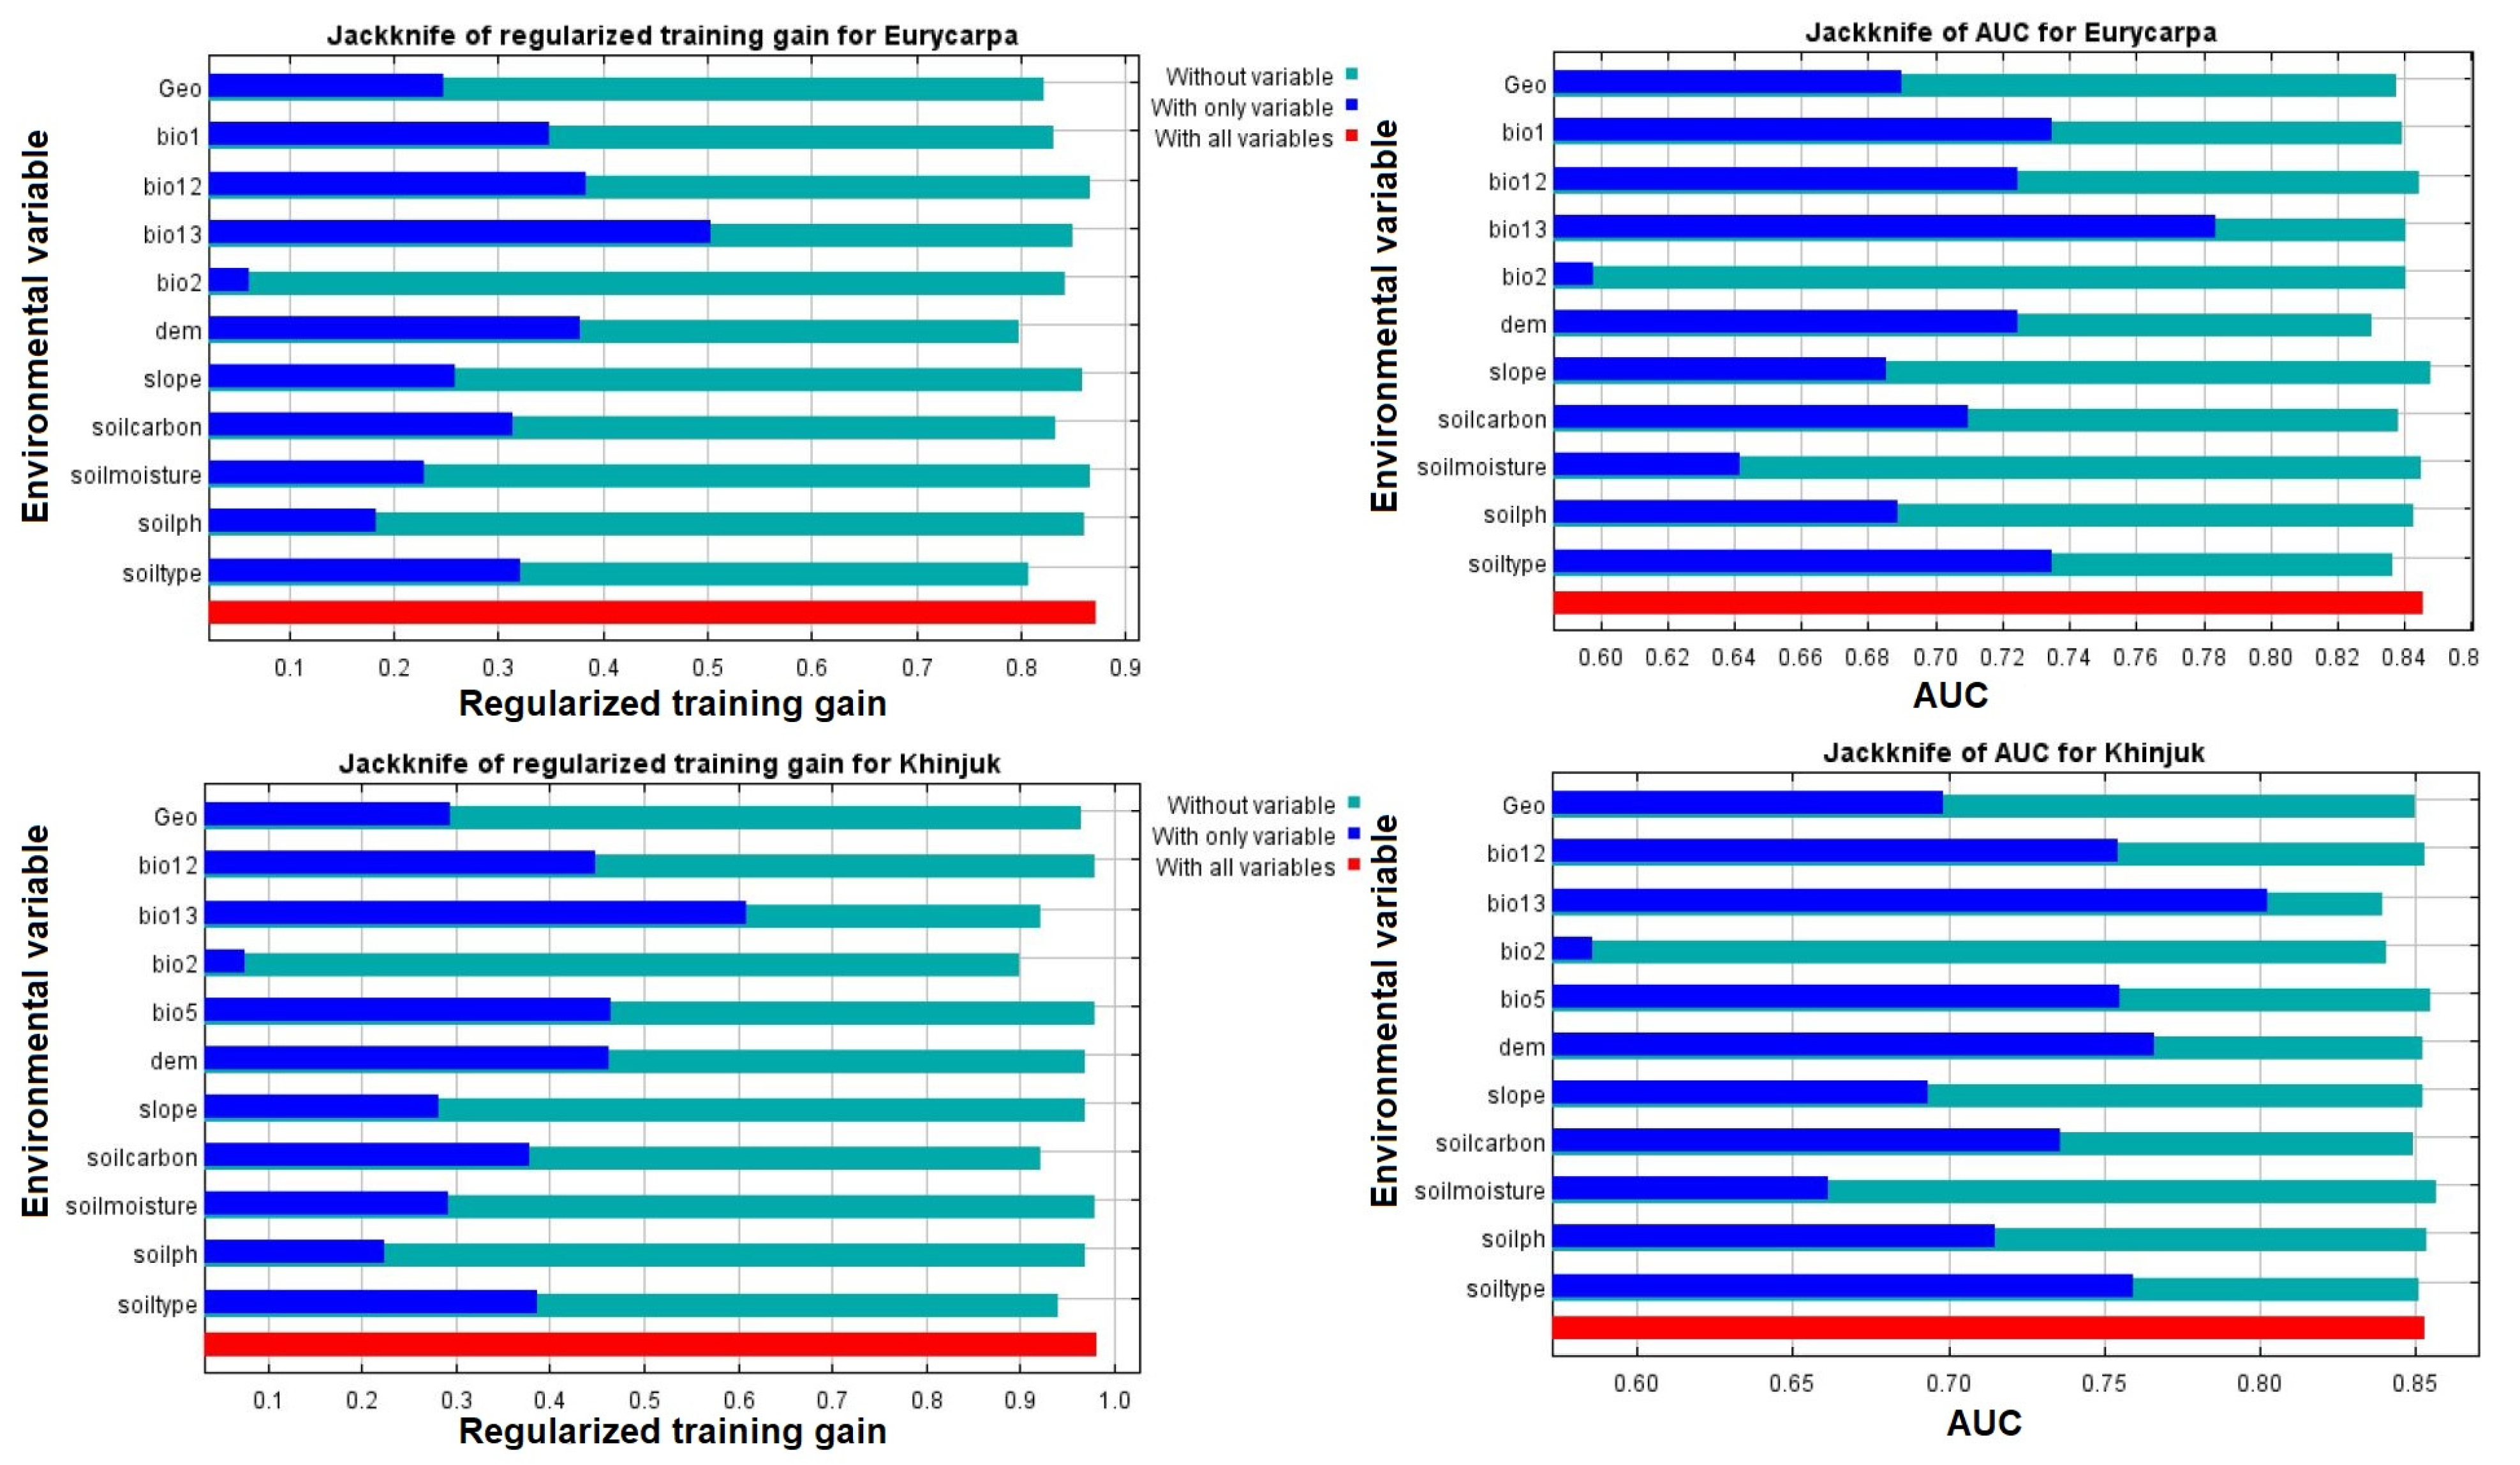
The MaxEnt model illustrated the relative impact of factors from the jackknife analysis on the two species under the present conditions. According to the jackknife test for regularizing the AUC variable gains and training gains (%), the precipitation of the soil carbon, soil type, annual precipitation (Bio12), DEM, annual mean temperature (Bio1), and wettest month (Bio13) included more information (gains) in the P. eurycarpa distribution compared to the rest of variables. For P. khinjuk, the variables soil carbon, soil type, and DEM included larger increases in distribution than the wettest month (Bio13), the annual precipitation(Bio12), the maximum temperature of the hottest month (Bio5), and the other factors (Figure 10).

4. Discussion

4.1. Species of Tree Plant Respond Differently to the Scenarios of the Future Climate

One of the most urgent environmental challenges confronting mankind at the moment is global climate change. The average worldwide surface air temperature rose by 0.76 °C between 1850 and 2005. This indicates a trend of warming in the past 50 years of 0.13 °C per decade [28]. Between 2030 and 2052, if global warming keeps at its present pace, there will likely be a 1.5 °C increase [64]. Many plants are anticipated to adapt to the rapid temperature rise and spread to new areas. Climatic change has had a substantial impact on species distribution and abundance during the last several decades, and under future climate scenarios, it also causes species extinction, a shift in demography, a shift in phenology, expansion, contraction, and differences in growth and productivity [65]. According to Monzón, et al. [66], species ranges related to climate change are likely to grow or contract, and some species may even need to relocate to take advantage of new environments. According to earlier research, species contraction and plant habitat loss were anticipated to occur in the KRI [67], Africa [68], and California [69]. Different plant species also react differently to the predicted climatic circumstances. Nevertheless, other research, has indicated that, in several countries, including the Marion Island [70], Spain [71], the southern United States [72], and Indonesia [73], plant species’ habitats are expanding due to anticipated climate change. Our results also indicate that under the two GCMs, the BCC-CSM2-MR and the MIROC-ES2L models, and for the majority of the SSP climate change scenarios, the overall habit range of both species would expand. For the two GCMs the species habitat range would overlap by 8812 km2 (17.25%) and 9177 km2 (17.96%), respectively. The modeling revealed a total habitat suitability rise over a habitat suitability decline in the future circumstances. The modeling of BCC-CSM2-MR, for instance, under scenarios of SSP 245/2041–2060 and SSP 585/2041–2060, presented the maximum gain in habitat suitability for P. khinjuk and P. eurycarpa. Both species’ habitat appropriateness is predicted to move from the present 9230 km2 (18.06%) to the future 9735 km2 (19.05%), and from the present 10,442 km2 (20.43%) to the future 11,047 km2 (21.61%), respectively. In a similar way, the scenarios of the MIROC-ES2L modeling for the two species resulted in a comparative finding regarding habitat suitability gain. P. khinjuk is predicted to expand from the current 9230 km2 (18.06%) to 10,769 km2 (21.07%) under SSP 585/2081–2100, in the future; whereas, P. eurycarpa, under SSP 585/2081–2100 was seen to move from the current 10,442 km2 (20.43%) to 11,210 km2 (21.94%) in the future (Table A1 and Table A2). Moreover, the expansion of eminent habitat (the expansion–contraction net percentage) findings are predicted to increase in both modeling scenarios, MIROC-ES2L and BCC-CSM2-MR. The expansion in BCC-CSM2-MR will be as follows: P. khinjuk expands by 504 km2 (0.986%) under SSP 245/2041–2060 and P. eurycarpa grows by 606 km2 under SSP 585/2041–2060 (1.186%); whereas, P. khinjuk expands by 1539 km2 (3.012%) under SSP 585/2081–2100 and P. eurycarpa expands by 1683 km2 (3.294%) under SSP 245/2081–2100, when using MIROC-ES2L modeling scenarios (Table A3 and Table A4).
Kozhoridze et al. [1] showed the same findings for the expansion of both species of Pistacia, in which they investigated Pistacia globally under future climate conditions between 2050 and 2100. Similarly, the eucalyptus spread in the 2050 and 2070 periods has been predicted by López-Sánchez, Castedo-Dorado, Cámara-Obregón and Barrio-Anta [71]. With regards to the tables resulting from the applied models and according to the centroid and distribution shift maps, for the Pistacia modeling in the KRI, utilizing MIROC-ES2L seems to be more appropriate compared to BCC-CSM2-MR. The MIROC-ES2L model predicts a greater growth and distribution range for the both species under the scenarios of the future climate. Moreover, the model indicated a considerable variety in the centroid shifts, which fits with the geography and the habitat characteristics of the research region. Moreover, according to the MIROC-ES2 scenarios, the future climate changes will insignificantly influence the amount of precipitation in the wettest months, which makes the greatest contribution to the distribution of both species in the current and future conditions (Table 2).

4.2. Edaphic and Environmental Variables Contributed to the Expansion and Distribution of the P. khinjuk and P. eurycarpa in the Future Climatic Scenarios

The major environmental factors that affected both species are the precipitation in the wettest month (Bio13) (32.2%; 35.2%), DEM (24.5%; 16.8%), and soil type (16.2%; 16.7%) (Figure 11). These outcomes were anticipated and justified in light of the research area’s geography, the seasonal change in precipitation, and the kind of soil. In the mountains of Zagros in the KRI, the two species have evolved to live on sandstone hills, steep dry slopes, and stony hillsides. The Zagros Mountains are characterized by significant seasonal variations in temperature and precipitation, with dry summers and wet winters. The mountains of the KRI might get 1200 mm of precipitation annually, the most of which falls from October to May, the wettest months [40]. According to predictions on future climatic circumstances, the eco-regional features of the research area will make it ideal for the spread and growth of Pistacia. Additionally, P. khinjuk’s strong resistance to osmotic stress and drought, which provide the plant with more moisture and regulate temperature and precipitation rates, improve the plants’ ability to follow climatic change and survive aridity, according to [28]. As the most significant variable amongst other the variables, the results of Bio13 confirm the research conclusions. The predictions for Bio13 (i.e., the extracted layers of the map), which were employed in this work, are not anticipated to vary much in future climatic scenarios (especially in the mountainous regions of the KRI). The present range of the wettest month’s anticipated precipitation is between 58 mm (the lowest) to 200 mm (the highest). Pistacia can effectively monitor climate change in the area since these values are not anticipated to vary considerably in the future climatic scenarios (Table 2). Despite these realities, P. khinjuk is expected to spread further in the mountainous region due to climate change. This indicates how the species’ high tolerance aids the plant’s ability to withstand summertime heat and aridity on the Zagros Mountains’ stony slopes. Such findings support [28] findings that P. khinjuk grows better in high-altitude and dry environments. Similar justifications apply to P. eurycarpa as well, for two reasons: (i) both species share four out of five of the most significant variables that alter their potential distribution (Figure 11); and (ii) they usually coexist in most of the environments investigated in the field study (Figure 1). An additional factor that considerably influenced the spread of these two species was elevation. Elevation (or height) has been identified in several studies as a crucial element influencing the dispersion and growth of plants [74,75]. A piece of Marion Island research stated that 18 plant species reportedly expanded their ranges by about 70 m in altitude between 1966 and 2006, as a reaction to rising temperatures [70]. Moreover, the third factor influencing the dispersion of Pistacia was soil type. The distribution of the two species was influenced most by Chromic Vertisols, lithosols, and Calcic Xerosols, among the 19 categories of soil type. These soil types cover a region of around 23,021 km2 (45%) in the overall research area, according to the retrieved soil type map layer (Table 3). These soil types are described in the FAO classification system as follows: Vertisols are swelling and shrinking clayey soils which occur in (sub) tropical areas with an expressed dry season and are dominated by expanding 2:1 lattice clays. The very shallow lithosols occur in the most eroding positions of the landscape and are less than 10 cm thick. While, the Xerosols are characterized by an aridic soil (having an aridic but not cold climate) and moderate contents of organic matter in the topsoil [76].
To analyze the environmental drivers of species distribution and to project the species’ realized niche in a geographic area, SDMs can be utilized. The SDMs accuracy is affected by several predictors: (i) biological: presence or absence of the species; (ii) climatic: climate and vegetation; (iii) geological: topography, land cover types, soil and geology; and (iv) human activities: agriculture, deforestation, and land cover damage [77]. Therefore, researchers tend to consider habitat selection and other factors that influence species distribution [78]. Important limiters of SDMs involve the type of environmental gradients and multiple predictors, such as: the physical environment [79], a lack of biologically relevant information [80], invasive species and biotic interactions [81], and insufficient data [82]. In addition, among other factors that cause uncertainty in SDM output are data deficiencies (e.g., small and biased samples of species occurrences) and errors in the specification of the model [30]. Environmental gradients are among the other factors that influence SDM results, for example, direct gradients which have a direct physiological effect on species growth (temperature, pH, water, and nutrients), and indirect gradients, which result from location-specific correlations (elevation and latitude) [83].
To minimize the uncertainties in SDM outputs, categorizing the habitat suitability of the studied area might be useful. Land suitability provides decision makers with a good insight to develop management strategy. In this study, habitat suitability was categorized into several layers, as follows: high suitability, medium suitability, low suitability, and unsuitable. These categorized layers represent how the climatic and edaphic factors influence the absence and presence of the species.

4.3. Implications for Ecological Conservation

Through the protection and management of biological resources, conservation policy aims to provide a sustainable environment for the diverse range of species found across the globe without seriously compromising important habitats and ecosystems. Distribution, collection, storage, propagation, assessment, characterization, disease indexing, and disease removal are all part of conservation [84,85]. In the present and future climate situations, for conservation reasons, it is crucial to be aware of the possible range of a species. Therefore, some technologies (including global positioning systems (GPS), geographic information systems (GIS), SDMs, sampling schemes, and measurement methodologies are outstanding instruments to analyze the spatio-temporal dynamics and the complex processes that govern biodiversity. The vast array of remote sensing satellite data with their various spatio-temporal resolution changes might be beneficial for biodiversity assessment [86]. Geospatial methods and ecological modeling are used in this study for forecasting and estimating the species distribution ranges. In particular, the incorporation of MaxEnt into the GIS environment has a significant function in enhancing conservation planning development and the input data [87].
Approximately 10,219 km2 (20%) of the whole research area is predicted to be favorable for the distribution and development of the two species, according to the majority of the models’ findings. The results of the modeling map indicate that the two species’ medium and high suitability habitats for distribution are found in the mountainous area. The ecological, medicinal, nutritional, and cultural relevance of the Pistacia species, as well as their rarity in high altitudinal areas might benefit the KRI’s forestry management. Additionally, the attention of environmentalists and conservationists should be encouraged to monitor climate change and help withstand prolonged dry spells. Consequently, the following are firmly proposed: (i) Pistacia has to be preserved and protected, especially in the overlapping areas 9177 km2 (17.96%) for the MIROC-ES2L and 8812 km2 (17.25%) for the BCC-CSM2-MR models (Figure 12), from anthropogenic activities, including burning, cutting and the overuse of plants; and (ii) these species depend on rocky mountain peaks and slope habitats (mostly the unchanged suitable areas), which are crucial ecosystems and should be prioritized by conservation efforts.
Regarding GPS data point collections and the plant specimen, this research had certain limitations. The biggest limitation was the problem of accessibility in some locations, especially in the east and north border areas where landmines have been planted or political tensions existed.

5. Conclusions

The two Pistacia species’ existing and future distributions in the KRI were estimated as part of this study’s goal, which also included developing forest management strategies. Under the present environmental conditions, tree plants of P. khinjuk and P. eurycarpa cover around one fifth of the whole research area. The species attracted the attention of this study due to its cultural, medicinal, and ecological significance, and its tolerance to living in the rocky and mountainous highlands. The steep and rocky slopes of the Kurdistan Mountains are ideal sites for the development and spread of Pistacia species. The three main variables that affected these two species distributions were precipitation during the wettest month (Bio13), DEM, and soil type. The entire habitat range of the species is anticipated to grow in the future scenarios of climate change, and the centroid is most likely going to migrate to the southeast. The highlands and overlapping ecosystems should be given priority in management plans and conservation measures. Thus, the classified present and prospective species distribution maps that have been developed in this work, especially the overlapping maps, provide invaluable planning insights for safeguarding the Pistacia species in the area. No prior research has modeled the geographic distribution of these two species under the existing and future climates in the KRI, according to the already available information. Geospatial techniques combined with correlation-based modeling are efficient tools for predicting the spatial patterns of the tree species in the mountain ecosystem. The expanded future habitat ranges particularly the overlapping areas, preferably between 1500 and 3500 masl., should be prioritized in conservation and management actions.

Author Contributions

N.R.K. conceived, designed the study; B.A.H. performed field surveys, data collection, analysis and writing; N.R.K. also participated in analysis, writing and compiling the final version of the manuscript. All authors have read and agreed to the published version of the manuscript.

Funding

This research received no external funding.

Institutional Review Board Statement

Not applicable.

Informed Consent Statement

Not applicable.

Data Availability Statement

Applicable on reasonable request.

Acknowledgments

The Kurdistan Botanical Foundation members helped the authors confirm the species identification of the specimens, for which they are thankful. We also want to express our gratitude to the local guides who shared important knowledge about the distribution, traditional uses, and morphology of the plants.

Conflicts of Interest

The authors declare no conflict of interest.

Appendix A

Figure A1. Herbarium samples of P. khinjuk (left) and P. eurycarpa (right), collected and prepared by the researcher Berhem A. HamadAmin.
Sustainability 15 05469 g0a1
Table A1. Changes in the distribution of the habitat range (areas) for P. eurycarpa in the present and future under the scenarios of climate change, BCC-CSM2-MR, SSP 585, 245, and 126 for 2041–60, 2061–80, and 2081–2100, respectively. The total area of the study equals 51,097 km2 which is also shown in percentage below each category.
YearClassRange ExpansionNo Occupancy (Absence in Both)No Change (Presence in Both)Range Contraction
(2041–2060)SSP 126 area (km2)165938,99690501392
%3.2676.3217.702.72
SSP 245 area (km2)172438,93191281314
%3.3876.2017.862.56
SSP 585 area (km2)189338,76291571285
%3.7175.8717.912.51
(2061–2080)SSP 126 area (km2)197838,67785591883
%3.8875.7016.743.68
SSP 245 area (km2)193338,72280572385
%3.7975.7915.764.66
SSP 585 area (km2)171838,93790801362
%3.3776.2117.762.66
(2081–2100)SSP 126 area (km2)163739,01889931449
%3.2176.3717.592.83
SSP 245 area (km2)211138,54487631679
%4.1475.4417.143.28
SSP 585 area (km2)148939,16682782164
%2.9276.6616.194.23
Table A2. Changes in the distribution of the habitat areas (range) for P. eurycarpa in the present and future under scenarios of climate change, MIROC-ES2L, SSP 585, 245, and 126 for 2041–60, 2061–80, and 2081–2100, respectively. The total area of the study equals 51,097 km2 which is also shown in percentage below each category.
YearClassRange ExpansionNo Occupancy (Absence in Both)No Change (Presence in Both)Range Contraction
(2041–2060)SSP 126 area (km2)165838,99789161526
%3.2576.3317.442.98
SSP 245 area (km2)174438,91190301412
%3.4276.1617.662.76
SSP 585 area (km2)155639,09991351307
%3.0576.5317.872.55
(2061–2080)SSP 126 area (km2)185538,80091691273
%3.6475.9417.942.48
SSP 245 area (km2)204538,61090231421
%4.0175.5717.652.77
SSP 585 area (km2)189738,75892681174
%3.7275.8618.132.29
(2081–2100)SSP 126 area (km2)175338,90192381205
%3.4476.1418.072.35
SSP 245 area (km2)284537,81092831160
%5.587418.162.26
SSP 585 area (km2)202538,63091851257
%3.9775.6117.972.45
Table A3. Changes in the distribution of the habitat areas (range) for P. khinjuk in the present and future under scenarios of climate change, BCC-CSM2-MR, SSP 585, 245, and 126 for 2041–60, 2061–80, and 2081–2100, respectively. The total area of the study equals 51,097 km2 which is also shown in percentage below each category.
YearClassRange ExpansionNo Occupancy (Absence in Both)No Change (Presence in Both)Range Contraction
(2041–2060)SSP 126 area (km2)204439,82475361693
%4.0177.9514.743.31
SSP 245 area (km2)183340,03579021327
%3.6078.3615.462.59
SSP 585 area (km2)191339,95577711458
%3.7578.2015.202.85
(2061–2080)SSP 126 area (km2)155140,31774371792
%3.0478.9114.553.50
SSP 245 area (km2)176240,10667272502
%3.4678.5013.164.89
SSP 585 area (km2)166640,20277501479
%3.2778.6915.162.89
(2081–2100)SSP 126 area (km2)178640,08277411488
%3.5078.4515.142.90
SSP 245 area (km2)207539,79375441685
%4.0777.8914.763.29
SSP 585 area (km2)143140,43773701859
%2.8179.1514.423.63
Table A4. Changes in the distribution of the habitat areas (range) for P. khinjuk in the present and future under scenarios of climate change, MIROC-ES2L, SSP 585, 245, and 126 for 2041–60, 2061–80, and 2081–2100, respectively. The total area of the study equals 51,097 km2 which is also shown in percentage below each category.
YearClassRange ExpansionNo Occupancy (Absence in Both)No Change (Presence in Both)Range Contraction
(2041–2060)SSP 126 area (km2)224139,62778761353
%4.3977.5615.412.64
SSP 245 area (km2)153340,33575111718
%3.0178.9514.693.35
SSP 585 area (km2)178040,08879091320
%3.4978.4615.472.58
(2061–2080)SSP 126 area (km2)189139,97779021327
%3.7178.2515.462.59
SSP 245 area (km2)215439,71478571372
%4.2277.7315.372.68
SSP 585 area (km2)200239,86779851243
%3.9378.0315.622.42
(2081–2100)SSP 126 area (km2)188339,98580541175
%3.6978.2615.752.29
SSP 245 area (km2)244539,42378531376
%4.7977.1615.362.68
SSP 585 area (km2)283939,02979311298
%5.5676.3915.512.53
Table A5. Modeled habitat of the present and future areas of unsuitability and suitability distribution (in percentage) using model BCC-CSM2-MR under scenarios SSP 585, 245, and 126 climate change for P. eurycarpa for the years 2041–60, 2061–80, and 2081–2100, respectively. The total area of the study equals 51,097 km2 which is also shown in percentage below each category.
YearClassUnsuitableLow SuitabilityMedium SuitabilityHigh Suitability
CurrentArea (km2)40,656503242031208
%79.579.868.232.38
(2041–2060)SSP 126 area (km2)40,39152704469969
%79.0610.328.751.89
SSP 245 area (km2)43,98415384623954
%86.093.029.061.86
SSP 585 area (km2)40,05152064902940
%78.3910.209.601.83
(2061–2080)SSP 126 area (km2)40,566492244961115
%79.409.648.812.17
SSP 245 area (km2)41,109414148201029
%80.468.119.422.01
SSP 585 area (km2)40,29953494555896
%78.8810.488.921.75
(2081–2100)SSP 126 area (km2)40,46851464589896
%79.2110.088.991.75
SSP 245 area (km2)40,226467651631034
%78.739.1610.112.02
SSP 585 area (km2)41,33050003868901
%80.899.797.581.76
Table A6. Modeled habitat of the present and future areas of unsuitability and suitability distribution (in percentage) under SSP 585, 245, and 126 climate change scenarios using the MIROC-ES2L model for P. eurycarpa for the years 2041–60, 2061–80, and 2081–2100, respectively. The total area of the study equals 51,097 km2 which is also shown in percentage below each category.
YearClassUnsuitableLow SuitabilityMedium SuitabilityHigh Suitability
CurrentArea (km2)40,656503242011208
%79.579.868.212.36
(2041–2060)SSP 126 area (km2)40,52352204415939
%79.3110.228.631.83
SSP 245 area (km2)40,32553474507918
%78.9310.478.811.79
SSP 585 area (km2)40,40853574427905
%79.0910.498.661.76
(2061–2080)SSP 126 area (km2)40,07354694703852
%78.4310.719.201.66
SSP 245 area (km2)40,03152174859990
%78.3510.229.501.93
SSP 585 area (km2)39,93254544777934
%78.1610.689.341.82
(2081–2100)SSP 126 area (km2)40,10754294628933
%78.5010.639.051.82
SSP 245 area (km2)38,974552153971205
%76.2810.8110.552.35
SSP 585 area (km2)39,88856934547969
%78.0711.158.891.89
Table A7. Modeled habitat of the present and future areas of unsuitability and suitability distribution (in percentage) under SSP 585, 245, and 126 climate change scenarios using the BCC-CSM2-MR model for P. khinjuk for the years 2041–60, 2061–80, and 2081–2100, respectively. The total area of the study equals 51,097 km2 which is also shown in percentage below each category.
YearClassUnsuitableLow SuitabilityMedium SuitabilityHigh Suitability
CurrentArea (km2)41,868430837711150
%81.958.447.372.24
(2041–2060)SSP 126 area (km2)41,51848114153615
%81.269.428.121.20
SSP 245 area (km2)41,36350484084602
%80.969.8981.19
SSP 585 area (km2)41,42048084201668
%81.079.428.211.30
(2061–2080)SSP 126 area (km2)42,11142693905812
%82.428.367.631.58
SSP 245 area (km2)42,61338543819811
%83.407.557.471.58
SSP 585 area (km2)41,68248383942635
%81.589.487.711.23
(2081–2100)SSP 126 area (km2)41,57547004211611
%81.379.218.231.21
SSP 245 area (km2)41,48446104315688
%81.199.038.441.34
SSP 585 area (km2)42,29843313714754
%82.798.487.261.47
Table A8. Modeled habitat of the present and future areas of unsuitability and suitability distribution (in percentage under SSP 585, 245, and 126 climate change scenarios) using the MIROC-ES2L model for P. khinjuk for the following years 2041–60, 2061–80, and 2081–2100, respectively. The total area of the study equals 51,097 km2 which is also shown in percentage below each category.
YearClassUnsuitableLow SuitabilityMedium SuitabilityHigh Suitability
CurrentArea (km2)41,868430837711150
%81.958.447.372.24
(2041–2060)SSP 126 area (km2)40,984456842041341
%80.228.958.222.62
SSP 245 area (km2)42,06041594108770
%82.328.158.031.50
SSP 585 area (km2)41,40949444038706
%81.059.687.891.37
(2061–2080)SSP 126 area (km2)41,30549204306566
%80.849.648.421.10
SSP 245 area (km2)41,08749754445590
%80.429.748.691.15
SSP 585 area (km2)41,11050114181795
%80.449.818.171.55
(2081–2100)SSP 126 area (km2)41,16349874224723
%80.579.778.261.41
SSP 245 area (km2)40,80055244169604
%79.8610.828.151.17
SSP 585 area (km2)40,329540742461115
%78.9310.598.302.17

References

  1. Kozhoridze, G.; Orlovsky, N.; Orlovsky, L.; Blumberg, D.G.; Golan-Goldhirsh, A. Geographic distribution and migration pathways of Pistacia–present, past and future. Ecography 2015, 38, 1141–1154. [Google Scholar] [CrossRef]
  2. AL-Saghir, M.G.; Porter, D.M. Taxonomic revision of the genus Pistacia L. (Anacardiaceae). Am. J. Plant Sci. 2011, 3, 12–32. [Google Scholar] [CrossRef] [Green Version]
  3. Guest, E.; Townsend, C. Flora of Iraq; Ministry of Agriculture of the Republic of Iraq: Baghdad, Iraq, 1966.
  4. Ahmed, H.M. Traditional uses of Kurdish medicinal plant Pistacia atlantica subsp. kurdica Zohary in Ranya, Southern Kurdistan. Genet. Resour. Crop Evol. 2017, 64, 1473–1484. [Google Scholar] [CrossRef]
  5. Rankou, H.; M’sou, S.; Babahmad, R.A.; Ouhammou, A.; Alifriqui, M.; Martin, G. Pistacia atlantica. In The IUCN Red List of Threatened Species; IUCN red list: Cambridge, UK, 2018. [Google Scholar]
  6. Khwarahm, N.R. Spatial modeling of land use and land cover change in Sulaimani, Iraq, using multitemporal satellite data. Environ. Monit. Assess. 2021, 193, 148. [Google Scholar] [CrossRef]
  7. Khwarahm, N.R.; Najmaddin, P.M.; Ararat, K.; Qader, S. Past and future prediction of land cover land use change based on earth observation data by the CA–Markov model: A case study from Duhok governorate, Iraq. Arab. J. Geosci. 2021, 14, 1544. [Google Scholar] [CrossRef]
  8. Khwarahm, N.R.; Qader, S.; Ararat, K.; Al-Quraishi, A.M.F. Predicting and mapping land cover/land use changes in Erbil/Iraq using CA-Markov synergy model. Earth Sci. Inform. 2021, 14, 393–406. [Google Scholar] [CrossRef]
  9. Khwarahm, N.R. Modeling forest-shrubland fire susceptibility based on machine learning and geospatial approaches in mountains of Kurdistan Region, Iraq. Arab. J. Geosci. 2022, 15, 1184. [Google Scholar] [CrossRef]
  10. Nasser, M. Forests and forestry in Iraq: Prospects and limitations. Commonw. For. Rev. 1984, 63, 299–304. [Google Scholar]
  11. Javanshah, A. Global warming has been affecting some morphological characters of pistachio trees (Pistacia vera L.). Afr. J. Agric. Res. 2010, 5, 3394–3401. [Google Scholar]
  12. Hama, A.A.; Khwarahm, N.R. Predictive mapping of two endemic oak tree species under climate change scenarios in a semiarid region: Range overlap and implications for conservation. Ecol. Inform. 2023, 73, 101930. [Google Scholar] [CrossRef]
  13. Radha, K.O.; Khwarahm, N.R. An Integrated Approach to Map the Impact of Climate Change on the Distributions of Crataegus azarolus and Crataegus monogyna in Kurdistan Region, Iraq. Sustainability 2022, 14, 14621. [Google Scholar] [CrossRef]
  14. Ahmed, Z.B.; Yousfi, M.; Viaene, J.; Dejaegher, B.; Demeyer, K.; Heyden, Y.V. Four Pistacia atlantica subspecies (atlantica, cabulica, kurdica and mutica): A review of their botany, ethnobotany, phytochemistry and pharmacology. J. Ethnopharmacol. 2020, 265, 113329. [Google Scholar] [CrossRef] [PubMed]
  15. Bozorgi, M.; Memariani, Z.; Mobli, M.; Salehi Surmaghi, M.H.; Shams-Ardekani, M.R.; Rahimi, R. Five Pistacia species (P. vera, P. atlantica, P. terebinthus, P. khinjuk, and P. lentiscus): A review of their traditional uses, phytochemistry, and pharmacology. Sci. World J. 2013, 2013, 219815. [Google Scholar] [CrossRef] [PubMed] [Green Version]
  16. Hatamnia, A.A.; Abbaspour, N.; Darvishzadeh, R. Antioxidant activity and phenolic profile of different parts of Bene (Pistacia atlantica subsp. kurdica) fruits. Food Chem. 2014, 145, 306–311. [Google Scholar] [CrossRef] [PubMed]
  17. Bahmani, M.; Saki, K.; Asadbeygi, M.; Adineh, A.; Saberianpour, S.; Rafieian-Kopaei, M.; Bahmani, F.; Bahmani, E. The effects of nutritional and medicinal mastic herb (Pistacia atlantica). J. Chem. Pharm. Res. 2015, 7, 646–653. [Google Scholar]
  18. Schulze-Kaysers, N.; Feuereisen, M.; Schieber, A. Phenolic compounds in edible species of the Anacardiaceae family—A review. RSC Adv. 2015, 5, 73301–73314. [Google Scholar] [CrossRef]
  19. Sharifi, M.S.; Hazell, S.L. GC-MS analysis and antimicrobial activity of the essential oil of the trunk exudates from Pistacia atlantica kurdica. J. Pharm. Sci. Res. 2011, 3, 1364. [Google Scholar]
  20. Ahmad, S.A.; Askari, A.A. Ethnobotany of the Hawraman region of Kurdistan Iraq. Harv. Pap. Bot. 2015, 20, 85–89. [Google Scholar] [CrossRef]
  21. Al-Saghir, M.G.; Porter, D.M.; Nilsen, E.T. Leaf anatomy of Pistacia species (Anacardiaceae). J. Biol. Sci. 2006, 6, 242–244. [Google Scholar] [CrossRef] [Green Version]
  22. Basr Ila, H.; Kafkas, S.; Topaktas, M. Chromosome numbers of four Pistacia (Anacardiaceae) species. J. Hortic. Sci. Biotechnol. 2003, 78, 35–38. [Google Scholar] [CrossRef]
  23. Parfitt, D.E.; Badenes, M.L. Phylogeny of the genus Pistacia as determined from analysis of the chloroplast genome. Proc. Natl. Acad. Sci. USA 1997, 94, 7987–7992. [Google Scholar] [CrossRef] [PubMed] [Green Version]
  24. Kafkas, S.; Perl-Treves, R. Morphological and molecular phylogeny of Pistacia species in Turkey. Theor. Appl. Genet. 2001, 102, 908–915. [Google Scholar] [CrossRef]
  25. Talebi, M.; Kazemi, M.; Sayed-Tabatabaei, B.E. Molecular diversity and phylogenetic relationships of Pistacia vera, Pistacia atlantica subsp. mutica and Pistacia khinjuk using SRAP markers. Biochem. Syst. Ecol. 2012, 44, 179–185. [Google Scholar] [CrossRef]
  26. Belhadj, S.; Derridj, A.; Aigouy, T.; Gers, C.; Gauquelin, T.; Mevy, J.P. Comparative morphology of leaf epidermis in eight populations of Atlas pistachio (Pistacia atlantica Desf., Anacardiaceae). Microsc. Res. Tech. 2007, 70, 837–846. [Google Scholar] [CrossRef]
  27. Sawidis, T.; Dafnis, S.; Weryzko-Chmielewska, E. Distribution, development and structure of resin ducts in Pistacia lentiscus var. chia Duhamel. Flora 2000, 195, 83–94. [Google Scholar] [CrossRef]
  28. Al-Alfy, N.; Moustafa, A.; Alotaibi, M.; Mansour, S. Impact of Climate Change on Pistacia khinjuk as a Medicinal Plant in Egypt and Saudi Arabia. Appl. Sci. Res. Rev. 2019, 6, 3. [Google Scholar]
  29. Pineda, E.; Lobo, J.M. Assessing the accuracy of species distribution models to predict amphibian species richness patterns. J. Anim. Ecol. 2009, 78, 182–190. [Google Scholar] [CrossRef]
  30. Elith, J.; Leathwick, J.R. Species distribution models: Ecological explanation and prediction across space and time. Annu. Rev. Ecol. Evol. Syst. 2009, 40, 677–697. [Google Scholar] [CrossRef]
  31. Svenning, J.-C.; Fløjgaard, C.; Marske, K.A.; Nógues-Bravo, D.; Normand, S. Applications of species distribution modeling to paleobiology. Quat. Sci. Rev. 2011, 30, 2930–2947. [Google Scholar] [CrossRef]
  32. Elith, J.; Graham, C.H.; Anderson, R.P.; Dudík, M.; Ferrier, S.; Guisan, A.; Hijmans, R.J.; Huettmann, F.; Leathwick, J.R.; Lehmann, A.; et al. Novel methods improve prediction of species’ distributions from occurrence data. Ecography 2006, 29, 129–151. [Google Scholar] [CrossRef] [Green Version]
  33. Graham, C.H.; Ferrier, S.; Huettman, F.; Moritz, C.; Peterson, A.T. New developments in museum-based informatics and applications in biodiversity analysis. Trends Ecol. Evol. 2004, 19, 497–503. [Google Scholar] [CrossRef] [PubMed]
  34. Phillips, S.J.; Anderson, R.P.; Schapire, R.E. Maximum entropy modeling of species geographic distributions. Ecol. Model. 2006, 190, 231–259. [Google Scholar] [CrossRef] [Green Version]
  35. Bor, N.L.; Guest, E. Flora of Iraq, Vol. 9. Gramineae. In Flora of Iraq; Ministry of Agriculture and Agrarian Reform: Baghdad, Iraq, 1968. [Google Scholar]
  36. Malinowski, J.C. Iraq: A Geography; United States Military Academy: West Point, NY, USA, 2002. [Google Scholar]
  37. Salman, S.A.; Shahid, S.; Ismail, T.; Ahmed, K.; Chung, E.-S.; Wang, X.-J. Characteristics of annual and seasonal trends of rainfall and temperature in Iraq. Asia-Pac. J. Atmos. Sci. 2019, 55, 429–438. [Google Scholar] [CrossRef]
  38. Sissakian, V.; Jabbar, M.A.; Al-Ansari, N.; Knutsson, S. Development of Gulley Ali Beg Gorge in Rawandooz Area, Northern Iraq. Engineering 2015, 7, 16–30. [Google Scholar] [CrossRef] [Green Version]
  39. Khwarahm, N.R.; Ararat, K.; Qader, S.; Sabir, D.K. Modeling the distribution of the Near Eastern fire salamander (Salamandra infraimmaculata) and Kurdistan newt (Neurergus derjugini) under current and future climate conditions in Iraq. Ecol. Inform. 2021, 63, 101309. [Google Scholar] [CrossRef]
  40. Gaznayee, H.A.A.; Al-Quraishi, A.M.F.; Mahdi, K.; Ritsema, C. A Geospatial Approach for Analysis of Drought Impacts on Vegetation Cover and Land Surface Temperature in the Kurdistan Region of Iraq. Water 2022, 14, 927. [Google Scholar] [CrossRef]
  41. Bhatta, K.P.; Chaudhary, R.P.; Vetaas, O.R. A comparison of systematic versus stratified-random sampling design for gradient analyses: A case study in subalpine Himalaya, Nepal. Phytocoenologia 2012, 42, 191–202. [Google Scholar] [CrossRef]
  42. Boakes, E.H.; McGowan, P.J.; Fuller, R.A.; Chang-qing, D.; Clark, N.E.; O’Connor, K.; Mace, G.M. Distorted views of biodiversity: Spatial and temporal bias in species occurrence data. PLoS Biol. 2010, 8, e1000385. [Google Scholar] [CrossRef]
  43. Radosavljevic, A.; Anderson, R.P. Making better Maxent models of species distributions: Complexity, overfitting and evaluation. J. Biogeogr. 2014, 41, 629–643. [Google Scholar] [CrossRef]
  44. Brown, J.L. SDM toolbox: A python-based GIS toolkit for landscape genetic, biogeographic and species distribution model analyses. Methods Ecol. Evol. 2014, 5, 694–700. [Google Scholar] [CrossRef]
  45. Soberón, J.; Peterson, A.T. Interpretation of models of fundamental ecological niches and species’ distributional areas. Biodivers. Inform. 2005, 2, 1–10. [Google Scholar] [CrossRef] [Green Version]
  46. Elith, J.; Kearney, M.; Phillips, S. The art of modelling range-shifting species. Methods Ecol. Evol. 2010, 1, 330–342. [Google Scholar] [CrossRef]
  47. Austin, M.P.; Van Niel, K.P. Improving species distribution models for climate change studies: Variable selection and scale. J. Biogeogr. 2011, 38, 1–8. [Google Scholar] [CrossRef]
  48. Pradervand, J.-N.; Dubuis, A.; Pellissier, L.; Guisan, A.; Randin, C. Very high resolution environmental predictors in species distribution models: Moving beyond topography? Prog. Phys. Geogr. 2014, 38, 79–96. [Google Scholar] [CrossRef]
  49. IPCC. The Physical Science Basis: Contribution of Working Group I to the Fourth Assessment Report of the Intergovernmental Panel on Climate Change; Cambridge University Press: Cambridge, UK; New York, NY, USA, 2007; Volume 996, pp. 113–119. [Google Scholar]
  50. Hijmans, R.J.; Cameron, S.E.; Parra, J.L.; Jones, P.G.; Jarvis, A. Very high resolution interpolated climate surfaces for global land areas. Int. J. Climatol. J. R. Meteorol. Soc. 2005, 25, 1965–1978. [Google Scholar] [CrossRef]
  51. Hanberry, B.B. Global population densities, climate change, and the maximum monthly temperature threshold as a potential tipping point for high urban densities. Ecol. Indic. 2022, 135, 108512. [Google Scholar] [CrossRef]
  52. Karim, R.; Tan, G.; Ayugi, B.; Babaousmail, H.; Liu, F. Evaluation of historical CMIP6 model simulations of seasonal mean temperature over Pakistan during 1970–2014. Atmosphere 2020, 11, 1005. [Google Scholar] [CrossRef]
  53. Fan, X.; Duan, Q.; Shen, C.; Wu, Y.; Xing, C. Global surface air temperatures in CMIP6: Historical performance and future changes. Environ. Res. Lett. 2020, 15, 104056. [Google Scholar] [CrossRef]
  54. Beck, H.E.; Zimmermann, N.E.; McVicar, T.R.; Vergopolan, N.; Berg, A.; Wood, E.F. Present and future Köppen-Geiger climate classification maps at 1-km resolution. Sci. Data 2018, 5, 180214. [Google Scholar] [CrossRef] [Green Version]
  55. Syfert, M.M.; Smith, M.J.; Coomes, D.A. The effects of sampling bias and model complexity on the predictive performance of MaxEnt species distribution models. PLoS ONE 2013, 8, e55158. [Google Scholar] [CrossRef]
  56. Brown, J.L.; Bennett, J.R.; French, C.M. SDMtoolbox 2.0: The next generation Python-based GIS toolkit for landscape genetic, biogeographic and species distribution model analyses. PeerJ 2017, 5, e4095. [Google Scholar] [CrossRef] [PubMed] [Green Version]
  57. Dudík, M.; Phillips, S.J.; Schapire, R.E. Maximum entropy density estimation with generalized regularization and an application to species distribution modeling. J. Mach. Learn. Res. 2007, 8, 1217–1260. [Google Scholar]
  58. Merow, C.; Smith, M.J.; Silander Jr, J.A. A practical guide to MaxEnt for modeling species’ distributions: What it does, and why inputs and settings matter. Ecography 2013, 36, 1058–1069. [Google Scholar] [CrossRef]
  59. Phillips, S.J. A brief tutorial on Maxent. ATT Res. 2005, 190, 231–259. [Google Scholar]
  60. Jiménez-Valverde, A.; Lobo, J.M. Threshold criteria for conversion of probability of species presence to either–or presence–absence. Acta Oecologica 2007, 31, 361–369. [Google Scholar] [CrossRef]
  61. Yang, X.-Q.; Kushwaha, S.; Saran, S.; Xu, J.; Roy, P. Maxent modeling for predicting the potential distribution of medicinal plant, Justicia adhatoda L. in Lesser Himalayan foothills. Ecol. Eng. 2013, 51, 83–87. [Google Scholar] [CrossRef]
  62. Jiang, H.; Liu, T.; Li, L.; Zhao, Y.; Pei, L.; Zhao, J. Predicting the potential distribution of Polygala tenuifolia Willd. under climate change in China. PLoS ONE 2016, 11, e0163718. [Google Scholar] [CrossRef] [Green Version]
  63. Allouche, O.; Tsoar, A.; Kadmon, R. Assessing the accuracy of species distribution models: Prevalence, kappa and the true skill statistic (TSS). J. Appl. Ecol. 2006, 43, 1223–1232. [Google Scholar] [CrossRef]
  64. Li, C.; Gao, Y.; Zhao, Z.; Ma, D.; Zhou, R.; Wang, J.; Zhang, Q.; Liu, Q. Potential geographical distribution of Anopheles gambiae worldwide under climate change. J. Biosaf. Biosecur. 2021, 3, 125–130. [Google Scholar] [CrossRef]
  65. Hoveka, L.N.; van der Bank, M.; Davies, T.J. Winners and losers in a changing climate: How will protected areas conserve red list species under climate change? Divers. Distrib. 2022, 28, 782–792. [Google Scholar] [CrossRef]
  66. Monzón, J.; Moyer-Horner, L.; Palamar, M.B. Climate change and species range dynamics in protected areas. Bioscience 2011, 61, 752–761. [Google Scholar] [CrossRef] [Green Version]
  67. Khwarahm, N.R. Mapping current and potential future distributions of the oak tree (Quercus aegilops) in the Kurdistan Region, Iraq. Ecol. Process. 2020, 9, 56. [Google Scholar] [CrossRef]
  68. Ayebare, S.; Plumptre, A.; Kujirakwinja, D.; Segan, D. Conservation of the endemic species of the Albertine Rift under future climate change. Biol. Conserv. 2018, 220, 67–75. [Google Scholar] [CrossRef]
  69. Loarie, S.R.; Carter, B.E.; Hayhoe, K.; McMahon, S.; Moe, R.; Knight, C.A.; Ackerly, D.D. Climate change and the future of California’s endemic flora. PLoS ONE 2008, 3, e2502. [Google Scholar] [CrossRef] [PubMed]
  70. Le Roux, P.C.; McGEOCH, M.A. Rapid range expansion and community reorganization in response to warming. Glob. Chang. Biol. 2008, 14, 2950–2962. [Google Scholar] [CrossRef]
  71. López-Sánchez, C.A.; Castedo-Dorado, F.; Cámara-Obregón, A.; Barrio-Anta, M. Distribution of Eucalyptus globulus Labill. in northern Spain: Contemporary cover, suitable habitat and potential expansion under climate change. For. Ecol. Manag. 2021, 481, 118723. [Google Scholar] [CrossRef]
  72. Wang, W.J.; Thompson III, F.R.; He, H.S.; Fraser, J.S.; Dijak, W.D.; Jones-Farrand, T. Climate change and tree harvest interact to affect future tree species distribution changes. J. Ecol. 2019, 107, 1901–1917. [Google Scholar] [CrossRef]
  73. Setyawan, A.D.; Supriatna, J.; Nisyawati, N.; Nursamsi, I.; Sutarno, S.; Sugiyarto, S.; Sunarto, S.; Pradan, P.; Budiharta, S.; Pitoyo, A.; et al. Projecting expansion range of Selaginella zollingeriana in the Indonesian archipelago under future climate condition. Biodivers. J. Biol. Divers. 2021, 22, 2088–2103. [Google Scholar] [CrossRef]
  74. Tsiftsis, S.; Štípková, Z.; Kindlmann, P. Role of way of life, latitude, elevation and climate on the richness and distribution of orchid species. Biodivers. Conserv. 2019, 28, 75–96. [Google Scholar] [CrossRef]
  75. Zhang, K.; Liu, H.; Pan, H.; Shi, W.; Zhao, Y.; Li, S.; Liu, J.; Tao, J. Shifts in potential geographical distribution of Pterocarya stenoptera under climate change scenarios in China. Ecol. Evol. 2020, 10, 4828–4837. [Google Scholar] [CrossRef] [Green Version]
  76. Nachtergaele, F.O. Classification Systems: FAO☆. In Reference Module in Earth Systems and Environmental Sciences; Elsevier: Amsterdam, The Netherlands, 2017. [Google Scholar]
  77. Hao, T.; Elith, J.; Guillera-Arroita, G.; Lahoz-Monfort, J.J. A review of evidence about use and performance of species distribution modelling ensembles like BIOMOD. Divers. Distrib. 2019, 25, 839–852. [Google Scholar] [CrossRef]
  78. Baldwin, R.A. Use of maximum entropy modeling in wildlife research. Entropy 2009, 11, 854–866. [Google Scholar] [CrossRef]
  79. Elith, J.; Franklin, J. Species distribution modeling. In Encyclopedia of Biodiversity, 2nd ed.; Elsevier Inc.: Amsterdam, The Netherlands, 2013; pp. 692–705. [Google Scholar]
  80. Barnhart, P.R.; Gillam, E.H. The impact of sampling method on maximum entropy species distribution modeling for bats. Acta Chiropterologica 2014, 16, 241–248. [Google Scholar] [CrossRef]
  81. Kearney, M.; Porter, W. Mechanistic niche modelling: Combining physiological and spatial data to predict species’ ranges. Ecol. Lett. 2009, 12, 334–350. [Google Scholar] [CrossRef] [PubMed]
  82. Carneiro, L.R.d.A.; Lima, A.P.; Machado, R.B.; Magnusson, W.E. Limitations to the use of species-distribution models for environmental-impact assessments in the Amazon. PLoS ONE 2016, 11, e0146543. [Google Scholar] [CrossRef] [Green Version]
  83. Miller, J. Species distribution modeling. Geogr. Compass 2010, 4, 490–509. [Google Scholar] [CrossRef]
  84. Kasagana, V.N.; Karumuri, S.S. Conservation of medicinal plants (past, present & future trends). J. Pharm. Sci. Res. 2011, 3, 1378. [Google Scholar]
  85. Mahmoodi, S.; Heydari, M.; Ahmadi, K.; Khwarahm, N.R.; Karami, O.; Almasieh, K.; Naderi, B.; Bernard, P.; Mosavi, A. The current and future potential geographical distribution of Nepeta crispa Willd., an endemic, rare and threatened aromatic plant of Iran: Implications for ecological conservation and restoration. Ecol. Indic. 2022, 137, 108752. [Google Scholar] [CrossRef]
  86. Yadav, P.; Sarma, K.; Dookia, S. The review of biodiversity and conservation study in India using geospatial technology. Int. J. Remote Sens. GIS 2013, 2, 1–10. [Google Scholar]
  87. Draper, D.; Rosselló-Graell, A.; Garcia, C.; Gomes, C.T.; Sérgio, C.l. Application of GIS in plant conservation programmes in Portugal. Biol. Conserv. 2003, 113, 337–349. [Google Scholar] [CrossRef]
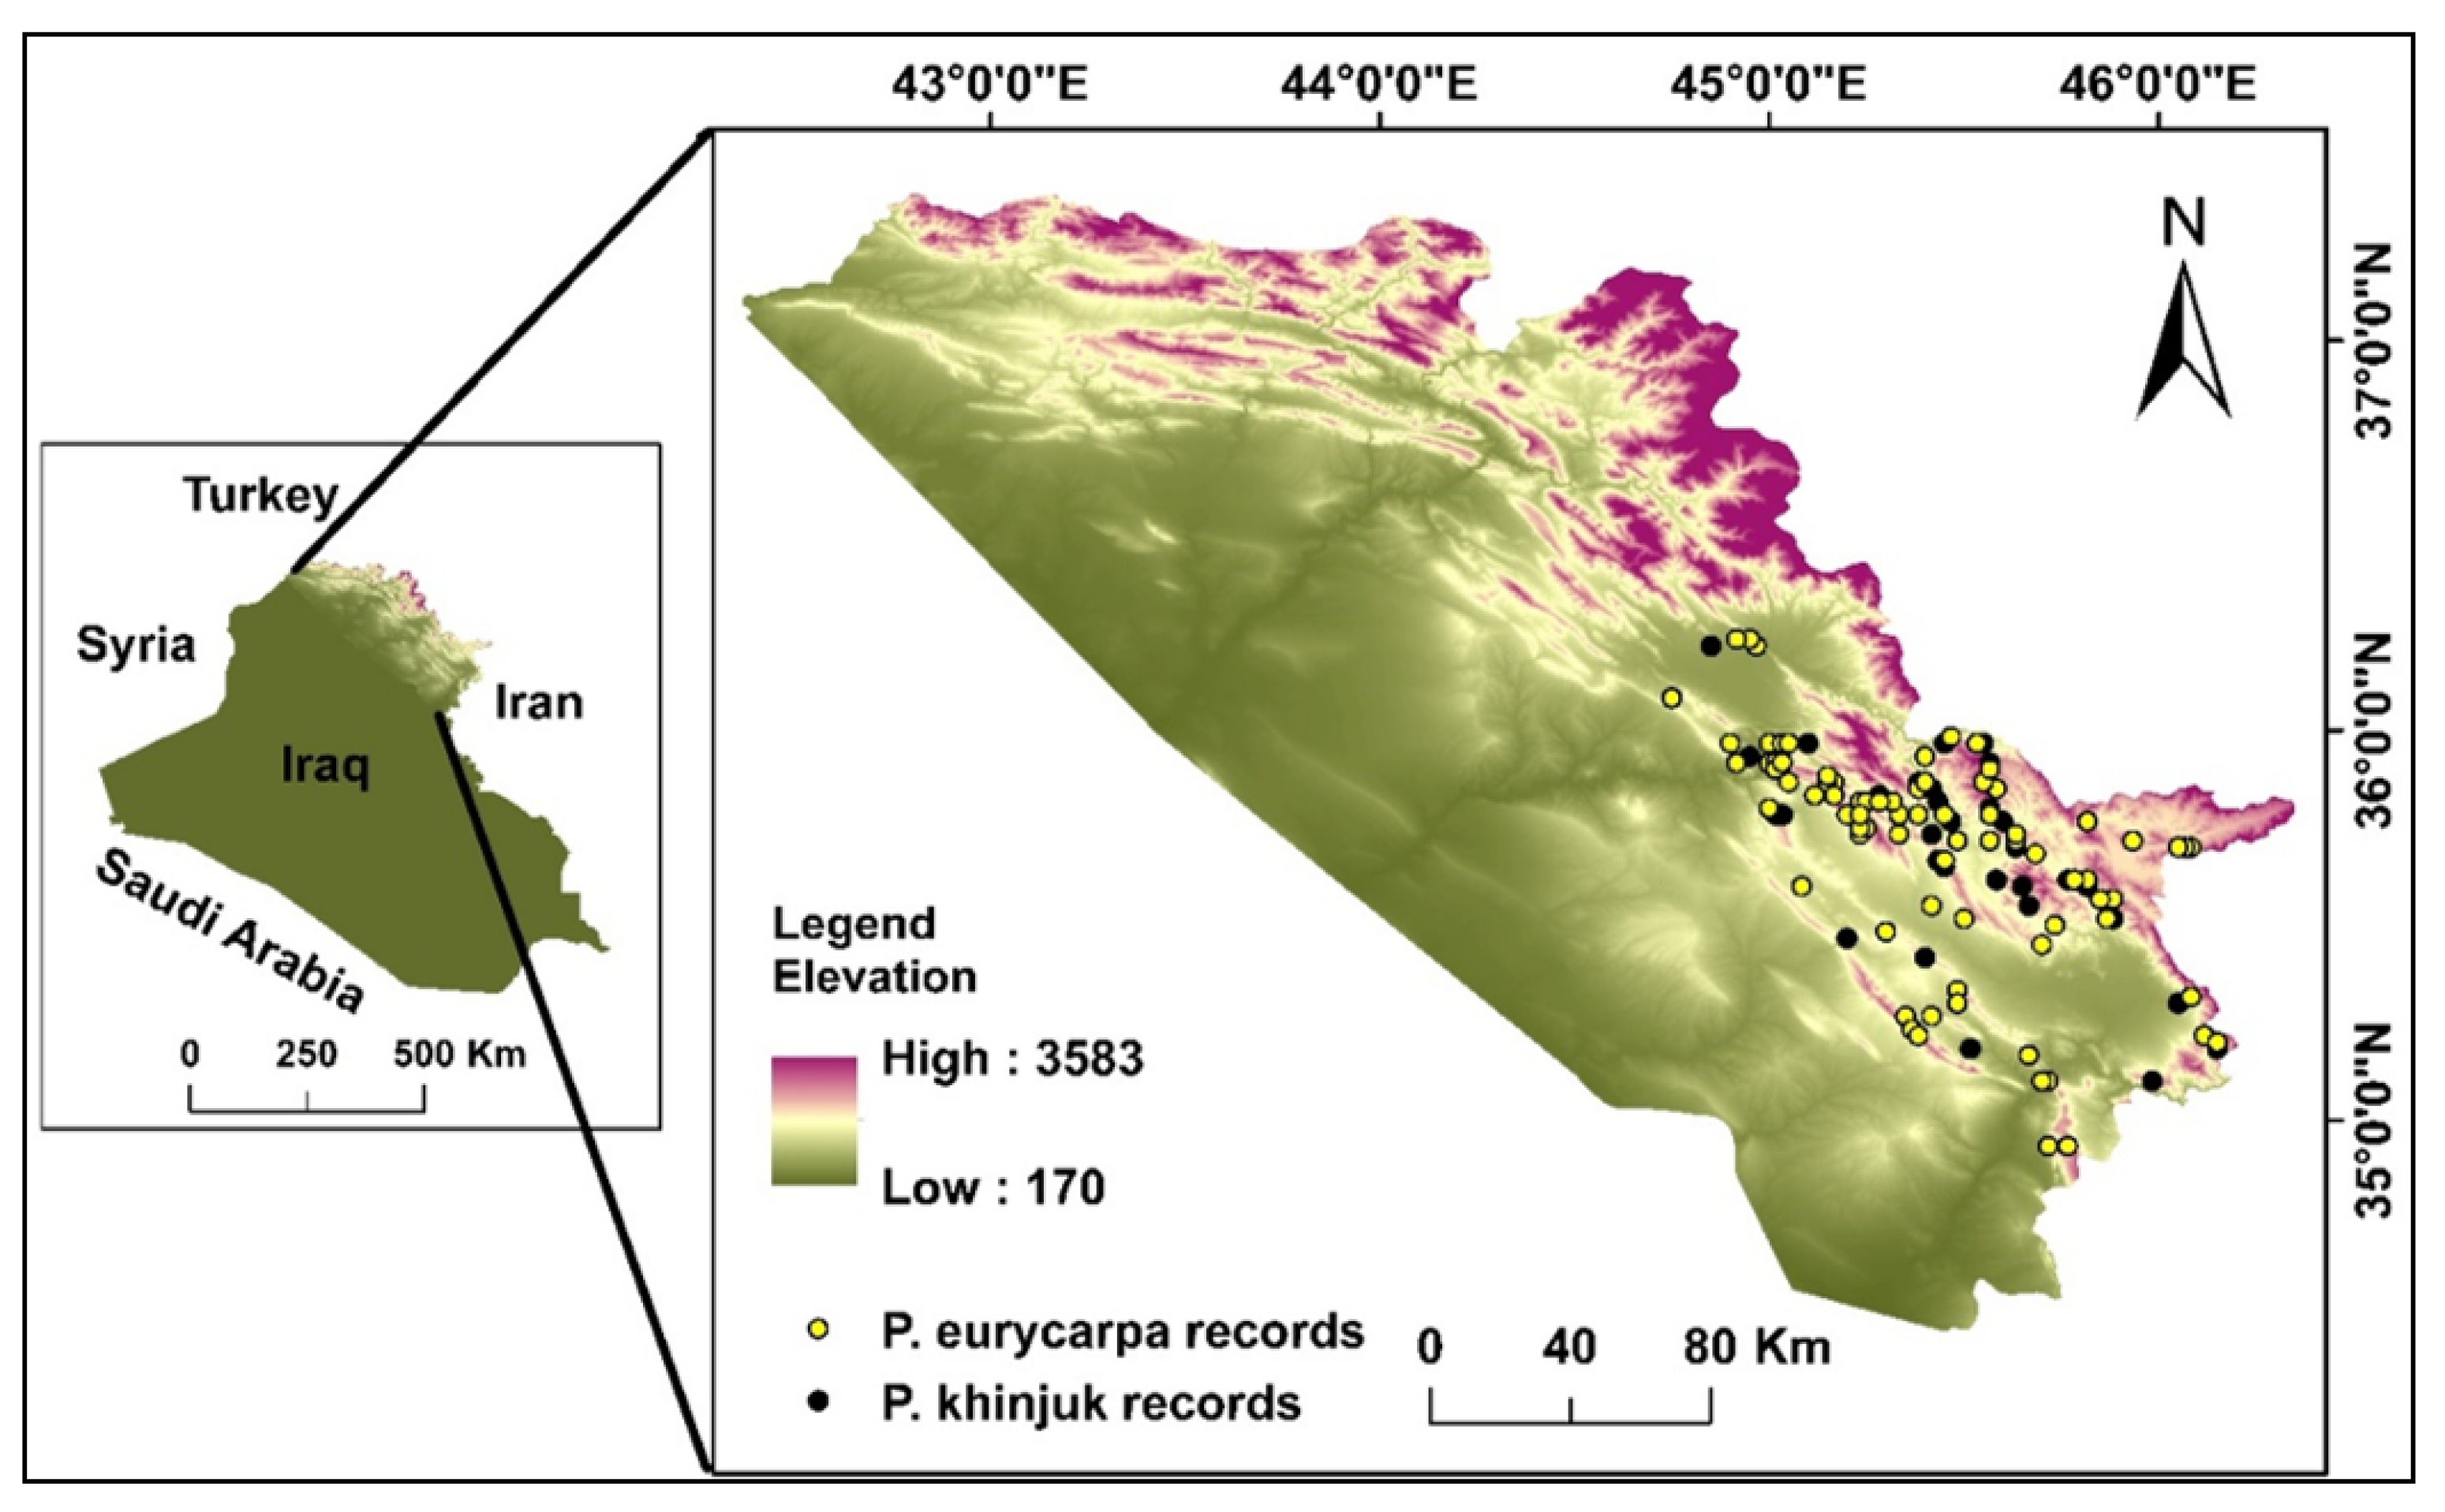
Figure 1. Study area: Kurdistan Region of Iraq and species records.
Sustainability 15 05469 g001
Figure 2. P. khinjuk (right) (Aug 2021, plant height 2.5 m) Sharbazher–Kanarwe area. P. eurycarpa photo (left) (July 2021, plant height 6 m) Sharbazher–Khamza area, Sulaimani Governorate. Photos by Barham A. HamadAmin.
Sustainability 15 05469 g002
Figure 3. Potential current distribution of both studied Pistacia sp. in the KRI.
Sustainability 15 05469 g003
Figure 4. Distributions for the future habitat of P. eurycarpa under (SSP 585, 245, and 126) climate change scenarios in the BCC-CSM2-MR model in the years 2041–2060, 2061–2080, and 2081–2100 in the KRI.
Sustainability 15 05469 g004
Figure 5. Distributions of the future habitat of P. eurycarpa under (SSP 585, 245, and 126) climate change scenarios in the MIROC-ES2L model for the years 2041–2060, 2061–2080, and 2081–2100 in the KRI.
Sustainability 15 05469 g005
Figure 6. Distributions of the future habitat of P. khinjuk under (SSP 6585, 245, and 12) climate change scenarios in the BCC-CSM2-MR model for the years 2041–2060, 2061–2080, and 2081–2100 in the KRI.
Sustainability 15 05469 g006
Figure 7. Distributions of the future habitat of P. khinjuk under (SSP 585, 245, and 126) climate change scenarios in the MIROC-ES2L model for the years 2041–2060, 2061–2080, and 2081–2100 in the KRI.
Sustainability 15 05469 g007
Figure 8. Change in the distribution of the habitat areas under the given scenarios of climate change for two species in future climates. Note: the maps illustrate only the expansion trend results for the species’ habitat changes. (a,b) Figures show P. eurycarpa’s future expansion, while (c,d) figures show P. khinjuk’s future expansion.
Sustainability 15 05469 g008
Figure 9. Change density (magnitude) of the distribution and the centroid (core) direction of P. eurycarpa (left) and P. khinjuk (right). The arrowhead = the distribution change direction under the given scenarios. The time windows of 2041–2060, 2061–2080, and 2081–2100 are shown in black, blue, and yellow color arrows in the figure, respectively.
Sustainability 15 05469 g009
Figure 10. The jackknife test for environmental factors significance, the AUC metric gain (%), and regularizing training gain (%) for P. eurycarpa (top) and P. khinjuk (bottom).
Sustainability 15 05469 g010
Figure 11. Contribution of the variables to the distribution probability of both P. khinjuk (right) and P. eurycarpa (left) in the KRI.
Sustainability 15 05469 g011
Figure 12. The two figures depict the spatial representation of the average overlapping habitat ranges among the 18 overlap results for P. khinjuk and P. eurycarpa in the KRI.
Sustainability 15 05469 g012
Table 1. The environmental factors taken into account for modeling. (The model development process employed just the variables in bold).
VariableCode and UnitP. eurycarpaP. khinjuk
Annual mean temperatureBio1 (°C)
Mean diurnal rangeBio2 (°C)
Temperature seasonality Bio4 (standard deviation × 100)
Isothermality (BIO2/BIO7) Bio3 (×100)
Max temperature of warmest monthBio5 (°C)
Min temperature of coldest monthBio6 (°C)
Temperature annual rangeBio7 (Bio5-Bio6) (°C)
Mean temperature of wettest quarterBio8 (°C)
Mean temperature of driest quarterBio9 (°C)
Mean temperature of warmest quarterBio10 (°C)
Mean temperature of coldest quarterBio11 (°C)
Annual precipitationBio12 mm
Precipitation of wettest monthBio13 mm
Precipitation of coldest quarterBio19 mm
Precipitation of warmest quarterBio18 mm
Precipitation of driest quarterBio17 mm
Precipitation of wettest quarterBio16 mm
Precipitation seasonality Bio15 mm
Precipitation of driest monthBio14 mm
SlopeSlope (degree)
Aspect Aspect (degree)
Soil typeFAO soil classification
Soil carbonSoil carbon (%)
Soil moistureSoil moisture (mm)
Soil pHSoil (parts hydrogen)
DEMDigital elevation model (m)
Geo
Table 2. The wettest month’s precipitation varies depending on the present and the future conditions. Only the scenarios with the biggest growth ranges for the two species were selected.
Precipitation of Wettest Month (Bio13)Current P. khinjukP. eurycarpa
BCC-CSM2-MRMIROC-ES2LBCC-CSM2-MRMIROC-ES2L
SSP 245SSP 585 SSP 585 SSP 245
(2041–2060)(2081–2100)(2041–2060)(2081–2100)
Lowest5855565555
Highest200174198181193
Table 3. Distribution of soil types by percentage in the KRI study area.
ValueLegendFAOSOILAreaArea in %
1LithosolI-Rc-Xk-c5842.211.4
3LithosolI-Be-c515.41.0
4Chromic LuvisolsLc63-3bc11.90.0
6Calcic XerosolsXk5-3ab101.10.2
7Haplic XerosolsXh31-3a30.70.1
9Chromic VertisolsVc1-3a954718.7
11Haplic XerosolsXh33-3a29.70.1
12Chromic VertisolsVc50-3ab20414.0
14LithosolI-E-bc851616.7
16LithosolI-E-Xk-bc533110.4
18Calcic XerosolsXk29-ab4400.9
19Calcic XerosolsXk26-2/3a10652.1
20Gypsic XerosolsXy5-a10232.0
21Calcic XerosolsXk28-b12,46424.4
22Calcic XerosolsXk9-2/3a5861.1
23Calcaric FluvisolsJc1-2a4620.9
24Gypsic YermosolsYy10-2ab2590.5
25Gypsic YermosolsYy10-2/3a24734.8
29Calcic YermosolsYk34-b3590.7
Disclaimer/Publisher’s Note: The statements, opinions and data contained in all publications are solely those of the individual author(s) and contributor(s) and not of MDPI and/or the editor(s). MDPI and/or the editor(s) disclaim responsibility for any injury to people or property resulting from any ideas, methods, instructions or products referred to in the content.