Article

Defining Important Areas for Ecosystem Conservation in Qinghai Province under the Policy of Ecological Red Line

1
Institute of Ecology, China West Normal University, Nanchong 637009, China
2
College of Life Sciences, China West Normal University, Nanchong 637009, China
3
Ecological Field Station Real-Time Monitoring Center, Research Center for Ecology, Tibet University, Lhasa 850000, China
*
Author to whom correspondence should be addressed.
Sustainability 2023, 15(6), 5524; https://doi.org/10.3390/su15065524
Submission received: 2 January 2023 / Revised: 12 March 2023 / Accepted: 14 March 2023 / Published: 21 March 2023
(This article belongs to the Special Issue Biodiversity and Ecosystem Services for Environmental Sustainability)

Abstract

:
Delimiting important ecological conservation areas is critical for ecological integrity, sustainability of the ecological service function, and management of environmental degradation. However, the process of defining important areas for ecological protection purposes is elusive, especially in the Qinghai Province of China, which is home to unique ecosystems. To address this issue, we selected biodiversity (endangered mammals, birds, and plants), soil retention, water storage, and carbon sequestration to define and delimit important areas for the protection of these ecosystem functions. We found that the important endangered birds of Qinghai Province were mainly distributed in the eastern and southern parts, while important endangered plants were relatively centralized, with relatively high distribution in the Golog of Qinghai Province. The total amounts were 2.245 billion tons, 46.513 billion m3, and 60.91 Tg for soil retention, water storage, and carbon sequestration in Qinghai ecosystems, respectively. Soil retention and carbon sequestration presented a similar trend, with high levels in the eastern and low levels in the western parts of Qinghai, while water storage was higher in the south than in the north. Among various ecosystem types, the grassland ecosystem was the main body of soil retention, water retention, and carbon sequestration; soil retention, water retention, and carbon sequestration were quite small in the desert, town, and city ecosystems. By evaluating the spatial distribution of the service functions of ecosystems, we found that extremely important areas of the ecosystem service function in Qinghai Province totaled 247,200 square kilometers, and the important areas summed to 124,500 square kilometers. Combined extremely important and important areas of the ecosystem service function reached 371,700 square kilometers and accounted for 53.36% of the total area of Qinghai. The ecological protection red line has now become an important national strategy for ecological protection. The demarcation of the ecological protection red line has great significance in safeguarding Qinghai’s ecological security. It is the basic guarantee for sustainable economic and social development in China.

1. Introduction

Qinghai Province is located in the northeast of the Qinghai-Tibet Plateau. As an important water conservation area, Qinghai Province is known as the Water Tower of China. It is an important source of the Yangtze River, Yellow River, and Lantsang River. At the same time, it is a very important plateau biological distribution area and biodiversity key conservation area. However, the environment in this area is relatively fragile and is impacted by global climate change and human activity [1]. For example, the glacier in Qinghai exhibits material deficit status, with ice reduction and thinning and a decreasing water retention function. Further, vegetation has been severely degraded, biodiversity reduced, and water and soil loss intensified; this has led to a decrease in ecosystem stability, limiting the sustainable development of the economy in peripheral regions [2,3]. Due to its special geographical location and environmental conditions, the ecosystem of Qinghai is rich in ecosystem service functions but provides poor social and economic development in Qinghai. The delimiting of ecological red lines is of great significance for China’s ecological construction and sustainable development [4].
Human activities reflect the problem of the resource–utilization mode. The stagnancy and exhaustion of resource utilization in time and space are the main reasons causing severe environmental problems [5]. A major issue facing human social development is how to establish a new ecological resource management mode to ensure the rational and sustainable utilization of resources [6]. The implementation of the ecological red line policy is an effective means to solve the environmental problems caused by the rapid urbanization and industrialization process in China, such as the loss of biodiversity, ecosystem degradation, and land resource degradation, and it plays a key role in maintaining the stable performance of the ecosystem service function and in safeguarding national and regional ecosecurity [7,8]. It also represents an urgent need and effective means of curbing environmental degradation [9,10].
The ecology protection red line is an important innovation in Chinese ecological construction. China is the first country in the world to apply the ecology protection red line theory to national ecological management [11]. The ecology protection red line is similar to the protected area system, national park system, and natural reserve network [12]. The construction of global nature reserves promoted by the IUCN, the construction of national parks in the United States, the European Union Network of Nature Reserves (Natura 2000), the zonal planning of the Great Barrier Reef Marine Park in Australia, and the construction of protected areas show that these measures have a remarkable effect on the protection of regional ecosystems. The ecology protection red line not only emphasizes the protection of complete ecosystems and classified protection but also includes the integrated management of important ecological functions and ecologically sensitive and fragile areas [13]. The ecology protection red line is the ecosecurity bottom line and a strictly-controlled boundary for ecological space; it consists of a protection red line for ecological function areas, ecologically sensitive and fragile areas, and biodiversity [14]. The ecology protection red line seeks to optimize and adjust production, life, and ecological space from a macro pattern and is of key significance in maintaining national and regional ecosecurity, safeguarding ecosystem functions, and supporting the sustainable development of society [15,16].
The Chinese government established red line delineation in Qinghai for the purpose of slowing down or reversing environmental degradation and protecting water resources [17]. The early results showed that the vegetation coverage rate in Qinghai has increased in recent years [18]. However, the influence of red line delimiting on the environment of Qinghai has not been determined. Additionally, studies in Qinghai focused on the three-river source area and Qinghai Lake basin; analyses at the scale of the province are lacking [19]. In this study, we selected biodiversity (endangered mammals, birds, and plants), soil retention, water storage, soil retention, and carbon sequestration to define and delimit important areas for the protection of these ecosystem functions.
Defining important areas for ecosystem conservation in Qinghai Province under the policy of ecological red lines will safeguard the environmental security of Qinghai, maintain the health of Qinghai ecosystems, and provide support for implementing ecosystem protection and ecological restoration [20]. Due to the special location of Qinghai, the integrated protection of important ecological function areas, ecologically sensitive areas, fragile areas, and protection areas of biodiversity will ensure national ecological security [19].

2. Materials and Methods

2.1. Research Area

Qinghai Province is located in the western part of China at longitude 89°35′–103°04′ E and latitude 31°36′–39°19′ N; it borders Gansu to the north and east, Xinjiang to the northwest, Tibet to the south and southwest, and Sichuan to the southeast [21]. Qinghai has a total area of 696,6000 square kilometers, with 2 provincial cities, and 6 autonomous prefectures. At the end of 2018, permanent residents of Qinghai reached 6.0323 million [22]. Qinghai has high altitudes in the west, north, and south; low altitudes are found in the east and central parts. The high altitudes in the west descend step-wise to the east; the eastern part forms a transition zone from Tibet to Loess Plateau. The terrain is complex, and the landform is diverse [23] (Figure 1).
Qinghai Province exhibits plateau continental climate, with long duration of sunshine and strong radiation, long winters and cool summers, large daily temperature differences, and small annual temperature differences. Rainfall is low, and most areas receive less than 400 mm annual precipitation [24]; rainfall exhibits large differences among regions, with relatively more rainfall in the east and southeast, and it is dry and windy in the west and northwest. In Qinghai, the average annual temperature ranges from −5.1 to 9.0 °C.
The area has concentrated plateau biodiversity. Biodiversity protection needs to be strengthened because the loss of habitat is increasing due to the influence of human activity and climate change. As the area constitutes the upper reaches of the Yangtze and Yellow River Basins, water and soil retention functions are highly significant for maintaining water conservancy projects, agricultural irrigation, and other human production activities and subsistence [25].

2.2. Data Sources

Ecosystem classification data were obtained from a remote sensing survey of the environment conducted by the Chinese Academy of Sciences and Ministry of Ecology and Environment of the People’s Republic of China [26]. Biodiversity data were obtained from different sources. Plant distribution and biodiversity information was obtained from China Plants Database; spatial distribution data for mammals, amphibians, and reptiles were from IUCN and were supplemented with Colored Atlas of Chinese Amphibians and Their Distribution and China’s Mammal Diversity and Geographic Distribution. Bird spatial distribution data were from Bird Life International. Altitude and vegetation type were obtained from China Plants Database, IUCN Red List, Bird Life International, and recent research [27]. Altitude data were from 90 m digital elevation model obtained by NASA space shuttle radar in terrain surveying tasks; vegetation types were obtained from 90 m resolution ecosystem-type map of China in 2015. Other service functions, such as water retention, soil retention, and carbon sequestration were calculated from 5-year (2010–2015) evaluation project of national ecological environment [28].
Vegetation net primary productivity data were taken from the MOD17A3NPP product from 2000 to 2014, with a spatial resolution of 0.0083 °C, which was issued by big digit globe dynamic simulation research of Montana, U.S.A. (http://www.ntsg.umt.edu/project/mod17, accessed on 2 March 2022) at 100 m spatial resolution obtained by re-sampling with ArcGIS 10.3 software [29]. Meteorological data were from China’s surface climate dataset (including rainfall, temperature, and evaporation) from National Meteorological Information Center for 1984–2015 at 100 m spatial resolution generated by conducting spatial interpolation with ArcGIS 10.3 software [30]. Land use data were from www.dsac.cn, accessed on 10 March 2022. The vegetation coverage data are from http://www.chinageoss.org/, accessed on 12 March 2022. The elevation data are from http://www.gscloud.cn/, accessed on 15 March 2022, with the data resolution as 30 m [31]. Soil data were obtained from Harmonized World Soil Database v1.2, China’s soil dataset of global soil attribute database, and the 1∶1,000,000 soil data were provided by the Institute of Soil Science, Nanjing, as part of the 2nd national land survey [32].

2.3. Data Analysis

Ecosystem Service Function Calculations

As Qinghai is located in the plateau area of China, its special geographical climate environment makes its biodiversity protection, soil retention, water retention, and carbon sequestration function become key ecosystem service functions of the region [33]. As the main body area of carbon sequestration is in the west of China, biodiversity, soil retention, water retention, and carbon sequestration (Table 1) were selected as research objects [34].
An importance index was used to evaluate the biodiversity protection function of ecosystems. The index ranges from 0–100, and the higher the value, the higher the unit’s value in biodiversity protection [35].
For this study, we selected extremely endangered, endangered, and vulnerable species from the IUCN and China Species Red List as indicator species of the need for biodiversity protection in Qinghai. These endangered species not only reflect the value of biodiversity but also the threat that human activities and climate change pose. In total, 48 species were selected as important protection species, including 7 plants, 23 mammals, 16 birds, and 1 amphibian.
Important areas of protected species were delineated by summing the areas of potential habitats after weighting of each community. To describe the relative importance of different classification grades in IUCN, we assigned 3, 2, and 1, respectively, to extremely endangered grade, endangered grade, and vulnerable grade. Minimum and maximum normalization method was used to standardize the value to a range between 0 and 100, where 100 indicated the most important, and 0 indicated least important.
As a well-known model of species distribution, MaxEnt (maximum entropy) model is a species distribution model based on maximum entropy, which is able to predict habitat suitability of each point in the region by training species distribution point data and combining this with regional environmental data for the species [36]. MaxEnt model is widely used for predicting potentially suitable habitats of species; predictions exhibited high precision, high calculation efficiency, and easy application. The Species Distribution Model (SDM) tool pack is a tool plug-in based on ArcGIS, which is able to invoke and execute MaxEnt models with high efficiency. The species distribution point automatic screening, spatial autocorrelation analysis of environmental variables, and other functions in the tool pack improve the efficiency of MaxEnt models and generate graphic results automatically [37]. Its actual operation process includes data pre-treatment (processing species–distribution–point and environmental variables data into standard format), main element analysis of environmental variables, calculation of spatial heterogeneity of environmental variables, spatial screening of species distribution points, background selection of species distribution points, and MaxEnt model operations [38].
National class I and class II protected species of Qinghai and other species of important protection value, and bird distribution points of regionally important species were entered into the model as sample points. Due to the relatively centralized distribution of different birds, different kinds of birds are taken as one bird species for simulation to facilitate the actual operation of the model [39].
The great differences in environmental factors, such as altitude, temperature, and precipitation in different regions of Qinghai Province have a profound impact on birds’ choice of habitat. Therefore, we considered those environmental factors which have relatively large influence on bird habitat selection and selected the following: vegetation coverage, land utilization type, distance from water, distance from residence, distance from high-grade roads (roads above county level), and distance from low-grade roads (town and forest roads). The “Remove Highly Correlated Variables” tool in SDM tool pack was used to set the maximum allowed related coefficient at 0.8 and remove environment variables with high correlations (r > 0.8); the inspection result showed that 5 environmental variables met the requirements [40]. Bird distribution data and environmental variables were introduced; 75% of bird distribution data was randomly selected to establish the model, and 25% was used for model verification [41]. Model was run 10 times, and the average of 10 simulation results was taken as the final result. We then selected to establish the response curve for each environmental variable, evaluated the contribution rate of each environmental variable to the model, analyzed the importance of environmental factors using jack-knife inspection, and evaluated model precision using the lower area of ROC curve, i.e., AUC value. High AUC value indicated strong correlation between the environmental variable and the predicted species distribution.
The soil loss formula USLE0 was used to calculate the amount of soil erosion and soil retention, taking into account the influence of rainfall, soil type, terrain, and vegetation coverage [42]:
SC = R · K · LS · ( 1 C )
where SC is the soil retention amount (t hm−2 a−1), R is rainfall erosivity factor (MJ mm hm−2 h−1 a−1), K is soil erodibility factor (MJ mm hm−2 h−1 a−1), LS is terrain factor, and C is vegetation coverage factor.
The amount of water storage is closely related to rainfall, evapotranspiration, surface runoff, and vegetation coverage type. The amount of soil retention was calculated using the water balance equation [43]:
TQ = i = 1 j ( P i R i ET i ) · A i
where TQ is total water retention (m3), Pi is rainfall amount (mm), Ri is storm runoff amount (mm), ETi is evapotranspiration amount, Ai is the area of type I ecosystem, i is the ith ecosystem type in the study area, and j is the total number of ecosystem types in the research area.
Net ecosystem productivity (NEP), i.e., the difference between net primary productivity and soil respiration, was taken as the indictor of ecosystem carbon sequestration [44]:
NEP = NPP RS
where NEP is carbon sequestration amount (g C/m2/yr), NPP is net primary productivity of ecosystem, and RS is the amount of carbon release from soil respiration (g C/m2).
The spatial pattern of the importance of ecosystem service functions in Qinghai was determined using overlap analysis of biodiversity. The importance degree of ecosystem service functions in specific regions depends on the importance of each individual ecosystem service in that area.
Raster graphics of different types of ecosystem service function values were obtained from the model. In ArcGIS, raster calculator is adopted to enter formula “Int ([raster data of a certain function]/[the maximum value of a certain function raster data] × 100)” to obtain normalized raster graphics of ecosystem service function values. An attribute table of raster data was exported, recording the ecosystem service function value of a raster cell, the service function value was ranked from high to low, and the service function value was calculated and accumulated [45]. Subsequently, raster value was taken such that it corresponds to 50 and 80% of the accumulated service function values in total value of ecosystem service function as the demarcation point of ecosystem service function. The re-classification tool of Arc GIS software was used to classify the importance of ecosystem service functions into 4 classes [46]. The service function importance was assigned to extreme importance, importance, medium importance, and general importance for the top 50%, 50~75%, 75~90%, and 90~100% of service function amounts, making up the spatial distribution pattern of important areas of ecosystem service functions in the Qinghai region.

3. Results

3.1. Classification Characteristics of Ecosystem Patterns

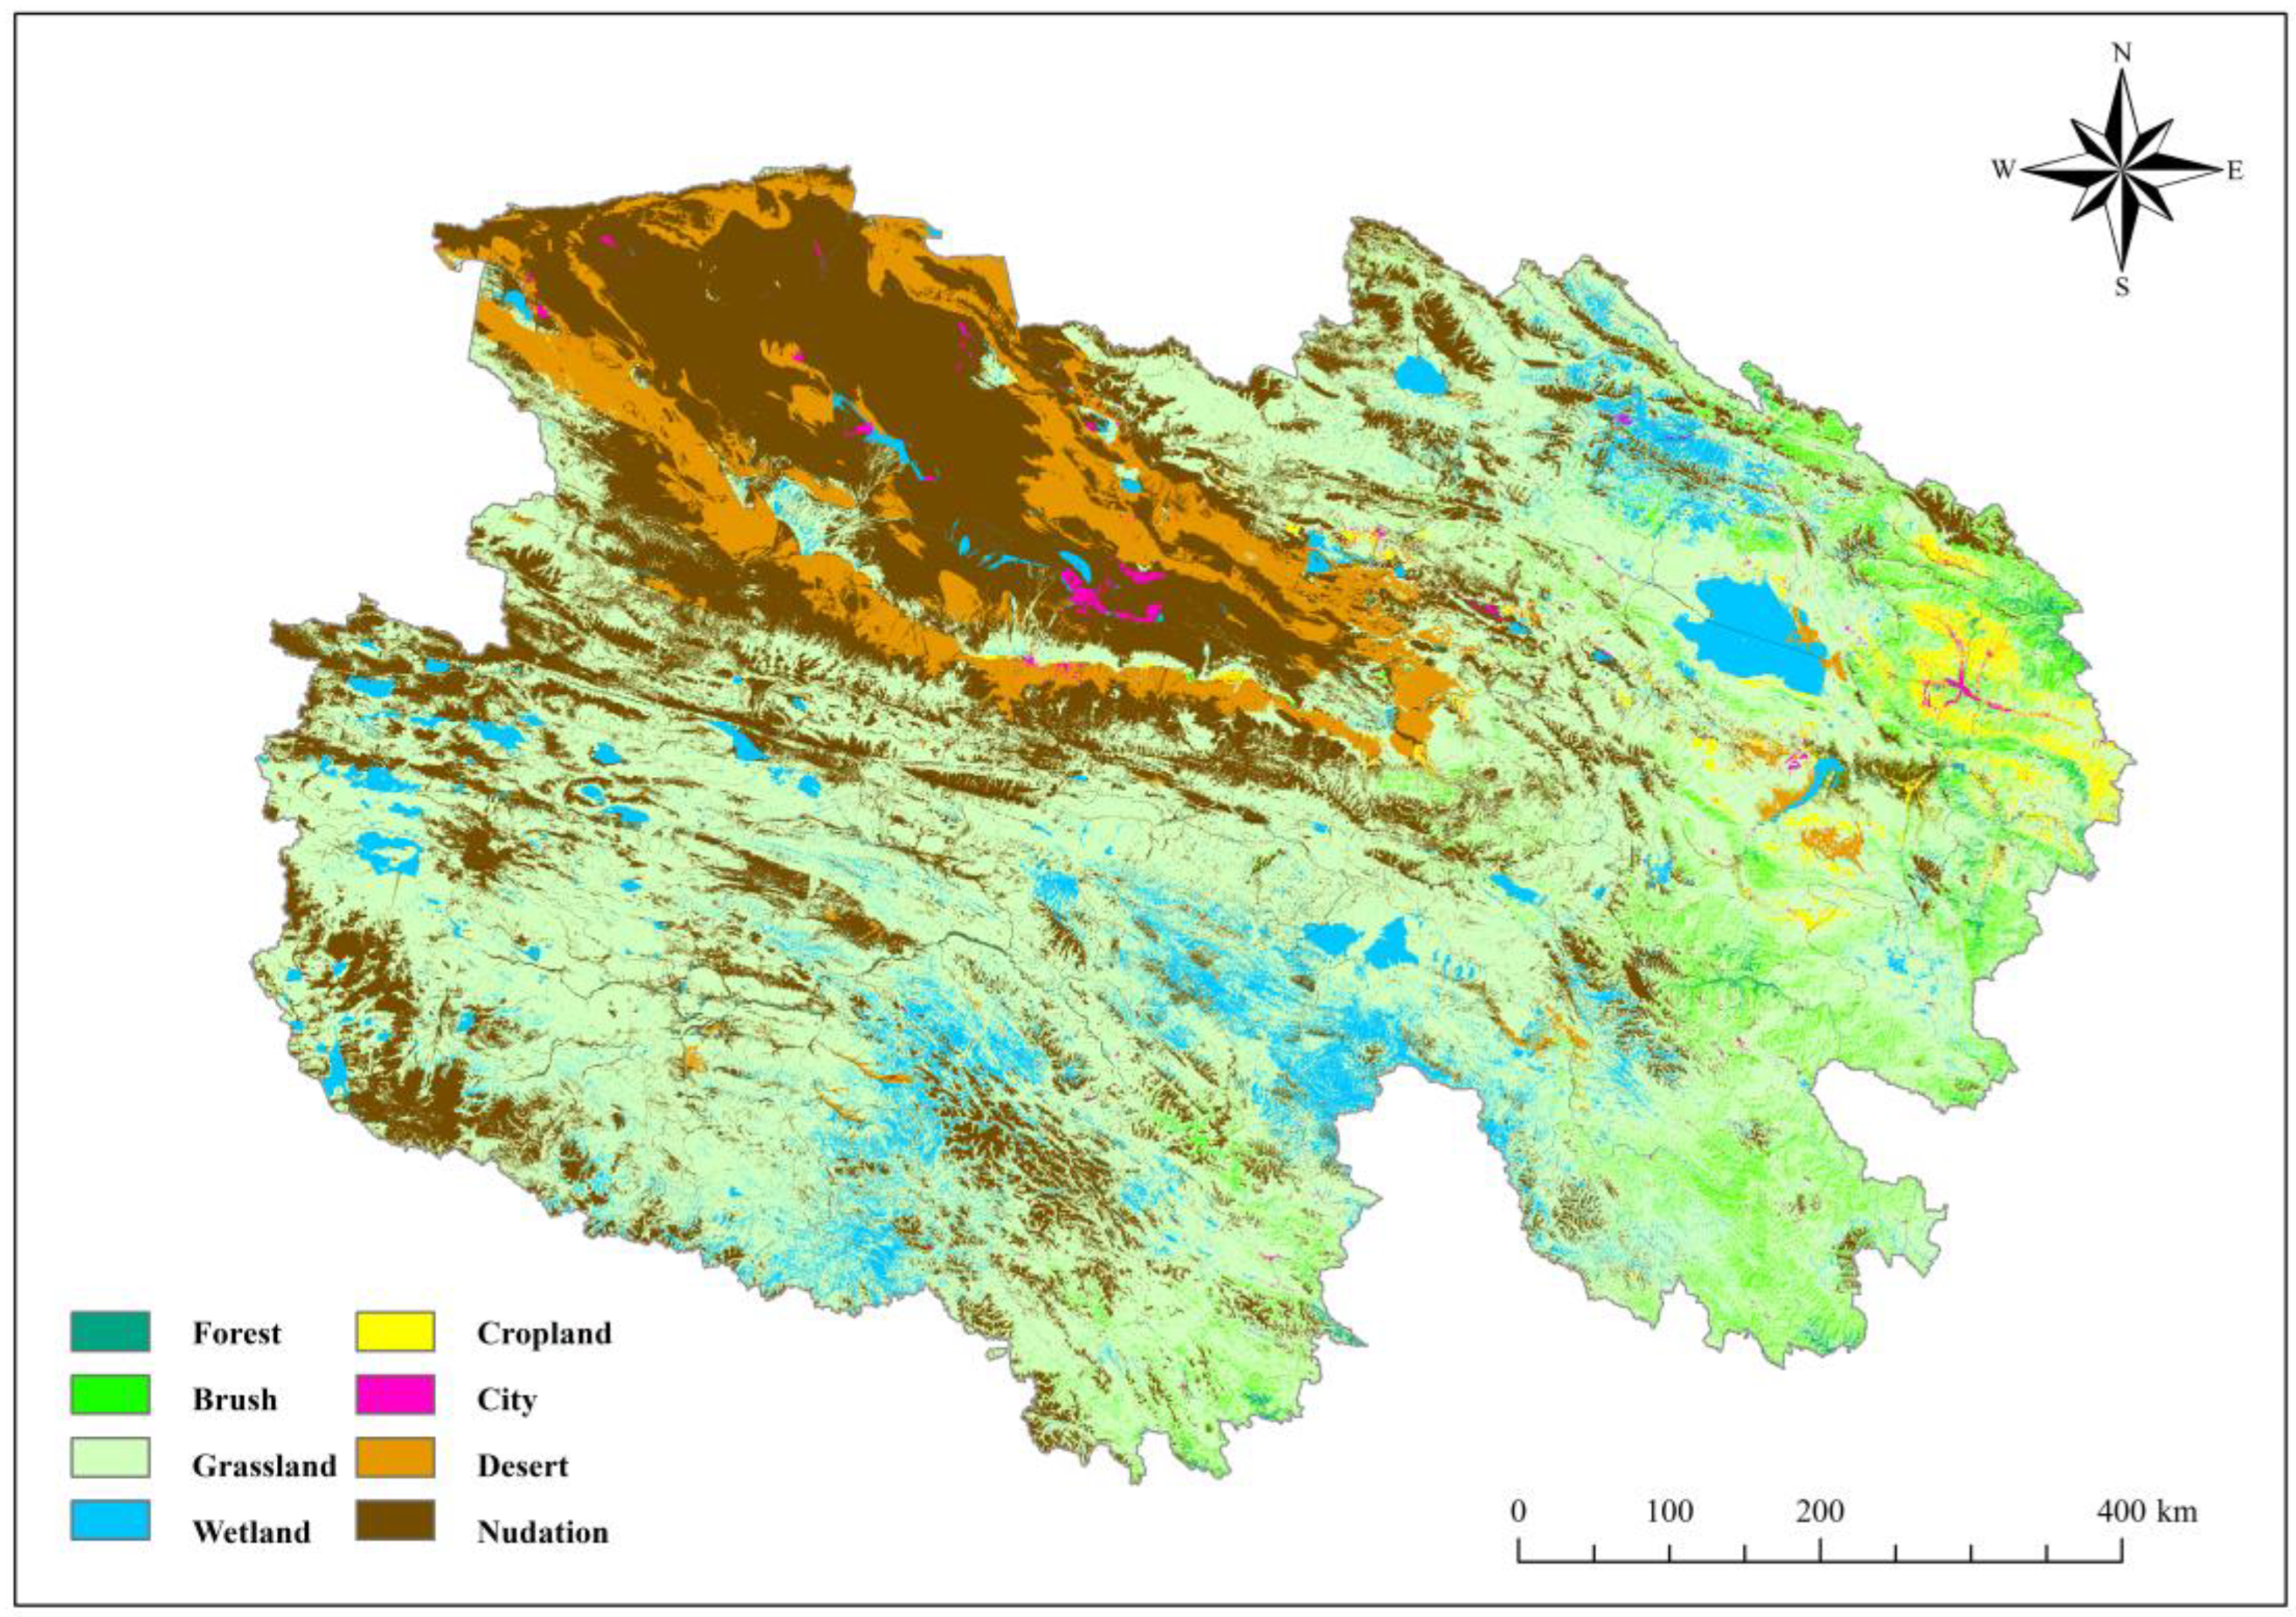
Grasslands, wetlands, deserts, and four other ecosystems accounted for 94.24% of the total area of Qinghai Province. In that, grasslands accounted for the largest area at 381,700 square kilometers and 54.8% of the total; other ecosystems, wetlands, and desert accounted for 27.01, 6.63, and 5.79%, respectively, of the total area, while town areas were relatively small at 0.44% of the total area (Figure 2).
The area of the forest ecosystem was 25,000 square kilometers and mainly distributed in Xining City, Haidong City, and the Huangnan Tibetan Autonomous Prefecture in the eastern part of Qinghai. The shrub ecosystem totaled 26,200 square kilometers and was mainly distributed in the eastern cities of Qinghai. The wetland ecosystem totaled 46,200 square kilometers and the desert ecosystem 40,400 square kilometers mainly in the Haixi Mongolian Autonomous Prefecture. Agricultural fields had a total area of 8300 square kilometers mainly in Xining City and Haidong City in the east. City and town ecosystems were mainly embedded in agricultural fields, grasslands, deserts, and other ecosystems, with an area of 3100 square kilometers. Glaciers and bare lands had an area of 188,200 square kilometers.

3.2. Evaluation of Ecosystem Service Functions

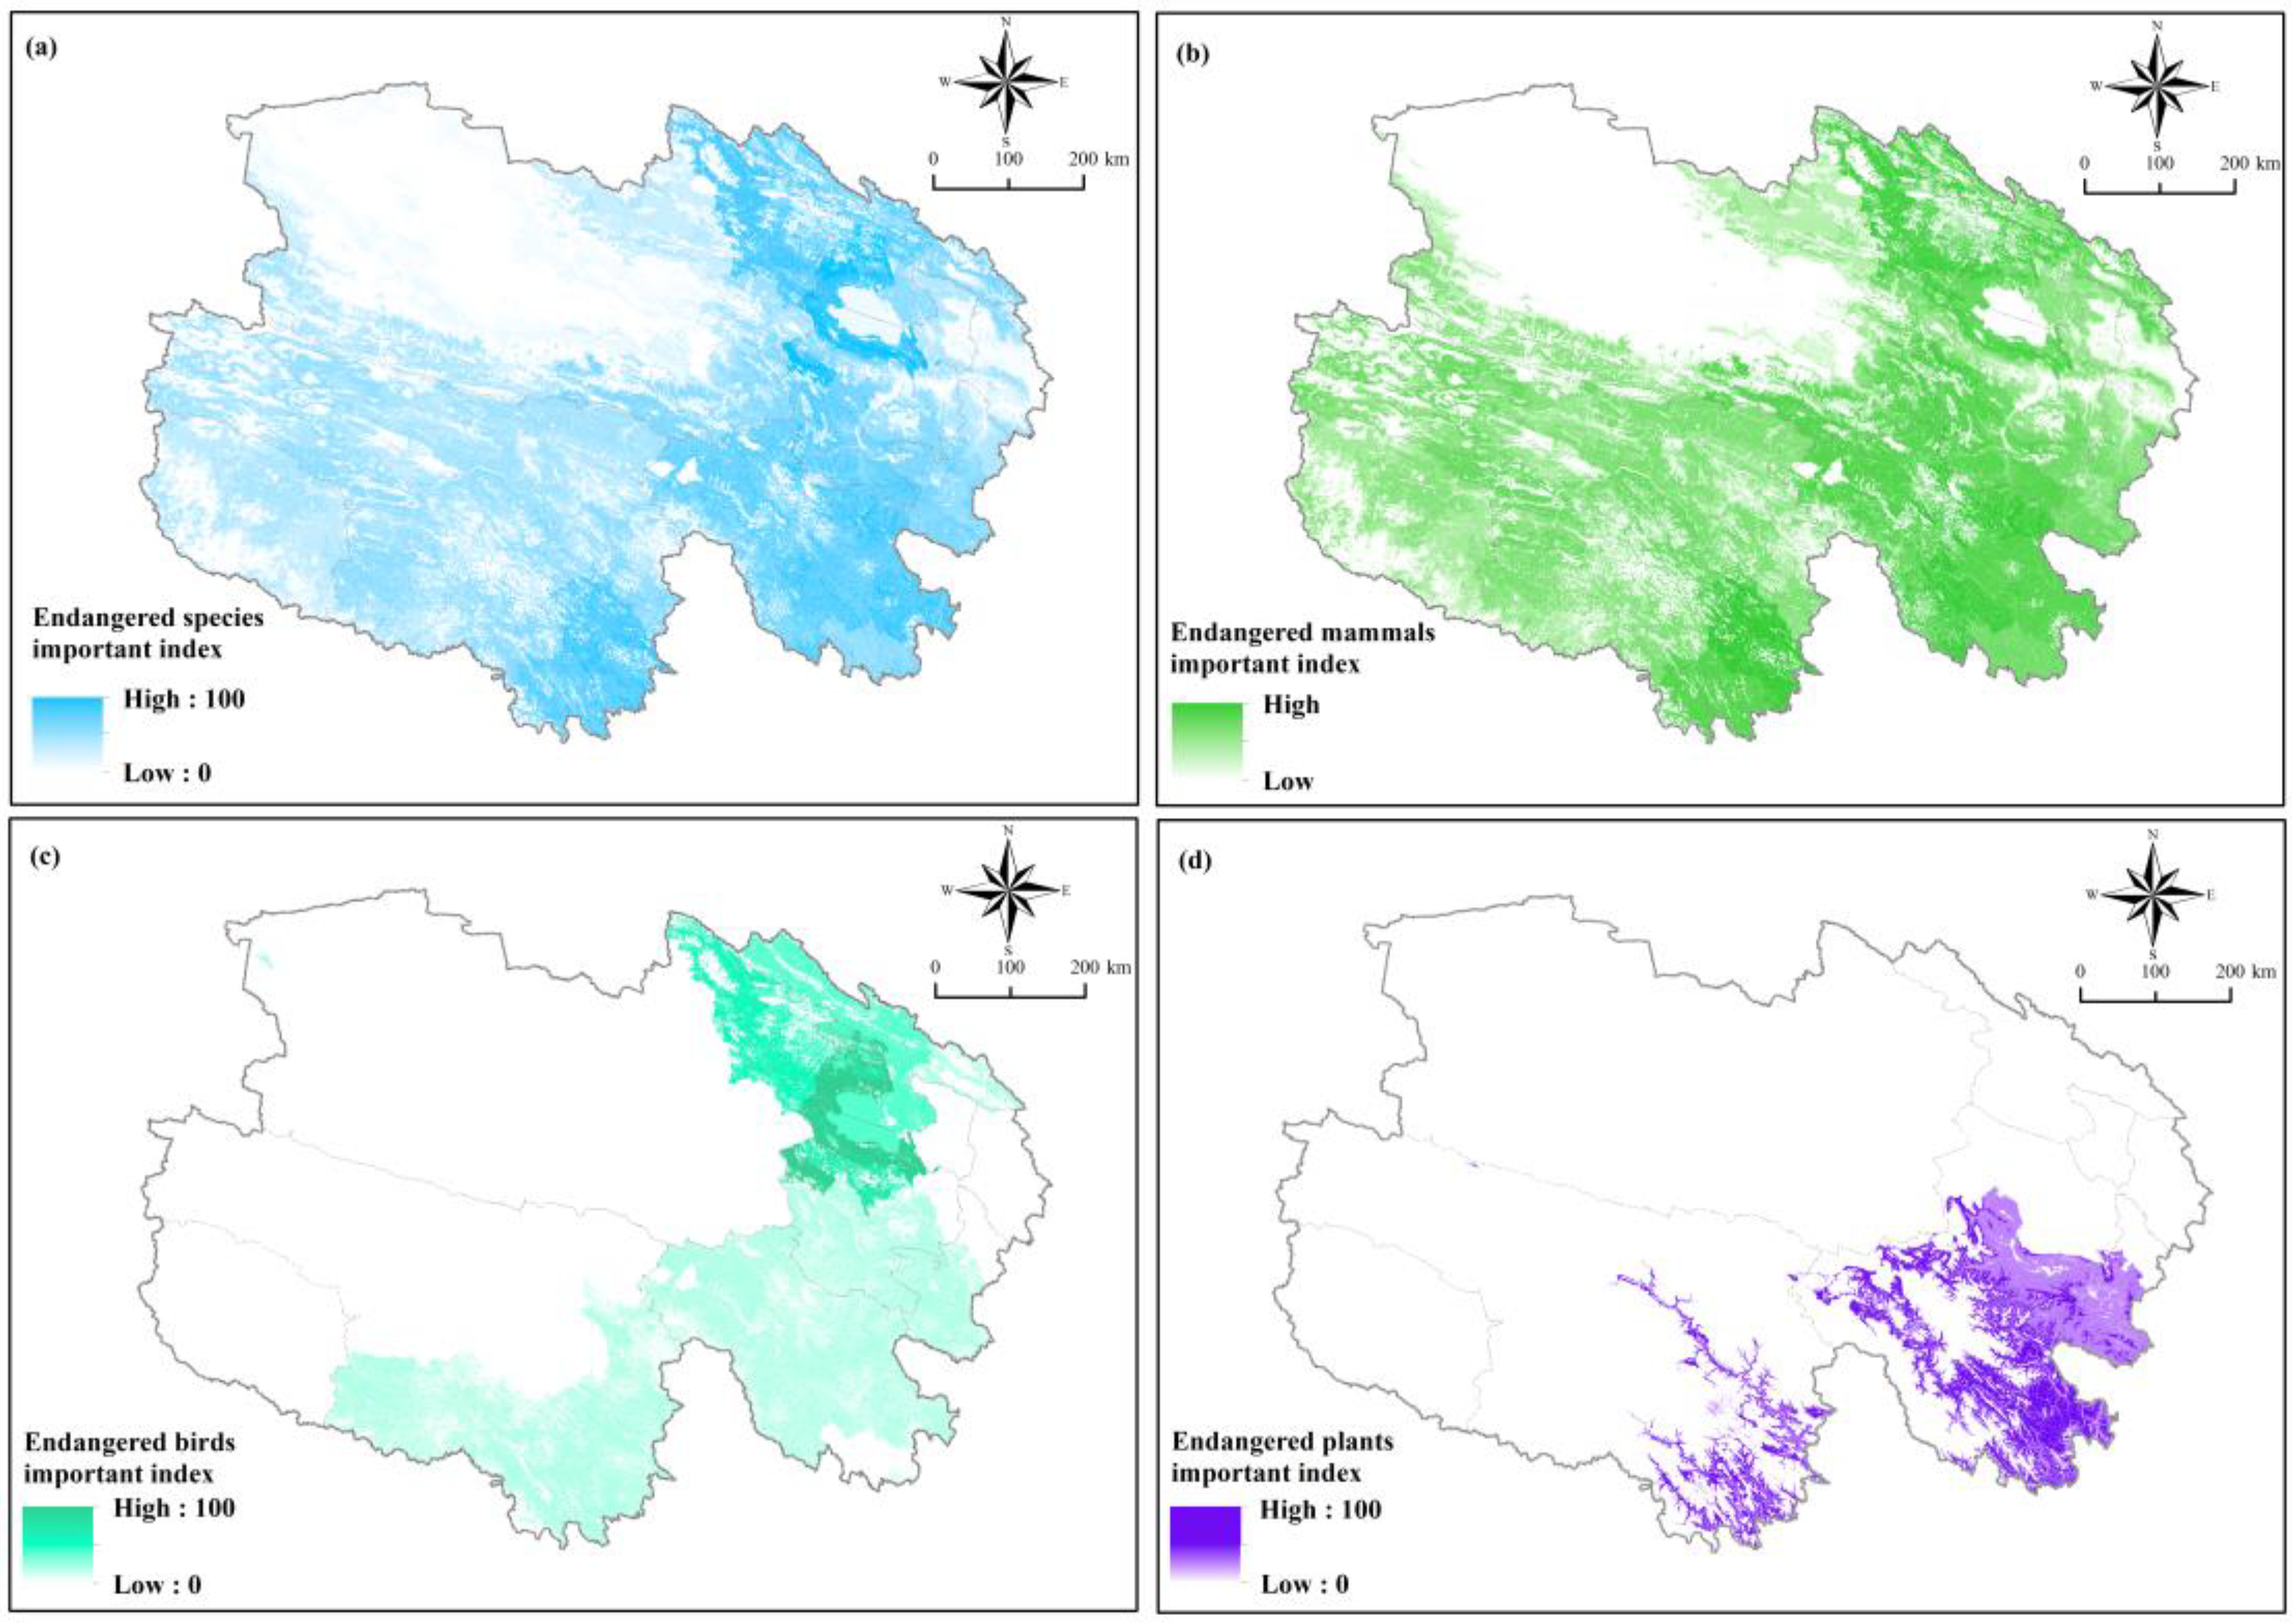
The important endangered species of Qinghai were mainly distributed in the eastern and southern parts, including the northeastern part of the Haixi Mongolian and Tibetan Autonomous Prefecture, Tibetan Autonomous Prefecture of Haibei, Tibetan Autonomous Prefecture of Hainan, Tibetan Autonomous Prefecture of Huangnan, most of the Tibetan Autonomous Prefecture of Golog, and the southeastern part of the Yushu Tibetan Autonomous Prefecture. Important endangered mammals exhibited a relatively large distribution area (Figure 3b), with relatively high species abundance in the eastern part of the Haixi Mongolian and Tibetan Autonomous Prefecture, Tibetan Autonomous Prefecture of Haibei, Tibetan Autonomous Prefecture of Hainan, Tibetan Autonomous Prefecture of Huangnan, most of the Tibetan Autonomous Prefecture of Golog, and the southeastern part of the Yushu Tibetan Autonomous Prefecture. The distribution area of endangered birds was smaller than that of mammals (Figure 3c), with relatively high numbers northeast of the Haixi Mongolian and Tibetan Autonomous Prefecture, Tibetan Autonomous Prefecture of Haibei, and northwest of the Tibetan Autonomous Prefecture of Hainan; the distribution of Qinghai’s endangered plants was relatively centralized (Figure 3d), mainly in the Tibetan Autonomous Prefecture of Hainan, Tibetan Autonomous Prefecture of Huangnan, parts of the Tibetan Autonomous Prefecture of Golog, parts of the Yushu Tibetan Autonomous Prefecture, and a relatively high concentration in the Tibetan Autonomous Prefecture of Golog.
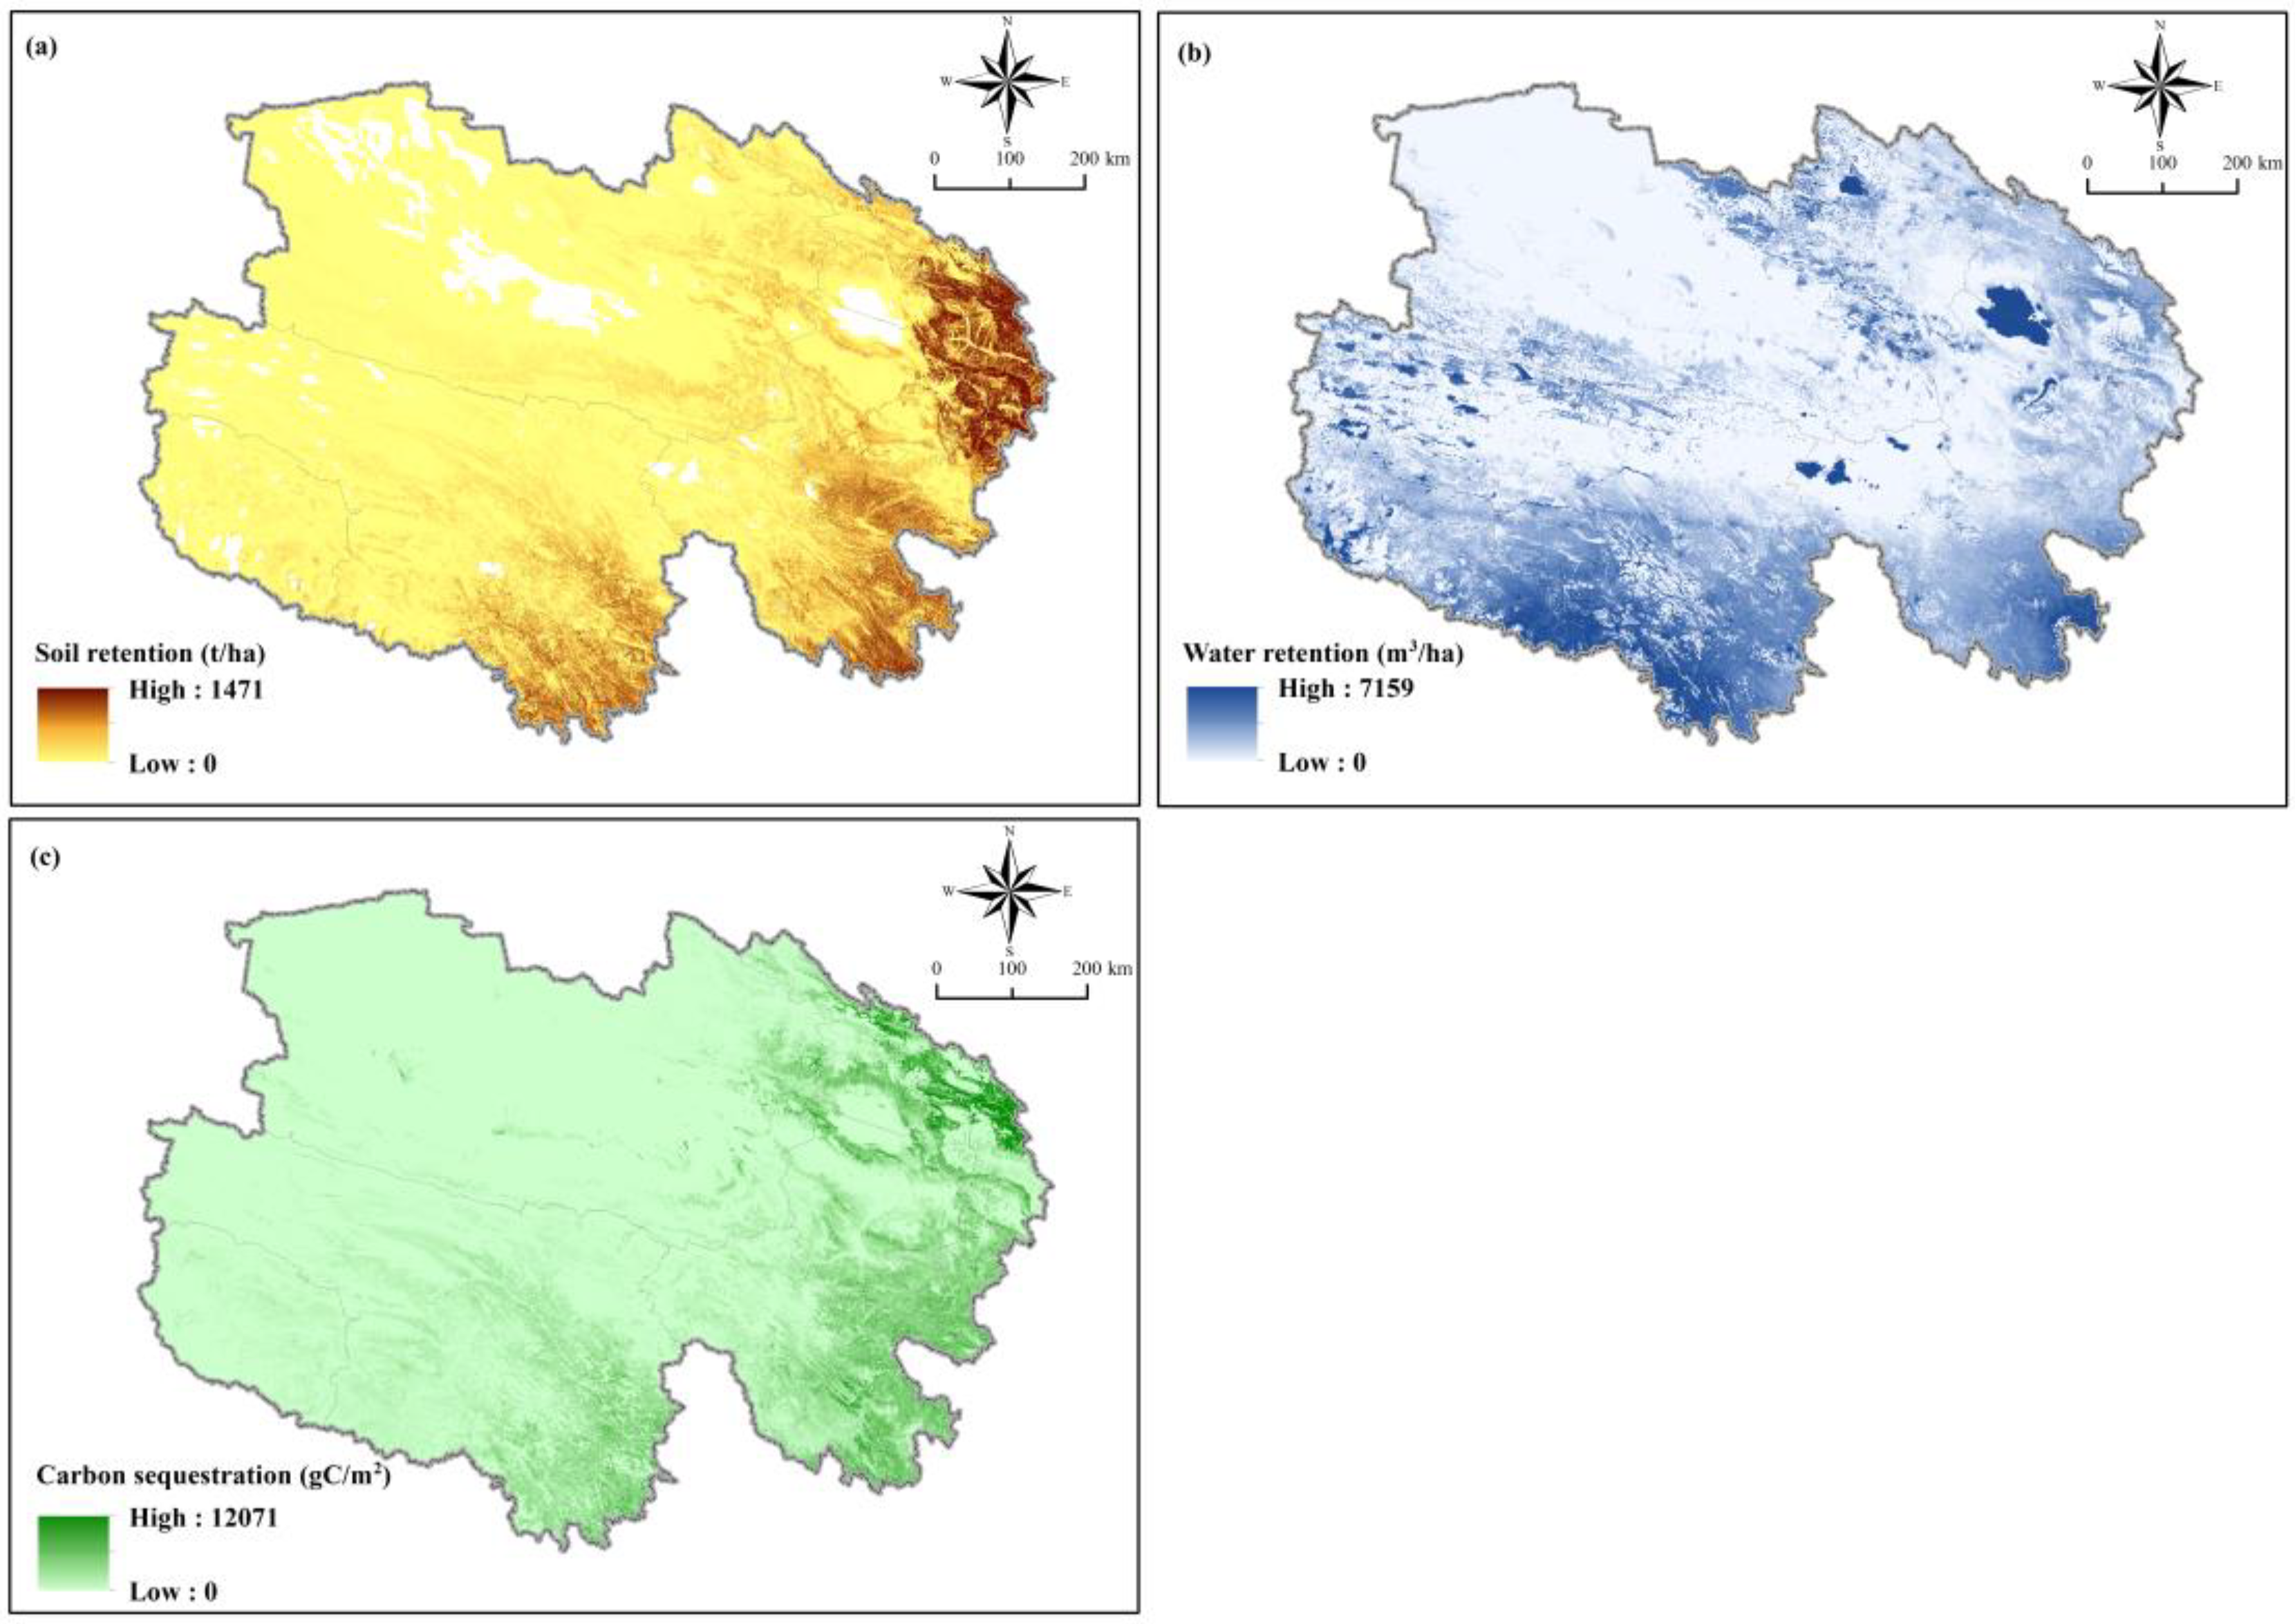
The total amount of soil retention in Qinghai was 2.245 billion tons, with soil retention a per unit area of 32.24 t hm−2 a−1. The total amount of water storage was 46.513 billion m3, with a per unit area storage of 66,800 m3/km2. Carbon sequestration totaled 60.91 Tg, with a per unit area of 87.44 g C m−2 a−1. Soil retention (Figure 4a) and carbon sequestration capacity (Figure 4c) had a similar distribution pattern, with high values in the east and low in the west, while water retention (Figure 4b) exhibited a high in the south and a low in the north.
Grasslands were the main ecosystem for soil retention, water retention, and carbon sequestration, providing 1.611 billion tons of soil retention, 33.62 billion m3 of water retention, and 37.79 Tg of carbon sequestration, and accounting for 71.76, 72.28, and 62.04% of the ecosystem. Soil retention and carbon sequestration amounts in the shrub ecosystem were lower than in grasslands and totaled 0.436 billion tons and 17.18 Tg, respectively. The water retention amount in the wetland ecosystem was lower than that in grassland and totaled 2.960 billion m3. The total amount of soil retention, water retention, and carbon sequestration in the desert and town ecosystems was relatively small (Table 2).
The forest ecosystem had the highest soil retention and carbon sequestration capacity, reaching 272.48 t hm−2 a−1 and 1912.08 g C m−2 a−1, respectively, while the wetland ecosystem had the strongest water retention capacity at 14,230 m3 km−2 a−1. We found that the desert had the weakest soil retention, water retention, and carbon sequestration capacity (Table 2).

3.3. Selection of Important Areas in Qinghai Province

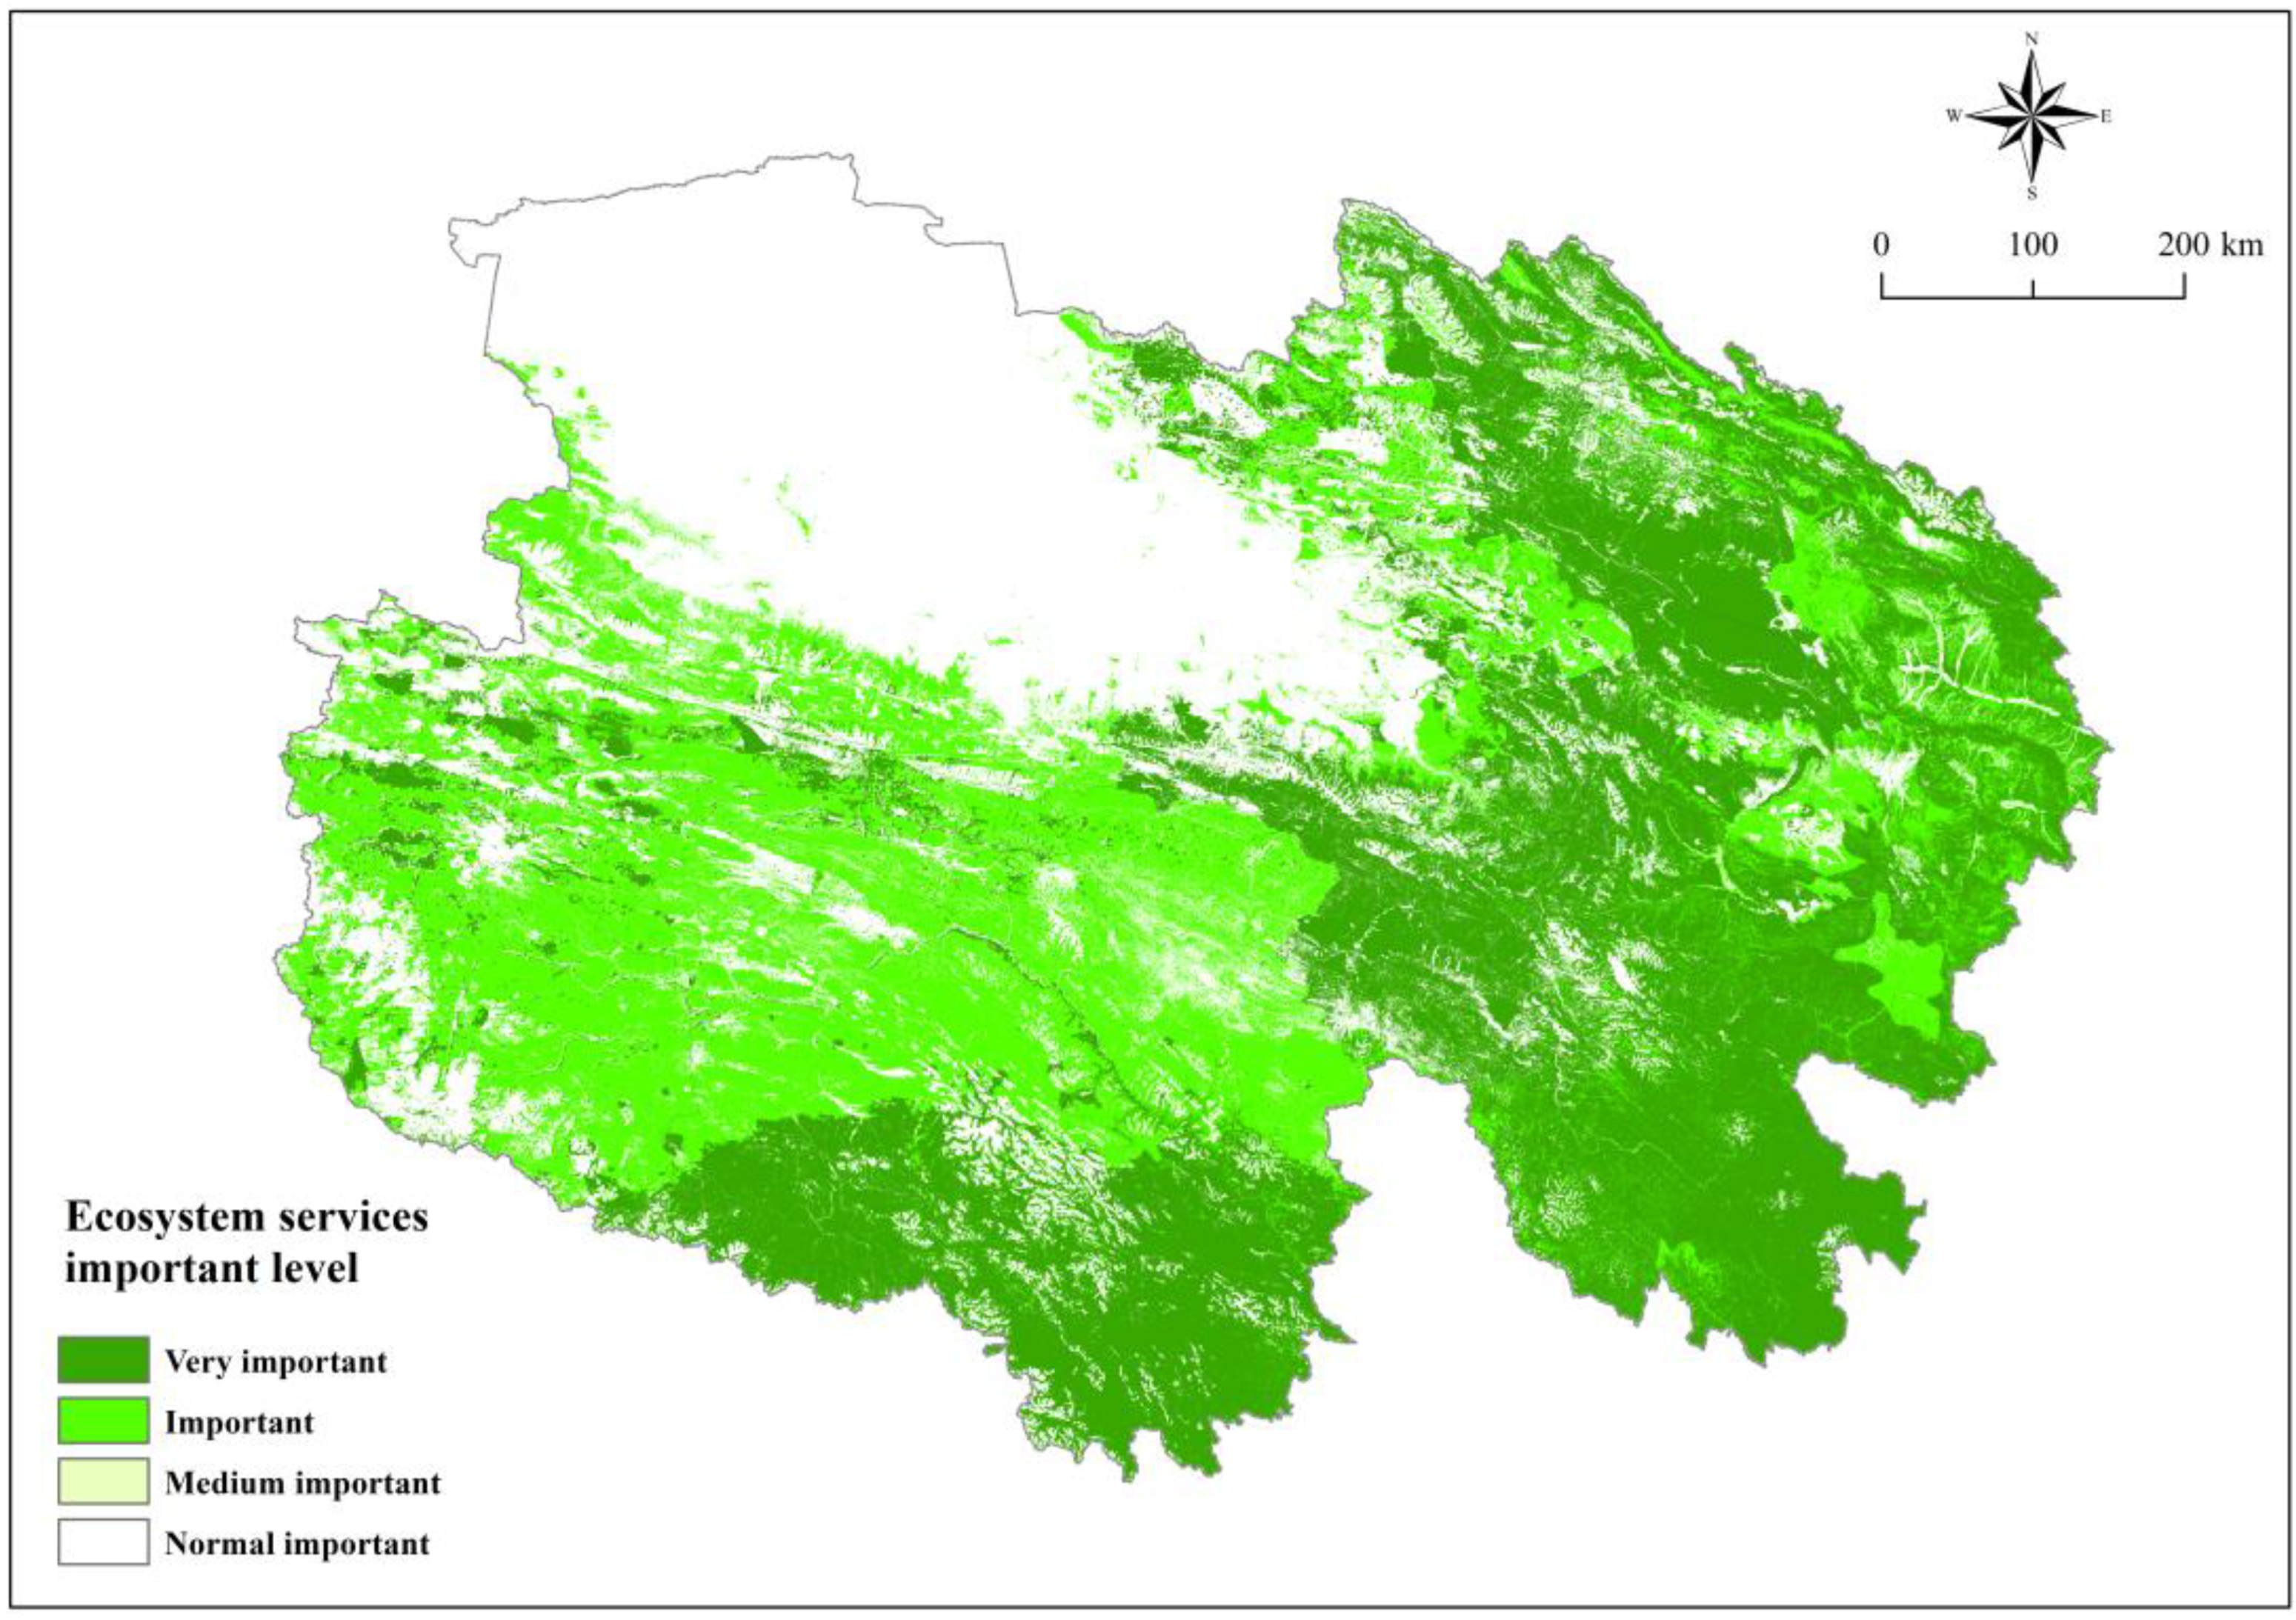
The importance of the ecosystem service in Qinghai was separated into extreme importance, importance, medium importance, and general importance levels, and their spatial distribution pattern is shown in Figure 5. We determined that 247,200 square kilometers of the area were extremely important for ecosystem service functions in Qinghai; biodiversity accounted for 35.49% of the total area of the Qinghai Province and was mainly distributed east of the Haixi Mongolian and Tibetan Autonomous Prefecture, Tibetan Autonomous Prefecture of Haibei, Tibetan Autonomous Prefecture of Hainan, Tibetan Autonomous Prefecture of Huangnan, Tibetan Autonomous Prefecture of Golog, and south of the Yushu Tibetan Autonomous Prefecture.
We also found that 124,500 square kilometers were important for ecosystem service functions, accounting for 17.87% of the total area of the province; these important areas were mainly distributed north of the Yushu Tibetan Autonomous Prefecture and southeast of the Haixi Mongolian and Tibetan Autonomous Prefecture (Figure 5). The extremely important and important areas of the ecosystem service functions totaled 371,700 square kilometers, accounting for 53.36% of the total area of the province; together, the areas provided 95.91% of the total provincial amount of soil retention, 90.25% of the total amount of water storage, 97.00% of the total carbon sequestration, and 76.70% of total biodiversity (Table 3).
Soil retention, water retention, and carbon sequestration services in the important protection areas delimited based on the ecology red line are higher than that of the whole Qinghai Province. Meanwhile, they also provide 48.86% of the habitat areas for endangered species (Figure 5). Therefore, important areas of ecology protection are of great significance for biodiversity protection, soil retention, water retention, carbon sequestration, and other ecological services.

4. Discussion

4.1. Biodiversity Protection

The link between biodiversity and ecosystem function indicates that when the number of species is lower than a threshold value, the extinction of any one species may have severe consequences for the ecosystem function [47]. The loss of any key species will cause a status change in an ecosystem. Our research clearly indicates that the important endangered birds in Qinghai are mainly distributed in the eastern and southern parts of the province. The distribution of important endangered plants is concentrated in Golog, Huangnan, and the Yushu area. Biodiversity is the manifestation of a complex relationship between living beings and their environment [48]. The alpine shrub and grasslands in the eastern part of Qinghai were formed by hardy mesophytic or xerophytic shrubs as the dominant species and grasslands as a dominant ecosystem type; this assemblage is important and typical vegetation in that area of Qinghai. The likely reason for this assemblage is the suitability of these areas for the growth of shrubs and the persistence of grasslands. The distribution of important endangered plants indicates the comprehensive function of community structure, environment, human activity, and other factors, and may be due to differences in what was included in the study; we included shrub and herbaceous species in this study [49].
The evaluation of the importance of the biodiversity maintenance function of ecosystems is a critical step in delimiting the ecology protection red line [50]. For this study, we adopted a distribution model which analyzes the importance of maintaining biodiversity in Qinghai. We found that the range of distribution of important endangered mammals was relatively wide, and it covered all areas of Qinghai except for the Haixi Prefecture [51]. The range of distribution of important endangered birds was smaller compared with mammals, and important endangered birds were mainly found in the south and northeast. Several studies showed that the coupling mechanism among ecosystem structures, processes, and services can be determined. Biodiversity is the basis of many important ecosystem services, and it promotes the stability, productivity, and nutrient supply of ecosystems [52].

4.2. Strengthen the Protection and Natural Recovery of Ecology Function Areas

Our data suggest that the areas with relatively high soil retention were distributed mainly in Haibei, Xining, Haidong, and Golog in the eastern part of Qinghai, while the areas with relatively low soil retention were mainly found in the western areas, such as the Haixi Prefecture, Yushu, and others. Soil retention increased from west to east, along with carbon sequestration [53]. These results agree with earlier research on the spatial distribution of the soil retention function in Qinghai. This increase from west to east is due to the highest soil retention capacity of grassland ecosystems also concentrated in the east; the desert ecosystem concentrated in the western part has the poorest soil retention capability among various ecosystems in the alpine region. Therefore, to protect the ecosystem in this region, an increase in vegetation cover based on local conditions may increase soil retention [52]. According to the structure–process–function relationships of ecosystems, soil retention function has a close relationship with the ecosystem type and vegetation cover [53]. In alpine areas, among different ecosystem types, grasslands have the strongest soil retention function, followed by shrubs and wetlands. In addition, the higher the vegetation cover, the stronger the soil retention function [12].
Water retention is one of the important service functions in Qinghai. In this study, we found that the southern and northern parts of the province had high water retention capacity, while the western part had low water retention capacity. This may be because multiple ecosystem services may co-vary; thus, biomass is closely related to water, and water is the main limiting factor in the formation of biomass [54]. Water has an amplifying effect on above-ground biomass, and water retention capacity ability improves the primary production capacity of plants [55]. An increase in vegetation cover improves precipitation interception, penetration, and water retention capacity in grasslands compared with bare land [56,57].
Our research results confirm earlier reports on water retention function in Qinghai. In general, with recovery and governance projects, the structure and function of grassland ecosystems can gradually improve, and the water retention function can also increase. Ecosystem recovery and ecosystem restoration projects should be combined, and the protection and ecosystem restoration, such as grassland, wetlands, and others should be strengthened to improve ecosystem service functions [58].

4.3. Strengthening of Red Line Monitoring and Evaluation

The major challenges confronting management strategies and policy planning are relieving poverty, developing the economy, and safeguarding ecosystem services [59]. Delimiting and implementation of red line management need to be conducted at a national level to enable sustainable development. The purpose of ecological red line management is to affirm ecological security and realize the coordinated protection of biodiversity and ecosystem services. The protection of biodiversity plays a critical role in ecosystem functions providing necessary services for humans. Biodiversity protection can be realized by managing and protecting ecosystems; conservationists and ecosystem managers should work together to ensure the recognition and realization of multiple objectives [60]. In cases where the priority area of biodiversity and ecosystem services coincide in space, protection can be carried out jointly for both. Our comprehensive evaluation of the spatial distribution of ecosystem service functions, such as water retention, soil retention, carbon sequestration, and biodiversity protection, showed that the red line area in Qinghai accounts for 53.36% of the total area of the province. In conclusion, the red line policy can promote the recovery of degraded ecosystems and habitats of wild species and is of great significance for the protection of biodiversity and the improvement of ecosystem services.

5. Conclusions

Our results show that more than half of the land area of Qinghai Province should be established into the ecological red line. The delimiting of the ecology protection red line will recognize important areas of ecosystem protection in Qinghai and safeguard ecological security in the province and neighboring areas. However, the important function of ecological services or biodiversity results in nonconformity between ecologically important areas in Qinghai and key biodiversity areas, increasing the difficulty with the delimitation of the red line. Researchers believe that this problem can be solved by separating areas based on the weight of the service function. The importance index of endangered species explained the importance of biodiversity in Qinghai, demonstrating that the best method to protect the environment is to consider biodiversity protection as a priority in this region.
The delimiting of the red line in Qinghai is critical for the protection of the water supply to the neighboring provinces. This, in turn, increases the protection of the soil retention function. The change in water retention influences water sources downstream of Qinghai, impacting the security of these areas. The results of this study indicate that red line delimitation should fully incorporate the importance of local biodiversity and ecosystem service functions. We present a strong argument for the use of the ecological red line to enhance biodiversity protection in Qinghai to avoid potential ecological risks.

Author Contributions

J.H., T.Z. and P.C. conceived and designed the research; J.X., J.C. and J.H. analyzed the data; J.H., J.C. and J.X. wrote the main manuscript; J.X., J.C. and T.Z. prepared the figures and tables. All authors reviewed the manuscript. J.H., T.Z. and P.C. conceived and designed the experiments, contributed reagents/materials/analysis tools, wrote the main manuscript, authored or reviewed drafts of the paper, and approved the final draft. All authors have read and agreed to the published version of the manuscript.

Funding

This study was supported by the Plateau Scientific Expedition and Research Program (STEP) (2019QZKK0402); the National Foundation of Natural Sciences of China (No: 42171045); the Natural Science Foundation of Sichuan (2022NSFSC1708); the Sichuan Science and Technology Program (2021YJ0338); the Fundamental Research Funds of China West Normal University (18Q051); the Natural Science Foundation of Tibet Autonomous Region in 2020 (XZ202001ZR0023G); the Construction of the Tibetan Ecological Civilization Research Centre ((2021) No. 60); and the study on Monitoring Technology of Ecological Protection Redline in Typical Regions of Tibet (No. 2019).

Institutional Review Board Statement

Ethical review and approval were waived for the research as the questionnaire survey did not involve ethical issues and was conducted in accordance with general ethical guidelines and legal requirements.

Informed Consent Statement

Informed consent was obtained from all subjects involved in the study.

Data Availability Statement

Data are available on request from the authors.

Acknowledgments

We would like to thank Becky Stewart for her help in writing this paper and the journal editors and anonymous reviewers for their comments on an earlier version of this manuscript.

Conflicts of Interest

The authors declare no conflict of interest.

References

  1. Abdulkarim, B.; Yacob, M.R.; Abdullah, A.M.; Radam, A. Farmers’ perceptions and attitudes toward forest watershed conservation of the North Selangor Peat Swamp Forest. J. Sustain. For. 2017, 36, 309–323. [Google Scholar] [CrossRef]
  2. Jiang, W.; Lü, Y.; Liu, Y.; Gao, W. Ecosystem service value of the Qinghai-Tibet Plateau significantly increased during 25 years. Ecosyst. Serv. 2020, 44, 101146. [Google Scholar] [CrossRef]
  3. Zhang, J.; Hull, V.; Huang, J.; Yang, W.; Zhou, S.; Xu, W.; Huang, Y.; Ouyang, Z.; Zhang, H.; Liu, J. Natural recovery and restoration in giant panda habitat after the Wenchuan earthquake. For. Ecol. Manag. 2014, 319, 1–9. [Google Scholar] [CrossRef]
  4. Miao, C.; Duan, Q.; Sun, Q.; Lei, X.; Li, H. Non-uniform changes in different categories of precipitation intensity across China and the associated large-scale circulations. Environ. Res. Lett. 2019, 14, 025004. [Google Scholar] [CrossRef]
  5. Walsh-Wilkinson, E.; Beaumont, C.; Drolet, M.; Roy, È.; Houillier, C.L.; Beaudoin, J.; Arsenault, M.; Couet, J. Effects of the loss of estrogen on the heart’s hypertrophic response to chronic left ventricle volume overload in rats. PeerJ 2019, 7, e7924. [Google Scholar] [CrossRef] [PubMed] [Green Version]
  6. Sun, Q.; Miao, C.; Hanel, M.; Borthwick, A.G.L.; Duan, Q.; Ji, D.; Li, H. Global heat stress on health, wildfires, and agricultural crops under different levels of climate warming. Environ. Int. 2019, 128, 125–136. [Google Scholar] [CrossRef]
  7. Gao, Y.; Zhou, F.; Ciais, P.; Miao, C.; Yang, T.; Jia, Y.; Zhou, X.; Klaus, B.; Yang, T.; Yu, G. Human activities aggravate nitrogen-deposition pollution to inland water over China. Natl. Sci. Rev. 2020, 7, 430–440. [Google Scholar] [CrossRef] [Green Version]
  8. Bai, Y.; Jiang, B.; Wang, M.; Li, H.; Alatalo, J.M.; Huang, S. New ecological redline policy (ERP) to secure ecosystem services in China. Land Use Policy 2016, 55, 348–351. [Google Scholar] [CrossRef] [Green Version]
  9. Yin, M.; Gao, X.; Tenuta, M.; Kuang, W.; Gui, D.; Zeng, F. Manure application increased denitrifying gene abundance in a drip-irrigated cotton field. PeerJ 2019, 7, e7894. [Google Scholar] [CrossRef] [PubMed]
  10. Birundu, A.O.; Suzuki, Y.; Gotou, J.; Matsumoto, M. Analysis of the role of forest, biomass policy legislation and other factors that may affect the future of Kenya’s forests: Use of Japanese forestry as a model. J. Sustain. For. 2017, 36, 90–105. [Google Scholar] [CrossRef]
  11. Dao, T.H.H.; Hölscher, D. Fujian cypress and two other threatened tree species in three conservation zones of a nature reserve in north-western Vietnam. For. Ecosyst. 2017, 4, 1–11. [Google Scholar] [CrossRef] [Green Version]
  12. Desnoues, E.; de Carvalho, J.F.; Zohner, C.M.; Crowther, T.W. The relative roles of local climate adaptation and phylogeny in determining leaf-out timing of temperate tree species. For. Ecosyst. 2017, 4, 1–7. [Google Scholar] [CrossRef] [Green Version]
  13. Cao, S.; Lu, C.; Yue, H. Optimal tree canopy cover during ecological restoration: A case study of possible ecological thresholds in Changting, China. BioScience 2017, 67, 221–232. [Google Scholar] [CrossRef] [Green Version]
  14. Cao, S.; Zhang, J. Political risks arising from the impacts of large-scale afforestation on water resources of the Tibetan Plateau. Gondwana Res. 2015, 28, 898–903. [Google Scholar] [CrossRef]
  15. Amiri, N.; Emadian, S.F.; Fallah, A.; Adeli, K.; Amirnejad, H. Estimation of conservation value of myrtle (Myrtus communis) using a contingent valuation method: A case study in a Dooreh forest area, Lorestan Province, Iran. For. Ecosyst. 2015, 2, 1–11. [Google Scholar] [CrossRef] [Green Version]
  16. Morris, J.L.; DeRose, R.J.; Brunelle, A.R. Long-term landscape changes in a subalpine spruce-fir forest in central Utah, USA. For. Ecosyst. 2015, 2, 1–12. [Google Scholar] [CrossRef] [Green Version]
  17. Shahzad, N.; Saeed, U.; Gilani, H.; Ahmad, S.R.; Ashraf, I.; Irteza, S.M. Evaluation of state and community/private forests in Punjab, Pakistan using geospatial data and related techniques. For. Ecosyst. 2015, 2, 1–13. [Google Scholar] [CrossRef] [Green Version]
  18. Xu, X.; Chen, H.; Levy, J.K. Spatiotemporal vegetation cover variations in the Qinghai-Tibet Plateau under global climate change. Chin. Sci. Bull. 2008, 53, 915–922. [Google Scholar] [CrossRef] [Green Version]
  19. Zhang, J.; Hull, V.; Ouyang, Z.; He, L.; Connor, T.; Yang, H.; Huang, J.; Zhou, S.; Zhang, Z.; Zhou, C.; et al. Modeling activity patterns of wildlife using time-series analysis. Ecol. Evol. 2017, 7, 2575–2584. [Google Scholar] [CrossRef]
  20. Miao, C.; Su, L.; Sun, Q.; Duan, Q. A nonstationary bias-correction technique to remove bias in GCM simulations. J. Geophys. Res. Atmos. 2016, 121, 5718–5735. [Google Scholar] [CrossRef]
  21. Fan, Z.; Bai, R.; Yue, T. Spatio-temporal distribution of vascular plant species abundance on Qinghai-Tibet Plateau. J. Geogr. Sci. 2019, 29, 1625–1636. [Google Scholar] [CrossRef]
  22. Xin, H. A green fervor sweeps the Qinghai-Tibetan Plateau. AAS 2008, 321, 633–635. [Google Scholar] [CrossRef]
  23. Li, G.; Jiang, C.; Cheng, T.; Bai, J. Grazing alters the phenology of alpine steppe by changing the surface physical environment on the northeast Qinghai-Tibet Plateau, China. J. Environ. Manag. 2019, 248, 109257. [Google Scholar] [CrossRef] [PubMed]
  24. Yu, C.; Zhang, J.; Pang, X.; Wang, Q.; Zhou, Y.; Guo, Z. Soil disturbance and disturbance intensity: Response of soil nutrient concentrations of alpine meadow to plateau pika bioturbation in the Qinghai-Tibetan Plateau, China. Geoderma 2017, 307, 98–106. [Google Scholar] [CrossRef]
  25. Pan, X.; Yu, Q.; You, Y.; Chun, K.P.; Shi, X.; Li, Y. Contribution of supra-permafrost discharge to thermokarst lake water balances on the northeastern Qinghai-Tibet Plateau. J. Hydrol. 2017, 555, 621–630. [Google Scholar] [CrossRef] [Green Version]
  26. Yu, W.; Zhou, W. Spatial pattern of urban change in two Chinese megaregions: Contrasting responses to national policy and economic mode. Sci. Total Environ. 2018, 634, 1362–1371. [Google Scholar] [CrossRef]
  27. Ni, Z.; Jones, R.; Zhang, E.; Chang, J.; Shulmeister, J.; Sun, W.; Wang, Y.; Ning, D. Contrasting effects of winter and summer climate on Holocene montane vegetation belts evolution in southeastern Qinghai-Tibetan Plateau, China. Palaeogeogr. Palaeocl. 2019, 533, 109232. [Google Scholar] [CrossRef]
  28. Irawanti, S.; Race, D.; Stewart, H.; Parlinah, N.; Suka, A.P. Understanding the timber value chain in community-based forestry in Indonesia: Analysis of sengon in central Java. J. Sustain. For. 2017, 36, 847–862. [Google Scholar] [CrossRef]
  29. Wang, W.; Wu, T.; Chen, Y.; Li, R.; Xie, C.; Qiao, Y.; Zhu, X.; Hao, J.; Ni, J. Spatial variations and controlling factors of ground ice isotopes in permafrost areas of the central Qinghai-Tibet Plateau. Sci. Total Environ. 2019, 688, 542–554. [Google Scholar] [CrossRef]
  30. Miao, C.; Kong, D.; Wu, J.; Duan, Q. Functional degradation of the water–sediment regulation scheme in the lower Yellow River: Spatial and temporal analyses. Sci. Total Environ. 2016, 551, 16–22. [Google Scholar] [CrossRef]
  31. Yang, Y.; Jia, X.; Wendroth, O.; Liu, B.; Shi, Y.; Huang, T.; Bai, X. Noise-assisted multivariate empirical mode decomposition of saturated hydraulic conductivity along a south-north transect across the Loess Plateau of China. Soil. Sci. Soc. Am. J. 2019, 83, 311–323. [Google Scholar] [CrossRef]
  32. Ge, J.; Meng, B.; Liang, T.; Feng, Q.; Gao, J.; Yang, S.; Huang, X.; Xie, H. Modeling alpine grassland cover based on MODIS data and support vector machine regression in the headwater region of the Huanghe River, China. Remote. Sens. Environ. 2018, 218, 162–173. [Google Scholar] [CrossRef]
  33. Liu, S.; Zhang, Y.; Cheng, F.; Hou, X.; Zhao, S. Response of grassland degradation to drought at different time-scales in Qinghai Province: Spatio-temporal characteristics, correlation, and implications. Remote. Sens. 2017, 9, 1329. [Google Scholar] [CrossRef] [Green Version]
  34. Kangas, A.; Korhonen, K.T.; Packalen, T.; Vauhkonen, J. Sources and types of uncertainties in the information on forest-related ecosystem services. For. Ecol. Manag. 2018, 427, 7–16. [Google Scholar] [CrossRef]
  35. Peng, C.; Ouyang, H.; Gao, Q.; Jiang, Y.; Zhang, F.; Li, J.; Yu, Q. Building a “green” railway in China. Science 2007, 316, 546–547. [Google Scholar] [CrossRef]
  36. Ran, Q.; Wang, F.; Li, P.; Ye, S.; Tang, H.; Gao, J. Effect of rainfall moving direction on surface flow and soil erosion processes on slopes with sealing. J. Hydrol. 2018, 567, 478–488. [Google Scholar] [CrossRef]
  37. Wang, Y.; Ran, L.; Fang, N.; Shi, Z. Aggregate stability and associated organic carbon and nitrogen as affected by soil erosion and vegetation rehabilitation on the Loess Plateau. Catena 2018, 167, 257–265. [Google Scholar] [CrossRef]
  38. Mhaske, S.N.; Pathak, K.; Basak, A. A comprehensive design of rainfall simulator for the assessment of soil erosion in the laboratory. Catena 2019, 172, 408–420. [Google Scholar] [CrossRef]
  39. Xiao, H.; Li, Z.; Chang, X.; Huang, J.; Nie, X.; Liu, C.; Liu, L.; Wang, D.; Dong, Y.; Jiang, J. Soil erosion-related dynamics of soil bacterial communities and microbial respiration. Appl. Soil. Ecol. 2017, 119, 205–213. [Google Scholar] [CrossRef]
  40. Wu, Y.; Ouyang, W.; Hao, Z.; Lin, C.; Liu, H.; Wang, Y. Assessment of soil erosion characteristics in response to temperature and precipitation in a freeze-thaw watershed. Geoderma 2018, 328, 56–65. [Google Scholar] [CrossRef]
  41. Rubio-Delgado, J.; Schnabel, S.; Gómez-Gutiérrez, Á.; Sánchez-Fernández, M. Estimation of soil erosion rates in dehesas using the inflection point of holm oaks. Catena 2018, 166, 56–67. [Google Scholar] [CrossRef]
  42. Sun, D.; Zhang, W.; Lin, Y.; Liu, Z.; Shen, W.; Zhou, L.; Rao, X.; Liu, S.; Cai, X.; He, D.; et al. Soil erosion and water retention varies with plantation type and age. For. Ecol. Manag. 2018, 422, 1–10. [Google Scholar] [CrossRef]
  43. Kong, D.; Miao, C.; Borthwick, A.G.L.; Duan, Q.; Liu, H.; Sun, Q.; Ye, A.; Di, Z.; Gong, W. Evolution of the Yellow River Delta and its relationship with runoff and sediment load from 1983 to 2011. J. Hydrol. 2015, 520, 157–167. [Google Scholar] [CrossRef] [Green Version]
  44. Xiao, H.; Li, Z.; Chang, X.; Huang, B.; Nie, X.; Liu, C.; Liu, L.; Wang, D.; Jiang, J. The mineralization and sequestration of organic carbon in relation to agricultural soil erosion. Geoderma 2018, 329, 73–81. [Google Scholar] [CrossRef]
  45. Bryant, B.P.; Borsuk, M.E.; Hamel, P.; Oleson, K.L.L.; Schulp, C.J.E.; Willcock, S. Transparent and feasible uncertainty assessment adds value to applied ecosystem services modeling. Ecosyst. Serv. 2018, 33, 103–109. [Google Scholar] [CrossRef]
  46. Bouwma, I.; Schleyer, C.; Primmer, E.; Winkler, K.J.; Berry, P.; Young, J.; Carmen, E.; Špulerová, J.; Bezák, P.; Preda, E.; et al. Adoption of the ecosystem services concept in EU policies. Ecosyst. Serv. 2018, 29, 213–222. [Google Scholar] [CrossRef]
  47. Cao, S.; Chen, L.; Xu, C.; Liu, Z. Impact of three soil types on afforestation in China’s Loess Plateau: Growth and survival of six tree species and their effects on soil properties. Landsc. Urban Plan 2007, 83, 208–217. [Google Scholar] [CrossRef]
  48. Yang, H.; Xiao, H.; Guo, C.; Sun, Y. Spatial-temporal analysis of precipitation variability in Qinghai Province, China. Atmos. Res. 2019, 228, 242–260. [Google Scholar] [CrossRef]
  49. Cao, S.; Liu, Y.; Su, W.; Zheng, X.; Yu, Z. The net ecosystem services value in mainland China. Sci. China Earth Sci. 2018, 61, 595–603. [Google Scholar] [CrossRef]
  50. Kinzig, A.P.; Perrings, C.; Chapin, F.S., III; Polasky, S.; Smith, V.K.; Tilman, D.; Turner, B.L. Response-ecosystem services: Free lunch no more. Science 2012, 335, 656–657. [Google Scholar] [CrossRef]
  51. Zhao, M.; Peng, J.; Liu, Y.; Li, T.; Wang, Y. Mapping watershed-level ecosystem service bundles in the Pearl River Delta, China. Ecol. Econ. 2018, 152, 106–117. [Google Scholar] [CrossRef]
  52. Gao, Y.; Jia, Y.; Yu, G.; He, N.; Zhang, L.; Zhu, B.; Wang, Y. Anthropogenic reactive nitrogen deposition and associated nutrient limitation effect on gross primary productivity in inland water of China. J. Clean. Prod. 2019, 208, 530–540. [Google Scholar] [CrossRef]
  53. Xiao, Y.; Xiao, Q.; Zhang, J. Balancing the international benefits and risks associated with implementation of ecological policy on the Qinghai-Tibet Plateau, China. Gondwana Res. 2023, 115, 183–190. [Google Scholar] [CrossRef]
  54. Carpenter, S.R.; DeFries, R.; Dietz, T.; Mooney, H.A.; Polasky, S.; Reid, W.V.; Scholes, R.J. Millennium ecosystem assessment: Research needs. Science 2006, 314, 257–258. [Google Scholar] [CrossRef]
  55. Irvine, K.N.; Herrett, S. Does ecosystem quality matter for cultural ecosystem services? J. Nat. Conserv. 2018, 46, 1–5. [Google Scholar] [CrossRef]
  56. Zheng, X.; Zhang, J.; Cao, S. Net value of grassland ecosystem services in mainland China. Land Use Policy 2018, 79, 94–101. [Google Scholar] [CrossRef]
  57. Xiao, Y.; Xiao, Q. The ecological consequences of the large quantities of trees planted in Northwest China by the Government of China. Environ. Sci. Pollut. Res. Int. 2019, 26, 33043–33053. [Google Scholar] [CrossRef]
  58. Rau, A.; von Wehrden, H.; Abson, D.J. Temporal dynamics of ecosystem services. Ecol. Econ. 2018, 151, 122–130. [Google Scholar] [CrossRef]
  59. Gou, J.; Miao, C.; Samaniego, L.; Xiao, M.; Wu, J.; Guo, X. CNRD v1.0: A high-quality natural runoff dataset for hydrological and climate studies in China. Bull. Am. Meteorol. Soc. 2021, 102, E929–E947. [Google Scholar] [CrossRef]
  60. Manuri, S.; Brack, C.; Noor’an, F.; Rusolono, T.; Anggraini, S.M.; Dotzauer, H.; Kumara, I. Improved allometric equations for tree aboveground biomass estimation in tropical dipterocarp forests of Kalimantan, Indonesia. For. Ecosyst. 2016, 3, 1–10. [Google Scholar] [CrossRef] [Green Version]
Figure 1. Study area (Qinghai Province, red) and its elevation map. (a) Elevation gradient distribution in Qinghai Province; (b) land cover type.
Sustainability 15 05524 g001
Figure 2. Spatial distribution map of ecosystem types in Qinghai Province.
Sustainability 15 05524 g002
Figure 3. Biodiversity importance index of Qinghai Province. (a) Endangered species important index (b) Endangered mammals important index (c) Endangered birds important index (d) Endangered plants important index.
Sustainability 15 05524 g003
Figure 4. Spatial distribution of soil retention (a), water retention (b), and carbon sequestration capacity (c) in Qinghai Province.
Sustainability 15 05524 g004
Figure 5. Spatial distribution of ecosystem service importance levels in Qinghai Province.
Sustainability 15 05524 g005
Table 1. Ecosystem evaluation system for Qinghai Province.
Research ContentsResearch ContentsIndicatorIndicator Description
Ecosystem service functionBiodiversity protectionSpecies abundance and importance indexThe number of species in coenosis is defined as species abundance; the importance index ranges from 0 to 100; the higher the index, the larger the biodiversity value.
Soil retentionSoil retention amountThe difference between amounts of potential and actual soil erosion.
Water retentionAdjusted water amountControl of water flow; water circulation is realized by intercepting, penetrating, and saving rainfall and evapotranspiration.
Carbon sequestrationCarbon sequestration
amount
The difference between net primary productivity of ecosystem and soil respiration.
Table 2. Soil retention, water retention, and carbon sequestration of each ecosystem type in Qinghai Province.
Ecosystem TypeAreaSoil Retention AmountWater RetentionCarbon Sequestration
10,000 km2Ratio
%
Unit Amount/
t hm−2 a−1
Total Amount/0.1 Billion ton Ratio
%
m3 km−2 a−1
Unit Amount/10,000 m3 km−2 a−1
Total Amount/0.1 Billion m3 Ratio
%
Unit Amount/
g C m−2 a−1
Total Amount
Tg
Ratio
%
Forest0.250.36272.480.683.0310.452.620.561912.084.807.88
Shrub2.623.76166.204.3619.4211.2829.606.36654.3917.1828.21
Grassland38.1754.7942.3216.1171.768.81336.2072.2899.0137.7962.04
Wetland4.626.6311.080.381.6914.2365.7414.138.440.390.64
Desert4.045.800.240.010.040.210.860.180.070.000.00
Agriculture field0.831.1964.270.532.361.681.400.3039.980.330.54
Town0.310.4512.880.030.132.360.730.1618.950.060.10
Others (glacier, bare land)18.8227.022.090.351.561.4927.986.021.920.360.59
Total69.6610032.2422.451006.68465.1310087.4460.91100
Table 3. Importance levels of ecosystem services in Qinghai Province.
Importance LevelAreaSoil RetentionWater RetentionCarbon SequestrationBiodiversity
km2
10,000 km2
%0.1 Billion tons%0.1 Billion m3%0.1 Billion tons%10,000 km2%
Extremely important24.7235.4918.6783.09324.4469.7551.8885.1723.5151.49
Important12.4517.872.8812.8295.3120.497.2011.8211.5125.21
Medium important7.8311.230.703.1235.827.701.442.366.9815.29
General24.6635.400.220.989.552.050.390.643.668.02
Disclaimer/Publisher’s Note: The statements, opinions and data contained in all publications are solely those of the individual author(s) and contributor(s) and not of MDPI and/or the editor(s). MDPI and/or the editor(s) disclaim responsibility for any injury to people or property resulting from any ideas, methods, instructions or products referred to in the content.