Article

Spatial and Temporal Dynamics of Drought and Waterlogging in Karst Mountains in Southwest China

1
School of Geographic and Environmental Sciences, Guizhou Normal University, Guiyang 550001, China
2
School of Architecture and Urban Planning, Guizhou Institute of Technology, Guiyang 550003, China
3
Guiyang Geographic Information Big Data Center, Guiyang 550002, China
*
Author to whom correspondence should be addressed.
Sustainability 2023, 15(6), 5545; https://doi.org/10.3390/su15065545
Submission received: 29 January 2023 / Revised: 12 March 2023 / Accepted: 16 March 2023 / Published: 21 March 2023

Abstract

:
Under the synergetic effect of land use and climate change, natural disasters occur frequently in the karst region of southwest China. This study used the daily precipitation data from 33 meteorological stations across 61 years (1960–2020), utilized the MK test and the Z index to calculate the levels of drought and waterlogging (DW) at multiple times (month and year) and spatial (province, sub-divisions, station) scales, and investigated the spatiotemporal patterns and their associated factors in DW in the karst mountains of Guizhou, southwest China. The results showed that: (1) DW occurred frequently and increasingly during the study period in Guizhou, with seven mutations of annual DW. (2) There were more droughts (especially heavy droughts) based on annual data, but more waterlogging (especially heavy waterlogging) based on monthly data. Drought occurred most frequently in summer, while waterlogging was most frequent in spring, followed by winter. (3) The normalized difference drought and waterlogging index (NDDWI) was created in this study to exhibit combined DW phenomena, which could be improved in the future to better present the compound hazards. The spatiotemporal patterns of DW in Guizhou were complicated and associated with terrain, geology, climate change, vegetation, land use, etc.

1. Introduction

Karst develops on soluble bedrocks (e.g., limestone, dolostone, halite, etc.), and is a three-dimensional landscape with solutional weathered surfaces and subsurface drainage systems [1,2]. Karst regions cover nearly 15% of the lands surface globally and are extremely valuable natural sites hosting a wide variety of unique ecological resources [3,4]. Karst aquifers provide freshwater to approximately 25% of the world’s population and support related agriculture, groundwater, and ecosystems [5,6].
In the context of climate change, together with increasing population, improper land use, and urban expansion, the fragile karst ecosystem could be easily affected [7,8]. Karst-related hazards, such as rocky desertification, drought, flood, landslides, etc., occur frequently and aggravatedly, and some unusual karst hazards have gradually evolved into periodic disasters with increasing frequency every year [9,10,11].
There are many different types of floods in the karst region, such as karst terrain flooding [12,13] and river flooding [14]. At the macro-regional scale, karst floods often occur in humid tropical and subtropical karst environments [11]. From the perspective of surface and underground structures, karst floods mainly occur in negative landforms (such as peak cluster depressions and peak cluster valleys) [12,15].
There are mainly two types of drought in karst areas: drought caused by low precipitation and, in humid climates, drought caused by the uneven distribution of precipitation in time and space, thin soil layers, low soil water storage capacity, and large variation in groundwater levels [16]. Karst droughts cause shortages of drinking water, crop yield reduction, vegetation damage, forest fires, vegetation degradation, and rocky desertification, and indirectly lead to serious secondary disasters and ecological environment degradation [17].
Karst drought and flood studies are often based on data from meteorological stations [18], climatic datasets [19], and remote sensing images [20]. Multiple indexes are the most common methods used to monitor drought and flood events, e.g., SPI (standardized precipitation index) [18,21], SWAP (standardized weighted average of the precipitation index) [22], ETI (evapotranspiration index) [23], CDI (composite drought index) [24], China-Z index [19], etc. Systemic and hydrological models are also applied in karst aquifers without accurate knowledge regarding the physics and detailed geometry of the karst system, i.e., neural network models [25] and SWAT (the soil and water assessment tool) [7,26].
However, current disaster studies of karst mainly focus on single hazard aspects, such as the classification, formation, and evolution mechanisms of rocky desertification [27,28], drought-related soil and vegetation research [29,30], or the development of karst floods [31,32]. The phenomena of compound multiple disasters, e.g., drought and waterlogging (DW), and their temporal and spatial distribution has not been analyzed in-depth [33,34,35].
China has the largest karst region in the world, accounting for 13% of the total area of the country. The karst mountains in southwest China are highly sensitive to climate change and human activities due to their special geomorphological features, increasing population, and insufficient land resources [36,37]. Karst droughts have occurred frequently in southwest China. For example, in Bijie in Guizhou province, there were 24 spring droughts and 24 summer droughts during 1959–1985 according to local records. From July 2009 to May 2010, severe droughts occurred throughout all four seasons in Guizhou and the intensity and area covered broke historical meteorological records, classified as extreme drought [35,38]. Flooding is also common in the region with exposed and shallowly covered karst in southwest China [39]. Karst floods often occur multiple times and periodically, often one to four times a year or up to eight times a year in the same region [15]. Since the 1990s, the frequency and intensity of floods have increased [16,40].
Therefore, Guizhou province in southwest China was chosen as the research area, and the Z index, the MK test, topographical analysis, and Pearson’s correlation were combined to analyze local drought and waterlogging (DW) across 61 years (1960–2020). This study examines the following: (1) the identification of different levels of DW and their spatiotemporal patterns; (2) the invention of the combined index for DW (NDDWI); and (3) the calculation of topographical indicators, and an analysis of their relationship with DW.

2. Materials and Methods
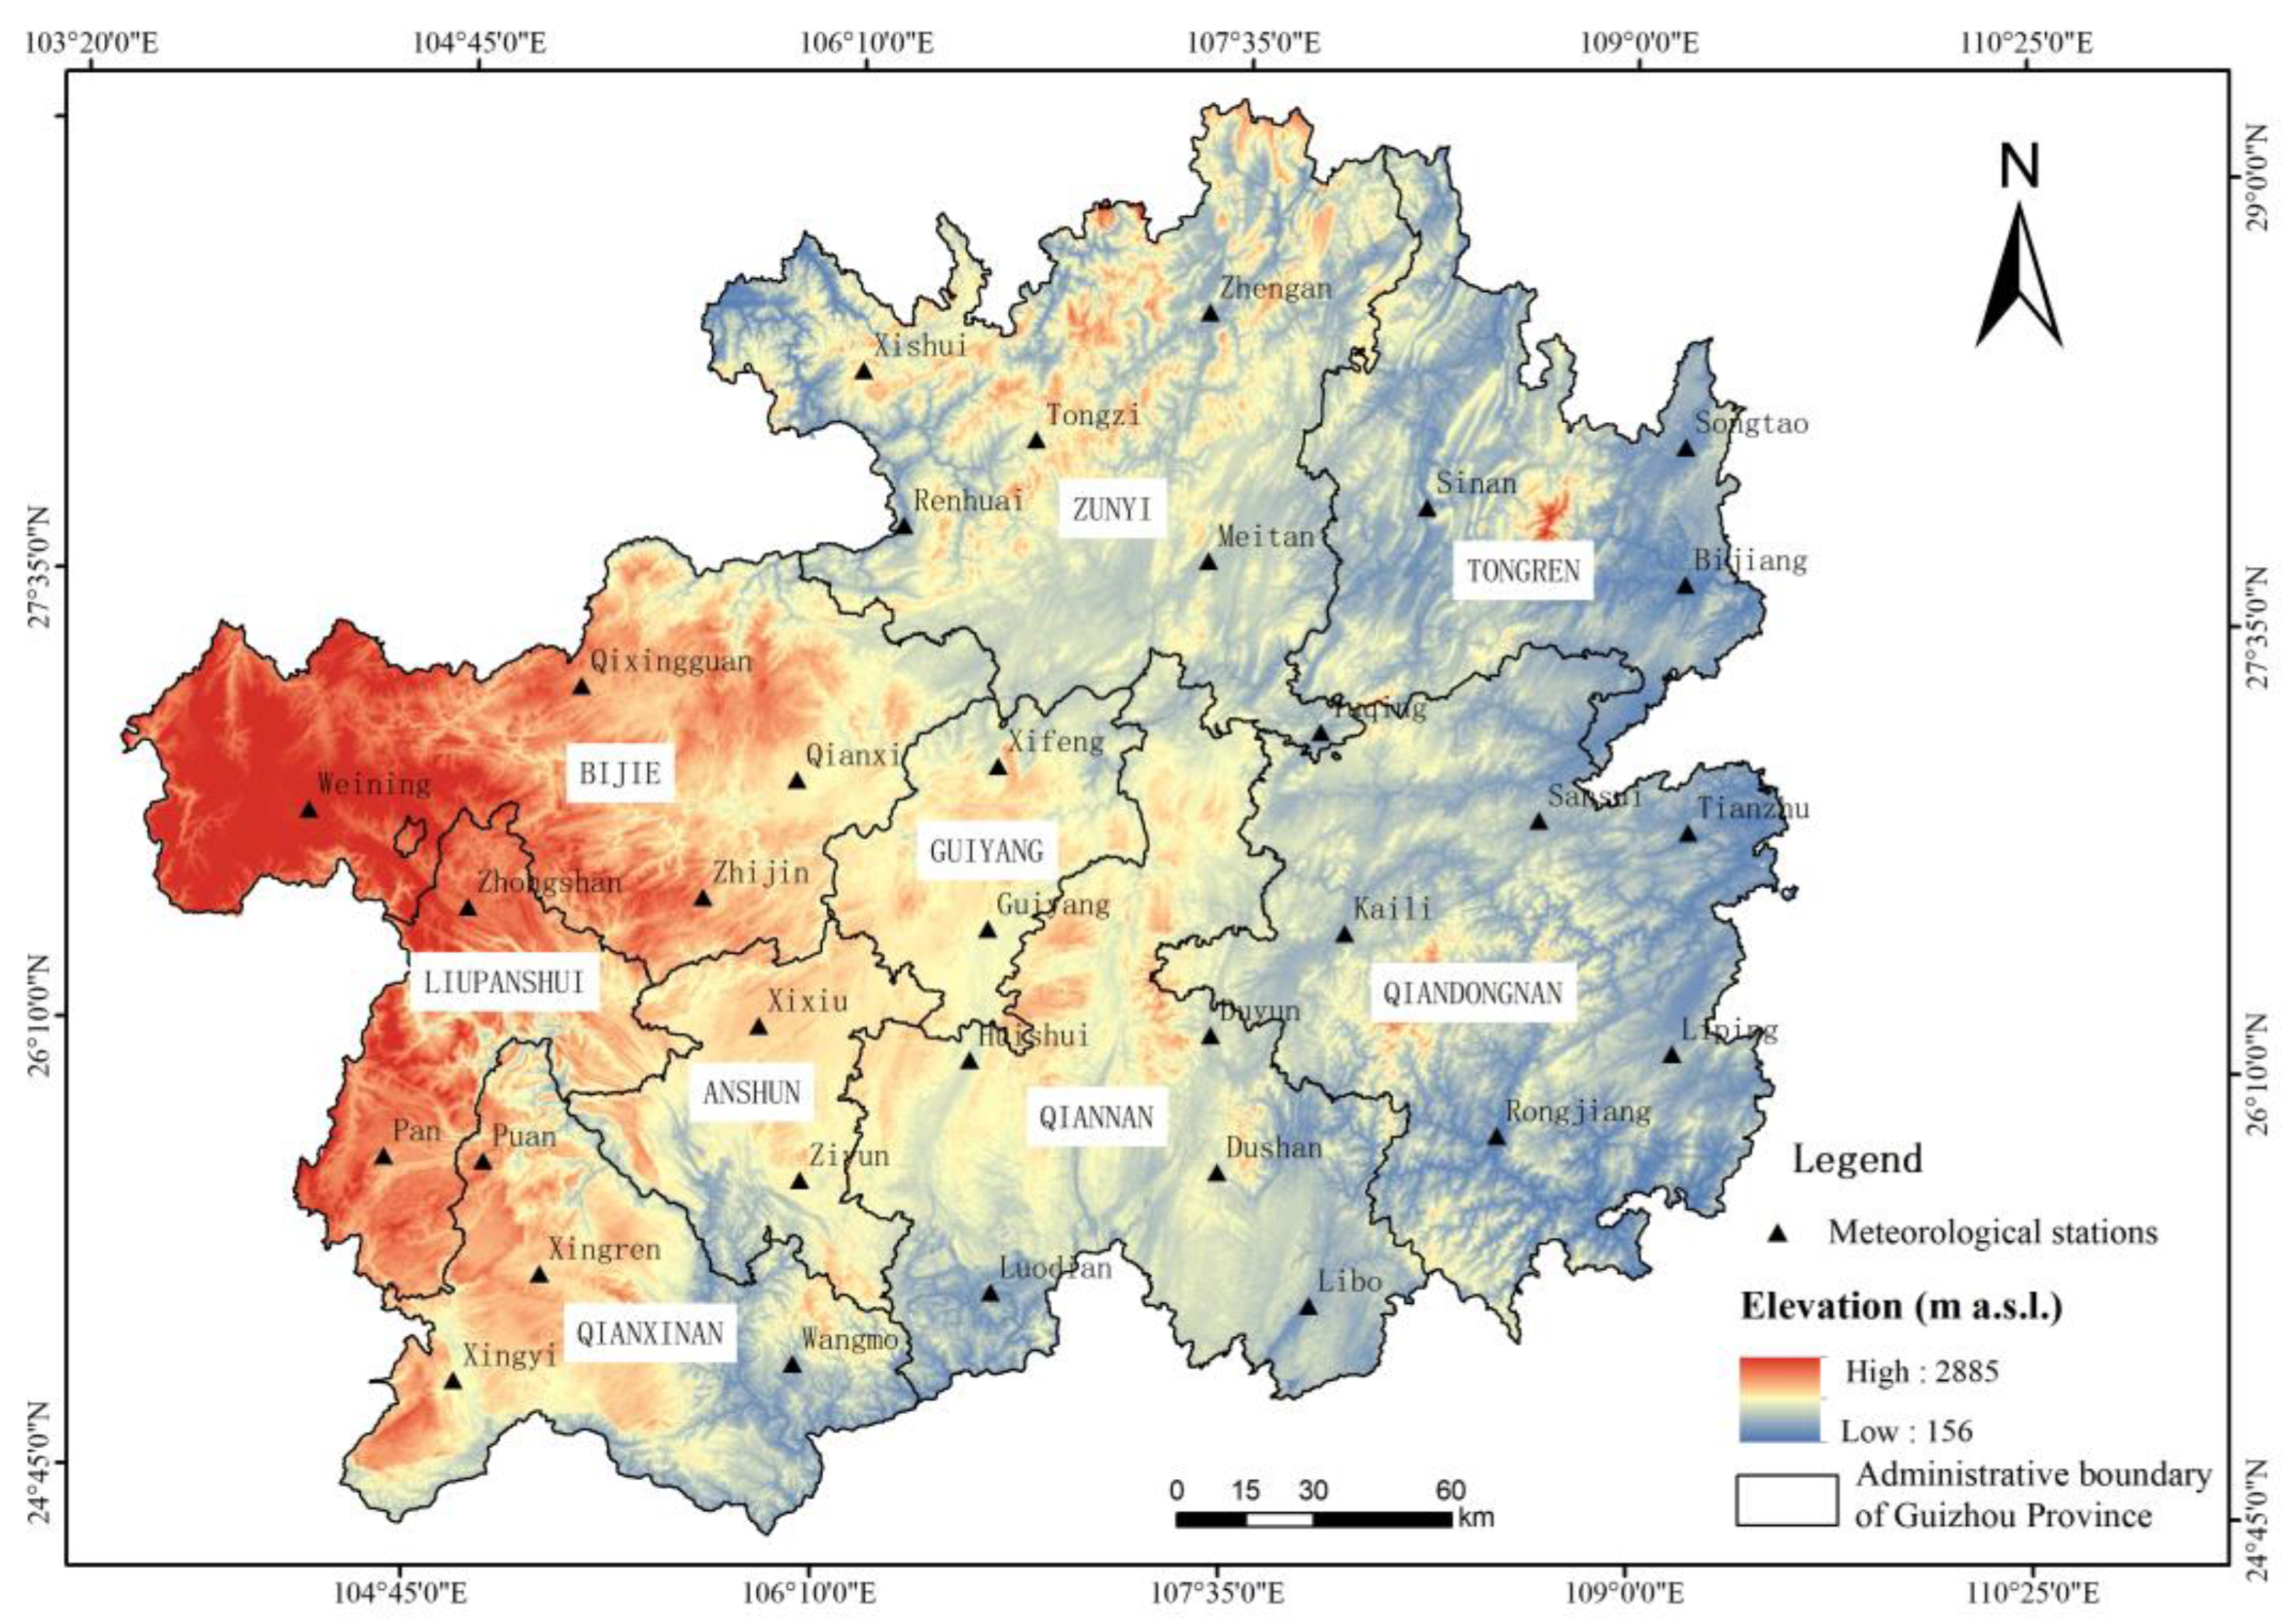
2.1. Study Area

Guizhou, a province in the mountainous karst region, was selected as the research site of this study (Figure 1). Guizhou is well known due to its karst environment and fragile ecological system. The total area of the province is 176,100 km2, 73.8% of which is karst landscape [41]. There are 9 administrative sub-divisions [42] (Figure 1).
Guizhou is part of the Yunnan–Guizhou plateau in southwestern China. The terrain is high in the west and low in the east, with an average elevation of approximately 1100 m a.s.l. [43]. Guizhou has a subtropical humid monsoon climate, and the precipitation affected by the monsoon occurs mainly in summer. During the 1960–2020 period in Guizhou, the mean annual precipitation was 1194.48 mm, the highest mean monthly precipitation was 220.09 mm in June, and the lowest mean monthly precipitation was 23.79 mm in December. Influenced by atmospheric circulation, topography, and landform [44,45,46], Guizhou has a diversified climate, many types of disastrous weather types, and a high frequency of drought, freezing, hail, etc., which negatively affect local ecosystems and the quality of people’s lives [42].

2.2. Data Collection and Analysis

2.2.1. Data Sources

In this study, the daily precipitation data from 33 meteorological stations in the 1960–2020 period in Guizhou (Figure 1) were collected from the China Meteorological Data Service Center (https://data.cma.cn/; accessed in April 2017 and December 2021). The inverse distance weighted (IDW) method was used to calculate the missing data from records of surrounding meteorological stations.
The digital elevation model (DEM, with a cell size of 90 m) of the study area was obtained from the Geospatial Data Cloud, Computer Network Information Center, Chinese Academy of Sciences (http://www.gscloud.cn, accessed on 28 January 2022).

2.2.2. Z Index Calculation

The Z index is not only related to precipitation at a specific point but is also related to the distribution pattern of precipitation in an entire region. The Z index is calculated on the assumption that precipitation in a certain period follows the Pearson type III distribution. After the normalization process, the probability density function of precipitation can be converted to form Equation (1) [47,48,49].
Z i = 6 C s ( C s 2 φ i + 1 ) 1 3 6 C s + C s 6
where C s is the skewness coefficient and φ i is the standard variable. Both C s and φ i were calculated using following equations:
C s = i = 1 n ( x i x ¯ ) 3 n σ 3
φ i = x i x ¯ σ
σ = 1 n i = 1 n ( x i x ¯ ) 2
x ¯ = 1 n i = 1 n x i
where x i represents precipitation of the ith month or year, and x ¯ is the mean precipitation.
After the Z index was calculated, the level of drought or waterlogging was determined according to Table 1 [50].
In order to increase the accuracy, 2 methods were used and compared to calculate the x ¯ (Equations (2)–(5)): ① A 1 km buffer zone around each administrative sub-division (Figure 1) was made, and then x ¯ was calculated according to the records of all the meteorological stations inside both the buffer zone and each administrative sub-division; ② x ¯ was calculated using records of all the stations inside the study area (33 meteorological stations). After the levels of DW were determined, the results were compared with DW records from China Meteorological Disasters (Guizhou Volume) [51] and the Guizhou Water Resources Bulletin from 2000 to 2020 [52]. The buffer zone method was adopted in this study because of its higher accuracy (≥90%).

2.2.3. Calculation of Normalized Difference Drought and Waterlogging Index

To compare the number of DW at the same locations and during same periods of time, a new index, the normalized difference drought and waterlogging Index (NDDWI), was created in this study. It was calculated as follows:
NDDWI = D W D + W
where D and W represent all the drought and waterlogging in Table 1.
NDDWI is between 1 and −1; the negative value denotes that there is more waterlogging than drought, the positive value denotes the opposite, while 0 denotes that the frequency of drought and waterlogging are the same.

2.2.4. Intensity of Drought and Waterlogging

The intensity of drought or waterlogging was calculated as [53]:
I = 1 n i = 1 n | I i |
where I is the intensity, n represents the number of stations recording drought or waterlogging, | I i | is the level of drought or waterlogging at each station (Table 1), and the values of I i are 0, 1, 2, 3, −1, −2, and −3 representing normal, PD, SD, HD, PW, SW, and HD, respectively. The intensity of DW at 33 stations was calculated separately.

2.2.5. MK Test

The Mann–Kendall test (MK test) is a method often used in meteorological studies, which is mainly used for long-term trend analysis and the abrupt change detection of temperature, precipitation, runoff, and other time series data [54].
Hypotheses are made for time series data x1, x2, …, xn: the data display either an increasing or decreasing trend (F0), or there is no obvious trend (F1). Under the assumption of F1, the statistic value S was calculated as follows:
S = i = 1 n 1 j = i + 1 n sgn ( x j x i )
where x represents the time series data, sgn (xjxi) is an indicator function that takes the values 1, 0, or −1 according to the sign in Equation (9).
sgn ( x j x i ) = { 1 ,     i f ( x j x i ) > 0 0 ,   i f ( x j x i ) = 0 1 ,   i f ( x j x i ) < 0
If n ≥ 10, S follows the normal distribution, and it can be standardized to obtain L. The significance for L is tested as:
L = { ( S 1 ) / var ( S ) S > 0 0 S = 0 ( S + 1 ) / var ( S ) S < 0
var ( s ) = 1 18 { n ( n 1 ) ( 2 n + 5 ) i = 1 m w i ( w i 1 ) ( 2 w i + 5 ) }
where n is the number of the data, m represents the number of tied groups, and w i is the amount of data in the ith (tied) group.
At a given significance level of α, if |L| ≥ L(1−α⁄2), F0 is accepted; otherwise, F1 is accepted. If |L| ≥ 1.645/1.96/2.58, it passes the 90%, 95%, and 99% significance tests [54].
To detect the time of change, the Sk is calculated as:
S k = i = 1 k r i ( k = 2 , 3 , , n )
r i = { 1 x i > x j 0 x j x i ( j = 1 , 2 , , i )
The sequential values of a statistic, UFk, are defined with Equations (14)–(16):
U F k = [ S k E ( S k ) ] var ( S k ) ( k = 1 , , n )
E ( S k ) = ( k ( k + 1 ) ) / 4                                               ( 2 k n )
var ( S k ) = ( k ( k 1 ) ( 2 k + 5 ) ) / 72         ( 2 k n )
where U F 1 = 0. Then, the data series (UFk) is reversed, and U B k is calculated ( U B k = U F k , UB1 = 0). If an intersection appears between UFk and U B k , this is the point of a sudden change or mutation [55].

2.2.6. Topographical Analysis

Based on DEM (90 m of cell size), the elevation, slope, aspect, change rate of slope, terrain relief, and topographical surface roughness were calculated with 5 km, 10 km, and 15 km buffer zones at each meteorological station. The terrain relief was calculated using 4 different sizes of neighborhood analysis in geographical information science (GIS) software: 3 × 3 ,   5 × 5 ,   7 × 7 , and 9 × 9 cell sizes [56].
The topographical surface roughness was calculated using the following equation:
R = 1 / cos ( P )
where R is the surface roughness and P represents the slope.
Pearson’s correlation was then utilized to analyze the relationship between topographical indices and annual DW.
In this study, the statistical analysis and correlation tests were carried out using Excel and SPSS, and GIS and RS analysis were carried out using ArcGIS and PIE (Pixel Information Expert) software, and PIE-Engine platform.

3. Results

3.1. Interannual Characteristics of Drought and Waterlogging

By calculating the mean annual Z index from 33 meteorological stations (Figure 2a) during the 1960–2020 period, it can be seen that: years with drought or waterlogging accounted for 23% of the study period; the lowest value of mean annual Z index was in 2011, which means that HD occurred in this year; there were also HDs in 1989 and 2013; and that there were five years of SD (1960, 1966, 1981, 2005, and 2009). The highest value of the mean annual Z index was in 2020, and four years of PW were recorded during the study period.
The results of the MK test for change in the arithmetic mean annual Z index is shown in Figure 2b. Within the 95% confidence range, the mean annual Z index experienced seven mutations and the frequency of change was relatively higher during the 1997–2000 period. In 1963, 1982, and 1990, the value changed from negative to positive: it changed from PD to normal in 1963, from SD to normal in 1982, and from HD to normal in 1990. The second mutation was in 1967: it changed from SD to PW and then to normal. Although the results of the MK test (Figure 2b) changed quite often during the 1997–2000 period, these years were all within the normal range.
The intensity (Equation (7)) and number of meteorological stations recording annual DW during the 1960–2020 period are presented in Figure 3. During the study period, the years where both drought and waterlogging were recorded account for 87%, and the years with a higher intensity of drought than waterlogging account for 77% (Figure 3a). The highest intensity of drought appeared in nine separate years (1965, 1969, 1974, 1976, 1983, 1993, 1997, 2002, 2020). The highest intensity of waterlogging was in 2015, followed by values of 2.22–2.35 in six separate years (1972, 1983, 1997, 2004, 2014, 2020).
For every year, the number of stations that recorded DW is shown in Figure 3b. The years where the stations had more drought than waterlogging account for 46%. The year when the most stations recorded drought (31 stations) was 2011, followed by 2009 (24 stations) and 1989 (22 stations). The years when most stations recorded waterlogging (21 stations) were 1967 and 2020, followed by 1977 (19 stations) and 2014 (17 stations). There were eight years with either no droughts or floods, in which four years saw no drought (1961, 1967, 1982, and 2014) and four years saw no waterlogging (1966, 2006, 2009, and 2011). In terms of the annual data of all the stations (33 stations × 61 years), HD accounted for 10.88%, SD was 7.70%, PD was 3.78%, PW was 6.01%; SW was 12.43%, and HW was 4.47%.
The proportion of the stations at each level of DW (annual) within the administrative sub-divisions (Figure 1) is shown in Table 2. The highest proportion of all levels of DW was in Bijie (64.34%), followed by Qiannan (49.51%) and Anshun (45.90%). The smallest proportion of all levels of DW was in Liupanshui (37.70%), followed by Qianxinan (37.86%) and Tongren (38.80%).
The frequency of annual DW at each meteorological station is shown in Figure 4. At the level of HD, the highest value (30 years) was from northwest of the study area, followed by the central and southern regions (up to 22 years); lower values were seen in the north and southwest; the lowest was zero in the east. For SD, the value was high in the center, south, and east (up to 12 years), and low in the west (the lowest frequency was zero years). For PD, the frequency was higher in the southwest and east (up to seven years) and lower in the north, center, and west. For HW, the frequency was high in the center (up to 16 years), followed by the southwest and then the north, and was lowest in the south. For SW, the highest frequency was in the center (up to 32 years), followed by the southwest, southeast, and north; but it was low in the northwest and east. For PW, the frequency was higher in the southeast (up to 9) followed by the west, and lower in the north and east.
The spatial distribution of the annual NDDWI from all stations is shown in Figure 5. The stations with positive NDDWI were more than those with negative NDDWI (19 were positive, 14 were negative). There were 14 stations with an absolute NDDWI of ≥0.5, in which 8 stations were positive and 6 were negative. The highest NDDWI was at Qixingguan (0.93) and the lowest was at Zhijin (−0.96). Most negative NDDWI stations were in the east and southwest, and those with positive NDDWI were scattered within the study area (positive NDDWI was high in the northwest and south).
From 1960 to 2020, by calculating annual the Z index of the whole province and nine administrative sub-divisions, the results (Table 3) show that drought increased significantly in Bijie, waterlogging of all sub-divisions decreased, and the decline was significant only in Bijie.

3.2. Characteristics of Monthly Drought and Waterlogging

In the past 61 years, the proportion of stations with drought or waterlogging during all months (61 year × 12 month/year = 732 month) in Guizhou was 75.50%. HD accounted for 23.50%, SD was 8.04%, PD was 2.49%, PW was 2.36%, SW was 6.90%, and HW was 32.21%.
The percentage of stations recording DW each month is shown in Figure 6. June had the highest normal ratio (32%), followed by October (29%) and September (27%). The highest SWA was in July (48%), followed by August (41%). The highest SDA was in April (38%), followed by February and March (36% and 35%, respectively). In all months, HW was highest, followed by HD and the normal month. PW and PD were the lowest.
The ratio of SWA and SDA based on monthly data in all sub-divisions is shown in Table 4. The months with higher SWA than SDA accounted for 84.11%. Qianxinan had higher SWA than SDA throughout all 12 months. In Bijie, the SDA of most months (nine months) was much higher than that of SWA; the highest SDA ratio was in March (71.31%), while the SWA of this month accounted for only 11.48%. Guiyang had higher SWA ratios than SDA in 10 months (except August and September), with the highest SWA in November (61.48%). The lowest SDA and SWA were in June in Qianxinan (1.23%) followed by Liupanshui in October (1.64%).
The spatial distribution of monthly DW is shown in Figure 7. HD was high in the northwest with the highest value of 449 months, followed by the northeast and central–south regions. It was low in the center, southeast, and southwest (the lowest value was 44 months). SD was high in the south, east, and northwest, and low in the central and southwestern region (with value range of 29–94 months). PD was high in the southwest and center (up to 31 months), but low in the east and north (the lowest value was 9 months). Higher HW values were in the north, center, and southwest (max = 337 months), with lower values in the east and south. The lowest value was in the northwest (87 months). SW had a similar spatial distribution to HW, with a data range of 27–74 months. PW was high in the southwest and center and low in the south and east, with a data range of 6–31 months.
The spatial distribution of the monthly NDDWI is shown in Figure 8. Most stations had negative NDDWI. Only nine stations were positive, and one station had a value of zero (Tongzi). Positive NDDWI was mainly distributed in the northwest. There were only three stations with an absolute value of NDDWI ≥ 0.5 (Qianxi = 0.55, Qixingguan = 0.63, Puan = −0.68).

3.3. Relationship between Terrain and Annual Drought and Waterlogging

The correlation between DW and the topography of the study area is shown in Table 5. Only the correlation between HW and minimum terrain relief within the 5 km buffer zone (Table 5) was significant at the 0.01 level. Other significances were at the 0.05 level.
Inside 5 km buffer zone, HW positively significantly correlated with the minimum terrain relief (9 × 9, 7 × 7, and 5 × 5 cell size). W and SWA exhibited a significantly positive relationship with the minimum terrain relief (9 × 9, 5 × 5, and 3 × 3 cell size) with similar coefficients.
Inside the 10 km buffer zone, PD had a significantly positive relationship with the maximum terrain relief (3 × 3 cell size), the maximum and mean of slope change rate, and mean slope. PD significantly negatively correlated with minimum elevation. HD was significantly negatively related to maximum terrain relief (5 × 5 and 3 × 3 cell size), slope change rate, slope, and aspect, and significantly positively correlated with minimum elevation. SDA exhibited a significantly negatively relationship with maximum terrain relief (3 × 3 cell size), slope change rate, and slope.
Inside the 15 km buffer zone, PD was significantly positively related to mean topographic relief (9 × 9, 7 × 7, 5 × 5, and 3 × 3 cell size), min topographic relief (9 × 9 cell size), min and mean of the slope change rate, mean surface roughness, and slope. PD significantly negatively correlated with minimum elevation. PW significantly negatively correlated to the minimum of the lope change rate, surface roughness, and slope.

4. Discussion

4.1. The Spatiotemporal Pattern of Waterlogging and Drought in Guizhou

Compound hazards have emerged recently to better understand the phenomena or effects of multiple hazards occurring simultaneously, or independently but with close association. The synergetic hazards could aggravate or reduce the impact on the environment, especially in the fragile karst ecosystem. The combined effect of drought and extreme wet events in a central Amazonian forest was studied by Esteban et al. [57], and results showed that interactions of both climatic anomalies had a positive impact, which could mitigate the negative effects from a single hazard. DW occurred frequently during the 1960–2020 period in Guizhou, and their spatiotemporal patterns were complicated based on yearly and monthly analyses. However, this joint phenomenon does not receive enough attention in karst studies, especially in the subtropical humid monsoon climate [17,30,58].
According to the annual analysis of Guizhou province (Figure 2 and Figure 3), drought was more severe and more frequent than waterlogging. The status fluctuated quite often (seven mutation in 61 years, as seen in Figure 2b) and was more obvious during the 1997–2000 period. Similar studies were carried out by Wang et al. [19] (based on monthly analysis for 51 years) and Liu et al. [10] (based on daily analysis for 20 years) in southwest China, and results showed a high frequency of drought and fluctuation at the beginning of the 21st century.
Some characteristics of DW were scale-dependent (time and space) in this study. DW increased in the last 61 years based on annual data for the whole province, but only drought remained in the same trend on a smaller scale (sub-regions, Table 3). SWA was higher than SDA on the monthly scale, but it was opposite based on the annual data. The proportions of both SWA and SDA on the monthly scale were higher than those in the annual data. In the context of climate change, these phenomena may be caused by the increasing trend of uneven precipitation distribution, as well as the synergetic effect of karst geomorphology and intense population pressure.
DW exaggerated in smaller scales may result in serious damage to local ecosystems. Although Guizhou experienced more droughts in a larger space scale and in a longer time frame in the past, precautions against extreme wet events cannot be neglected. Therefore, various scale methods (both time and space) should be considered when investigating DW patterns, especially in karst regions [59].
The NDWWI index was created in this study to investigate the combined effect of DW at the same locations. The value of NDDWI is between 1 and −1. The higher the absolute value, the more drought or waterlogging. The NDDWI of this study presents a more obvious trend (Figure 5 and Figure 8) when compared with traditional indexes (Figure 4 and Figure 7): drought was more widely distributed than waterlogging based on annual data, while the trend was reversed on a monthly scale. While the NDDWI was calculated using the sum of DW in this study, it could also be utilized to investigate trends with any level of DW, e.g., SWA or SDA.
However, the NDDWI cannot identify the difference between zero and the same number of drought and waterlogging instances. This weakness can be overcome by combining DW at each level, e.g., as seen in Figure 4. The NDDWI could be improved in the future to better present the combined effects of DW or other extreme weather events or disasters. Using NDDWI in conjunction with other relevant indices, e.g., the drought–flood abrupt alternation (DFAA) index [22,59,60], can effectively demonstrate the impact of combined hazards.

4.2. The Correlated Factors of Waterlogging and Drought in Karst Mountains

In Table 5, except for PW, significant correlations increased with a larger buffer zone: three significant correlations were identified for the 5 km buffer, up to five significant correlations in the 10 km buffer, and the highest was 10 significant correlations for PD at the 15 km buffer. With the increasing buffer zone (10–15 km), the correlation between PD, the mean of slope change rate, mean slope, and minimum elevation increased. Compared with precipitation, the underlying causes of DW are geomorphic types, geology, terrain, and human activities [22]. These parameters frequently exhibit spatial heterogeneity on a larger scale and are much more closely related in the karst region, which in our study also coincides with the rising scale-dependent correlation of terrain [30].
Rocky desertification, influenced by climate, land use, geology, terrain, etc., is one of the most serious environmental issues in southwest China [35]. This issue also has a close relationship with DW. Bijie, in the west of Guizhou (Figure 1), has a relatively large region of rocky desertification and the highest proportion of HD, SW, and HW (Table 2, Figure 5 and Figure 8). Similar phenomena were observed by Liu et al. [10], where the extreme drought shifted gradually towards the locations with high levels of rocky desertification in karst regions. Rocky desertification accelerates the deterioration of the ecological environment, resulting in land resource loss and non-zonal DW; in turn, DW may aggravate vegetation damage and soil erosion and promote or accelerate rocky desertification, forming a vicious cycle [30,61,62].

5. Conclusions

Land degradation, rocky desertification, and secondary disasters have become the main ecological environment issues in karst regions. In this study, the precipitation data from 33 meteorological stations across 61 years were utilized, and multiple indexes were calculated to investigate the spatiotemporal patterns and associated factors of DW in the karst mountains of Guizhou. The major conclusions can be summarized as follows:
(1) Based on annual data, DW occurred frequently, with more droughts than waterlogging, and exhibited seven mutations. Both drought and waterlogging increased for the whole province, with drought on a smaller scale. Based on monthly data, the ratio of DW was 75.50%, with more waterlogging than drought. The highest SWA was in summer, and the highest SDA was in spring, followed by winter.
(2) The NDDWI was created in this study to exhibit the combined effects of DW at the same location. The NDDWI of this study presents a more obvious trend when compared with traditional methods. However, it still requires improvement in order to achieve a better presentation of combined effects for multiple hazards.
(3) The spatiotemporal patterns of DW in Guizhou were complicated and correlated with terrain, geology, climate change, vegetation, land use, etc. The multi-scale method (time and space) should be adopted for compound DW studies in karst regions.

Author Contributions

Conceptualization, L.D. and C.Y.; methodology, L.D. and Y.Z.; software, C.M. and P.Z.; validation, C.Y., L.D. and Y.Z.; formal analysis, L.D. and C.M.; investigation, C.Y., F.Z. and P.Z.; resources, L.D. and X.Y.; data curation, C.M. and Y.Z.; writing—original draft preparation, L.D. and Y.Z.; writing—review and editing, L.D. and C.Y.; visualization, X.Y.; supervision, C.Y.; project administration, L.D. and C.Y.; funding acquisition, C.Y. All authors have read and agreed to the published version of the manuscript.

Funding

This research was funded by the Science and Technology Foundation of Guizhou Province ([2017]1409) and the National Natural Science Foundation of China (41561038).

Institutional Review Board Statement

Not applicable.

Informed Consent Statement

Not applicable.

Data Availability Statement

The meteorological data can be found at the China Meteorological Data Service Center (https://data.cma.cn/).

Acknowledgments

The authors would like to express their gratitude to the reviewers and editors for their valuable comments and edits in this article, and also would like to acknowledge the help and support from PIESAT Information Technology Co., Ltd. for providing the PIE software and the service of PIE-Engine platform.

Conflicts of Interest

The authors declare no conflict of interest.

References

  1. Stokes, T.; Griffiths, P. An Overview of the Karst Areas in British Columbia, Canada. Geosci. Can. 2019, 46, 49–66. [Google Scholar] [CrossRef]
  2. Geekiyanage, N.; Goodale, U.; Cao, K.-F.; Kitajima, K. Plant ecology of tropical and subtropical karst ecosystems. Biotropica 2019, 51, 626–640. [Google Scholar] [CrossRef]
  3. Goldscheider, N.; Chen, Z.; Auler, A.; Bakalowicz, M.; Broda, S.; Drew, D.; Hartmann, J.; Jiang, G.; Moosdorf, N.; Stevanovic, Z.; et al. Global distribution of carbonate rocks and karst water resources. Hydrogeol. J. 2020, 28, 1661–1677. [Google Scholar] [CrossRef] [Green Version]
  4. Covington, M.; Martin, J.; Toran, L.; Macalady, J.; Sekhon, N.; Sullivan, P.; García, Á.; Heffernan, J.; Graham, W. Carbonates in the Critical Zone. Earth Future 2023, 11, e2022EF002765. [Google Scholar] [CrossRef]
  5. Olarinoye, T.; Gleeson, T.; Marx, V.; Seeger, S.; Adinehvand, R.; Allocca, V.; Andreo, B.; Apaéstegui, J.; Apolit, C.; Arfib, B.; et al. Global karst springs hydrograph dataset for research and management of the world’s fastest-flowing groundwater. Sci. Data 2020, 7, 59. [Google Scholar] [CrossRef] [PubMed] [Green Version]
  6. Ford, D.; Williams, P. Karst Geomorphology and Hydrology; John Wiley & Sons: Hoboken, NJ, USA, 2007; Volume 346. [Google Scholar]
  7. Khoury, I.; Boithias, L.; Labat, D. A Review of the Application of the Soil and Water Assessment Tool (SWAT) in Karst Watersheds. Water 2023, 15, 954. [Google Scholar] [CrossRef]
  8. Goldscheider, N. A holistic approach to groundwater protection and ecosystem services in karst terrains. Carbonates Evaporites 2019, 34, 1241–1249. [Google Scholar] [CrossRef]
  9. Athamrie, A.; Tadesse, C.; Abebe, T. Drought and Flood Extreme Events and Management Strategies in Ethiopia. J. Geogr. Nat. Disasters 2022, 12, 248. [Google Scholar] [CrossRef]
  10. Liu, B.; Chen, C.; Lian, Y.; Chen, J.; Chen, X. Long-term Change of Wet and Dry Climatic Conditions in the Southwest Karst Area of China. Glob. Planet. Chang. 2015, 127, 1–11. [Google Scholar] [CrossRef]
  11. Pang, J.; Zhang, H. Global map of a comprehensive drought/flood index and analysis of controlling environmental factors. Nat. Hazards 2022, 1–27. [Google Scholar] [CrossRef]
  12. Gutiérrez, F. A review on natural and human-induced geohazards and impacts in karst. Earth Sci. Rev. 2014, 138, 61–88. [Google Scholar] [CrossRef]
  13. Najib, K.; Jourde, H.; Pistre, S. A methodology for extreme groundwater surge predetermination in carbonate aquifers: Groundwater flood frequency analysis. J. Hydrol. 2008, 352, 1–15. [Google Scholar] [CrossRef]
  14. Bailly-Comte, V.; Borrell Estupina, V.; Jourde, H.; Pistre, S. A conceptual semidistributed model of the Coulazou River as a tool for assessing surface water-karst groundwater interactions during flood in Mediterranean ephemeral rivers. Water Resour. Res. 2012, 48, 9534. [Google Scholar] [CrossRef]
  15. Pei, J.; Li, Q. Land Use and Soil and Water Loss in Typical Karst Mountain Area. Bull. Soil Water Conserv. 2006, 26, 94–99. (In Chinese) [Google Scholar]
  16. Li, Y.; Wang, S.; Rong, L. Problems of karst rocky desertification in southwest China. Resour. Environ. Yangtze Basin 2003, 12, 593–598. (In Chinese) [Google Scholar]
  17. Luo, L.; Wu, Y.; Li, H.; Xing, D.; Zhou, Y.; Xia, A. Drought Induced Dynamic Traits of Soil Water and Inorganic Carbon in Different Karst Habitats. Water 2022, 14, 3837. [Google Scholar] [CrossRef]
  18. Moradi, H.; Rahmati, M.; Karimi, H. Evaluating the Effects of Meteorological Drought on the Karstic Aquifers with Karst Development in Different Conditions. J. Water Soil Sci. 2018, 22, 255–266. [Google Scholar] [CrossRef] [Green Version]
  19. Wang, Y.; Liang, L.; Jing, J.; Luo, F.; Wang, A. Characteristic of Drought and Flood in the Dian-Qian-Gui Karst Areas Based on TRMM-Z Index. Int. Arch. Photogramm. Remote Sens. Spat. Inf. Sci. 2020, XLII-3/W10, 917–924. [Google Scholar] [CrossRef] [Green Version]
  20. Fragoso-Servón, P.; Bautista, F.; Frausto, O.; Pereira Corona, A. Characterization of karst depressions (shape, size and density) at 1:50,000 scale and the associated type of flood in the State of Quintana Roo, Mexico. Rev. Mex. Cienc. Geol. 2014, 31, 127–137. [Google Scholar]
  21. Huang, W.; Yang, X.; Li, M.; Zhang, X.; Wang, M.; Dai, S.; Ma, J. Evolution characteristics of seasonal drought in the south of China during the past 58 years based on standardized precipitation index. Trans. Chin. Soc. Agric. Eng. 2010, 26, 50–59. [Google Scholar] [CrossRef]
  22. Zhou, W.; Liu, D.; Zhang, J.; Jiang, S.; Xing, S.; Wang, J.; Cheng, Y.; Chen, N. Identification and frequency analysis of drought–flood abrupt alternation events using a daily-scale standardized weighted average of the precipitation index. Front. Environ. Sci. 2023, 11, 1142259. [Google Scholar] [CrossRef]
  23. Chloé, O.; Olioso, A.; Carrière, S.; Boulet, G.; Chalikakis, K.; Chanzy, A.; Charlier, J.-B.; Combemale, D.; Davi, H.; Emblanch, C.; et al. An evapotranspiration model driven by remote sensing data for assessing groundwater resource in karst watershed. Sci. Total Environ. 2021, 781, 146706. [Google Scholar] [CrossRef]
  24. Faiz, M.; Zhang, Y.; Zhang, X.; Ma, N.; Aryal, S.; Trinh Thi, V.H.; Baig, F.; Naz, F. A composite drought index developed for detecting large-scale drought characteristics. J. Hydrol. 2021, 605, 127308. [Google Scholar] [CrossRef]
  25. Kong A Siou, L.; Fleury, P.; Johannet, A.; Borrell Estupina, V.; Pistre, S.; Dörfliger, N. Performance and complementarity of two systemic models (reservoir and neural networks) used to simulate spring discharge and piezometry for a karst aquifer. J. Hydrol. 2014, 519, 3178–3192. [Google Scholar] [CrossRef]
  26. Nerantzaki, S.; Nikolaidis, N. The response of three Mediterranean karst springs to drought and the impact of climate change. J. Hydrol. 2020, 591, 125296. [Google Scholar] [CrossRef]
  27. Pu, J.; Zhao, X.; Dong, P.; Wang, Q.; Yue, Q. Extracting Information on Rocky Desertification from Satellite Images: A Comparative Study. Remote Sens. 2021, 13, 2497. [Google Scholar] [CrossRef]
  28. Zhang, J.; Dai, M.; Wang, L.; Zeng, C.; Su, W. The challenge and future of rocky desertification control in Karst areas in Southwest China. Solid Earth Discuss. 2015, 7, 3271–3292. [Google Scholar] [CrossRef] [Green Version]
  29. Molina Paniagua, M.; Melo, P.H.; Ramírez-Barahona, S.; Ortiz Rodriguez, A.; Monro, A.; Burelo-Ramos, C.; Gómez-Domínguez, H. How Diverse Are the Mountain Karst Forests of Mexico? bioRxiv 2023, 3, 530643. [Google Scholar] [CrossRef]
  30. Wang, Z.; Liu, S.; Su, Y. Spatial-Temporal Characteristics of Soil Erosion and Erosion Hotspots in Guiyang City of Karst Plateau Mountainous Region in 2008–2018. J. Soil Water Conserv. 2020, 34, 94–102+110. (In Chinese) [Google Scholar] [CrossRef]
  31. Cinkus, G.; Mazzilli, N.; Jourde, H. KarstID: An R Shiny application for the analysis of karst spring discharge time series and the classification of karst system hydrological functioning. Environ. Earth Sci. 2023, 82, 136. [Google Scholar] [CrossRef]
  32. Rad, S.; Junfeng, D.; Jingxuan, X.; Zitao, L.; Linyan, P.; Wan, Z.; Lin, L. Lijiang flood characteristics and implication of karst storage through Muskingum flood routing via HEC-HMS, S. China. Hydrol. Res. 2022, 53, 1480–1493. [Google Scholar] [CrossRef]
  33. Wu, Q.; Zheng, W.; Rao, C.; Wang, E.; Yan, W. Soil Quality Assessment and Management in Karst Rocky Desertification Ecosystem of Southwest China. Forests 2022, 13, 1513. [Google Scholar] [CrossRef]
  34. Yao, B.; Yue, X.-j.; Huang, P.; Li, Y.-h. The Qing-Long model: China provides a solution to the karst rocky desertification challenge. Acta Ecol. Sin. 2022. [Google Scholar] [CrossRef]
  35. Huang, Q.; Cai, Y. Spatial pattern of Karst rock desertification in the Middle of Guizhou Province, Southwestern China. Environ. Geol. 2007, 52, 1325–1330. [Google Scholar] [CrossRef]
  36. Fan, Z.; Li, J.; Yue, T.-X.; Zhou, X.; Lan, A. Scenarios of land cover in Karst area of Southwestern China. Environ. Earth Sci. 2015, 74, 6407–6420. [Google Scholar] [CrossRef]
  37. Gao, J.; Jiang, Y.; Anker, Y. Contribution analysis on spatial tradeoff/synergy of Karst soil conservation and water retention for various geomorphological types: Geographical detector application. Ecol. Indic. 2021, 125, 107470. [Google Scholar] [CrossRef]
  38. Xiong, H.; Wang, S.; Rong, L.; Cheng, A.; Li, Y. Effects of extreme drought on plant species in karst area of Guizhou province, southwest China. Chin. J. Appl. Ecol. 2011, 22, 1127–1134. [Google Scholar]
  39. Yuan, D.; Cai, G. The Study of Karst Environment; Chongqing Publisher: Chongqing, China, 1988. [Google Scholar]
  40. Lu, H.; Chen, S.; Zhang, C. Characteristics and generation mechanism of flood disaster in karst basin: A case study of the houzhai river in Guizhou. Trop. Geogr. 2012, 32, 352–356. [Google Scholar]
  41. Zhao, Z.; Xiong, K.; Chen, H.; Zhou, W.; Meng, H.; Wang, X.; Xue, Z. Effect of Drought on Soil Animal in Karst Rocky Desertification Ecological Rehabilitation Areas in Guizhou. Southwest China J. Agric. Sci. 2011, 24, 1167–1172. (In Chinese) [Google Scholar] [CrossRef]
  42. Bai, S.; Mo, T.; Shi, J.; Zhou, Y. Spatial and temporal variations of rainfall days with different intensities in Guizhou in recent 50 years (in Chinese). South North Water Transf. Water Sci. Technol. 2015, 13, 220–224. (In Chinese) [Google Scholar] [CrossRef]
  43. Yu, F.; Ningbo, C.; Yanmei, X.; Zhenping, Z.; Junqin, W. Temporal and spatial distribution characteristics of meteorological drought in Guizhou Province. J. Arid. Land Resour. Environ. 2015, 29, 82–86. (In Chinese) [Google Scholar] [CrossRef]
  44. Zhao, Y.; Park, C.; Son, S.W. Importance of Diabatic Heating for the Eastward-Moving Heavy Rainfall Events along the Yangtze River, China. J. Atmos. Sci. 2022, 80, 151–165. [Google Scholar] [CrossRef]
  45. Zhao, Y.; Lin, D.; Li, Z.; Wang, Y. Quantitative Attribution of Vertical Motion Responsible for Summer Heavy Rainfall Over North China. J. Geophys. Res. Atmos. 2022, 127, e2021JD035765. [Google Scholar] [CrossRef]
  46. Zhao, Y.; Chen, D.; Li, J.; Chen, D.; Yi, C.; Li, J.; Qin, R. Enhancement of the summer extreme precipitation over North China by interactions between moisture convergence and topographic settings. Clim. Dyn. 2020, 54, 2713–2730. [Google Scholar] [CrossRef] [Green Version]
  47. Jain, V.; Pandey, R.; Jain, M.; Byun, H.-R. Comparison of drought indices for appraisal of drought characteristics in the Ken River Basin. Weather. Clim. Extrem. 2015, 8, 1–11. [Google Scholar] [CrossRef] [Green Version]
  48. Dogan, S.; Berktay, A.; Singh, V. Comparison of multi-monthly rainfall-based drought severity indices, with application to semi-arid Konya closed basin, Turkey. J. Hydrol. 2012, 470–471, 255–268. [Google Scholar] [CrossRef]
  49. Shahabfar, A.; Ghulam, A.; Eitzinger, J. Drought monitoring in Iran using the perpendicular drought indices. Int. J. Appl. Earth Obs. Geoinf. 2012, 18, 119–127. [Google Scholar] [CrossRef]
  50. Zhang, H.; Yang, J. Characteristics and Models of Regional Drought Evolution in Guizhou; China Water Conservancy and Hydropower Press: Beijing, China, 2014. [Google Scholar]
  51. Wen, K.; Luo, N. China Meteorological Disasters: Guizhou Volume; Meteorological Press: Beijing, China, 2006. (In Chinese) [Google Scholar]
  52. Water-Resources-Department-of-Guizhou. Guizhou Water Resources Bulletin from 2000 to 2020. Available online: http://mwr.guizhou.gov.cn/sjfb/slsj/202211/t20221117_77132741.html (accessed on 10 July 2021).
  53. Chen, Y.; Chang, J.; Huang, S.; Wang, Y.; Guo, A. Variation characteristics of drought in Weihe River Basin based on Palmer drought severity index. J. Nat. Disasters 2014, 23, 29–37. (In Chinese) [Google Scholar] [CrossRef]
  54. Pirnia, A.; Golshan, M.; Darabi, H.; Adamowski, J.; Rozbeh, S. Using the Mann–Kendall test and double mass curve method to explore stream flow changes in response to climate and human activities. J. Water Clim. Chang. 2018, 10, 725–742. [Google Scholar] [CrossRef]
  55. Huang, Q.; Fan, J. Detecting Runoff Variation of the Mainstream in Weihe River. J. Appl. Math. 2013, 2013, 356474. [Google Scholar] [CrossRef] [Green Version]
  56. Tang, G.; Na, J.; Cheng, W. Progress of Digital Terrain Analysis on Regional Geomorphology in China. Acta Geod. Cartogr. Sin. 2017, 46, 1570–1591. (In Chinese) [Google Scholar] [CrossRef]
  57. Esteban, E.; Castilho, C.; Melgaço, K.; Costa, F. The other side of droughts: Wet extremes and topography as buffers of negative drought effects in an Amazonian forest. New Phytol. 2020, 229, 1995–2006. [Google Scholar] [CrossRef]
  58. He, Z.; Liang, H.; Yang, Z. Study on the driven mechanism of hydrologic drought based on the lithology-combined structure of the Karst drainage basin in South China. J. Water Clim. Chang. 2021, 12, 3714–3733. [Google Scholar] [CrossRef]
  59. Ren, J.; Wang, W.; Wei, J.; Li, H.; Li, X.; Liu, G.; Chen, Y.; Ye, S. Evolution and prediction of drought-flood abrupt alternation events in Huang-Huai-Hai River Basin, China. Sci. Total Environ. 2023, 869, 161707. [Google Scholar] [CrossRef]
  60. Qiao, Y.; Xu, W.; Meng, C.; Liao, X.; Qin, L. Increasingly Dry/Wet Abrupt Alternation Events in a Warmer World: Observed Evidence from China during 1980–2019. Int. J. Climatol. 2022, 42, 6429–6440. [Google Scholar] [CrossRef]
  61. Dixon, R.K.; Solomon, A.M.; Brown, S.; Houghton, R.A.; Trexier, M.C.; Wisniewski, J. Carbon Pools and Flux of Global Forest Ecosystems. Science 1994, 263, 185. [Google Scholar] [CrossRef]
  62. McMahon, S.M.; Dietze, M.C.; Hersh, M.H.; Moran, E.V.; Clark, J.S. A Predictive Framework to Understand Forest Responses to Global Change. In Year in Ecology and Conservation Biology 2009; Blackwell Publishing: Oxford, UK, 2009; Volume 1162, pp. 221–236. [Google Scholar]
Figure 1. Location of the Guizhou and the meteorological stations.
Sustainability 15 05545 g001
Figure 2. The mean annual Z index and its MK test for change in Guizhou from 1960–2020. (a) Mean annual Z index. (b) The MK test for change in mean annual Z index.
Sustainability 15 05545 g002
Figure 3. The annual waterlogging or drought from 33 meteorological stations during 1960–2020 inside study area. (a) The intensity (Equation (7)) of meteorological stations each year. (b) The number of meteorological stations with drought or waterlogging each year.
Sustainability 15 05545 g003
Figure 4. The annual DW with all levels at meteorological stations from 1960–2020.
Sustainability 15 05545 g004
Figure 5. The annual NDDWI of meteorological stations from 1960–2020.
Sustainability 15 05545 g005
Figure 6. The percentage of meteorological stations recording DW each month.
Sustainability 15 05545 g006
Figure 7. Monthly drought and waterlogging at all levels from 1960–2020.
Sustainability 15 05545 g007
Figure 8. The monthly NDDWI of meteorological stations from 1960–2020.
Sustainability 15 05545 g008
Table 1. The level of drought or waterlogging determined by the Z index.
Z IndexLevel of the Drought or Waterlogging
Z > 1.645Heavy waterlogging (HW)SW and above (SWA)Waterlogging
(W)
1.037 < Z ≤ 1.645Severe waterlogging (SW)
0.842 < Z ≤ 1.037Partial waterlogging (PW)
−0.842 < Z ≤ 0.842Normal
−1.037 < Z ≤ −0.842Partial drought (PD) Drought
(D)
−1.645 < Z ≤ −1.037Severe drought (SD)SD and above (SDA)
Z ≤ −1.645Heavy drought (HD)
Table 2. Proportion of stations with different levels of annual DW inside nine administrative sub-divisions of Guizhou during 1960–2020.
Administrative Sub-DivisionDW Proportion (%)
HDSDPDNormalPWSWHW
Anshun4.1012.307.3854.1010.666.564.92
Bijie30.332.87035.666.9717.626.56
Guiyang4.9213.933.2859.022.4612.304.10
Liupanshui5.746.564.9262.305.7410.664.10
Qiandongnan6.2310.825.5756.075.5711.803.93
Qiannan17.384.590.6650.498.5215.083.28
Qianxinan4.948.234.5362.144.949.056.17
Tongren5.467.657.1061.204.379.294.92
Zunyi9.027.383.8357.924.9213.663.28
Table 3. MK test of annual trend of drought and waterlogging in Guizhou from 1960–2020.
DWL Value in Equation (10)
Entire ProvinceAnshunBijieGuiyangQiandongnanQiannanQianxinanTongrenZunyiLiupanshui
D0.320.541.92 *0.461.281.490.90.921.040.25
W0.06−0.97−2.37 **−0.87−0.55−1.47−1.22−0.8−1.36−1.16
* pass the 90% significance test. ** pass the 95% significance test.
Table 4. The ratio of stations with SDA/SWA based on monthly data from 1960–2020.
Sub-DivisionsMonthRatioMonthRatioMonthRatio
SDASWASDASWASDASWA
Anshun10.350.3550.200.4590.400.33
Bijie0.620.180.500.250.220.48
Guiyang0.140.520.200.570.490.26
Liupanshui0.300.430.320.350.160.54
Qiandongnan0.310.410.330.390.260.42
Qiannan0.350.340.290.420.200.45
Qianxinan0.220.460.300.410.270.44
Tongren0.310.380.360.380.130.40
Zunyi0.360.360.400.370.220.45
Anshun20.250.3660.280.52100.310.45
Bijie0.700.170.300.390.530.27
Guiyang0.160.490.320.380.220.48
Liupanshui0.250.420.070.660.000.02
Qiandongnan0.330.380.330.400.320.39
Qiannan0.370.340.240.460.240.39
Qianxinan0.220.440.010.000.190.46
Tongren0.370.410.310.390.390.36
Zunyi0.340.370.320.410.300.37
Anshun30.230.4070.260.48110.290.42
Bijie0.710.110.250.470.640.17
Guiyang0.090.580.390.300.100.61
Liupanshui0.380.340.120.590.360.41
Qiandongnan0.320.380.300.400.250.45
Qiannan0.390.340.010.830.250.43
Qianxinan0.250.420.300.430.260.41
Tongren0.360.380.360.320.350.37
Zunyi0.280.400.330.390.270.45
Anshun40.310.4080.350.40120.260.39
Bijie0.690.140.270.460.610.18
Guiyang0.170.590.510.250.100.53
Liupanshui0.550.270.160.590.240.35
Qiandongnan0.300.410.340.400.280.40
Qiannan0.340.390.310.400.370.34
Qianxinan0.320.410.290.440.250.43
Tongren0.370.380.370.350.390.38
Zunyi0.360.390.330.400.350.39
Table 5. The Pearson correlation between terrain and annual DW inside the study area.
Topographic Factors5 km10 km15 km
FactorWindow
Size
ValueHWWSWAPDHDSDAPDPW
Terrain
relief
9 × 9Min0.49 **0.35 *0.39 *0.33−0.2−0.190.38 *−0.08
Mean−0.0100.060.34−0.18−0.130.39 *−0.2
7 × 7Min0.39 *0.260.290.29−0.21−0.210.280
Mean−0.0100.060.34−0.18−0.120.40 *−0.2
5 × 5Min0.44 *0.36 *0.38 *0.24−0.15−0.180.210.03
Max−0.19−0.0400.34−0.35 *−0.320.19−0.1
Mean−0.02−0.010.050.34−0.17−0.110.40 *−0.2
3 × 3Min0.350.35 *0.37 *0.18−0.15−0.150.020.03
Max0.030.150.180.35 *−0.35 *−0.36 *0.170.02
Mean−0.0200.050.34−0.16−0.10.39 *−0.2
Slope
change
rate
Min0.06−0.1−0.040.33−0.1−0.10.36 *−0.38 *
Max−0.010.10.120.40 *−0.37 *−0.35 *0.34−0.04
Mean−0.010.020.070.36 *−0.21−0.190.39 *−0.1
ElevationMin0.130.070.03−0.36 *0.37 *0.25−0.39 *0.22
Surface roughnessMin0.02−0.08−0.080.290.060.120.08−0.383 *
Mean−0.08−0.040.010.32−0.13−0.080.39 *−0.18
SlopeMax0.010.110.140.3−0.35 *−0.35 *0.220
Min−0.1−0.2−0.170.290.060.120.08−0.38 *
Mean−0.03−0.020.040.35 *−0.16−0.10.40 *−0.21
* significant correlation at 0.05 level (two-tailed); ** significant correlation at 0.01 level (two-tailed). Note: only the Pearson correlations with at least one significancy were listed in the table.
Disclaimer/Publisher’s Note: The statements, opinions and data contained in all publications are solely those of the individual author(s) and contributor(s) and not of MDPI and/or the editor(s). MDPI and/or the editor(s) disclaim responsibility for any injury to people or property resulting from any ideas, methods, instructions or products referred to in the content.

