Article

Optimal Scale Selection and an Object-Oriented Method Used for Measuring and Monitoring the Extent of Land Desertification

1
School of Civil Engineering and Geomatics, Shandong University of Technology, Zibo 255000, China
2
Guangzhou Institute of Geography, Guangdong Academy of Sciences, Guangzhou 510070, China
*
Author to whom correspondence should be addressed.
Sustainability 2023, 15(7), 5619; https://doi.org/10.3390/su15075619
Submission received: 13 February 2023 / Revised: 21 March 2023 / Accepted: 21 March 2023 / Published: 23 March 2023
(This article belongs to the Special Issue Climate Change and Enviromental Disaster)

Abstract

:
Desertification has become a major problem in the field, affecting both the global ecological environment and economy. The effective monitoring of desertified land is an important prerequisite for land desertification protection and governance. With the aim of addressing the problems of spectral confusion as well as the salt and pepper phenomenon concerning the successful extraction of desertification information by utilizing the pixel-based method in the studies, Landsat remote sensing images obtained from the year 2001 to 2021 were selected in this study as the data source, and then, the object-oriented random forest classification method was improved by using different optimal segmentation scale selection techniques and combining multi-thematic index characteristics for measuring the extent of land desertification. Finally, the improved method was applied to study the dynamic changes in desertification in the Mu Us Sandy Land Ecological Function Reserve. The results show that the optimal scale determined by different optimal segmentation scale selection methods is not entirely consistent, and a minor scale should be selected as the optimal scale. Compared with the pixel-based classification method, the overall accuracy of object-oriented classification based on the optimal segmentation scale was improved by 8.06%, the Kappa coefficient increased by 0.1114, and the salt and pepper phenomenon was significantly reduced. From 2001 to 2021, the area of desertified land decreased by 587.12 km2 and the area of severely desertified land decreased by 4115.92 km2, indicating that the control effect was remarkable. This study can provide effective decision-making evidence and support for the successful governance of desertification.

1. Introduction

Desertification refers to the phenomenon that land in arid and semi-arid areas, or even some semi-humid areas, gradually degenerates into a desert due to the combined effects of human activities and natural factors, such as drought, low rainfall, overgrazing, soil and water loss, and vegetation destruction [1]. As one of the global ecological–social–economic problems experienced by the international community, it is attracting extensive scientific attention all over the world. Desertification leads to negative changes occurring in the properties of vegetation (such as biomass, density, vegetation cover), loss of biodiversity and soil fertility, and changes in landscape patterns in dry regions at different geographical scales [2]. It is also increasingly damaging the local natural, ecological environment and is rapidly becoming one of the greatest obstacles to the sustainable development of both society and the economy. Therefore, it is critical to dynamically monitor desertification processes and quantitatively analyze the spatiotemporal distribution characteristics, which can provide a scientific basis for environmental protection and sustainable development practices [3].
At present, there are numerous methods used for acquiring desertification information, which focus on field investigations and remote sensing. Among them, the field investigations method mainly relies on taking the measurements of sample grids in small areas, which is a time-consuming practice and requires a considerable effort when employed at the city level. Compared with field investigations, remote sensing methods have been widely used in the field to monitor the spatiotemporal information relating to desertification because of their large spatial coverage, easy accessibility, and reasonable costs [4]. The primary monitoring method is dependent on manual visual interpretation. Although this method provides good mapping results for desertified land, it has high labor costs and its accuracy is dependent on its interpreters [5]. Thus, this method is not optimal for desertification monitoring, especially for large regions. Furthermore, the monitoring results are affected by the interpretations and professional qualities of the individual personnel. With the ongoing development of remote sensing and computer technologies, numerous evaluation indexes have been proposed in the research to assess the degree of desertification in certain areas [6]. Some relevant studies have tried to extract desertification information through thematic indices, such as the normalized difference vegetation index (NDVI), fractional vegetation cover (FVC), modified soil-adjustment vegetation index (MSAVI), and enhanced vegetation index (EVI) [7,8,9,10]. However, since the relevant vegetation index is greatly affected by precipitation fluctuations and soil background characteristics, especially in open vegetation environments, the use of a single vegetation index cannot entirely and accurately reflect the desertification information in semi-arid areas [11]. Therefore, the method of combining multiple indexes and constructing a desertification degree index was proposed to better extract the necessary desertification information [12,13,14,15]. Based on the combination of NDVI–Albedo, MSAVI–Albedo, etc., feature space models were constructed to evaluate the desertification degree and study the spatial distribution in the region [16,17,18]. The abovementioned methods can be used to extract the required desertification information; however, all these methods are based on the spectral characteristics of individual pixels, rarely considering the texture, geometric characteristics, or additional information of the land’s surface, which are difficult to use when attempting to distinguish areas of the same objects with different spectra or different objects with the same spectra. The results make it easy to generate the salt and pepper phenomenon, that is, due to the spectral differences of the same object, the original complete and uniform land-types are classified into different categories, usually presenting as discrete pixels [19]. In addition, the environment of interaction among pixels is ignored in the studies, which can easily cause misclassifications in land desertification monitoring practices and can also affect the classification results [20].
In recent years, the object-oriented multi-scale segmentation method has been extensively used in remote sensing image interpretation practices. Multi-scale segmentation can segment an image into geographical units with multiple similar attributes that are classified according to their spectral characteristics, texture characteristics, and additional information, effectively overcoming problems, such as spectral confusion or the salt and pepper phenomenon [21]. Image segmentation is deemed to be a critical prerequisite for object-oriented classification because its quality considerably affects the final result of geo-object recognition activity. Understanding how to effectively determine the optimal segmentation scale is crucial to the improvement of segmentation quality in this field of research [22]. Therefore, a variety of quantitative evaluation methods for selecting optimal segmentation scales was proposed, such as the maximum area method, objective function method, mean variance method, and homogeneity and heterogeneity index model [23,24,25]. Quantitative evaluation approaches can achieve a wide range of segmentation results. If the segmentation scale is larger than the classified target object, under-segmentation occurs, whereas if the segmentation scale is smaller than the classified target object, over-segmentation occurs. As a result, it is challenging to understand how to successfully obtain the optimal segmentation scale for a certain class of objects. In terms of land cover classification methods [26], vegetation information extraction [27,28], and farmland identification practices [29], the optimal segmentation scale has been thoroughly studied in the literature and improved classification accuracy has been achieved by using the object-oriented classification method based on optimal segmentation. However, few studies focus on optimal segmentation scale selection in terms of the monitoring and mapping of land desertification behavior.
China is one of the countries with the largest desert areas and the fastest speed of desertification in the world. Sandstorm disasters frequently occur and land desertification causes considerable economic losses [30]. The Mu Us Sandy Land is one of the four major sandy-land areas in China, which is located at the junction of arid and semi-arid areas. It is a typical agricultural–pastoral ecotone formed by both the natural environment and human activities. To a certain extent, the desertification process occurring in the Mu Us Sandy Land Ecological Function Reserve represents the desertification characteristics of arid and semi-arid areas [31]. Following years of management, the Mu Us Sandy Land Ecological Function Reserve has experienced significant improvements, and the desertification area has also been considerably reduced. However, the ecological environment in this region remains fragile and sensitive, and the results of governance are still unstable. In order to prevent the phenomenon of desertification from recurring, the effective monitoring and assessment of land desertification processes needs to be continuously conducted.
In order to solve the problems of spectral confusion and the salt and pepper phenomenon by using the pixel classification method, to assess different types of land desertification, this paper addresses the Mu Us Sandy Land Ecological Function Reserve located in northwest China as the main study area to explore the effects of using the object-oriented method to successfully extract the appropriate desertification information. An improved method for desertified land classification is developed by incorporating spectral and spatial features as well as thematic index information with the object-oriented technique to improve the efficiency and accuracy of identifying the degree of desertification that occurs in the selected site. Based on these methods, we monitor and analyze the spatiotemporal changes in land desertification activity from the year 2001 to 2021. The results presented in this study provide a scientific basis for the prevention and control of desertification in the Mu Us region in the future.

2. Study Area and Data Sources

2.1. Study Area

This study was conducted at the Mu Us Sandy Land Ecological Function Reserve, which is located at the coordinates of 37°30′ N~39°25′ N, 107°20′ E~110°30′ E, across the southern part of Ordos City in the Inner Mongolia Autonomous Region and the northern part of Yulin District in Shaanxi Province (Figure 1). The altitude of the study area is between 920 and 1600 m, with an average altitude level of approximately 1200 m, and the overall trend decreases from the northwest to the southeast of the region. The climate type is temperate continental Monsoon, with an average annual temperature of approximately 8 °C, the coldest month has an average temperature as low as −9.5 °C, and the warmest month has an average temperature of 24 °C. The average annual precipitation ranges from 240 to 400 mm and the average annual evapotranspiration level is 2200 mm. Precipitation mainly occurs in the summer with the maximum daily precipitation level reaching 200 mm, and the precipitation gradually decreases from east to west directions [32]. Due to the area’s climate, the vegetation zone in the Mu Us Sandy Land Ecological Function Reserve is transitional in nature, gradually changing from the desert grassland belt located in the west to the dry grassland–forest grassland transition zone, and the vegetation types present are mainly shrubs and meadows, such as Artemisia ordosica, Sabina vulgaris, Salix cheilophila, and Leymus secalinus [33].

2.2. Data Collection and Pre-Processing Steps

Landsat series data have the advantages of their multi-temporal, wide-area coverage, and convenient access characteristics, which are suitable for large-scale desertification monitoring practices. Landsat 8 OLI and Landsat 5 TM remote sensing data were downloaded from the United States Geological Survey (https://earthexplorer.usgs.gov, accessed on 15 January 2022). In order to avoid the influence of winter snow and the weak spectral information of vegetation in the spring and autumn seasons, images taken during summer were selected to extract the necessary desertification information. Table 1 presents detailed information concerning the selected images. All images were pre-processed using radiation calibration, atmospheric correction, mosaic, and clipping, using ENVI 5.3 software.
Google Earth image data. A total of 1485 samples were selected by a visual interpretation of the high-resolution images based on Google Earth, of which 60% were used as training area samples and 40% were used for accuracy verification, including non, mild, moderate, and severe desertification. The samples were selected according to the principle of random sampling and evenly distributed throughout the study area (Figure 2).

3. Methods

Object-oriented image classification comprehensively considers the spatial, spectral, textural, and additional features of an image. The adjacent pixels presenting the same characteristics are divided into an image object, and then classified according to the features of each object. The basic processing unit is no longer a single pixel, but a polygon object with homogeneity. Object-oriented classification mainly includes two basic steps: image segmentation (object generation) and image classification (feature extraction) [34]. Image segmentation is the basis of the object-oriented information extraction method. Based on the minimum heterogeneity rule, adjacent pixels presenting similar eigenvalues (shape, brightness, texture, etc.) were grouped and segmented into different objects. Image classification was based on the feature extraction of the segmented objects. Additionally, the objects with different features were then classified, and therefore, the segmentation effect directly affects the accuracy of the image classification.

3.1. Interpretations of the Signs of Desertification

According to the General Principles of the Regional Environmental Geological Survey of the China Geological Survey and the previous research results presented in the literature [35,36,37], desertification is divided into four categories: non, mild, moderate, and severe desertification. Our interpretations of the signs of desertification are presented in Table 2.

3.2. Segmentation Algorithms

The object-oriented multi-scale segmentation algorithm is a region merging technique that starts with any single pixel and merges adjacent pixels with similar characteristics into polygon objects from the bottom up. If the segmentation is small, the same ground class is divided into multiple objects, which easily results in over-segmentation. If the segmentation scale is too large, different classes with similar spectra are divided into one object, resulting in the occurrence of under-segmentation. When the segmentation scale is optimal, the segmented polygon object is similar to the actual target shape, and the internal spectral variation in the object is minor; therefore, the key to multi-scale segmentation is the selection of an appropriate segmentation scale [38]. In this study, the multi-scale segmentation algorithm of eCognition software was used to determine the optimal segmentation scale by using the mean variance and maximum area methods.

3.2.1. Mean Variance Method

The mean refers to the average brightness of all pixels in an object following the image’s segmentation, and the variance of the average brightness value of all object pixels in the entire image is the mean variance. If the pure object following image segmentation increases, its spectral heterogeneity with the adjacent object also increases, and the mean variance of the object at this scale also increases; conversely, if the number of mixed objects following segmentation increases, the spectral variation between the mean variance of the objects decreases. When the mean variance reaches a maximum value, the spectral heterogeneity between the objects is the best, and the segmentation scale at this stage is the optimal partition scale [39]. The calculation formula of the mean variance is as follows:
C t = 1 m i = 1 m C t i
C t ¯ = 1 n i = 1 n C t
S 2 = 1 n i = 1 n ( C t C t ¯ ) 2
where Cti is the brightness value of the ith pixel in the object in the t-band, m is the number of pixels in the object, Ct is the average brightness value of a single object in band t, C t ¯ is the average brightness value of all objects in band t, n is the number of objects in the entire image, and S2 is the mean variance of all objects.

3.2.2. Maximum Area Method

Previous studies have indicated that [40,41], with the increase in the segmentation scale, the maximum area of the image object does not always increase, but rises in a step-like manner, that is, the maximum area of the object remains unchanged within a certain scale range, and the scale range at this stage is the optimal segmentation scale interval. According to the characteristic values of multi-scale segmentation, the maximum area of objects under different segmentation scales is counted, and the change curve evident between the segmentation scale and maximum area is established, so as to determine the optimal segmentation scale.

3.3. Characteristic Variables

The second step of object-oriented classification is feature extraction. Through the analysis of the spectral reflection curves and image characteristics of various types of desertified land in the analyzed study area, it was observed that the spectral reflection patterns between severe- and moderate-desertification areas, and moderate- and mild-desertification areas were similar, and it was difficult to distinguish the degree of desertification by relying on spectral characteristics alone, which is also one of the difficulties presented in the remote sensing monitoring of desertified land. Therefore, relevant evaluation indexes, which are the topsoil particle size index (GSI), Fe2O3, normalized difference vegetation index (NDVI), and Albedo, were introduced to the information extraction process, which caused the image objects to present clearer features concerning the degree of desertification and improve the overall classification accuracy [42,43].
In this study, the feature extraction tool of eCognition software was used to optimize the feature space according to the training data, and the group that could best characterize the land class information (Table 3) was extracted as the classification basis, which can reduce the complexity of data calculation and improve the classification accuracy result. The feature set included not only the spectral and geometric features of the images, but also the thematic exponential features presented by the calculation performed.

3.4. Random Forest Classification

The random forest algorithm is a machine learning algorithm proposed by Breiman [44] that integrates multiple decision trees. The smallest working unit based on object-oriented random forest classification changes from a single pixel to a polygon object with scale segmentation, which can effectively reduce the occurrence of the salt and pepper phenomenon and retain the advantages of the high stability and accuracy of the random forest classification method. It randomly selects several sample subsets from the original dataset and puts them back before next selecting, building a decision tree for each sample subsets, then predicting the samples, processing the classification results of each decision tree by voting, and finally determining the data category, namely:
H ( x ) = arg max Y i = 1 k I ( h i ( x ) = Y )
where x is the training sample, k is the number of decision trees, Y is the output variable, I is the indicative function, hi(x) is the classification result of a single decision tree, and H(x) is the final classification result [45].

3.5. Accuracy Evaluation

In this study, the overall accuracy and Kappa coefficient were used to evaluate the accuracy of the final classification results. The classification results were evaluated using a confusion matrix to determine the accuracy and reliability of the classification. Using the overall accuracy and Kappa coefficient as the selected evaluation factors, the calculation formula is as follows:
p c = k = 1 q p k k / p
where pc is the overall classification accuracy, k = 1 q p k k is the sum of correctly classified pixels, and p is the total number of pixels.
K a p p a = N j = 1 r x j j i = 1 r ( x j + x + j ) N 2 j = 1 r ( x j + x + j )
where r is the total number of columns in the error matrix (the total number of categories), xjj is the total number of pixels in row j and column j in the error matrix (the number of correct classifications), xj+ and x+j are the total number of pixels in row j and column j, respectively, and N is the total number of pixels used to perform the accuracy assessment.

4. Results and Analysis

4.1. Optimal Segmentation Scale

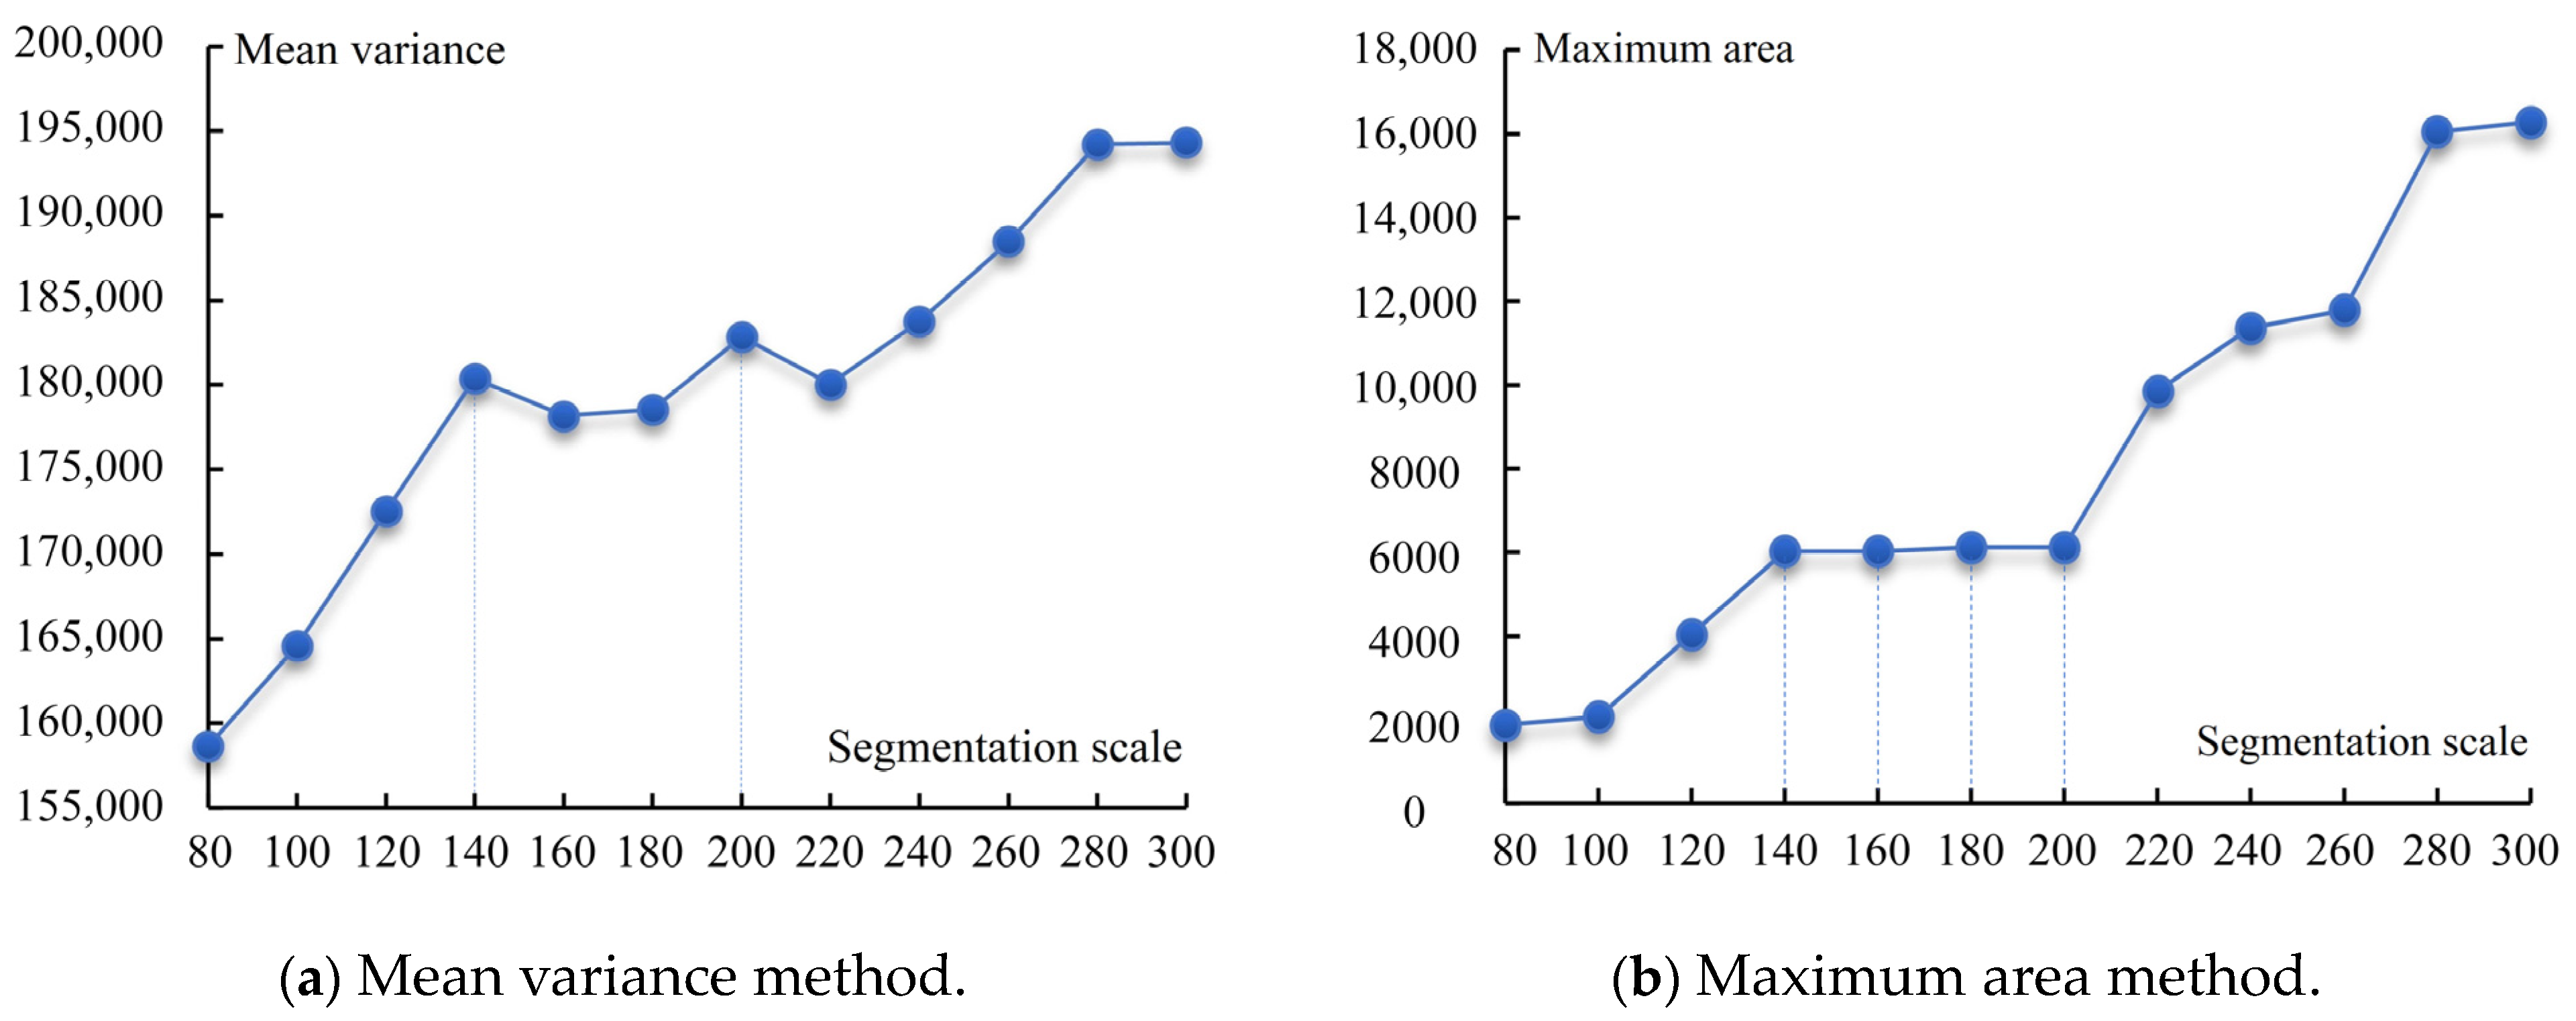
The optimal segmentation scale used to perform land desertification classifications was determined by using an optimal segmentation scale model based on Landsat 8 images obtained in the year 2021. When the scale was less than 80, the image was over-segmented and one real geo-object was fragmented by more than one resulting segment. When the scale was greater than 300, the image was under-segmented and the adjacent ground objects were divided into larger objects, which were not clearly distinguished. The mean variance and maximum area of each scale were calculated as the segmentation scale increased from 80 to 300 with a step size of 20. The variation curves of statistics with segmentation scales in different methods are presented as Figure 3.
Generally, the mean variance increases with the increase of the segmentation scale. However, two peaks appear in the curve graph (Figure 3a) and these peaks correspond to the segmentation scale values of 140 and 200. According to Figure 3b, the maximum area of the object also increases along with the increase in the segmentation scale. Plateaus appear in the curve at 140–160 and 180–200. Each plateau can be deemed as a range for extracting the optimal segmentation scale of the class. The mean variance method allowed us to obtain two maximum-value-points optimal segmentation scales, while the maximum area method obtained two-range optimal segmentation scales. However, the two maximum value points were located on the two plateaus.
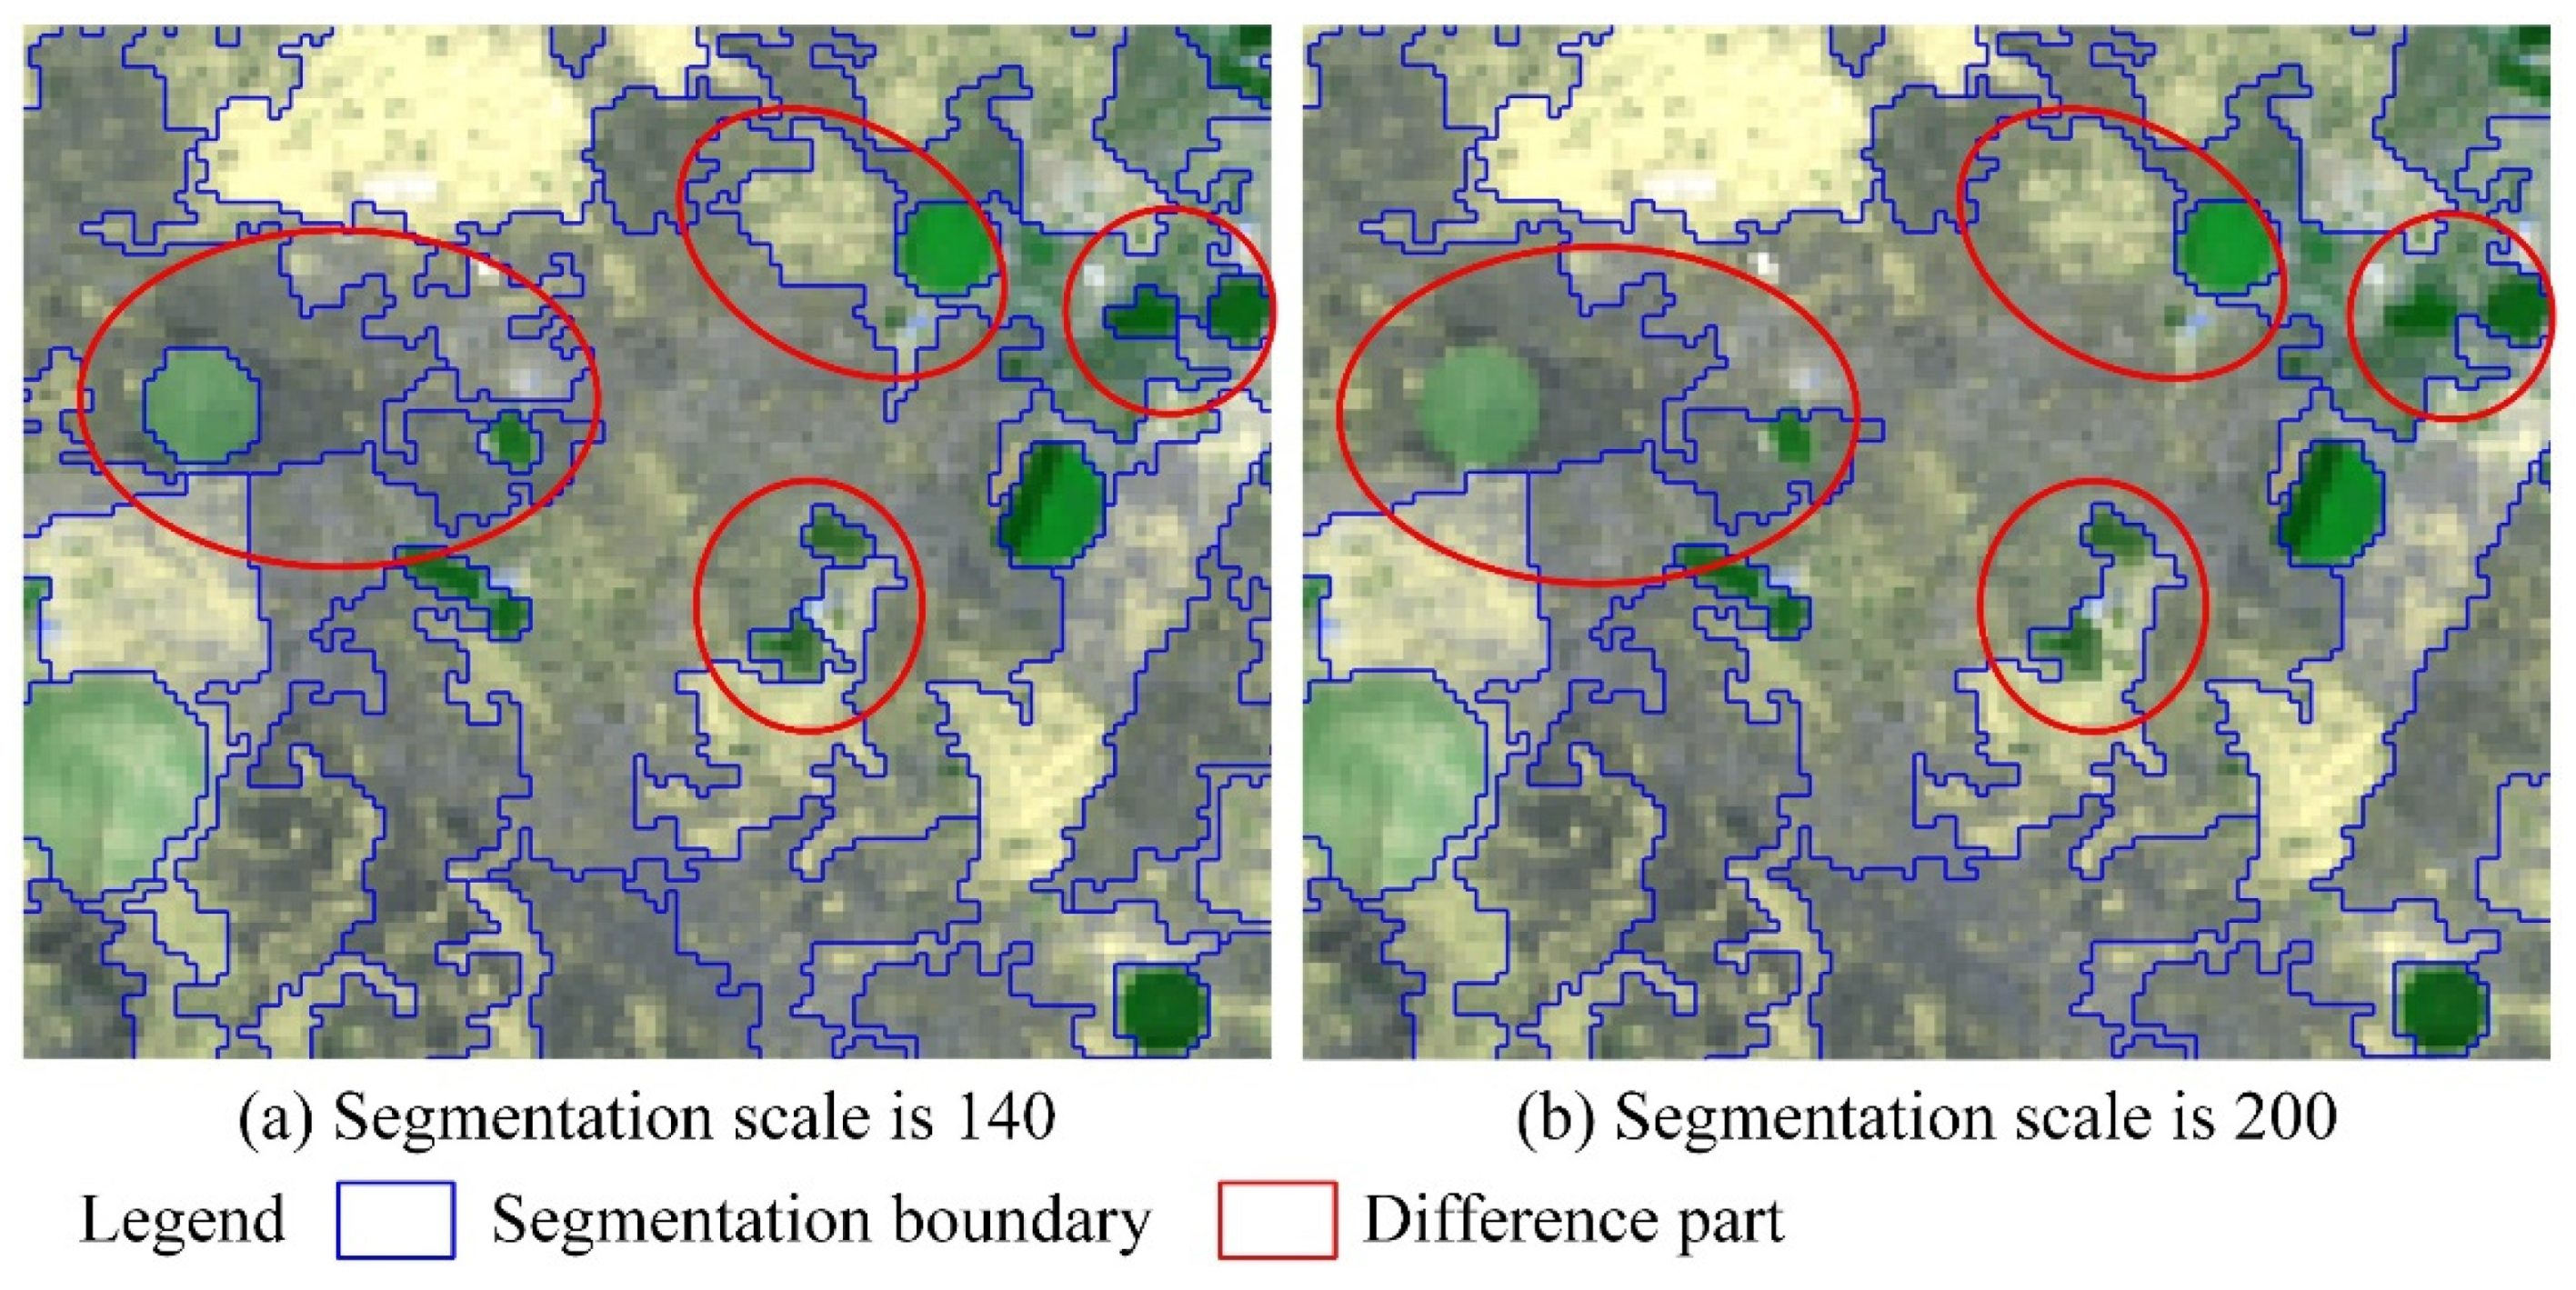
The segmentation scale values determined by the use of the mean variance method were 140 and 200, and the unchanged area of the object obtained using the maximum area method is evident from 140 to 160 and 180 to 200. Combining the results obtained for the two methods, 140 and 200 segmentation scales were preliminarily set and analyzed to evaluate the over-segmentation and under-segmentation of the land desertification information. The segmentation effect and quality of two different segmentation scales are presented in Figure 4 (the red circles are the areas with differences between scales 140 and 200). When the segmentation scale is 140, the image object is complete and uniform, and there is no under-segmentation or over-segmentation phenomenon present in any category (Figure 4a). When the segmentation scale is 200, part of the original, complete, and uniform land class (the red circle in the figure) is segmented into the same object as the surrounding land class, such as non- and mild-desertification areas, or even the area presenting moderate- or severe-desertification levels. Obvious under-segmentation is present in the image (Figure 4b), and the classification result is expected to present considerable errors. Considering that under-segmentation may result in greater errors than over-segmentation for the image classification stage, good segmentation can present minor over-segmentation but should not result in under-segmentation [46]. Therefore, the segmentation quality of the two scales were evaluated by qualitative visual analysis. The best segmentation effect was produced when the segmentation scale equaled 140.

4.2. Analysis of Classification Results

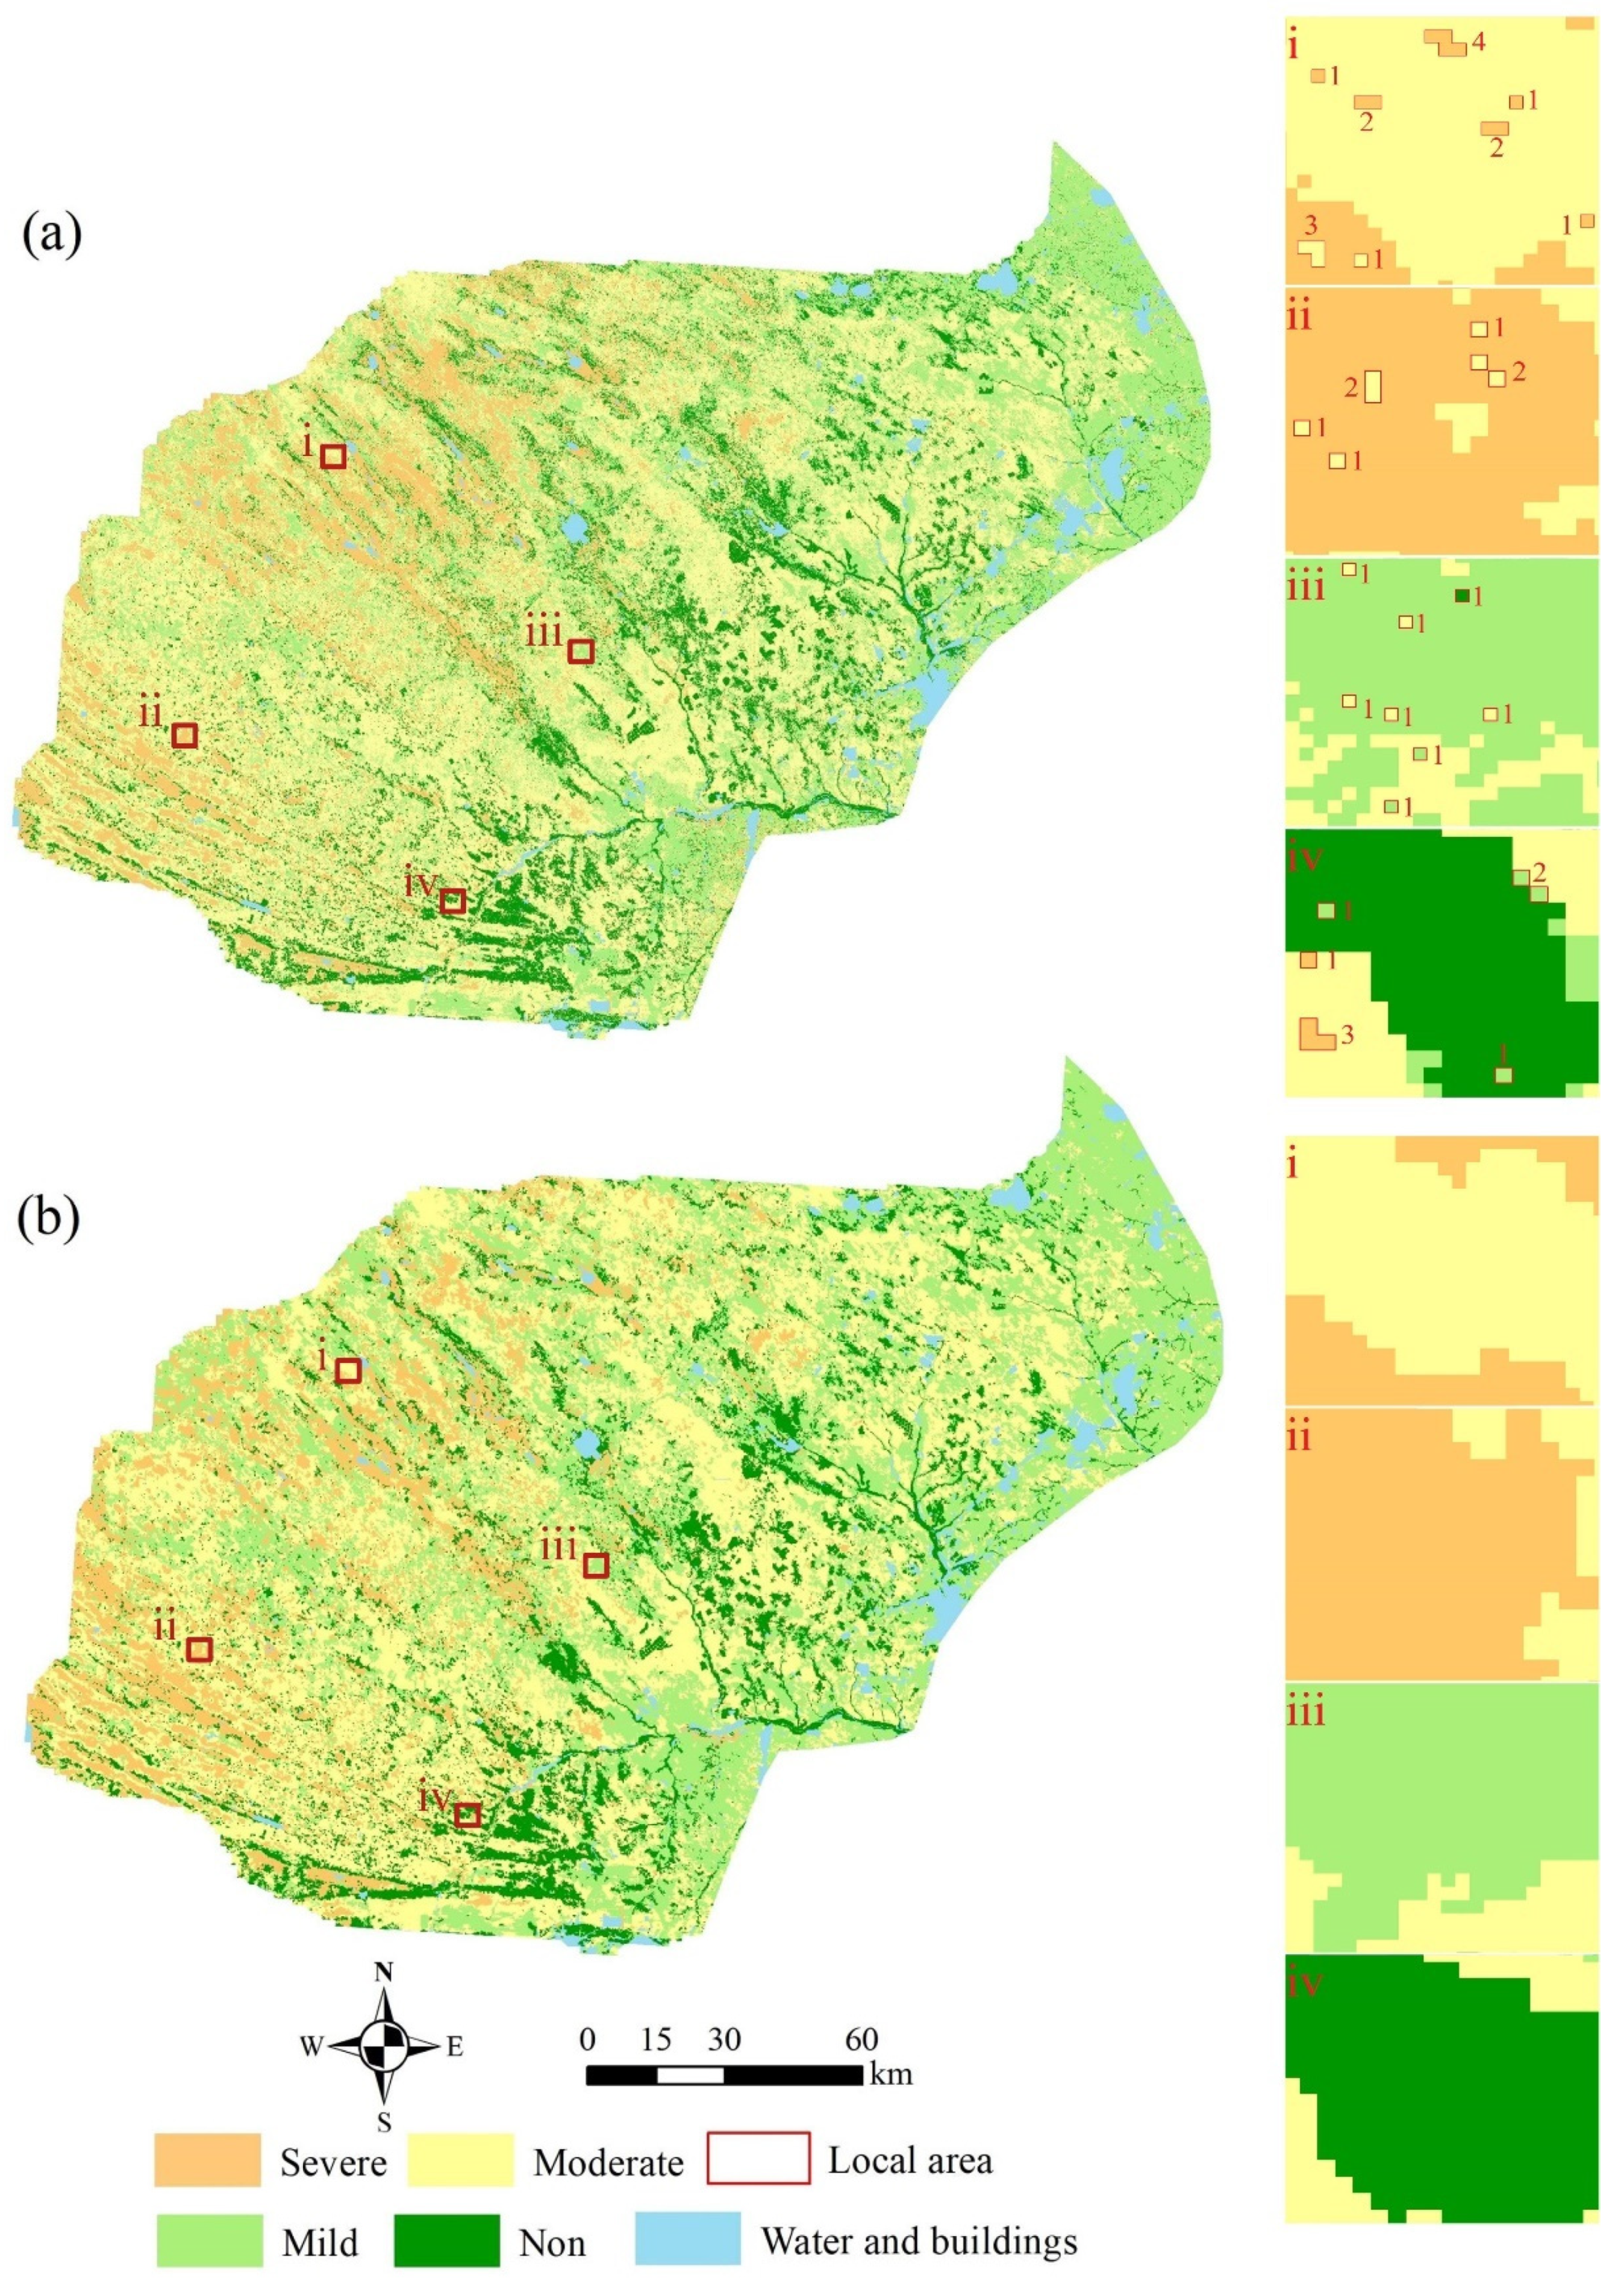
Random forest is a powerful machine learning classifier that has high classification accuracy [47]. Object-oriented classification was contrasted with pixel-based classification by using the random forest method based on the optimal segmented and pre-processed images we obtained in our study. Land desertification maps of the study area were also produced (Figure 5). The land-cover types were divided into four categories: non, mild, moderate, and severe desertification. Four zones (red-box areas) with different types of desertification were selected and magnified to investigate the advantages of the object-oriented method, and they are presented in Figure 5.
Four magnified zones presented in the pixel-based classification result presented a high number of small-landmass areas (Figure 5a, Zone ⅰ: moderate desertification, Zone ⅱ: severe desertification, Zone ⅲ: mild desertification, Zone ⅳ: non-desertification), representing the salt and pepper effect. Additionally, the commission and omission phenomenon also occurred. The number of small-landmass pixels was less than four. However, according to “The Fourth National Technical Provisions on Desertification and Desertification Monitoring”, the smallest area of the map should be controlled at approximately 4000 m2 on a regional scale when using remote sensing images to monitor the presence of sandy or desertified lands with a broken landmass-type of land and presenting artificial measurements. Therefore, the number of smallest-landmass pixels was higher than four when using remote sensing image data with a spatial resolution of 30 m for desertification information extraction purposes. There was no landmass less than five pixels evident in four magnified zones, as can be observed from the object-oriented classification result (Figure 5b). The salt and pepper effect was also evidently obviously reduced.
By performing a qualitative visual analysis, we determined that the extraction result for land desertification analysis using the object-oriented method was better than that of the pixel-based method. Compared with the pixel-based method, the object-oriented method utilizes the data obtained from the spectral features, spatial features, and thematic index information of each image object [20], which prevents a high salt and pepper effect during the pixel-based classification method [48]. Therefore, the object-oriented classification approach is more suitable for mapping when extracting the land desertification information required.

4.3. Validation of Desertification Classification Results

An accuracy assessment using the same verification sampling method selected from Google Earth high-resolution images was conducted to quantitatively evaluate the information extraction accuracy of the object-oriented and pixel-based methods used in the study. The producer accuracy (PA), user accuracy (UA), overall accuracy (OA), and Kappa coefficients were estimated using the confusion matrix presented in Table 4.
The overall accuracy of the pixel-based method was 83.22%, and the Kappa coefficient was 0.7686 (Table 4). The overall accuracy of the object-oriented method was 91.28%, of which the Kappa coefficient was 0.8800 (Table 5). This indicated that the land desertification classification accuracy of the object-oriented method was much higher than that of the pixel-based method. The producer accuracy of the pixel-based method was between 82.14% and 84.88%, while the user accuracy was between 67.65% and 98.89% (Table 4). The accuracy assessment indicated that the adjacent degree of the desertification type (severe and moderate desertification, moderate and mild desertification, mild and non-desertification) were easily incorrectly classified when using the pixel-based method. The producer accuracy of the object-oriented method was between 90.37% and 93.39%, and the user accuracy was between 83.06% and 97.85% (Table 5). However, the user accuracy of the mild desertification of the object-oriented method was 83.06%; as a result, some non- and moderate-desertification land-types were incorrectly classified as a mild desertification land-type. Generally, the misclassification and omission of different land-types significantly decreased. The use of the object-oriented classification method exhibited high accuracy when effectively classifying the land desertification types, and it could achieve the requirements of the research.

4.4. Spatial Distribution of Land Desertification Areas in Mu Us from 2001 to 2021

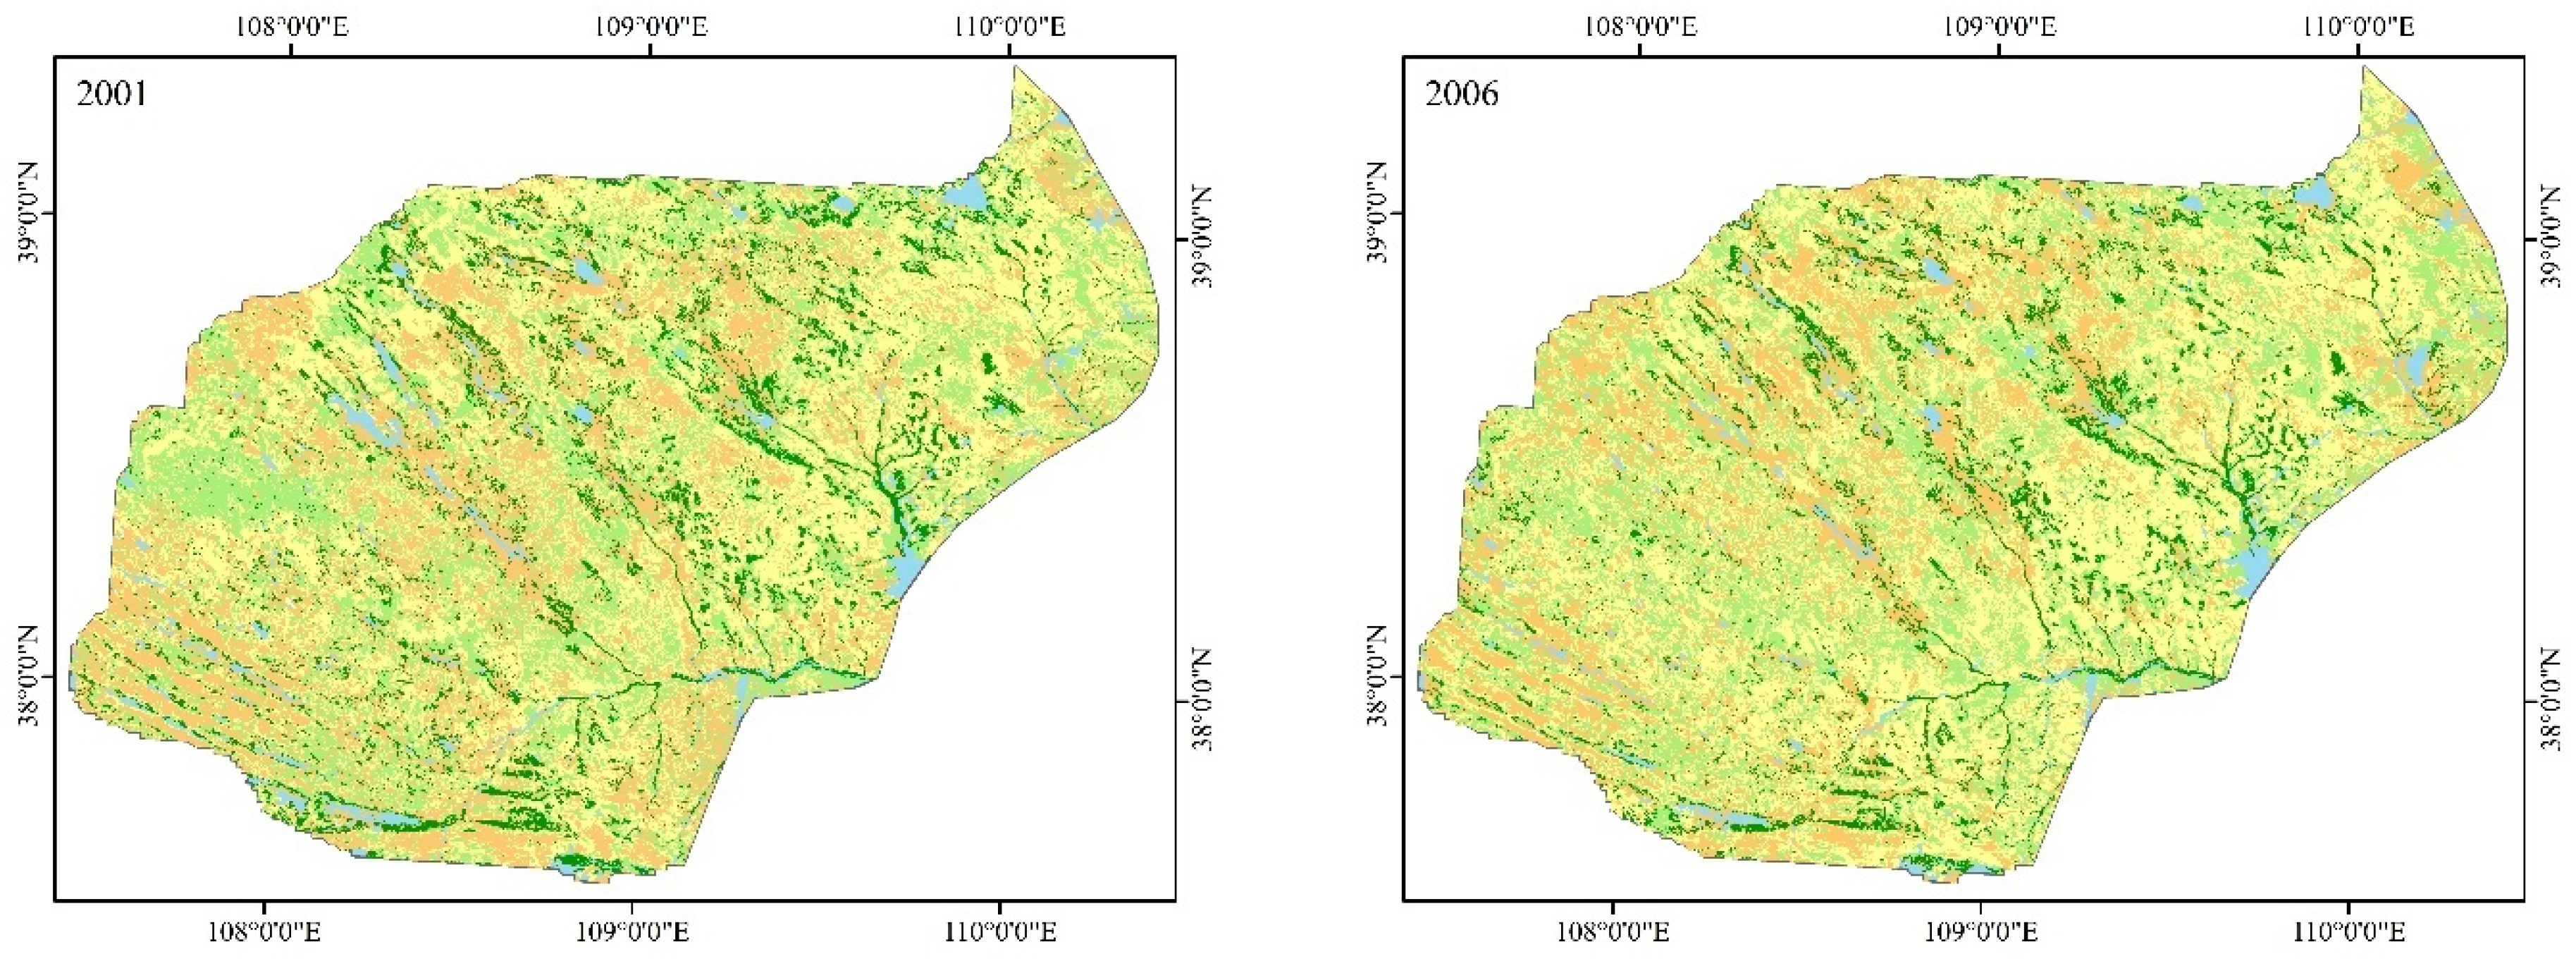
The object-oriented classification method was used to extract the land desertification information of the Mu Us area from 2001 to 2021. As illustrated in Table 6, it is clear that the desertification land area occupies more than 85% of the total area and most of the study area presented moderate desertification. Desertification maps were generated for five years (Figure 6), and the individual class area and change statistics for the five years are summarized in Table 6. The desertified areas in 2001 were moderate, severe, mild, and not desertified, in descending order. By the year 2021, the overall desertification status improved, and the desertified area decreased; in turn, it changed to moderate-, mild-, severe-, and non-desertification areas. From 2001 to 2021, the desertified area decreased from 26,910.36 to 26,323.24 km2 by approximately 587.12 km2, while the severe-desertification area decreased from 26.50% to 13.01% by 4115.92 km2, indicating a marked improvement. The mild-desertification area is increasing annually. The moderate-desertification area presented an expanding trend from 2001 to 2011 and gradually decreased in the last decade, while the non-desertification area showed the opposite trend.
According to the spatial distribution of desertified land (Figure 6), the overall area in the study location showed a trend of expanding first and then decreasing. Moderate desertification covers the most extensive areas. From 2001 to 2021, the eastern and southeastern regions of the Mu Us Desert, which are close to the water, have significantly decreased in terms of desertification, and the non- and mild-desertification areas have remarkably increased, while there still remain some moderate- and severe-desertification areas located in the western Gobi Desert.

4.5. Dynamic Changes in Desertification in Mu Us Desert from 2001 to 2021

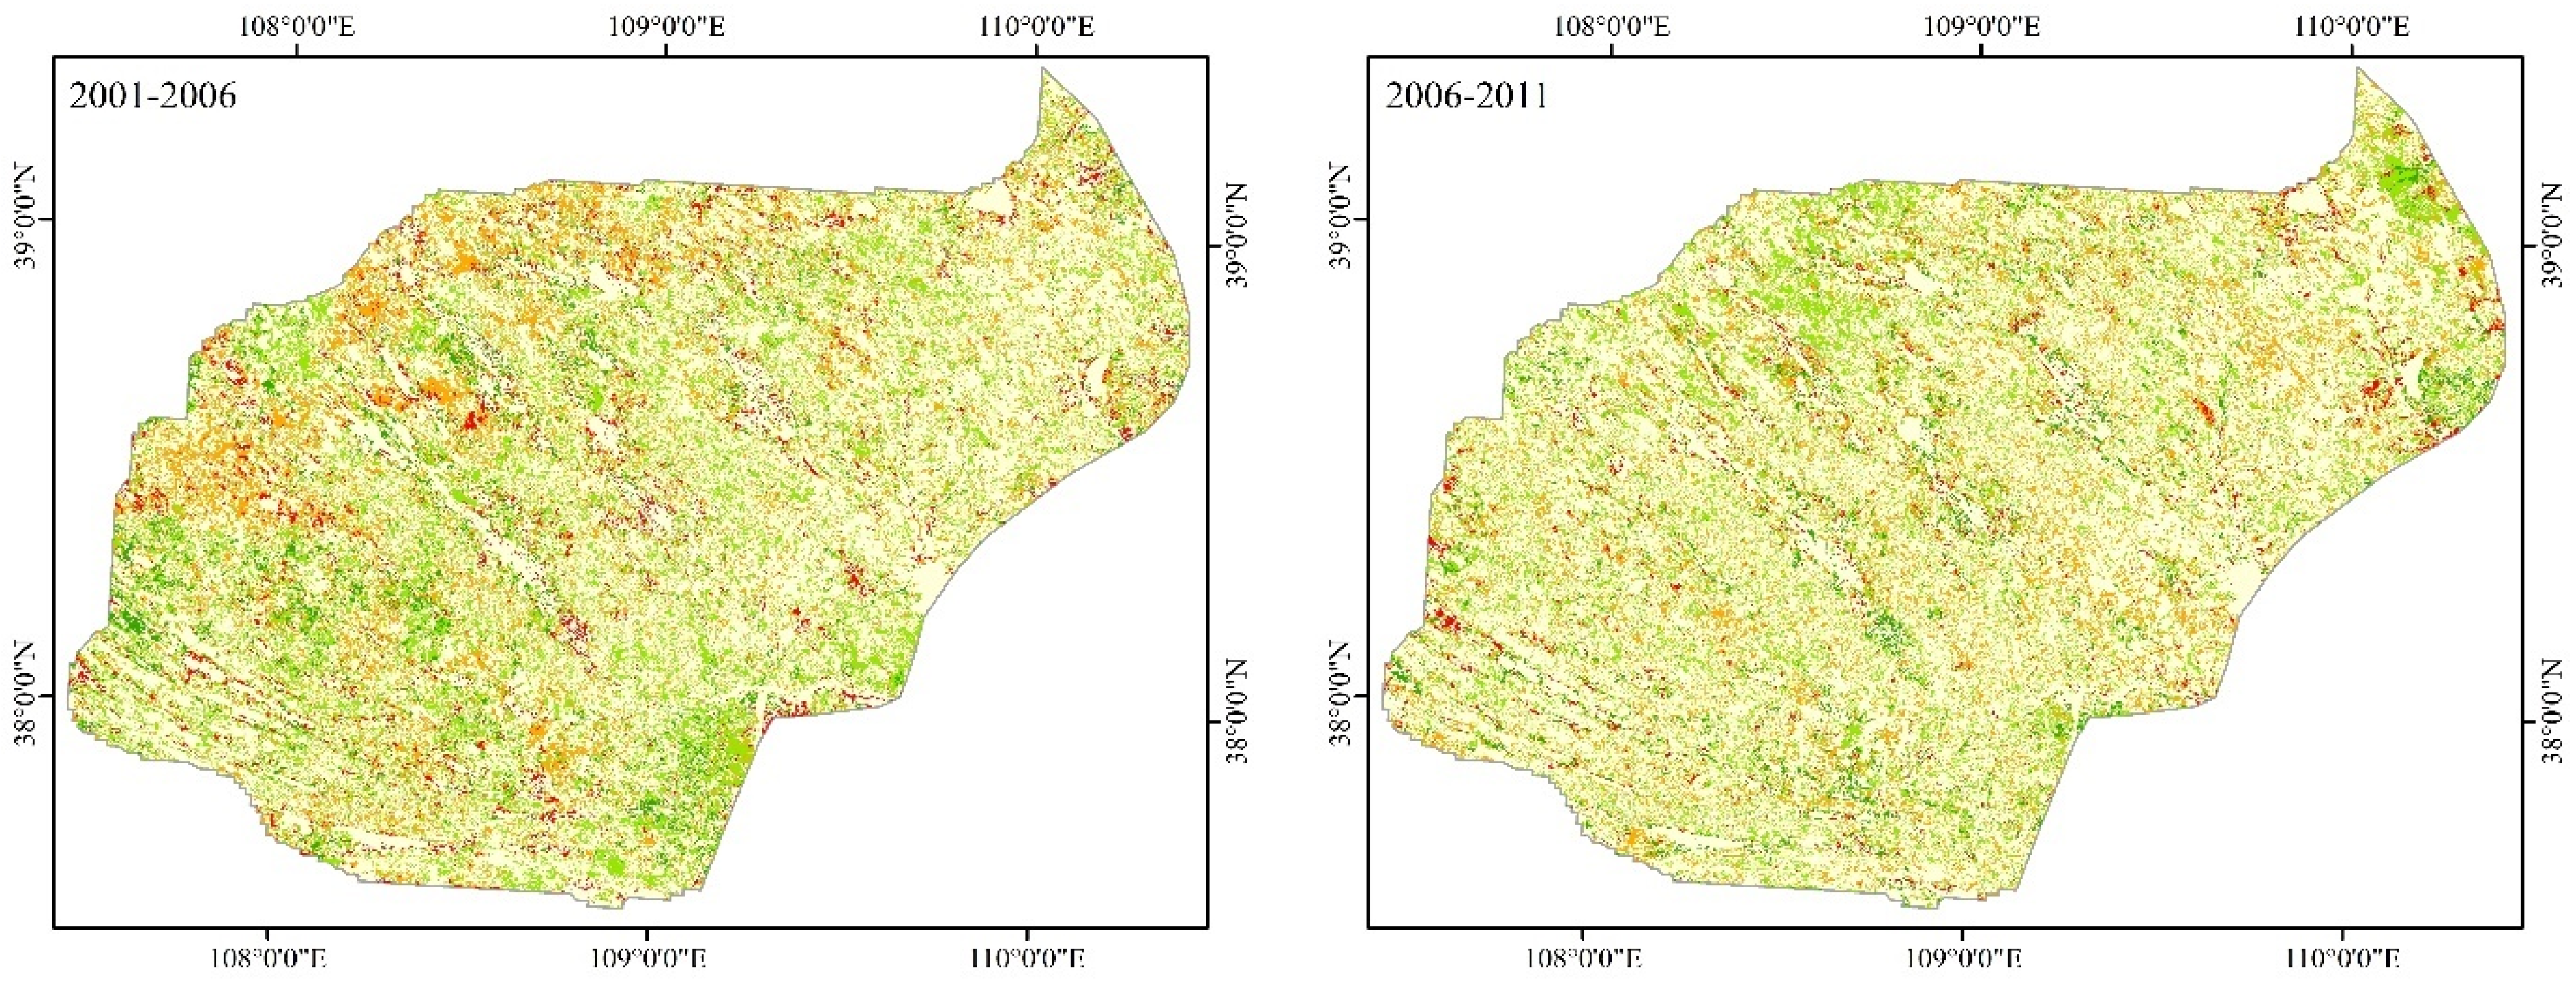
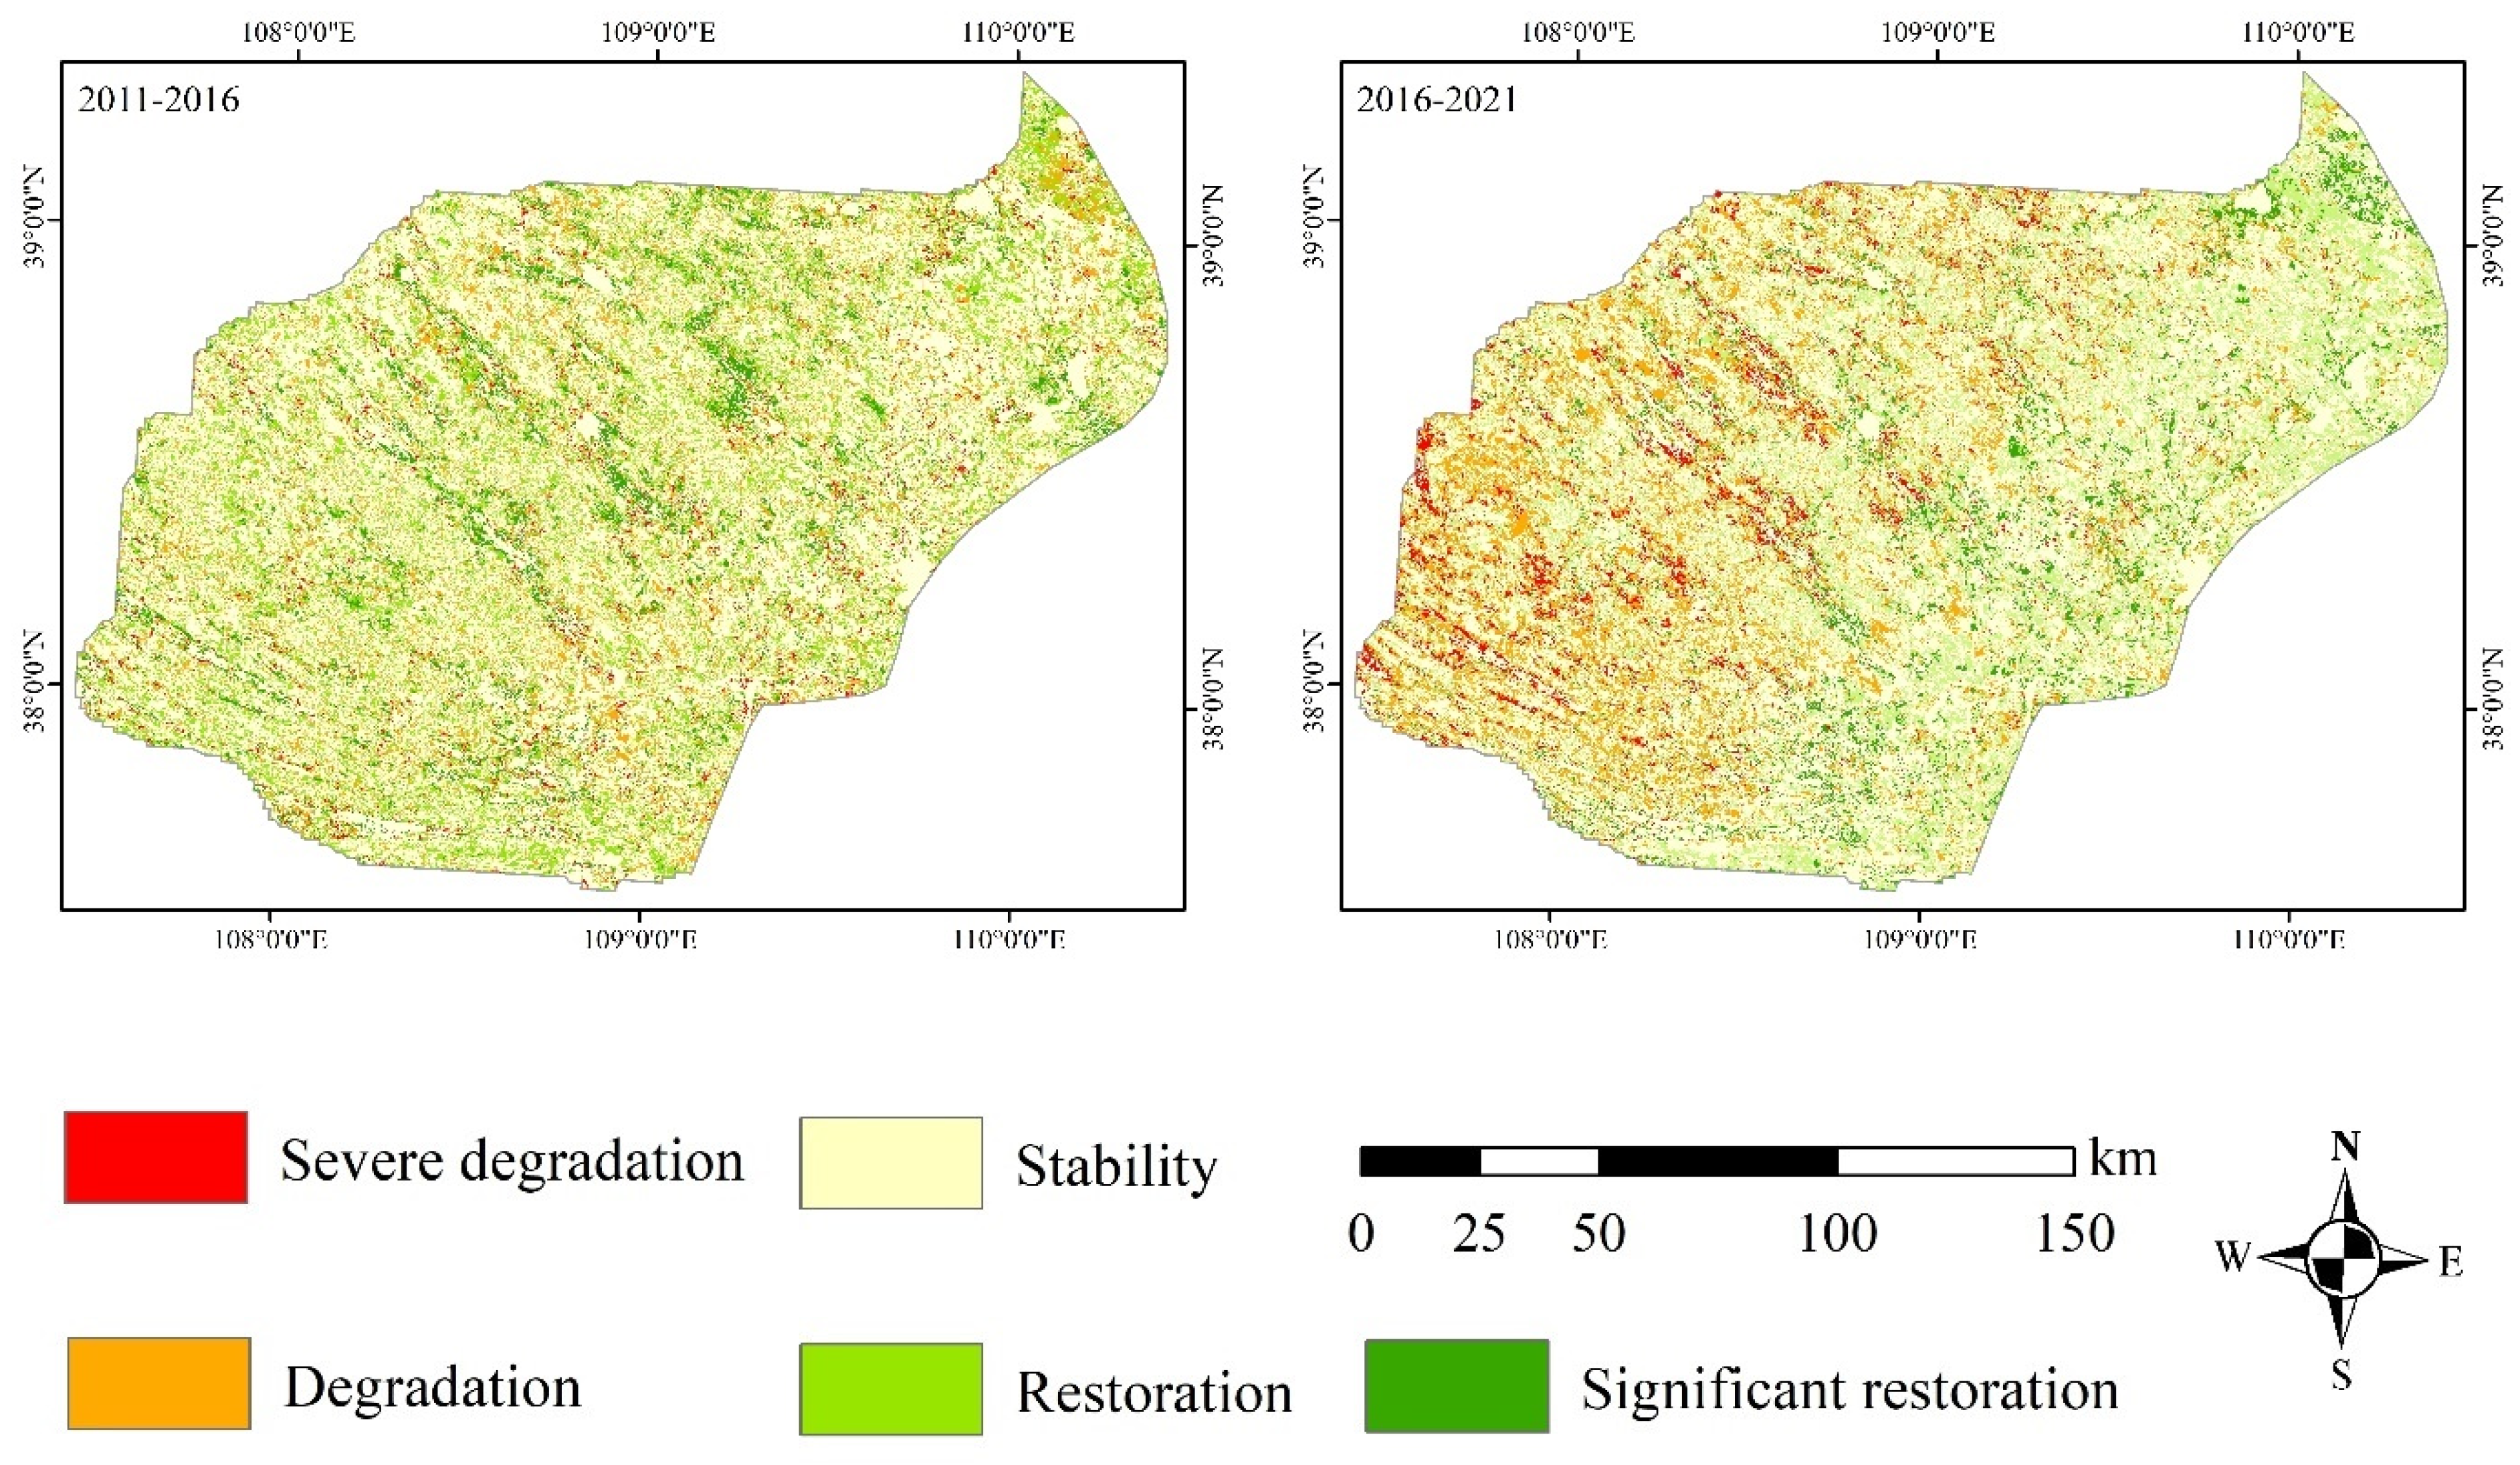
To further evaluate the results for the desertification conversions we obtained in this study, the changes occurring in desertified areas from 2001 to 2021 are summarized in Table 7. These results indicate that the area of restored, desertified land is larger than that of degraded land, and the area presenting stability is the largest, accounting for over 58%. From 2001 to 2016, the degraded areas decreased annually, while the stable and restored areas presented a fluctuating trend. By the year 2016, the degraded area was 3799.43 km2, accounting for 12.46% of the land, and the restored area was 6936.35 km2, accounting for 22.75%, showing the most significant improvement. From 2016 to 2021, the degraded area accounted for 18.77%, with a year-on-year increase of 6.31%, and the restored area accounted for 22.72%, showing little change. In the past five years, the overall recovery trend of land desertification in the Mu Us Desert has been relatively stable, while land degradation has occurred in the western Gobi Desert (Figure 7), indicating that the stability water-scarce areas was poor and the desertification process was repeated. Therefore, it is necessary to strengthen the governance of these areas by improving the availability of water resources.

5. Discussion

Desertification is a major obstacle to global sustainable development. The effective monitoring of desertification is particularly important for environmental protection and ecological restoration practices. In this study, object-oriented classification based on an optimal segmentation scale was used to obtain desertification information for the Mu Us Sandy Land Ecological Function Reserve from 2001 to 2021. Compared with the previous studies [49,50,51], the unit of analysis used in our study was not a single pixel, but a similar object with the same spectral, geometric, and thematic characteristics, which overcame the problems of spectral confusion and the salt and pepper phenomenon in sparse-vegetation areas.
Image segmentation is a special operation of object-oriented classification. The selection of a segmentation scale determines the size of the image objects and quality of the classification results; therefore, it is very important to select the appropriate segmentation scale. In previous studies, some scholars have tried to use object-oriented classification methods to extract desertified land information, and the classification results were significantly improved. However, the selection of a segmentation scale mainly relies on repeated visual comparisons, which causes increased subjective interference; therefore, classification accuracy may be improved further [52]. In this study, the mean variance and maximum area methods were used to determine the optimal segmentation scale of 140 in the study area, which can avoid over-segmentation and under-segmentation behaviors, to a certain extent, and reduce the influence of human interference. In a study conducted on Hunshandak Sandy Land [53], Li et al. presented an optimal segmentation scale for extracting vegetation types, such as arbors and shrubs, which was determined to be 145 by the ESP2 tool of eCognition software, while the optimal segmentation scale for only extracting sandy land was 200. This effect is similar to the optimal scale determined in this study when the land class of the vegetation, such as grassland, was classified as non-desertification land to participate in the segmentation process, indicating that the optimal segmentation scale for land desertification determined by this method presents a certain level of reliability.
In fact, in the process of segmentation, the determination of the optimal scale was affected by several factors. The different selection methods, the setting of the segmentation parameters, the type of ground objects present in the study area, and the resolution of the remote sensing images led to differences in the results [41]. Based on the Landsat images, Song et al. used the object-oriented method to extract ground feature information for the desertification area in the northwestern Liaoning Province and determined the optimal segmentation scale of vegetation types as 135 by using the mean variance method [54]. Gao et al. used the GF-2 image to identify shelterbelts in the desert oasis area of Dengkou County. When the segmentation scale of shelterbelts in this area was determined as 82 by using the ESP2 tool, the segmentation effect of the image was the best [55]. In addition, the optimal segmentation scale is closely related to the spatial resolution of the image. Generally speaking, the higher the spatial resolution, the smaller the corresponding optimal segmentation scale, and the better the segmentation effect; however, this does not mean that the classification accuracy will be higher. Lian and Chen used the object-oriented method in their study to classify the ground objects of images with different resolutions and observed that the classification accuracy of SPOT images with a resolution of 2.5 m was higher than that of Quick Bird images with a resolution of 0.6 m. Classification accuracy and spatial resolution do not simply have a linear relationship [56]. Similar conclusions were determined in the study conducted by Jiang et al. [57]. It was observed that the optimal segmentation scale was not completely consistent when providing results for different regions, research objects, and resolutions.
Although similar studies exist that are concerned with the dynamics of desertification in the study region, this study has provided long-term mapping trends of desertified land since 2001. It is helpful to comprehensively analyze the change in desertified areas and explore the spatial characteristics of the distribution of desertified areas, which has rarely been analyzed in previous studies. To effectively identify the different types of severe-, moderate-, and mild-desertification areas, the spectral, spatial, and thematic index features were selected to construct feature spaces, and the random forest algorithm was used to classify the desertification degree based on these features. Compared with the pixel-based classification method, the overall mapping accuracy of this method increased by 8.06%, and the Kappa coefficient increased by 0.1114. The mapping accuracy significantly improved for different degrees of desertification. In the relevant research of this region [58], since 2000, land desertification has been mainly moderate and severe and has gradually changed to moderate and mild. The area of moderate desertification increased first and then decreased, the area of mild desertification increased annually, and the area of severe desertification decreased annually, which is the same pattern presented for the land desertification activity observed in the present study. In addition, the spatial distribution of desertified land was consistent with the research results obtained by Wang et al. [49]; the change in desertification in the southeast region was more stable than that in the northwest, due to climate and topographic factors, as well as human activity, and the research results are reliable. In general, this research method meets the requirements of the classification of land desertification degree, at present, and can provide methodological support for the monitoring of desertification in the future.
However, there are certain issues that should be considered in future analyses. From the perspective of classification accuracy, whether pixel-based or object-oriented methods are employed, the classification accuracy of mild- and moderate-desertification areas is lower than that of non- and severe-desertification areas (Table 4 and Table 5). The main reason for this is that the characteristics between mild and moderate, and moderate and severe are relatively similar, which makes it difficult to perform the classification; therefore, some misclassifications may occur [59]. Future studies should consider improving this consequence through spectral information enhancement [60]. At the same time, the determination of the optimal segmentation scale is affected by several factors; whereas the method we utilized could effectively extract land desertification data, its robustness was not tested in other regions [5]. Therefore, for different desertified areas, the selection of remote sensing data with appropriate resolutions, a reasonable determination of the desertification segmentation scale, and the extraction of desertification information should also be key factors in the research conducted in the future.

6. Conclusions

In view of the deficiencies of pixel-based land desertification information extraction, this study combined the mean variance and maximum area methods to determine the optimal segmentation scale and adopted the object-oriented random forest algorithm to obtain the land desertification information for the Mu Us Sandy Land Ecological Function Reserve from 2001 to 2021.
In the segmentation process, when there are multiple segmentation scales, a smaller segmentation scale should be selected as the optimal scale. Compared with the pixel-based classification method, the overall accuracy of object-oriented classification based on the optimal segmentation scale was improved by 8.06%, the Kappa coefficient was increased by 0.1114, and the salt and pepper phenomenon was significantly reduced. From 2001 to 2021, the area of desertified land decreased by 587.12 km2 and the area of severely desertified land decreased by 4115.92 km2. The governance effect was remarkable. In the past ten years, the restoration rate of the entire area increased by 22% in the whole area, while the restored effect of the western Gobi Desert was not satisfied. The climate and topographic factors were the main reasons for land desertification, and human activities also aggravated the desertification process. Enhanced measurements are required for further successful governance in the future. This study explored the application of the object-oriented classification method and the optimal segmentation scale for obtaining land desertification information for the study area. The results show a significant improvement in the desertification classification accuracy. The long-term-mapping results provide effective decision-making ideas and support for land desertification restoration and management projects.

Author Contributions

L.H. conceived and designed the research ideas; Z.Z., X.W., G.S. and S.W. collected the data; J.H. and H.M. carried out experiments and analysis; J.H. and L.H. wrote the manuscript. All authors have read and agreed to the published version of the manuscript.

Funding

This research was supported by the Guangdong Academy of Sciences to build a domestic first-class research institutions special fund project (2019GDASYL-0103003), Natural Science Foundation of Shandong Province (ZR2020MD018 and ZR2020MD015) and National Natural Science Foundation of China (Grant No. 42171413).

Institutional Review Board Statement

Not applicable.

Informed Consent Statement

Not applicable.

Data Availability Statement

Landsat 8 OLI and Landsat 5 TM remote sensing data for this study were obtained from the United States Geological Survey (https://earthexplorer.usgs.gov, accessed on 15 January 2022).

Conflicts of Interest

The authors declare no conflict of interest.

References

  1. Zhou, R.P. Zonation and spatiotemporal evolution of China’s desertification. J. Geo-Inf. Sci. 2019, 21, 675–687. [Google Scholar] [CrossRef]
  2. Gebru, B.M.; Lee, W.K.; Khamzina, A.; Wang, W.S.; Cha, S.; Song, C.; Munkhansan, L. Spatiotemporal multi-index analysis of desertification in dry Afromontane forests of northern Ethiopia. Environ. Dev. Sustain. 2021, 23, 423–450. [Google Scholar] [CrossRef]
  3. Wei, W.; Guo, Z.C.; Shi, P.J.; Zhou, L.; Wang, X.F.; Li, Z.Y.; Pang, S.F.; Xie, B.B. Spatiotemporal changes of land desertification sensitivity in northwest China from 2000 to 2017. J. Geogr. Sci. 2021, 31, 46–68. [Google Scholar] [CrossRef]
  4. Bai, Z.F.; Han, L.; Jiang, X.H.; Liu, M.; Li, L.Z.; Liu, H.Q.; Lu, J.X. Spatiotemporal evolution of desertification based on integrated remote sensing indices in Duolun County, Inner Mongolia. Ecol. Infor. 2022, 70, 101750. [Google Scholar] [CrossRef]
  5. Zhan, Q.Q.; Zhao, W.; Yang, M.J.; Xiong, D.H. A long-term record (1995–2019) of the dynamics of land desertification in the middle reaches of Yarlung Zangbo River basin derived from Landsat data. Geogr. Sustain. 2021, 2, 12–21. [Google Scholar] [CrossRef]
  6. Zhao, Y.Y.; Gao, G.L.; Qin, S.G.; Yu, M.H.; Ding, G.D. Desertification detection and the evaluation indicators: A review. J. Arid Land Resour. Environ. 2019, 33, 81–87. [Google Scholar] [CrossRef]
  7. Feng, X.W.; Wu, G.X.; Wang, T.J.; Chai, Z.F. Sandy desertification process and dynamic assessment in Hunshandake sandland. J. Arid Land Resour. Environ. 2020, 34, 109–116. [Google Scholar] [CrossRef]
  8. Liu, C.; Li, C.Z.; Li, S.H.; Fu, X.L.; Shi, Q.D. Desertification analysis based on grid accumulation method in Tarim Basin, China. Arid Land Geogr. 2021, 44, 197–207. [Google Scholar] [CrossRef]
  9. Wu, Z.H.; Lei, S.G.; Bian, Z.F.; Huang, J.; Zhang, Y. Study of the desertification index based on the albedo-MSAVI feature space for semi-arid steppe region. Environ. Earth Sci. 2019, 78, 232. [Google Scholar] [CrossRef]
  10. Lamchin, M.; Lee, J.Y.; Lee, W.K.; Lee, J.E.; Kim, M.; Lim, H.C.; Choi, H.A.; Kim, S.O. Assessment of land cover change and desertification using remote sensing technology in a local region of Mongolia. Adv. Space Res. 2016, 57, 64–77. [Google Scholar] [CrossRef]
  11. Wang, S.X.; Han, L.S.; Yang, J.; Li, Y.; Zhao, Q.; Liu, Y.X.Y.; Wu, H. An improved method of combining multi-indicator desertification classification. Bull. Surv. Mapp. 2021, 0, 8–12. [Google Scholar] [CrossRef]
  12. Abduljabbar, H.M.; Hatem, A.J.; Al-Jasim, A.A.N. Desertification monitoring in the south-west of Iraqi using fuzzy inference system. NeuroQuantology 2020, 18, 1. [Google Scholar] [CrossRef]
  13. Eskandari Dameneh, H.; Gholami, H.; Telfer, M.W.; Comino, J.R.; Collins, A.L.; Jansen, J.D. Desertification of Iran in the early twenty-first century: Assessment using climate and vegetation indices. Sci. Rep. 2021, 11, 20548. [Google Scholar] [CrossRef]
  14. Rouibah, K.; Belabbas, M. Applying multi-index approach from Sentinel-2 imagery to extract Urban area in dry season (semi-arid land in north east Algeria). Rev. De Teledetección 2020, 56, 89–101. [Google Scholar] [CrossRef]
  15. Vendruscolo, J.; Marin, A.M.; dos Santos Felix, E.; Ferreira, K.R.; Cavalheiro, W.C.S.; Fernandes, I.M. Monitoring desertification in semiarid Brazil: Using the desertification degree index (DDI). Land Degrad. Dev. 2021, 32, 684–698. [Google Scholar] [CrossRef]
  16. Fan, Z.M.; Li, S.B. Spatio-temporal pattern change of desertification and its driving factors analysis in China-Mongolia-Russia economic corridor. Acta Ecol. Sin. 2020, 40, 4252–4263. [Google Scholar] [CrossRef]
  17. Wei, W.; Yu, X.; Zhang, M.Z.; Zhang, J.; Yuan, T.; Liu, C.F. Dynamics of desertification in the lower reaches of Shiyang River Basin, Northwest China during 1995–2018. Chin. J. Appl. Ecol. 2021, 32, 2098–2106. [Google Scholar] [CrossRef]
  18. Wei, H.S.; Wang, J.L.; Cheng, K.; Li, G.; Ochir, A.; Davaasuren, D.; Chonokhuu, S. Desertification information extraction based on feature space combinations on the mongolian plateau. Remote Sens. 2018, 10, 1614. [Google Scholar] [CrossRef] [Green Version]
  19. Liu, Z.J. Vegetation Extraction Method Using UAN Remote Sensing Image. Master’s Thesis, Henan University, Zhengzhou, China, 2017. [Google Scholar]
  20. Zhan, Q.Q.; Zhao, W.; Yang, M.J.; Fu, H.; Li, X.J.; Xiong, D.H. Identification of sandy land in the midstream of the Yarlung Zangbo River. J. Geo-Inf. Sci. 2022, 24, 391–404. [Google Scholar] [CrossRef]
  21. Nie, Q.; Qi, K.K.; Zhao, Y.F. Object-oriented classification of high-resolution image combining super-pixel segmentation. Bull. Surv. Mapp. 2021, 0, 44–49. [Google Scholar] [CrossRef]
  22. Liu, J.L.; Chen, Z.; Gao, J.P.; Gao, X.L.; Sun, Z.Q. Research on the method of determining the optimal segmentation scale for tree species classification of high-resolution image. Sci. Silvae Sin. 2019, 55, 95–104. [Google Scholar] [CrossRef]
  23. Peng, J.Y.; Wang, X.J.; Zhu, L.; Zhao, C.Y.; Xu, X.L. Information extraction of desert surface types based on UAV image. Arid Zone Res. 2019, 36, 771–780. [Google Scholar] [CrossRef]
  24. Wen, X.; Jia, M.M.; Li, X.Y.; Wang, Z.M.; Zhong, C.R.; Feng, E.H. Identification of mangrove canopy species based on visible unmanned aerial vehicle images. J. For. Environ. 2020, 40, 486–496. [Google Scholar] [CrossRef]
  25. Zhu, H.; Cai, L.; Liu, H.; Huang, W. Information extraction of high resolution remote sensing images based on the calculation of optimal segmentation parameters. PLoS ONE 2016, 11, e0158585. [Google Scholar] [CrossRef] [Green Version]
  26. Li, Z.; Han, W.C.; Hu, Q.Y.; Gao, X.; Wang, L.L.; Xiao, F.; Liu, W.C.; Guo, W.H.; Sun, D.F. Land use/cover classification based on combining spectral mixture analysis model and object-oriented method. Trans. Chin. Soc. Agric. Eng. 2021, 37, 225–233. [Google Scholar] [CrossRef]
  27. Zheng, H.R.; Luo, H.X.; Xiang, H.Y.; Cheng, Y.S.; Yang, R.F.; Cheng, Q.Y. Research on vegetation information extraction and distribution characteristics of rocky desertification area by means of object oriented approach. Resour. Environ. Yangtze Basin 2018, 27, 648–657. [Google Scholar] [CrossRef]
  28. Lu, C.; Liu, J.; Jia, M.; Liu, M.; Man, W.; Fu, W.; Zhong, L.; Lin, X.; Su, Y.; Gao, Y. Dynamic analysis of mangrove forests based on an optimal segmentation scale model and multi-seasonal images in quanzhou bay, China. Remote Sens. 2018, 10, 2020. [Google Scholar] [CrossRef] [Green Version]
  29. Zhang, W.; Liu, Y.; Shao, J.A. Farmland recognition and extraction based on object-oriented classification. J. Irrig. Drain. 2019, 38, 121–128. [Google Scholar] [CrossRef]
  30. Wang, X.; Diao, Z.Y.; Zheng, Z.R.; Jin, S.L.; Ma, P.; Lv, S.H. Temporal and spatial dynamics of desertification in adjacent steppe of China and Mongolia. Res. Environ. Sci. 2021, 34, 2935–2944. [Google Scholar] [CrossRef]
  31. Wang, Y.; Liu, X.M.; Hasi, E.R.D. Spatiotemporal differentiation and driving factors of coupling coordination degree of economic-ecological-social benefits from desertification control in the Mu Us Sandy Land. Resour. Sci. 2022, 44, 1224–1237. [Google Scholar] [CrossRef]
  32. Duan, Y.Z.; Li, J.; Du, Z.Y.; Kang, F.R. Analysis of biodiversity and flora characteristics of natural plants in Mu Us Sandy Land. Acta Bot. Boreali-Occident. Sin. 2018, 38, 770–779. [Google Scholar] [CrossRef]
  33. Xu, Z.W.; Lu, H.Y. Aeolian environmental change studies in the Mu Us Sandy Land, north-central China: Theory and recent progress. Acta Geogr. Sin. 2021, 76, 2203–2223. [Google Scholar] [CrossRef]
  34. Yue, Y.J.; Gong, J.H.; Wang, D.C. The extraction of water information based on SPOT5 image using object-oriented method. In Proceedings of the 2010 18th International Conference on Geoinformatics, Beijing, China, 18 June 2010. [Google Scholar] [CrossRef]
  35. Liu, G.F. A Study on Desertification Monitoring and the Impact of Settle Grazing in Mu Us Sandland. Master’s Thesis, Northeast Forestry University, Harbin, China, 2007. [Google Scholar]
  36. Ministry of Natural Resources of the People’s Republic of China. General Principles of Regional Environmental Geological Survey; Geological Survey: Beijing, China, 2004. Available online: https://www.mnr.gov.cn/gk/bzgf/201011/t20101119_1971770.html (accessed on 6 May 2022).
  37. Liu, X.Y. Land Desertification Trend Research Based on Remote Sensing Technology Take Inner Mongolia Autonomous Region as an Example. Master’s Thesis, Chang’an University, Xian, China, 2018. [Google Scholar]
  38. He, M.; Zhang, W.J.; Wang, W.H. Optimal segmentation scale model based on Object-oriented analysis method. J. Geod. Geodyn. 2009, 29, 106–109. [Google Scholar] [CrossRef]
  39. Lu, H.; Liu, C.; Li, N.W.; Fu, X.; Li, L.G. Optimal segmentation scale selection and evaluation of cultivated land objects based on high-resolution remote sensing images with spectral and texture features. Environ. Sci. Pollut. Res. 2021, 28, 27067–27083. [Google Scholar] [CrossRef] [PubMed]
  40. Huang, H.P. Scale Issues in Object-Oriented Image Analysis. Ph.D. Thesis, University of Chinese Academy of Sciences, Beijing, China, 2003. [Google Scholar]
  41. Chen, C.L.; Wu, G. Evaluation of optimal segmentation scale with object-oriented method in remote sensing. Remote Sens. Technol. Appl. 2011, 26, 96–102. [Google Scholar] [CrossRef]
  42. Liang, W.Q.; Tian, S.F.; Zhou, J.J. Comprehensive assessment of desertification status based on remote sensing and principle component analysis. Arid Zone Res. 2015, 32, 342–346. [Google Scholar] [CrossRef]
  43. Yang, M.Y. Spatial Change and Driving Force Analysis of Desert Land in Aba Prefecture Based on Remote Sensing Data. Master’s Thesis, China West Normal University, Nanchong, China, 2019. [Google Scholar]
  44. Breiman, L. Random forests. Mach. Learn. 2001, 45, 5–32. [Google Scholar] [CrossRef] [Green Version]
  45. Wang, M.; Zhang, X.C.; Wang, J.Y.; Sun, Y.; Jian, G.; Pan, C. Forest resource classification based on random forest and object oriented method. Acta Geod. Cartogr. Sin. 2020, 49, 235–244. [Google Scholar] [CrossRef]
  46. Castilla, G.; Hay, G.J. Image objects. In Object-Based Image Analysis; Blaschke, T., Lang, S., Hay, G.J., Eds.; Springer: Berlin, Germany, 2008; pp. 91–110. [Google Scholar] [CrossRef]
  47. Yu, Y.; Li, M.; Fu, Y. Forest type identification by random forest classification combined with SPOT and multitemporal SAR data. J. For. Res. 2018, 29, 1407–1414. [Google Scholar] [CrossRef]
  48. Adam, H.E.; Csaplovics, E.; Elhaja, M.E.; Adam, H.E.; Csaplovics, E.; Elhaja, M.E. A comparison of pixel-based and object-based approaches for land use land cover classification in semi-arid areas, Sudan. In IOP Conference Series: Earth and Environmental Science; IOP Publishing: Bristol, UK, 2016; Csaplovics, E.; Volume 37, p. 012061. [Google Scholar] [CrossRef]
  49. Wang, X.; Song, J.l.; Xiao, Z.Q.; Wang, J.; Hu, F.Z. Desertification in the Mu Us Sandy Land in China: Response to climate change and human activity from 2000 to 2020. Geogr. Sustain. 2022, 3, 177–189. [Google Scholar] [CrossRef]
  50. Liu, Q.F.; Zhang, Q.; Yan, Y.Z.; Zhang, X.F.; Niu, J.M.; Svenning, J.C. Ecological restoration is the dominant driver of the recent reversal of desertification in the Mu Us Desert (China). J. Clean. Prod. 2020, 268, 122241. [Google Scholar] [CrossRef]
  51. Yu, X.W.; Zhuo, Y.; Liu, H.M.; Wang, Q.; Lu, W.; Li, Z.Y.; Liang, C.Z.; Wang, L.X. Degree of desertification based on normalized landscape index of sandy lands in inner Mongolia, China. Glob. Rcol. Conserv. 2020, 23, e01132. [Google Scholar] [CrossRef]
  52. Hua, Y.C.; Li, Z.Y.; Gao, Z.H. Extraction of sand information using object-oriented segmentation combined with the decomposition of mixed pixels. Arid Zone Res. 2020, 37, 1346–1352. [Google Scholar] [CrossRef]
  53. Li, Y.J.; Zhang, L. Sandy land monitoring method based on classification index model. J. Geo-Inf Sci. 2021, 23, 680–691. [Google Scholar] [CrossRef]
  54. Song, W.D.; Zhang, Y.N.; Gao, L.; Zhen, Y. The extraction and classification of Liaoning northwest desertification information based on Object-oriented and decision-making model. J. Liaoning Technical. Univ. 2018, 37, 595–601. [Google Scholar] [CrossRef]
  55. Gao, F.; Jiang, Q.O.; Xin, Z.M.; Xiao, H.J.; Lv, K.X.; Qiao, Z. Extraction method of oasis shelterbelt systems based on remote-sensing images—A case study of Dengkou county. Spectrosc. Spectral. Anal. 2022, 42, 3896–3905. [Google Scholar] [CrossRef]
  56. Lian, L.; Chen, J.F. Research on segmentation scale of multi-resources remote sensing data based on object-oriented. Procedia Earth Planet. Sci. 2011, 2, 352–357. [Google Scholar] [CrossRef] [Green Version]
  57. Jiang, M.; Chen, X.W.; Wu, C.C.; Zhang, Q.; Tao, Y.C. Study on multi-scale segmentation of high-resolution aerial and satellite images. J. Geo-Inf. Sci. 2007, 5, 115–120. [Google Scholar]
  58. Han, X.Y.; Yang, G.; Qin, F.C.; Jia, G.P.; Ling, X.; Gao, G. Spatial and temporal dynamic patterns of sandy land in Mu Us in the last 30 years. Res. Soil Water Conserv. 2019, 26, 144–150. [Google Scholar] [CrossRef]
  59. Li, L.; Wang, A.H.; Chi, Y.B.; Wang, Z.Y. The research on desertification land extraction based on object-oriented method. In Proceedings of the International Archives of the Photogrammetry Remote Sensing and Spatial Information Sciences, XXI ISPRS Congress, Commission VIII, Beijing, China, 3–11 July 2008. [Google Scholar]
  60. Zhang, G.H.; Wang, X.J.; Xu, X.L.; Yan, L.N.; Chang, M.D.; Li, Y.K. Desert vegetation classification based on object-oriented UAV remote sensing images. J. Agric. Sci. Technol. 2021, 23, 69–77. [Google Scholar] [CrossRef]
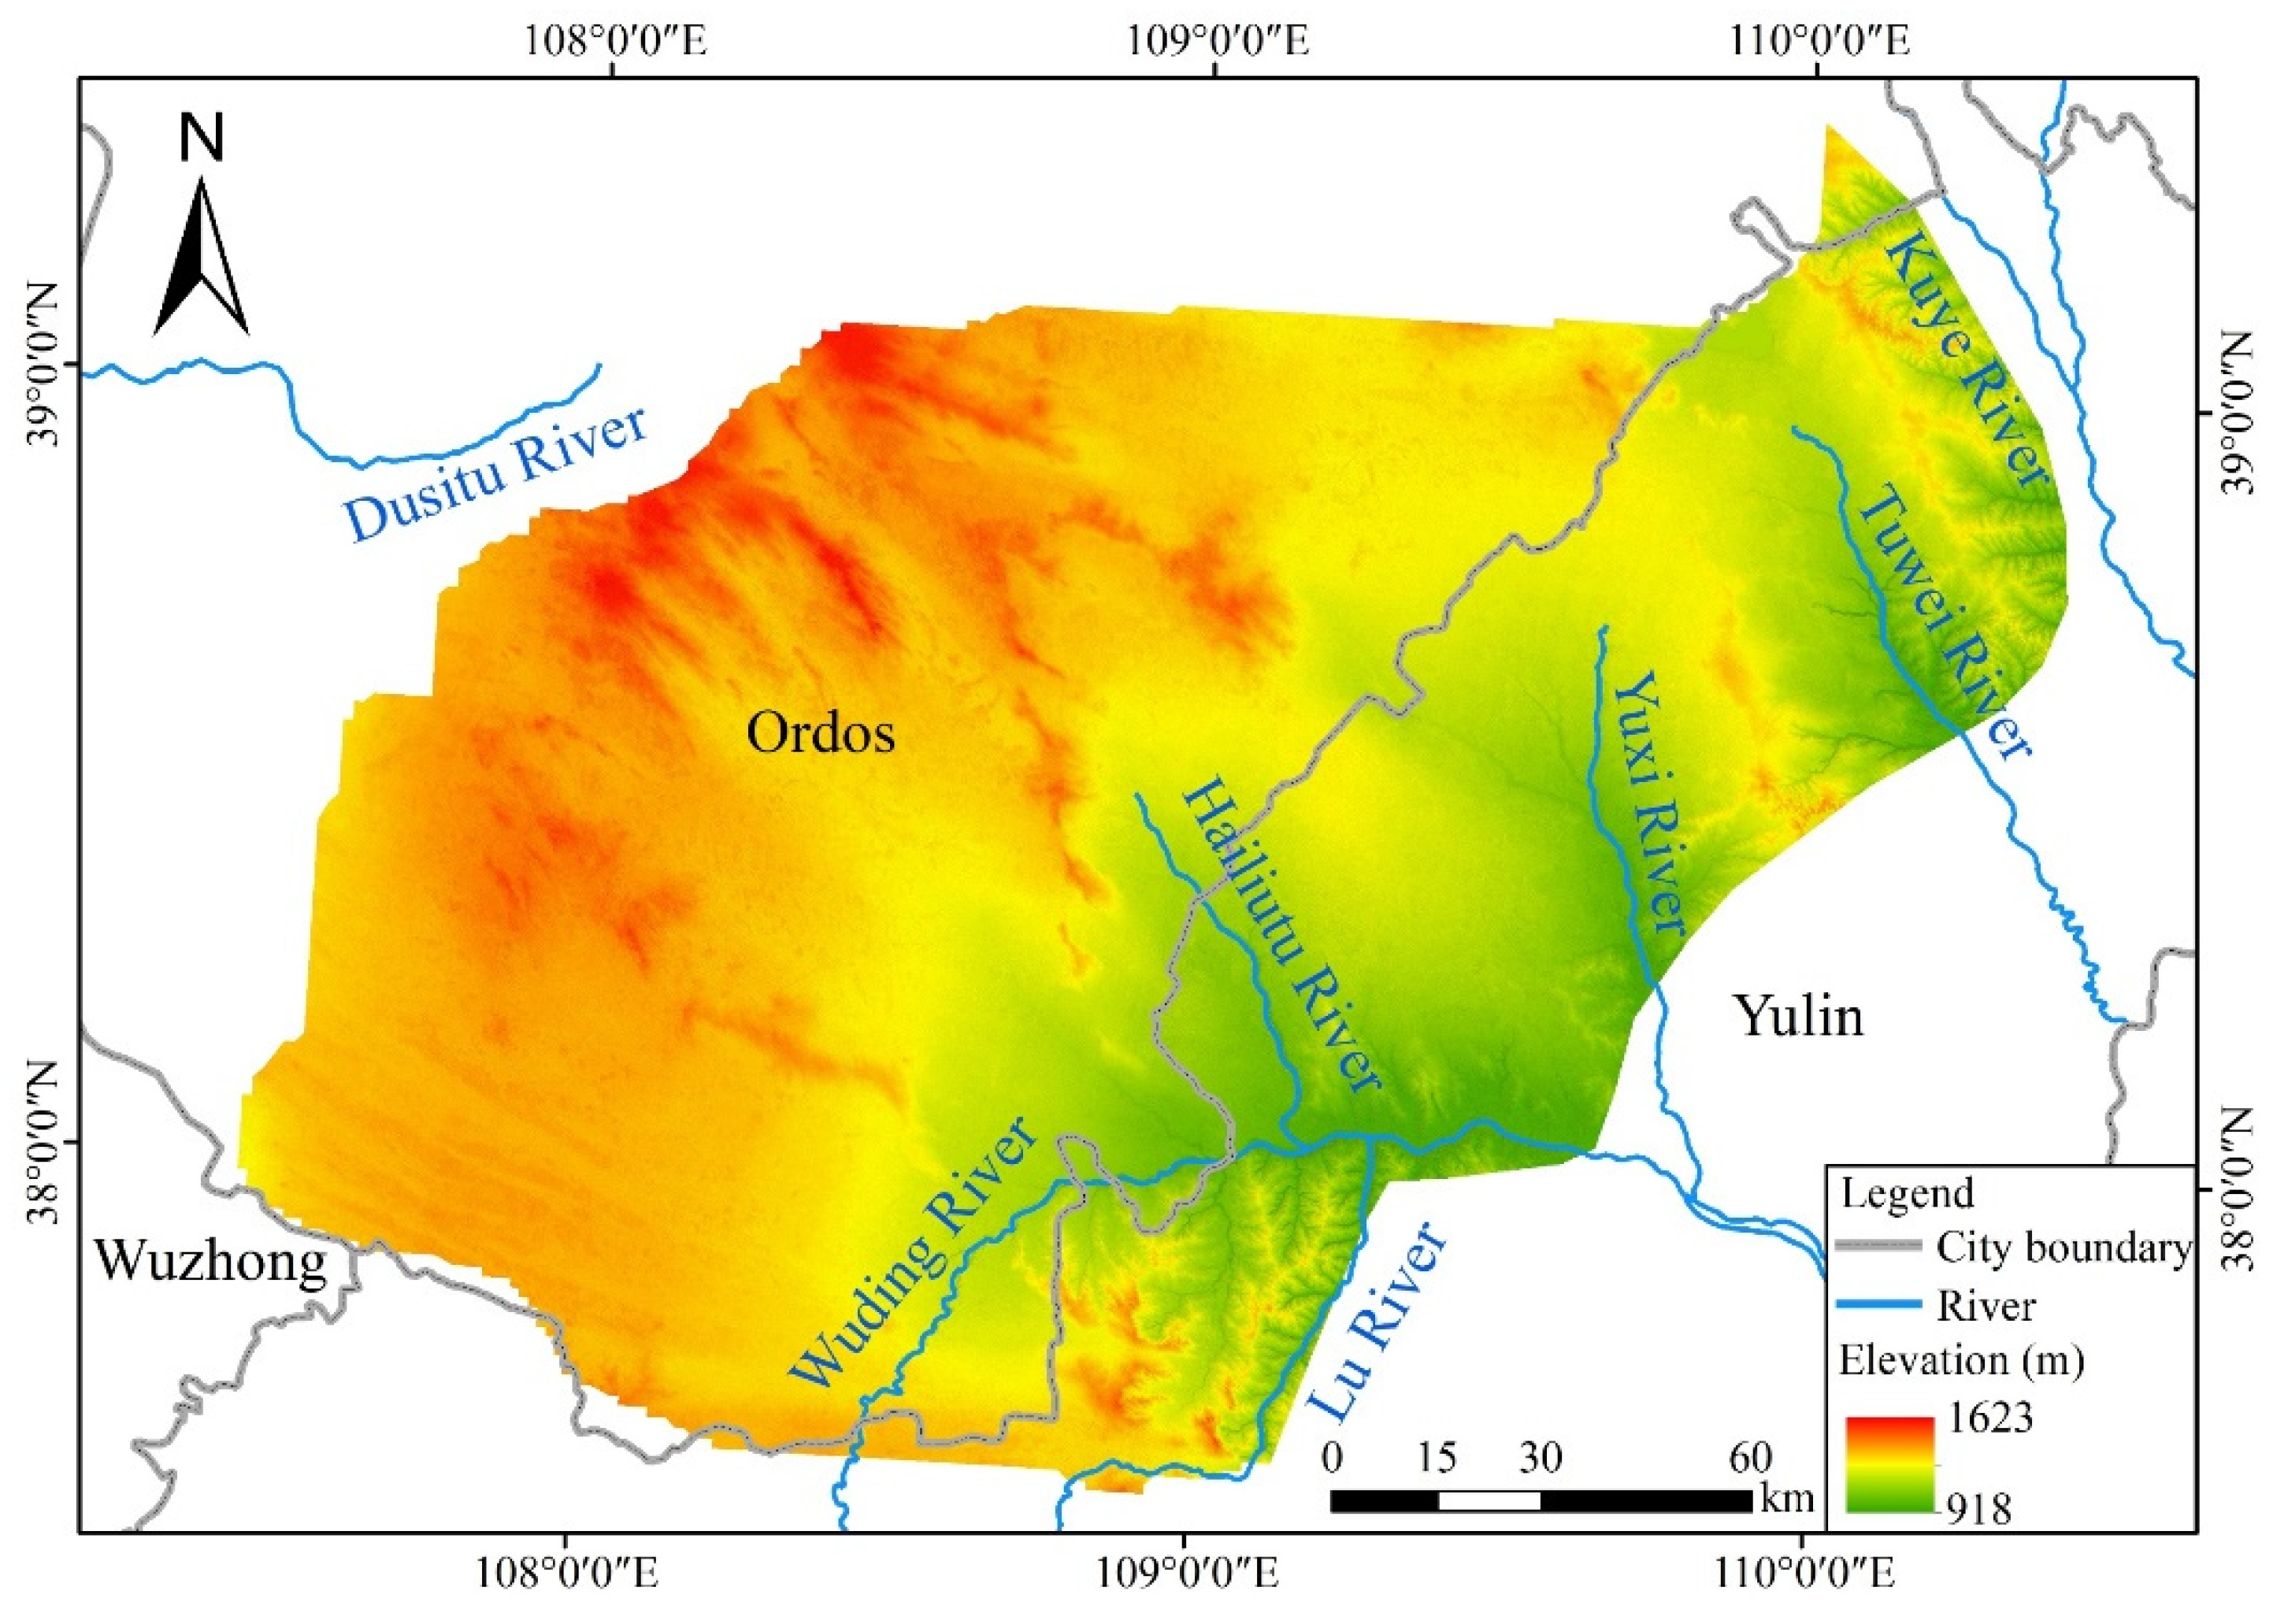
Figure 1. Elevation of the study area.
Sustainability 15 05619 g001
Figure 2. Distribution of Sample Points in the Study Area.
Sustainability 15 05619 g002
Figure 3. Variation curves of statistics with scales using different methods. (a) Mean variance method. (b) Maximum area method.
Sustainability 15 05619 g003
Figure 4. Local segmentation effects at scales 140 and 200 in the study area.
Sustainability 15 05619 g004
Figure 5. Random forest classification results based on pixel (a) and object-oriented (b) methods.
Sustainability 15 05619 g005
Figure 6. Spatial distribution of desertified land during 2001–2021.
Sustainability 15 05619 g006aSustainability 15 05619 g006b
Figure 7. Spatial distribution of land desertification changes during 2001–2021.
Sustainability 15 05619 g007aSustainability 15 05619 g007b
Table 1. Landsat 8 OLI and Landsat 5 TM image information.
Sensor TypePath/RowDateCloud Cover
Langsat-8 OLI127/332021/08/020.07%
127/342021/08/022.22%
128/332021/08/090.02%
128/342021/08/091.17%
Langsat-8 OLI127/332015/07/010.01%
127/342015/07/010.00%
128/332016/08/271.98%
128/342016/08/270.00%
Langsat-5 TM127/332011/08/073.00%
127/342011/08/079.00%
128/332010/08/270.00%
128/342010/08/276.00%
Langsat-5 TM127/332006/09/100.00%
127/342006/09/100.00%
128/332007/08/031.00%
128/342007/08/030.00%
Langsat-5 TM127/332002/08/300.00%
127/342002/08/303.00%
128/332000/08/310.00%
128/342000/08/3116.00%
Table 2. Classification criteria for desertified land.
Types of DesertificationVegetation CoverageFeature DescriptionImage Display
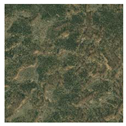
Non desertification>60%There is basically no wind erosion activity. It is mainly a large area of cultivated land with obvious morphological characteristics. The area of bare sand is small, and the image presents dark-or light-green colors.Sustainability 15 05619 i001
Mild desertification30%~60%Wind erosion activity is decreased. The dune morphology gradually disappears. There is a phenomenon of drifting sand accumulation. The vegetation increases and is presented as continuous, and the image presents brown and green colors.Sustainability 15 05619 i002
Moderate desertification10%~30%Wind erosion activity is frequent. The dunes are striped or irregular patches, interspersed with sparse vegetation, and the images presents reddish-brown and green colors.Sustainability 15 05619 i003
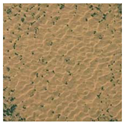
Severe desertification<10%Wind erosion activity is violent. The dune presents clear morphological characteristics and an obvious wavy pattern. The image presents bright reddish-brown or even white colors. There is almost no vegetation.Sustainability 15 05619 i004
Table 3. Description of characteristic variables.
Variable CategoriesVariable NameDescription of Features
Spectral characteristicsBand MeanBrightness values for Landsat 8 OLI band 1–7
Band Standard Deviation Spectral standard deviation of Landsat 8 OLI band 1–7
Geometric featuresAreaThe number of pixels that compose the image objects
Shape IndexThe ratio of the boundary length of the image to the square root of four times the area
CompactnessThe ratio of the perimeter of an object to the square root of its area
RoundnessThe ratio of the perimeter of the object to the perimeter of the minimum outer rectangle
Thematic indicesNDVI N D V I = ρ N I R     ρ R ρ N I R   +   ρ R
Albedo A lbedo = 0.356 ρ B + 0.130 ρ R + 0.373 ρ N I R + 0.085 ρ S W I R 1 + 0.072 ρ S W I R 2 0.0018
GSI G S I = ρ R     ρ B ρ R   +   ρ B   +   ρ G
Fe2O3 I Fe 2 O 3 = ρ R ρ B
Table 4. Classification accuracy evaluation confusion matrix based on pixel.
Types of
Desertification
NonMildModerateSeverePA (%)UA (%)
Non44361333483.1398.89
Mild63248611693083.2567.65
Moderate2479639209112382.1479.79
Severe212276632884.8895.49
OA (%)83.22
Kappa coefficient0.7686
Notes: Non, non-desertification; Mild, mild desertification; Moderate, moderate desertification; Severe, severe desertification; PA, producer accuracy; UA, user accuracy; OA, overall accuracy.
Table 5. Classification accuracy evaluation confusion matrix based on object.
Types of DesertificationNonMildModerateSeverePA (%)UA (%)
Non48771030491.4097.85
Mild1895453923093.3983.06
Moderate27028310,13167290.3789.21
Severe00157677990.9397.74
OA (%)91.28
Kappa coefficient0.8800
Notes: Non, non-desertification; Mild, mild desertification; Moderate, moderate desertification; Severe, severe desertification; PA, producer accuracy; UA, user accuracy; OA, overall accuracy.
Table 6. Statistics of land desertification area from 2001 to 2021.
YearTypeNonMildModerateSevereOther
2001Area (km2)2683.387284.6211,543.738082.01899.36
Percent (%)8.80 23.89 37.86 26.50 2.95
2006Area (km2)2174.907761.8212,895.726865.10795.57
Percent (%)7.13 25.45 42.29 22.52 2.61
2011Area (km2)1800.038103.1414,437.985295.36856.59
Percent (%)5.90 26.57 47.35 17.37 2.81
2016Area (km2)3353.878628.0913,161.234516.51833.40
Percent (%)11.00 28.30 43.16 14.81 2.73
2021Area (km2)3466.319823.1712,533.983966.09703.54
Percent (%)11.37 32.21 41.10 13.01 2.31
Notes: Non, non–desertification; Mild, mild desertification; Moderate, moderate desertification; Severe, severe desertification; Other, Water and buildings.
Table 7. Changes of desertification area in Mu Us Sandy Land between 2001 and 2021.
YearTypeSevere DegradationDegradationStabilityRestorationSignificant Restoration
2001–2006Area (km2)1071.094160.3419,162.864993.731105.08
Percent (%)3.5113.6462.8516.383.62
2006–2011Area (km2)620.253821.0020,797.954278.67975.23
Percent (%)2.0312.5368.2114.033.2
2011–2016Area (km2)628.793170.6419,757.325153.351783.00
Percent (%)2.0610.464.7916.95.85
2016–2021Area (km2)1175.374545.9417,841.655258.281671.87
Percent (%)3.8614.9158.5117.245.48
Disclaimer/Publisher’s Note: The statements, opinions and data contained in all publications are solely those of the individual author(s) and contributor(s) and not of MDPI and/or the editor(s). MDPI and/or the editor(s) disclaim responsibility for any injury to people or property resulting from any ideas, methods, instructions or products referred to in the content.