Article

Slope Crack Propagation Law and Numerical Simulation of Expansive Soil under Wetting–Drying Cycles

1
School of Safety Engineering, Chongqing University of Science and Technology, Chongqing 401331, China
2
School of Civil Engineering, Shaoxing University, Shaoxing 312000, China
3
Chongqing College of Mobile Communication, Chongqing 401520, China
4
China Institute of Water Resources and Hydropower Research, Beijing 100038, China
*
Authors to whom correspondence should be addressed.
Sustainability 2023, 15(7), 5655; https://doi.org/10.3390/su15075655
Submission received: 12 February 2023 / Revised: 15 March 2023 / Accepted: 16 March 2023 / Published: 23 March 2023
(This article belongs to the Special Issue Environmental Exposure, Risk Assessment and Public Health)

Abstract

:
This study investigated the crack propagation law of expansive soil slopes under drying–wetting conditions and the influence of cracks on slopes by conducting a large-scale indoor slope test subjected to drying–wetting cycles. The change in soil moisture content at different depths during the drying–wetting cycles was monitored using a moisture content sensor, and the variation in crack depths in the expansive soil during the drying process was measured using a crack depth detector. The cracks on the slope’s surface were processed using a self-made binarization program, and the crack evolution mechanism of the expansive soil during the drying process was analyzed. The rainfall-induced change in moisture content in the fractured soil was used to obtain the influence of moisture content change on expansive soils, and to analyze the dry–wet cycle failure mode of surface soil. The surface cracks of the soil were quantified by binary processing, and the area of the cracks and the area ratio of cracked soil to intact soil were calculated. Finally, by using PFC simulation software with the slope cracks and quantitative analysis results as parameters, it was confirmed that the greater the number of drying–wetting cycles, the greater the number of cracks, and the greater the damage to the slope.

1. Introduction

Expansive soil is a highly plastic soil composed of various minerals and sticky particles that has low permeability. It has the ability to absorb water and swell, and to dehydrate and shrink. In its natural state, the soil is relatively stable and is often mistakenly considered a good foundation material, leading to its misuse in construction facilities. However, due to its properties, expansive soil in hydraulic engineering can easily cause disasters such as slope instability, channel deformation, foundation uplift, and road cracking. In the face of the current severe environmental issues humanity is confronting, sustainable development has become a global consensus. Research on the behavior of soil cracking and the laws governing the propagation of cracks can help us better understand the sustainability of land use, plan urban and infrastructure construction rationally, minimize land destruction and environmental pollution, and achieve sustainable development goals. Globally, research has shown fruitful results on expansive soil slopes. An unsaturated expansive soil is a three-phase soil, which means that it is composed of solid, liquid, and gas. Owing to its expansion and contraction characteristics, this type of soil is prone to micropores and cracks on its surface. The appearance of cracks changes the structure and destroys the integrity of the soil, resulting in a decrease in the stability of slopes constructed using expansive soils [1]. Slope stability has long been a common problem in geotechnical engineering. The presence of cracks has significantly influenced the stability of expansive soil slopes [2,3] and it is, therefore, important to consider cracks when dealing with expansive soils. Most studies use experimental and numerical simulation methods to study the stability of slopes with cracks. Expansive soil has poor permeability; however, if it has cracks, rainwater infiltrating along the inner wall of the crack into the deep part of the soil will result in the softening and piping of the internal soil [4]. Studying expansive soil cracks is particularly important. Tang et al. [5] studied the coupling effect of the wetting–drying cycle and analyzed and discussed dry crack behavior. In 2010, Zhang et al. conducted an indoor experimental study on the fracture evolution law of expansive soil under repeated wetting–drying cycles [6]. Wang et al. obtained the relationship curves of the kerosene infiltration coefficient and dehumidifying time, average water content, and surface crack rate using oil infiltration and rainfall infiltration. Moreover, they determined the laws of crack development and expansive soil infiltration [7]. Wang and Yao et al. studied the mesostructure characteristics of fissured expansive soil and the influence of cracks on the macro mass deformation behavior of expansive soil through wetting–drying cycles, triaxial immersion tests, and CT image observations [8]. To study the water content and evolution of cracks in expansive soils, they used image processing technology to record the evolution of cracks in expansive soil samples. They analyzed the dynamic changes in water content, crack area, and fractal length and concluded that cracks in expansive soil are affected by soil thickness, water content, and other factors [9,10]. Ma et al. studied the evolution process of cracks in the soil in 2007 and applied the tensor stress theory of unsaturated soil to analyze the stress tensor, crack propagation, crack morphology, and the surface evolution process of fissured soil [11,12]. Yao et al. and Chen et al. studied the mesostructure changes in remolded soil during the wetting–drying process. The influence of water on the crack evolution of expansive soil was studied by three-dimensional (3D) CT scanning, and changes in the wetting–drying cycle structure of remolded soil were studied by tracking the crack formation and closure of samples [13]. In the same year, Chen et al. studied the evolution characteristics of the mesostructure of loess and expansive soil using a CT triaxial apparatus [14]. Cao et al. carried out indoor simulated rainfall experiments in 2016 and quantitatively analyzed cracks using an image recognition method. They recorded and observed the dynamic evolution processes of dry shrinkage cracking and wet healing of the soil samples [15]. In 2020, Luo et al. used a full-scale model test of a cracked soil slope to study the evolution law of soil cracks during the rainfall–evaporation process. They measured the surface water content of the soil and determined the crack rate using image vectorization technology and studied the evolution law of crack water content in the soil cracks and matrix domains. Based on the horizontal strain increment constitutive model of unsaturated soil, they calculated and determined the matric suction and water content of critical cracking in the soil matrix domain [16]. Xie et al. considered the influence of cracks on the stability of an expansive soil slope based on the upper bound method and established the stability analysis method [17]. Liu et al. used the direct shear test to determine the shear strength index of expansive soil under dry–wet cycles and revealed the relationship between crack development and shear strength [18]. Other previous studies have analyzed cracks in expansive soil under dry–wet cycles using image processing, quantified the crack index, analyzed the failure mechanism of slope cracks, and described the evolution mechanism of slope cracks [19,20,21,22,23,24,25]. Many previous studies have established numerical simulation experiments that consider the influence of cracks on the rainfall infiltration of expansive soil [26,27,28]. Some researchers have studied slope stability while considering the effects of cracks and rain infiltration [29,30,31,32,33,34]. Some scholars believe that the problem is composed of unsaturated soil multi-field coupling, and they have discussed the variations of unsaturated seepage, displacement response, and progressive failure of expansive soil slopes under rainfall infiltration. Previous studies have investigated the influence of slope stability using the finite element method [35,36,37,38]. They analyzed factors affecting slope stability, such as rainfall intensity, rainfall time, crack width, crack depth, crack permeability coefficient, and seepage field. It was found that the depth and width of the cracks have a significant influence on rainfall infiltration. Furthermore, it was concluded that the width and depth of the cracks are proportional to rainfall infiltration, and the depth of the cracks determines the position of the potential slip surface of the slope. In the absence of cracks, rainfall has little effect on the slope safety factor; however, in the presence of cracks, the slope safety factor decreases with an increase in the slope crack depth. This study contributes to a better understanding of slope stability, which can inform the planning and design of infrastructure and buildings and reduce the environmental damage and economic losses caused by slope instability [39]. As a computational method, the discrete element method also has many advantages in the study of rock and soil mechanics. Firstly, the PFC simulation data can comprehensively present the properties, internal structure, and macroscopic behavior of rock and soil from microscopic to macroscopic scales, providing strong support for the research. Secondly, PFC can study rock and soil with strong randomness and simulate progressive failure phenomena such as the development and existence of cracks, spalling, and collapse. Additionally, PFC can express the development and influence of cracks well, as it is not only limited to parameters such as stress, displacement, and safety factor [40,41,42,43].

2. Experimental Method

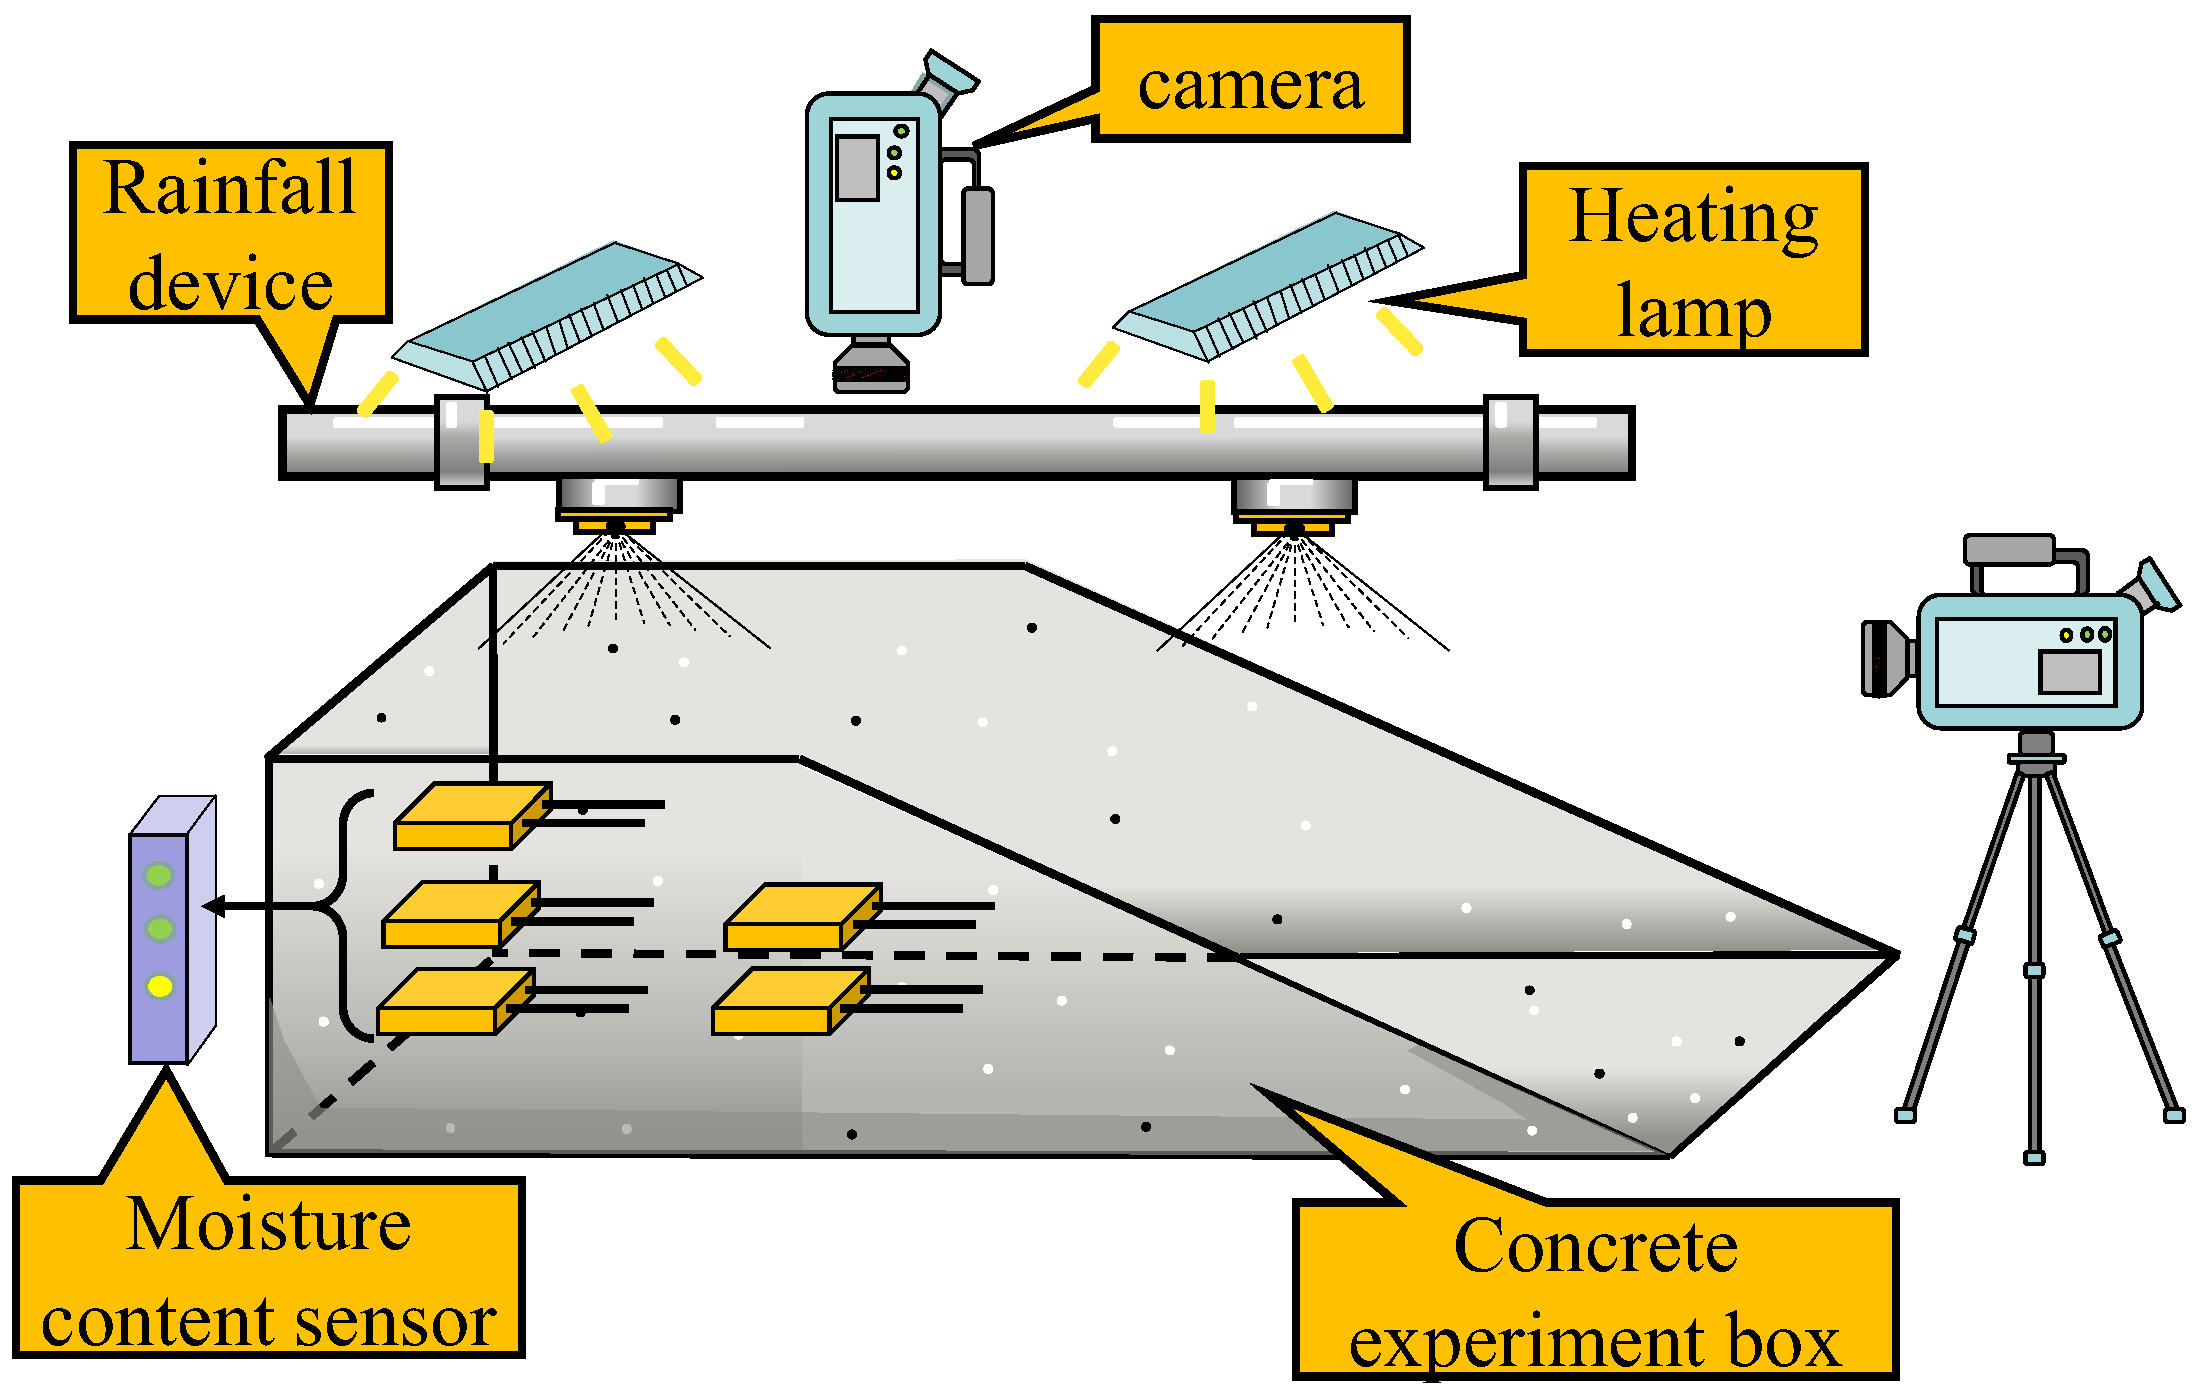
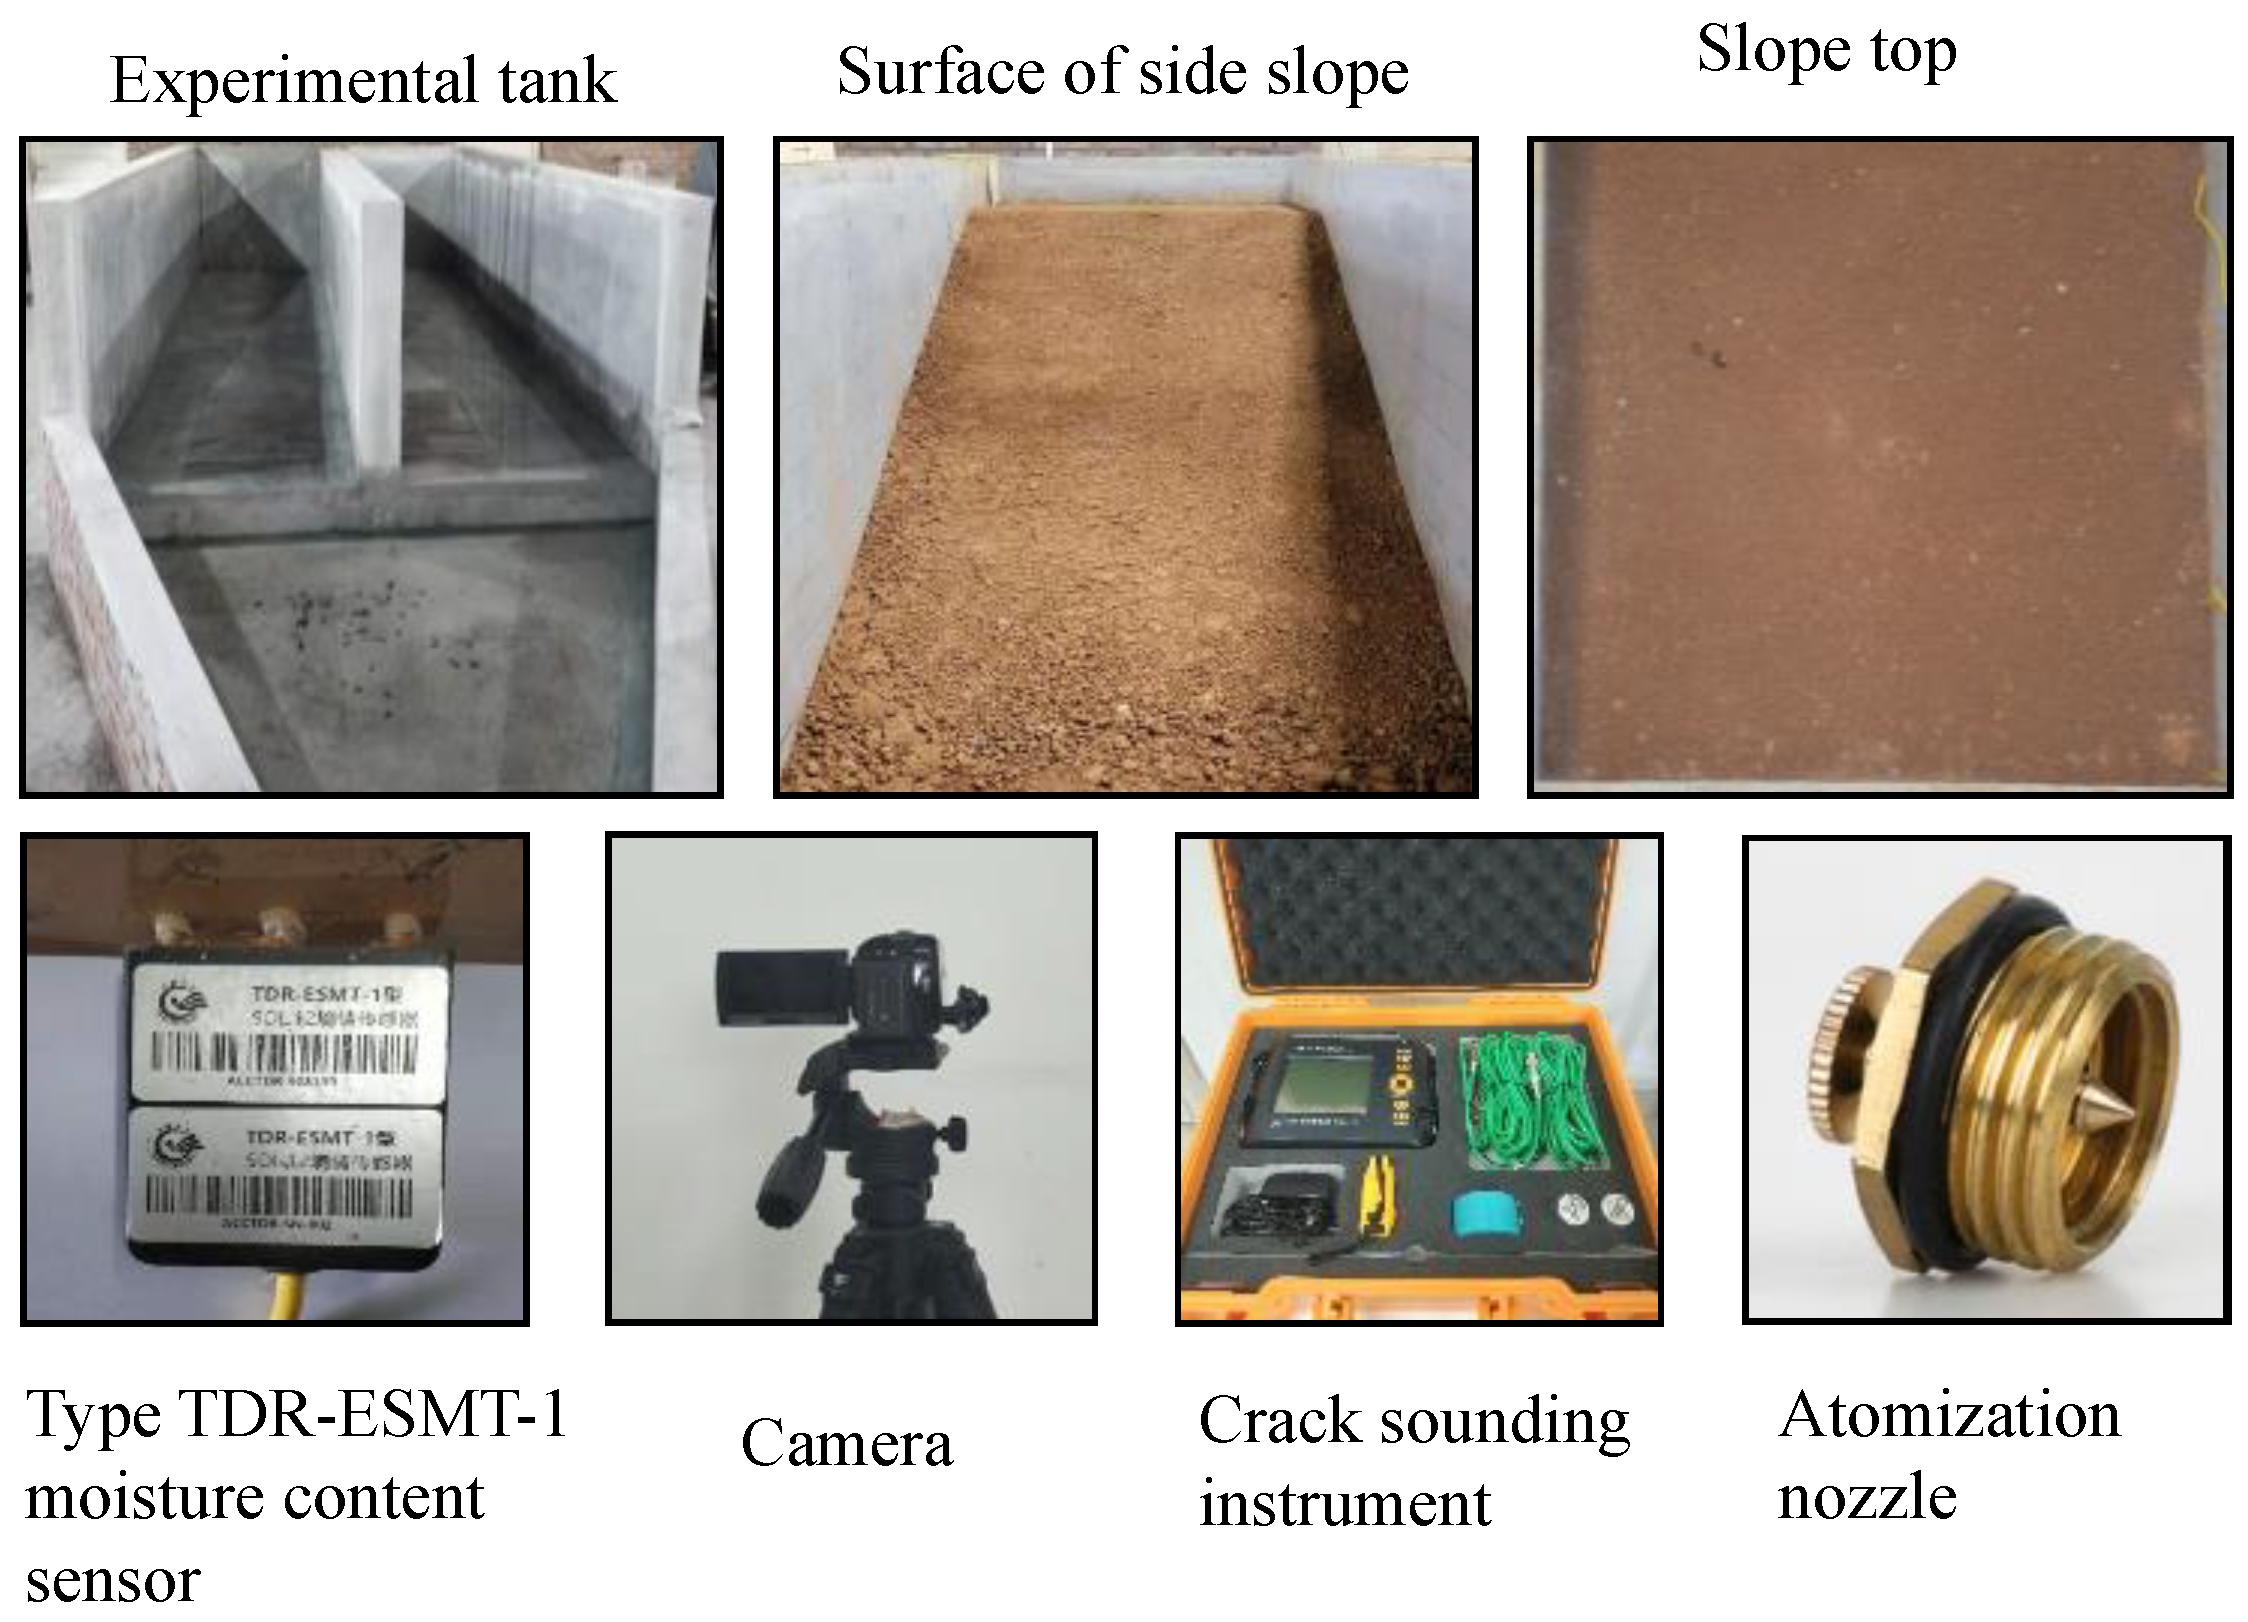
2.1. Experimental Facilities

This experiment used expansive soil from a construction site at the bank of a slope in Henan Province, China. The free swelling rate of clay in the upper part of the bank slope is 51%, indicating a weakly expansive soil. The soil is light yellow in color. The expansive soil contains black ferromanganese nodules, and it has high clay content. The soil sample section is a waxy gloss section. The basic physical indexes of the soil samples are shown in Table 1.
The test adopted a self-made wetting–drying circulation device that included a reservoir, water pump, a TDR-ESMT-1 water content monitoring device, rainfall device, control valve, and an HD camera (SONY, Beijing, China, resolution: 1920 × 1080/50 p) as an observation device. The size of the slope test groove is 4.0 m × 1.0 m × 1.0 m (length × width × height). The inner concrete wall of the test groove is smooth and polished, as shown in Figure 1. In the established slope model, the bottom side is 2.4 m long, and the top and bottom sides are 1.0 m long, 1.0 m high, and 1.0 m wide. The physical equipment diagram is shown in Figure 2.

2.2. Test Method

The following lists the steps of the expansive soil slope model.
① Before starting the experiment, the rainfall dispersion was measured to ensure that the soil received water uniformly. Rainfall uniformity was used to simulate natural rainfall dispersion, and the measuring cylinders were equidistantly dispersed in the upper part of the rainfall tank. The water valve was opened to collect rainfall and measure the rainfall dispersion. The rainfall U uniformity follows U = 1 | R i R ¯ | n R ¯ , where R i is the rainfall of the measuring point in a period within the rainfall range, n is the number of points measured, and R ¯ . is the average rainfall within the same period of rainfall [44]. To achieve uniform dispersion, it was necessary to adjust the height of and the distance between nozzles for the rainfall to completely cover the soil surface and adjust to the appropriate water pressure.
② According to the test requirements, the soil was prepared so it had the same 10% water content as the soil at the construction site, and a plastic film seal was used to cover it for 24 h to ensure uniform distribution of the soil water content [45].
③ Layered compaction method. The total height of the slope model was 0.8 m, and the layered compaction method was used to construct the slope model [29]. Compaction was carried out 10 times using a small compactor to a degree of compaction of 70%, and each layer of compacted soil was cut using a cutting ring [19]. The cutting ring and soil were weighed to calculate the degree of compaction of each layer. To prevent the stratification of the slope, the surface was roughened after the compaction of each layer.
④ The slope was left for 24 h to self-consolidate.
⑤ The sensor and computer were connected, and the sensor parameters, along with the camera angle and focus, were adjusted [32].
⑥ The rainfall test was initiated, and the rainfall valve was opened. The rainfall process was then monitored. When a small amount of water on the surface of the soil could not penetrate the soil within 15 min, the wetting process was considered complete.
⑦ At this time, the sensor data were read and recorded and the soil was photographed.
⑧ After the rainfall, the heating lamp was used to bake the soil to maintain the soil temperature at 25 °C. When there was no further change in the water content of the soil surface, the sensor data were recorded and the soil was photographed. The soil crack parameters were then measured and test steps ⑦ and ⑧ were repeated twice.

3. Experimental Results and Analysis

3.1. Experimental Results

Figure 3 clearly depicts the cracks that developed on the specimen’s surface after undergoing different wetting–drying cycles. During the first dehydration stage, uneven shrinkage deformation caused cracks to form. However, during precipitation, cracks on the surface healed. As the number of drying and wetting cycles increased, the width of the cracks slowly widened under dehydration, accompanied by the formation of secondary cracks. In the later stage of crack development, the rate of increase in crack width slowed down and remained constant, while the number of secondary cracks increased gradually. After reaching a certain number of cycles, the soil surface was completely destroyed. In contrast, the soil without wetting–drying cycles did not show any obvious cracks. After the first stage of the wetting–drying cycle, large cracks appeared in the soil, and their depth and width were relatively large. Atmospheric pressure squeezes the fine soil skeleton as pore water is discharged, resulting in the deformation of the softened soil skeleton. This process destroys the soil surface structure after pore water is discharged on the soil surface. Once the soil skeleton splits, it becomes difficult for it to return to its previous stable state. Under the combined action of bubble extrusion from the surface and soil expansion, the surface soil’s discretization becomes increasingly severe with the increasing number of drying and wetting cycles, and the failure of the entire soil gradually moves downward from the surface, as shown in Figure 4.
The surface soil was loosened, and the density, blocks, and particles were divided. When the soil surface had a high water content, the water content gradients were small, and the soil did not form cracks. However, when the water content of the soil surface decreased, there was a large gradient between the water content of the soil surface and that of the internal soil, resulting in cracks on the soil surface. As the number of cracks increased, the integrity of the soil was damaged, and the overall soil strength decreased. Initially, the development of cracks had little effect on the soil as a whole, but as they continued to develop, the soil structure and soil skeleton underwent significant changes. The small inter-particle connections caused the soil to break, leading to a gradual loss of soil and an increasing number of fine cracks in the soil. During wetting–drying cycles, the dispersion of the soil extended downward, with larger cracks gradually being replaced by smaller ones. This caused the soil to become more granulated and dispersed. As the number of wetting–drying cycles increased, the number of cracks and their scale also increased, leading to a looser soil structure and an increase in the crack area. The degree of crack development directly affects the soil’s bearing strength and corrosion resistance. Figure 5a shows that the initial water content of the soil was below 10%; thus, the soil was considered to be dry. In this state, the soil can absorb more water at a greater rate than in the wet state. After rainfall was initiated, the water content of the soil increased rapidly.
After the slope was constructed, it was left to stabilize solidly such that the water content of the soil was uniform. When the water content of the slope was stable, the wetting–drying cycle test began. The water content sensors were placed at 5 cm intervals in descending order from top to bottom and buried to a depth of 5 cm to 35 cm from the soil surface. Figure 5b shows the change in water content during the first stage of rainfall. When rainfall was initiated, the surface soil was first exposed to rain, and the upper water content rapidly increased. The water seeped into the pores between the soil particles and made contact with the second soil layer, which caused the water content of the second layer to increase rapidly. The water content of the surface soil reached its highest value of 45.4%. The water content of the second soil layer increased to 41.4% and then stabilized. When water penetrated the third soil layer, the water content of the third layer increased rapidly owing to the initial high water content of this layer. Due to the low permeability of the expansive soil, the water infiltration into the fourth layer was reduced, causing the fourth layer to remain in contact with the water longer than the other layers. The accumulation of soil water in the third layer caused its water content to increase to 43.3%. At this time, water had infiltrated from the top to the fourth and fifth soil layers, but the water content of these layers did not increase significantly because only a small amount of water infiltrated from the top. The increasing water contents of the first, second, and third soil layers gradually became stable, indicating that they reached their peak water contents. When the rainfall device was stopped, the water contents of the first, second, and third soil layers began to decrease gradually. The main reason for the decrease in water content is the outflow of water from the open boundary of the slope and the infiltration of water. At this time, the water had reached the fourth and fifth layers of soil, and the water contents of the fourth and fifth soil layers started to increase. However, because the rainfall stopped, the water content of the fourth and fifth layers of soil could not reach the same water content as the upper soil. The water contents of the fourth and fifth soil layers increased to 35.1% and 30.5%, respectively, and then began to decline. Due to the influence of gravity, water slowly penetrated deeper into the soil. However, because the water penetrated the soil relatively slowly compared to the soil above, the lower soil made contact with the water later and had no sudden increase in water content; instead, the water content increased linearly and slowly. Figure 5a shows that the soil water content appeared to peak after each rainfall event, and after stopping the rainfall, the water content decreased. Recordings from Sensor 7 show that when the last layer of soil experienced a period of rainfall, the trend in water content variation started to become obvious. Between the first and second rainfall events, the soil water content at a depth of 35 cm changed slowly. This is because some pores remained in the soil, and the gas in the pores hindered the entry of water, so the water entered the deep soil slowly.

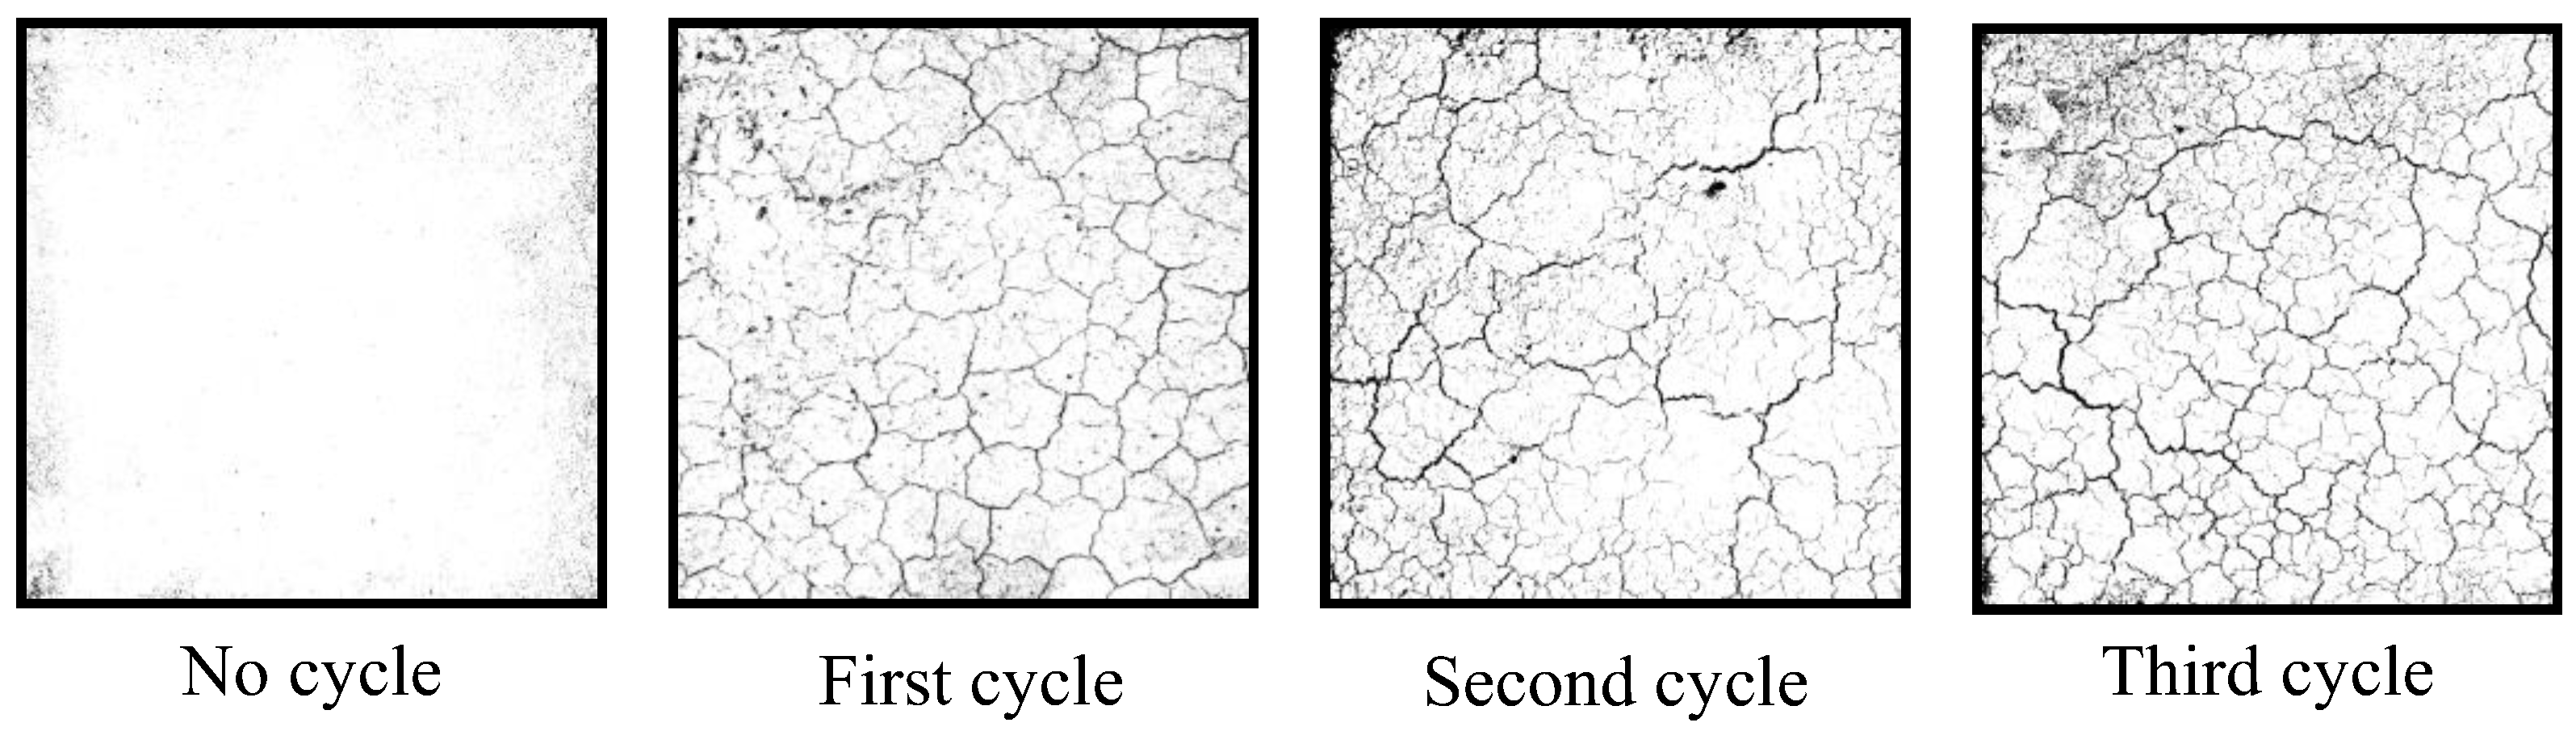
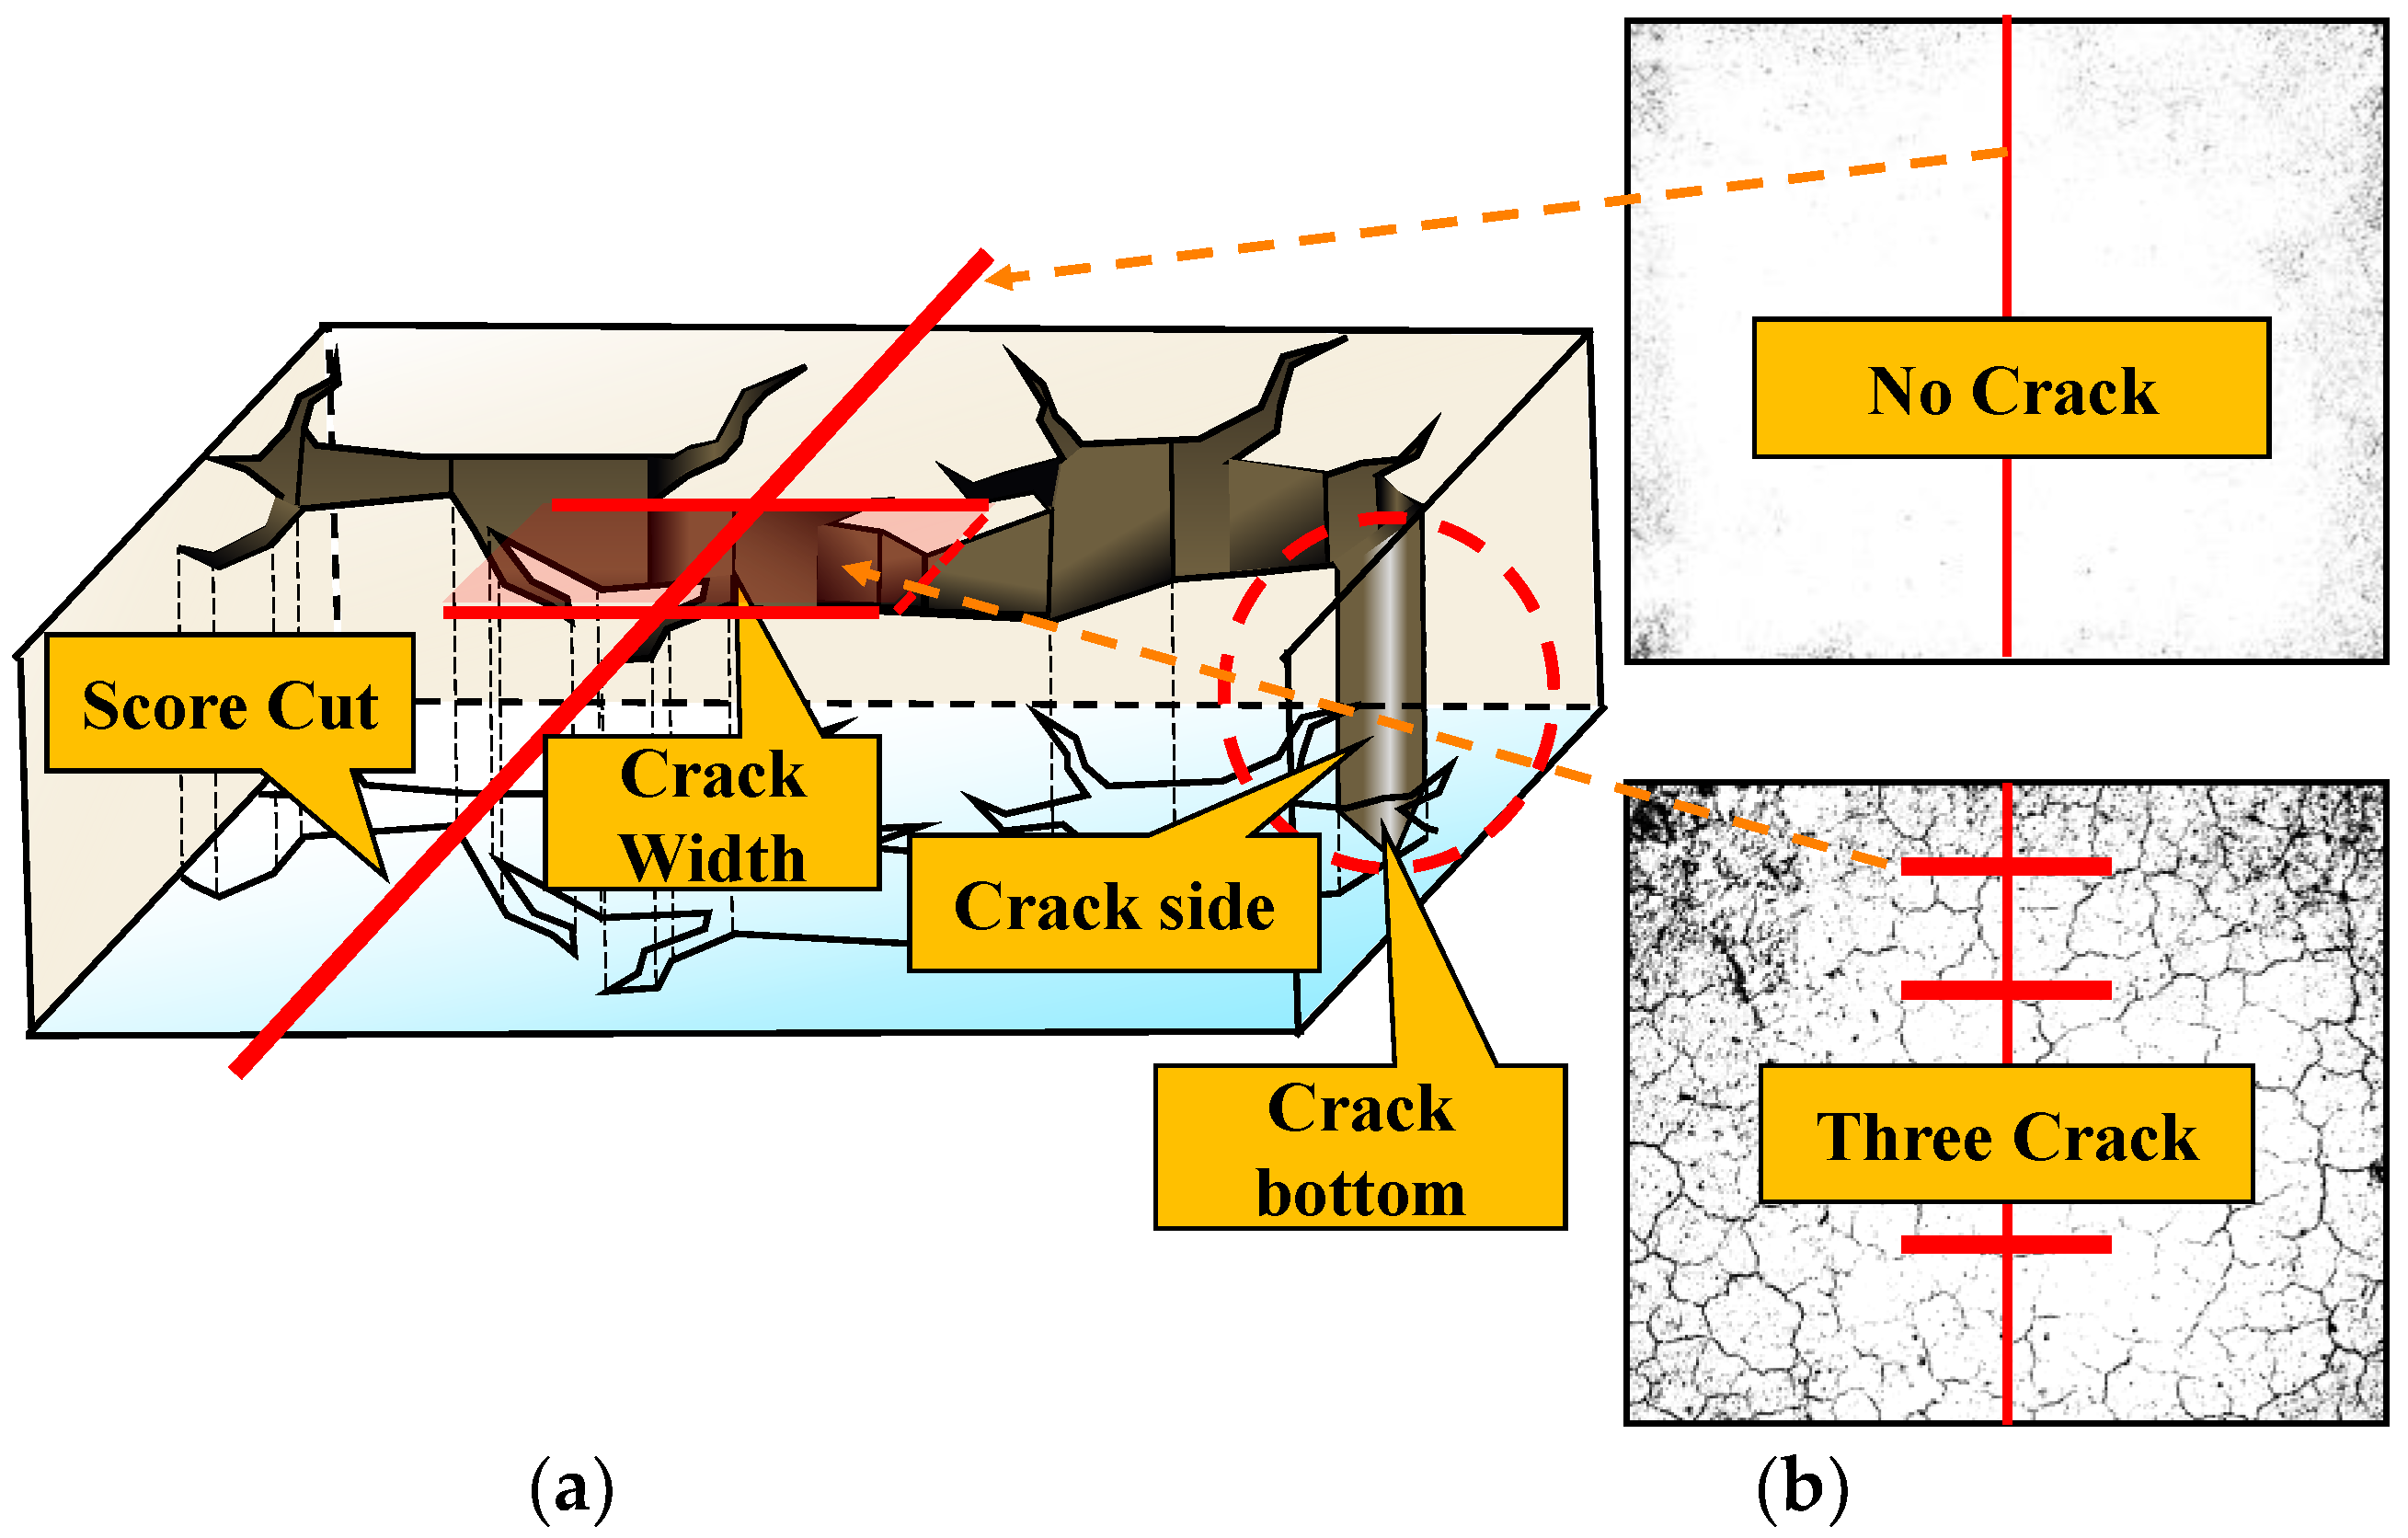
3.2. Binary Image Processing

To analyze crack evolution in expansive soil under wetting–drying cycles, it is important to quantitatively analyze slope cracks and calculate the crack-to-soil ratio after different cycles. The top of the slope was shot with the same angle and focal length, and the image was processed using the MATLAB image processing toolbox for ease of data extraction and to minimize the effect of color on the image analysis. A MATLAB program was developed to binarize the image, adjust the threshold, and distinguish between soil with and without cracks. Computer recognition was then used to count the black pixels, which corresponded to crack pixels. The crack-to-soil ratio was obtained by calculating the ratio of crack pixels to the total number of pixels on the soil surface.
From Figure 6, showing the results of binarization, it is clear that without wetting–drying cycles there are no cracks at the top of the soil slope. At this time, the soil was relatively intact. However, after rainwater infiltration and drying, small cracks appeared on the soil surface. These tiny cracks divided the soil, destroyed its integrity, and formed very small gullies, which provided channels for the flow and diffusion of rain during the second rainfall, allowing the rain to gather quickly. Rainwater scoured the inner walls of the soil cracks after gathering into strands, destroyed the soil structure, and caused soil loss. After entering the cracks, rainwater penetrated downward from the inner wall and bottom of the cracks, increasing the infiltration rate, and accelerating the absorption of water by the lower soil. The expansive soil clearly swelled after absorbing water, and the soil layers squeezed each other after the soil expanded, resulting in the surface healing of cracks owing to dehydration. After the second wetting–drying cycle, the soil cracks became dense, the soil surface was segmented, and the surrounding soil was segmented by small cracks. After the third cycle, the cracks became evident in the soil, and the crack width increased with the increasing number of cycles. The bulk of the soil separated in the second cycle was separated again, forming a discrete small block of soil, and the integrity of the soil was destroyed. In contrast, because small blocks of soil do not accumulate much energy, the cracks in these small blocks of soil were only tiny cracks with a width of some millimeters. The width of the cracks increased when the healing cracks were cracked again. The main reason for this is that the healing caused by extrusion is not healing between the soil particles. The separated soil lacks cohesion and the force between particles is easily pulled apart by the tension caused by deformation. When there are cracks in the soil, a new evaporation surface of the soil is formed on the inner wall and bottom of the cracks, which are exposed to air. The rate of water evaporation is accelerated, and the hydraulic gradient is increased, resulting in the development of cracks. The longer the soil is exposed to air, the faster water will be lost from the soil. The larger the contact area between soil and air, the faster the water loss. Without the presence of cracks, water needs to slowly rise from the bottom of the soil to the surface before it can be evaporated. However, after the occurrence of cracks, new evaporation surfaces are formed on the inner walls of the cracks, increasing the evaporative area. Water no longer needs to rise from the bottom to the very surface of the soil, as it can be evaporated directly from the soil in the inner wall of the crack. This shortens the distance of water evaporation, accelerating the change in water content. Therefore, this reduces the hydraulic gradient between the upper and lower layers of the soil, leading to a more uniform distribution of water content within the soil. For the above reasons, there is an increased rate of change in the water content of the soil. When the water content in the soil has decreased to a certain value, the shrinkage deformation tension formed by the water content gradient no longer reaches the tensile strength of the soil. Thus, cracks no longer develop.
Figure 7 shows that cracks develop after each wetting–drying cycle, but their development speed is not infinite and slows down to a certain extent. This is mainly because during the development process the initial cracks divide the soil, releasing energy and preventing the newly generated secondary cracks from reaching the same width and length as the initial ones. Since the wetting–drying cycle has a limited effect on the soil, cracks will not develop indefinitely. After the initial cracks are generated, their development trend decreases. The cracks lead to the division of the entire soil into several blocks, which alleviates the strain energy caused by soil shrinkage. Number of drying–wetting cycles and water content, crack, and soil mass data shows for Table A1.
Figure 8 shows the formation of cracks at depth in the soil after three precipitation cycles. After the first rainfall cycle, the water content of the soil began to decrease and cracks gradually appeared. As the water content decreased, the crack depth extended down to 3.93 cm. With the second rainfall, the cracks healed; the healing rate was much faster than the rate of crack formation, and the crack depth decreased. At the end of the rainfall, the soil was dried again, and cracks began to develop. However, in the early stages of crack development, the crack formation rate increased. The main reason is that the cracked soil was divided by cracks, and the healing cracks could not produce bite force and cohesion between the soil blocks. When the cracks returned to the deepest depth in the previous cycle, the rate of increase in the crack depth began to slow down; however, the development of cracks made the soil area more conducive to evaporation, and the surface water content decreased. Thus, the lower soil needed to contribute more water to compensate for the loss of water in the upper soil, which also changed the water content in the lower soil. There was a water content gradient between the different depths of the soil, resulting in a continuous downward extension of soil cracks to 5.93 cm. After the last wetting–drying cycle, the cracks developed to a depth of 6.97 cm. Relationship between rainfall period and crack depth shows for Table A2.

4. Numerical Simulation and Analysis

Slope stability is a classical problem in soil mechanics, whether it is a steep slope formed by natural geological changes or an artificially filled slope. Many factors, such as human activities or the geological environment, can cause slope instability, which is typically accompanied by landslides and debris flows, posing a hazard to persons downstream. To analyze the failure behavior of cracked slopes, it is necessary to use numerical simulations to more intuitively express the failure of cracks on the slope.
The software PFC was used to simulate the unstable behavior of expansive soil slopes with cracks; it provides a reference for studying the failure characteristics of expansive soil slopes with cracks. The simulated slope height was 1 m, the top slope length was 1.1 m, the bottom slope length was 2 m, and the slope gradient was 70°. This model is a centrifugal model with forces of 20 times gravity.

4.1. Boundary Conditions and Parameters of the Model

Owing to the limited bond between the discrete element particles, the particles accumulate large elastic forces during the compression process. If the pressure is suddenly released, the particles are propelled with high initial velocity due to the strong acceleration and can move randomly. Thus, the soil must be slowly compressed and then unloaded to stabilize it, requiring a particle position adjustment time after unloading. A soil block shaped like a slope was created by removing particles from a square soil block. Boundary conditions were applied at the bottom and the top of the slope, which consisted of a closed-wall boundary, an open boundary along the top and right slopes, and a free surface, as shown in Figure 9.
In the PFC software, there was no fixed connection between particles. During the process of model deformation, particle positions change irregularly, and the contact relationships between different particles are also random. Therefore, it is necessary to calibrate the soil parameters. The principle is to compare the shear strength curve obtained from the actual direct shear test with the shear strength parameters calibrated in PFC so that the simulated soil properties closely approximate the actual soil properties. The shear fracture curve obtained from the numerical simulation was compared with the results obtained from the indoor physical test. If the comparison results are significantly different, the parameters must be adjusted, and the shearing process repeated. If the final results are of the same order of magnitude, the two are considered similar. Figure 10 shows a linear bond shear model, where the model sample height is 20 mm and the width is 61.8 mm.
The resultant force on the wall was monitored during the shearing process, as shown in Figure 11.
Figure 12 shows the numerically simulated shear strength envelope and the measured saturated expansive soil shear strength envelope. From the comparison, it can be seen that although some data are different, the overall trend remains consistent.
From the above comparison, it can be seen that a partial gap remains between the numerical simulation and experimental test; however, this result is considered acceptable following considerable adjustment. The calibrated material parameters are listed in Table 2. The model parameters are shown in Table 2.
Crack dimensions and parameters were measured during the wetting–drying cycle test. To calculate the influence of cracks on slope stability, a two-dimensional (2D) model was developed using the simulation software PFC. The cracks have width, depth, and length in three-dimensional (3D) space, but in the 2D model, the slope is compressed from 3D to 2D, in which only the width and depth of the cracks exist. Therefore, the settings of the crack size can only be reflected by the width and depth of the cracks. The ratio of the crack area to the soil area can be regarded as the ratio of the crack width to the slope crest length. Since the depth of the cracks has not changed, the depth of the cracks still takes the original crack depth. According to the soil mechanism in the wetting–drying cycle, the maximum and deepest crack development occurs in the case of the initial crack, while the width and depth of the crack decrease after the wetting–drying cycle. The new secondary cracks will also appear near the initial cracks, but the depth and width of these secondary cracks are smaller than those of the initial cracks. For soil with initial cracks, the depth of cracks increases slowly after the wetting–drying cycle, but the increment is not obvious. Since the main focus is the influence of cracks on the slope, and the crack morphology is not specially set, the width and depth of cracks are directly set using the generalized model, as shown in Figure 13.
During the transformation of the 3D slope into a 2D slope, it was necessary to cut the slope along the longitudinal direction to obtain a 2D slope image. The 3D crack has length, width, and height, and after the slope is cut, the crack is only composed of width and depth. The ability of 2D images to capture cracks depends mainly on whether the longitudinal cutting line intersects the cracks, as shown in Figure 14a. The intersection of the longitudinal cutting line and the fracture is where the fracture occurs. According to the most obvious intersection point between the longitudinal cutting line and transverse fracture, the number and location of fractures were determined, as shown in Figure 14b. Subsequently, the measured average depth of the fracture was substituted into the fracture model to form the fracture generalization model. Slope crack parameter settings for numerical simulation as for Table 3.

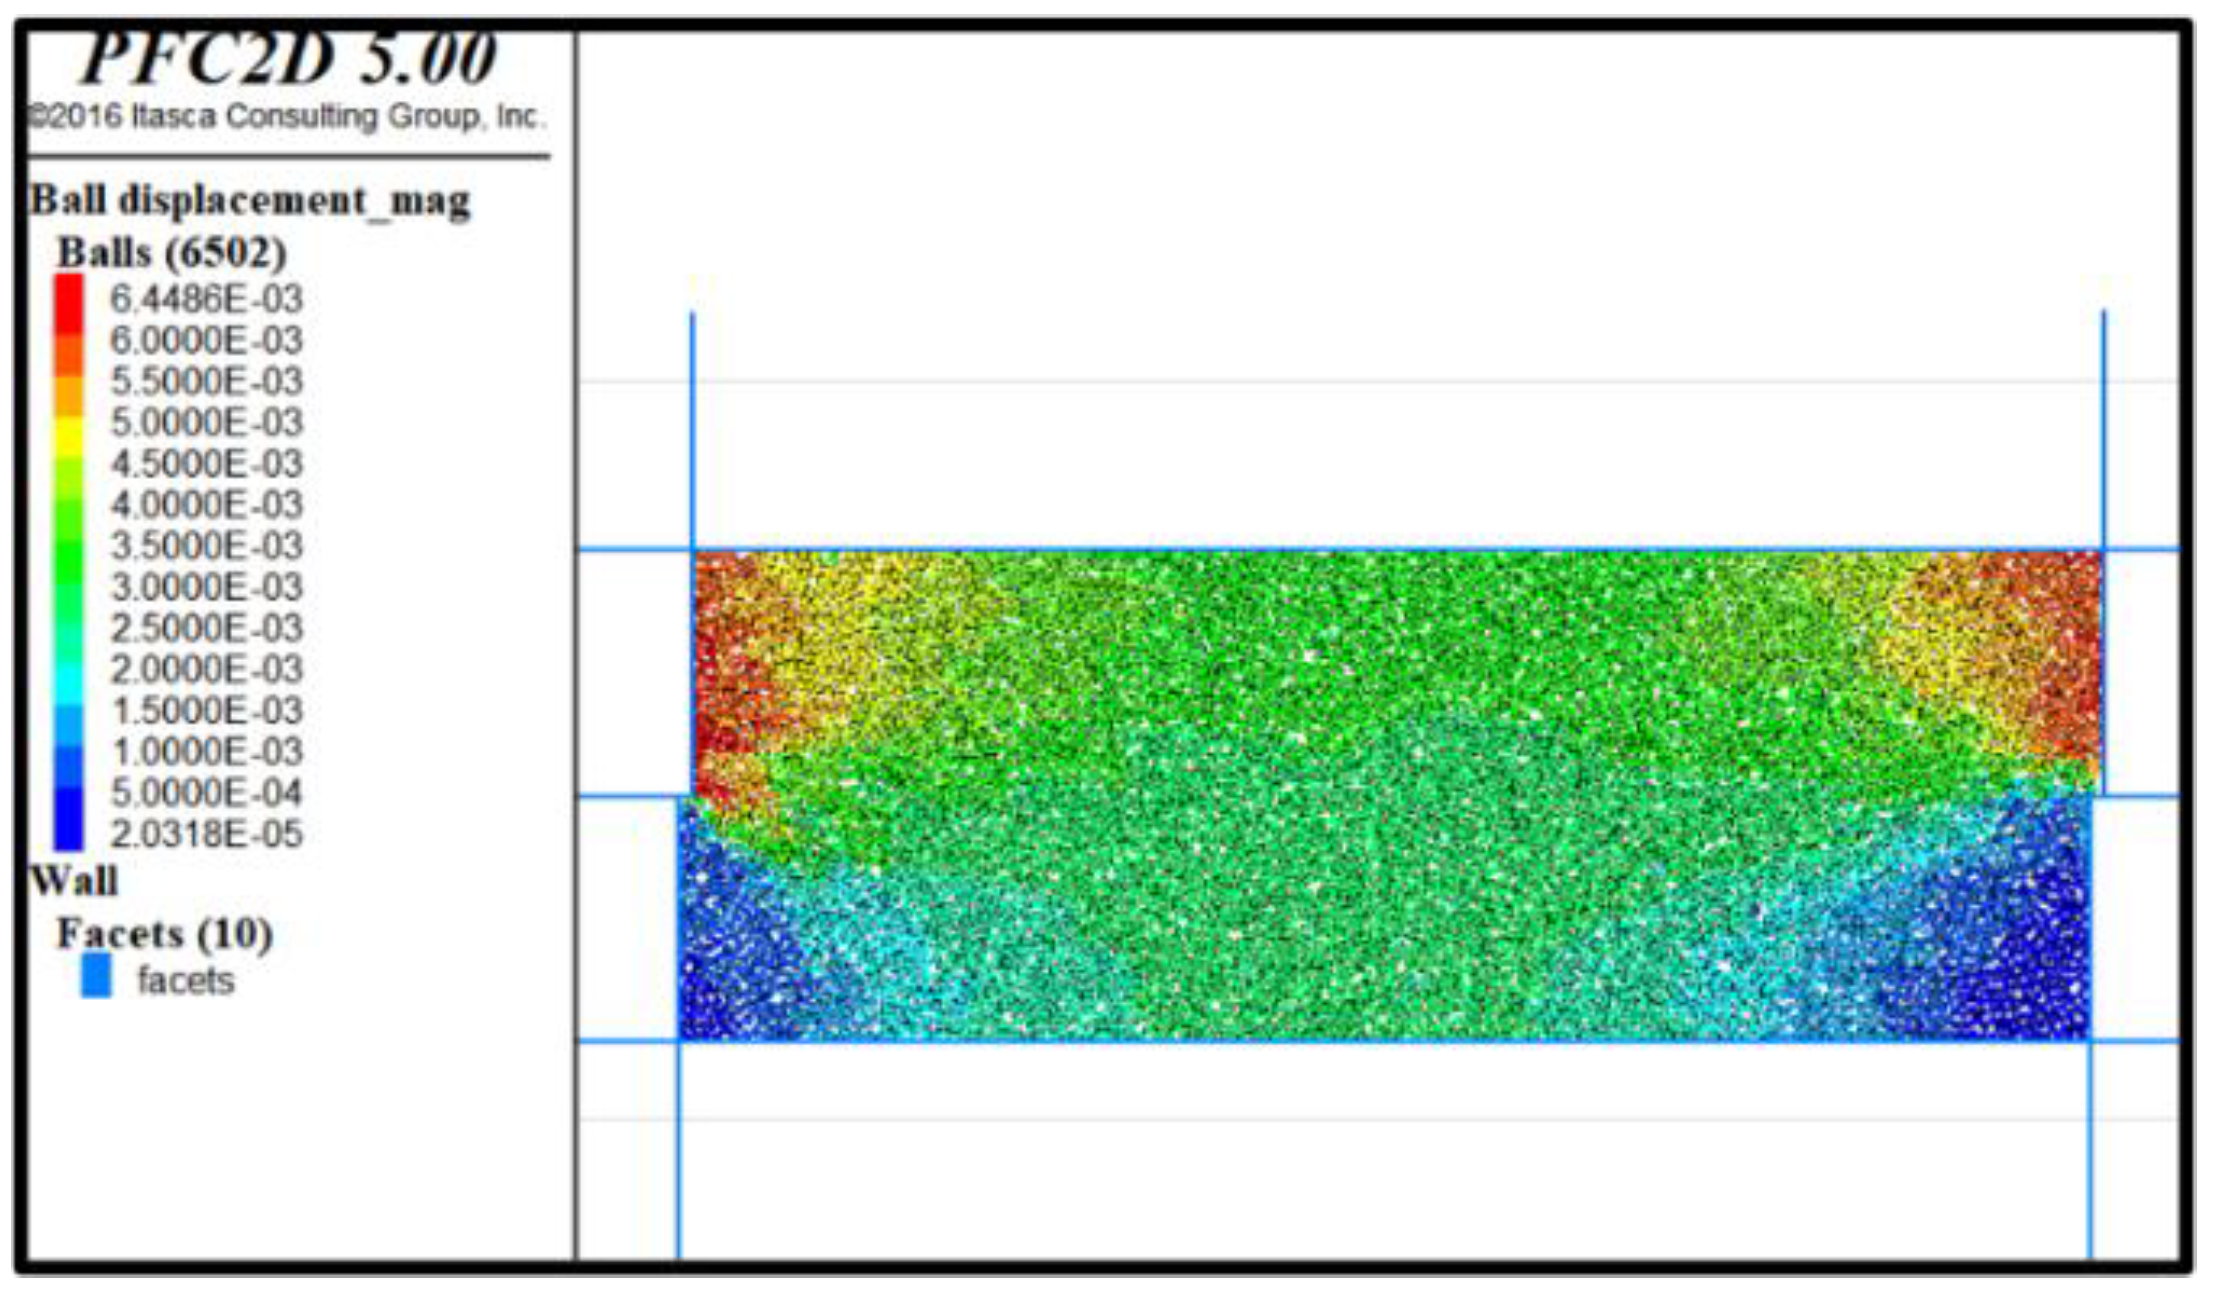
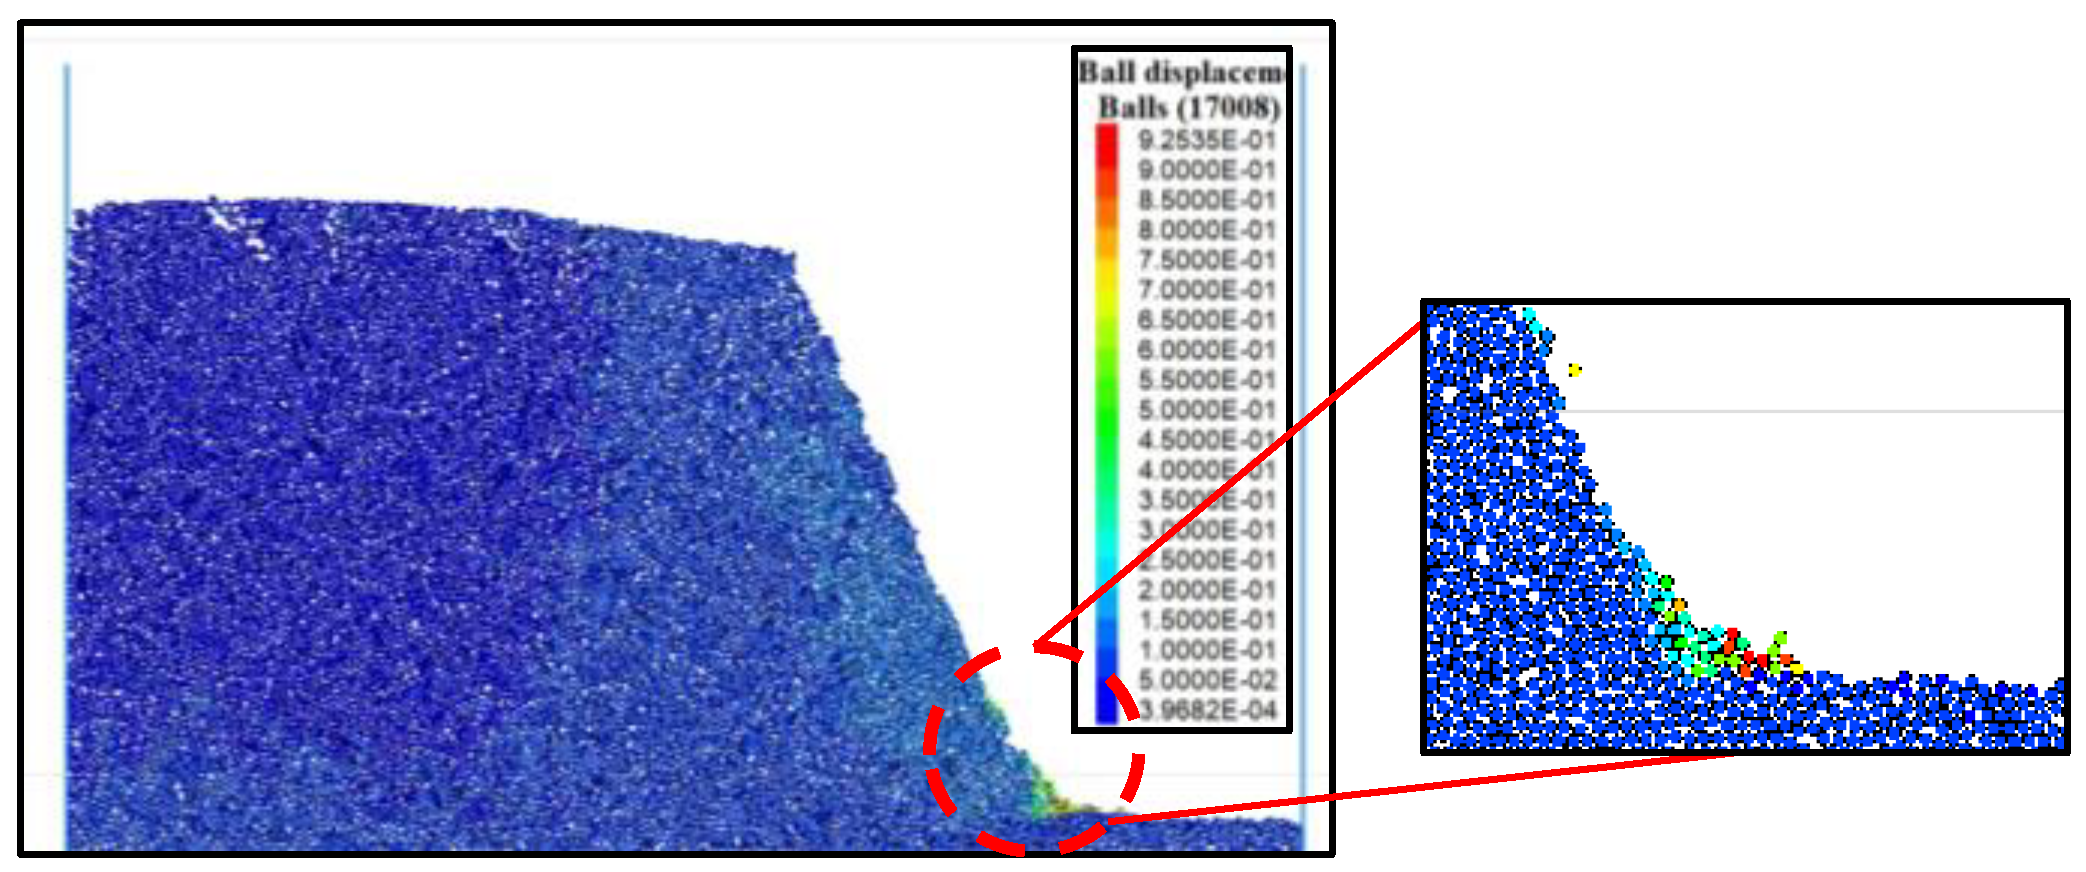
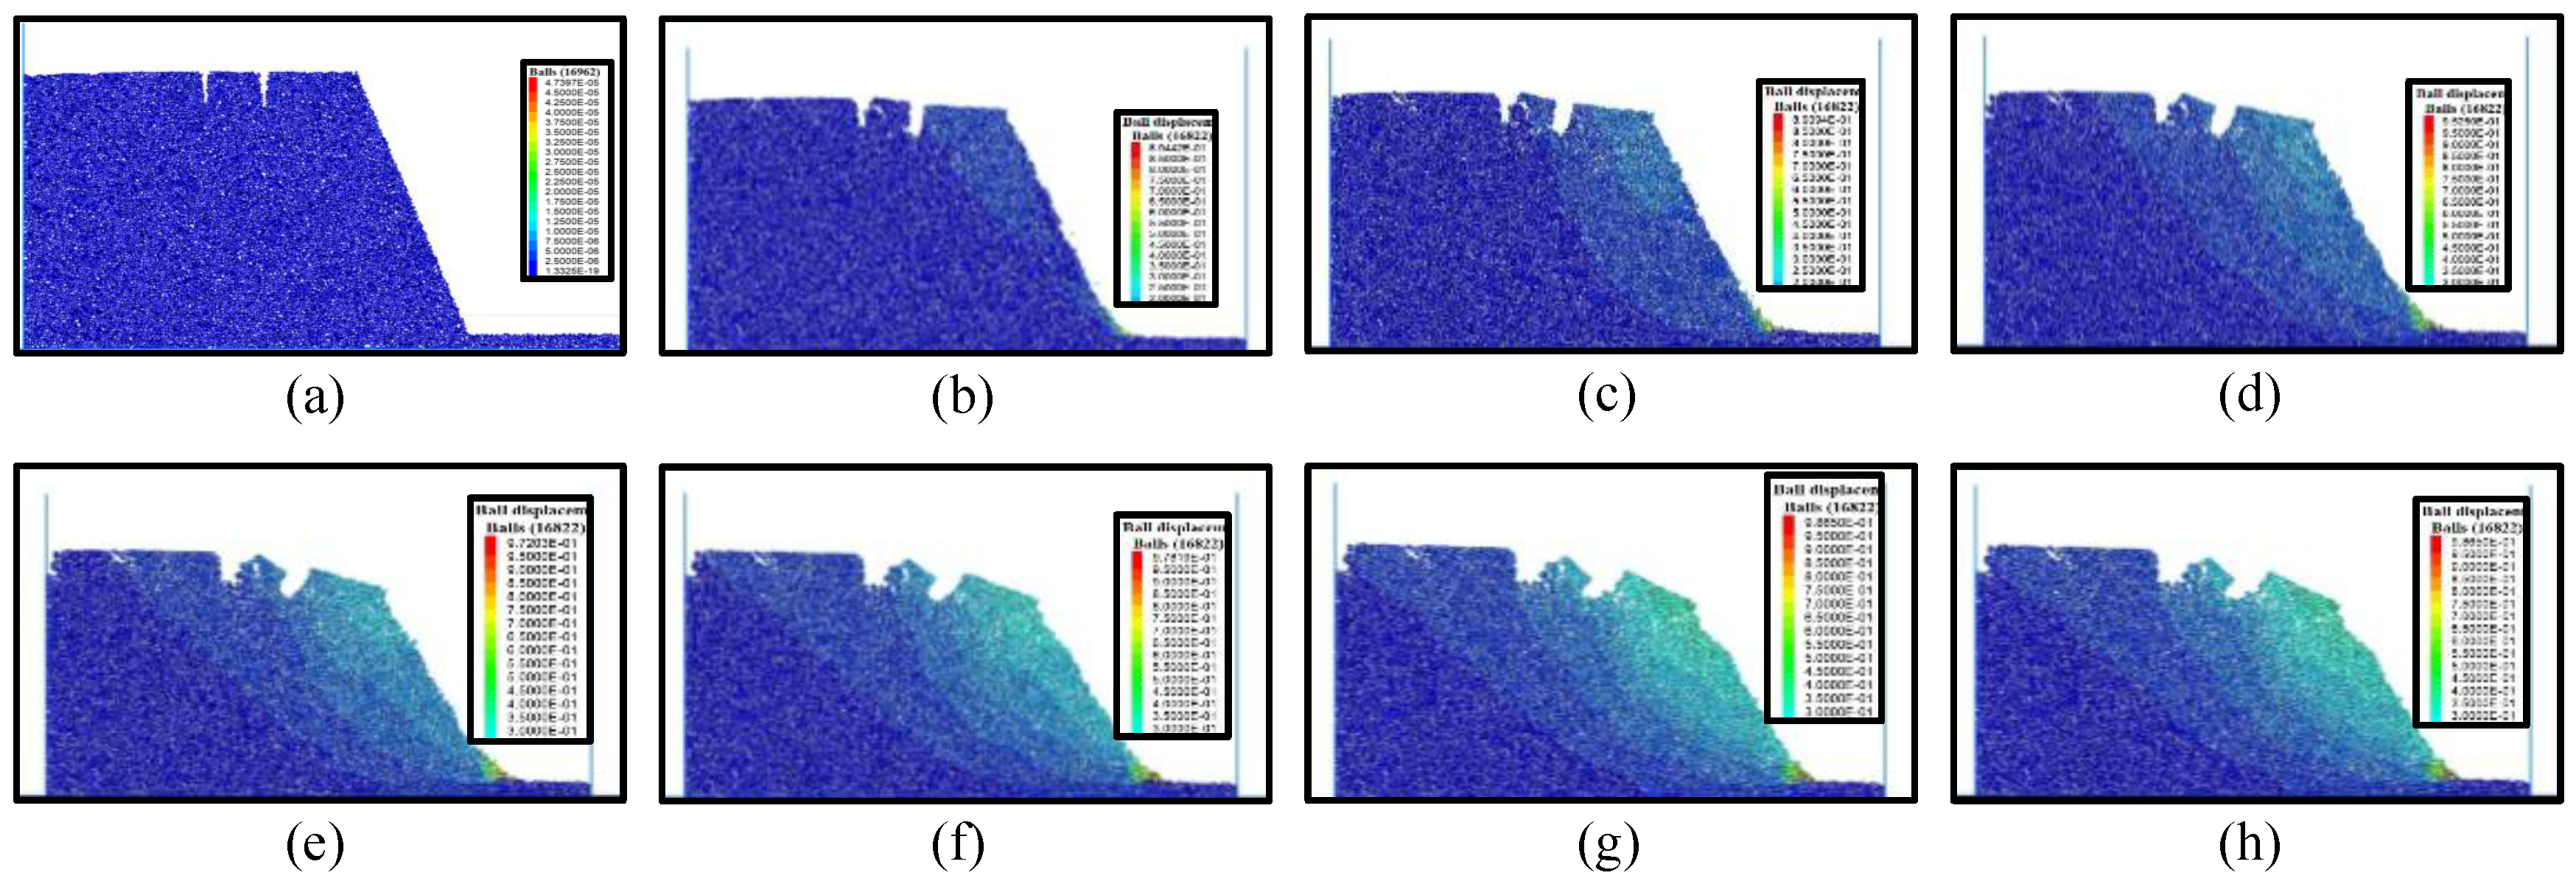
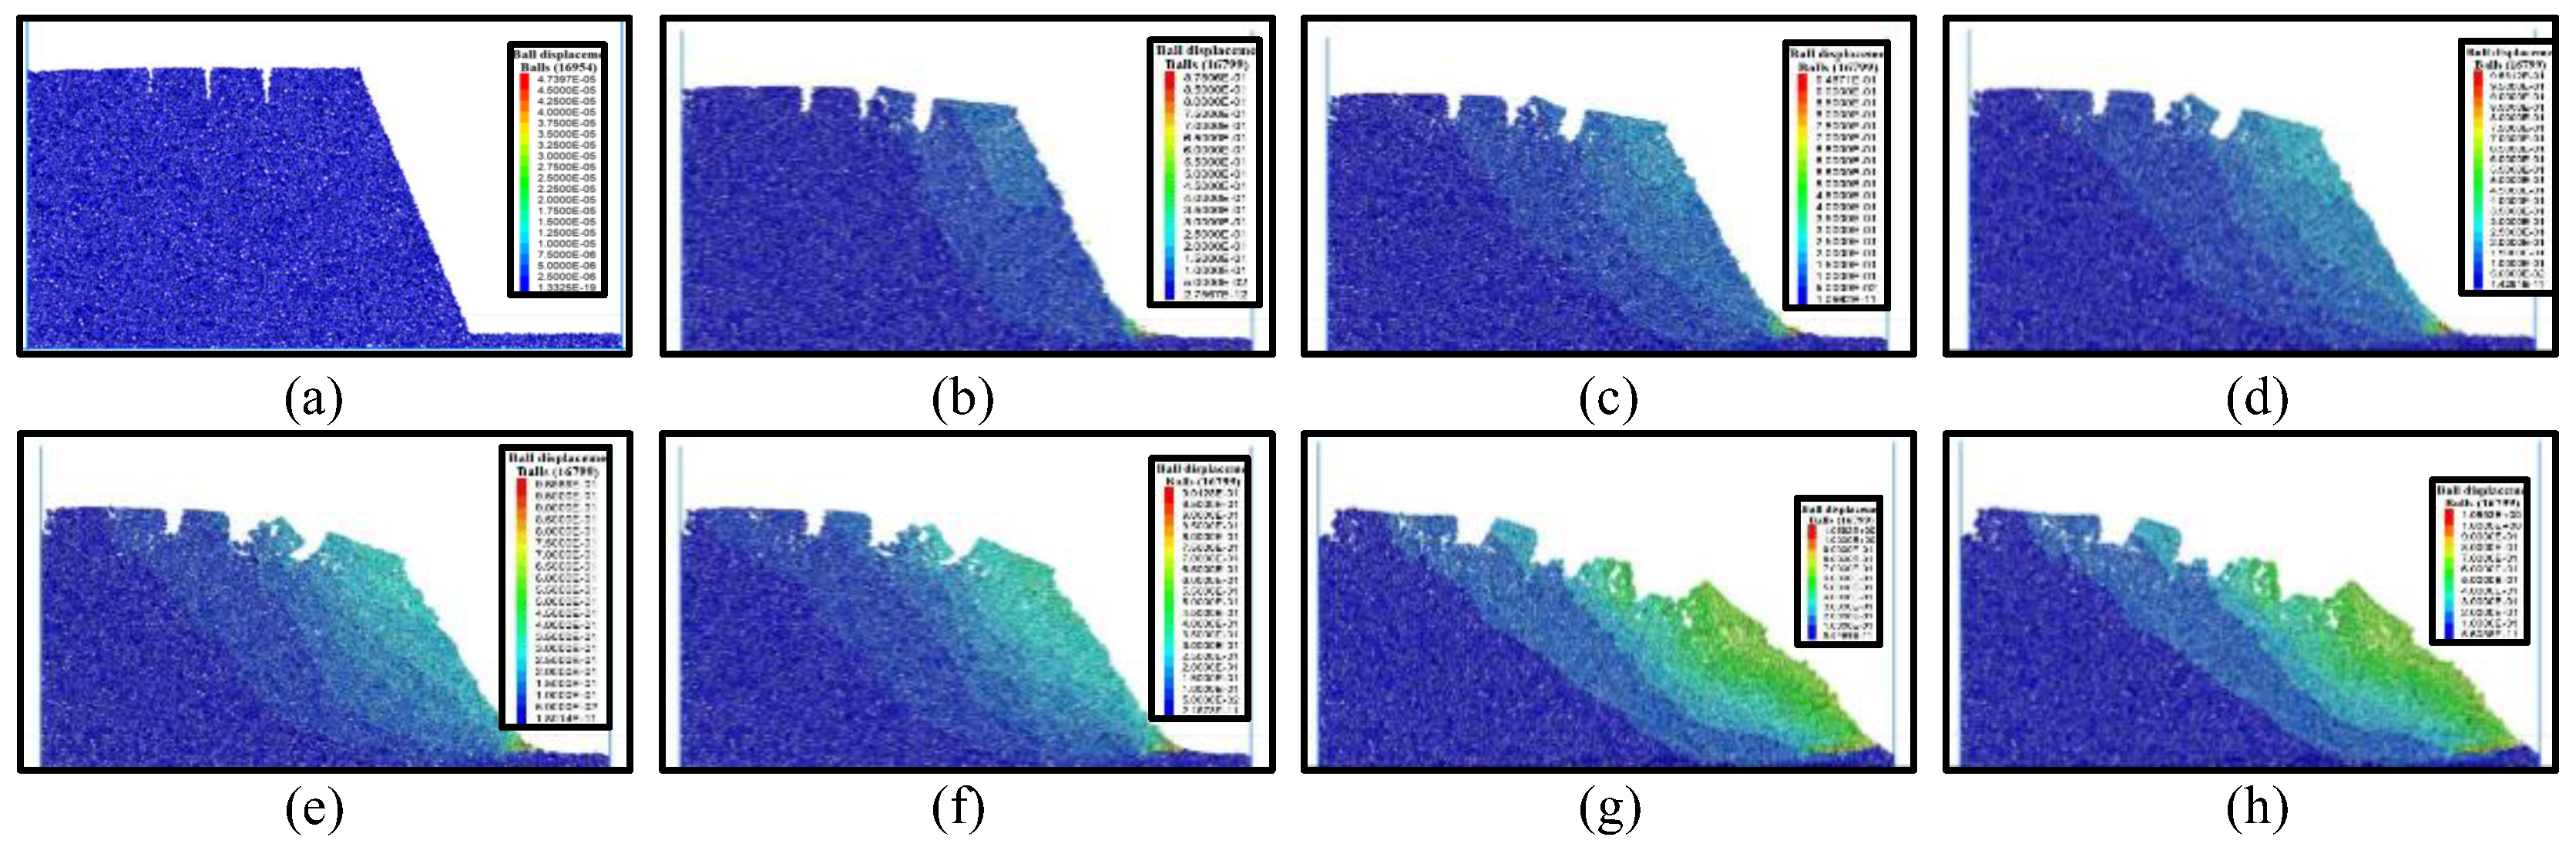
4.2. Numerical Simulation Results

This simulation mainly focused on the influence of cracks on the slope, as shown in Figure 15, where each case corresponds to the degree of cracks caused by a wetting–drying cycle on the soil. Owing to the increase in the number of dry–wet cycles, the width and depth of the newly developed cracks decreased, whereas the original cracks exhibited little change. Therefore, (a) is the case where there is no crack after slope cutting, (b) shows the occurrence of a fissure in the slope, (c) is the case with two cracks on the slope, and (d) is the case with three cracks in the slope; each subfigure corresponds to the slope influenced by cracks under different dry–wet cycles.
There are no cracks in the soil slope without a wetting–drying cycle. The slope without cracks has only a small amount of displacement at the foot of the slope. The overall slope does not produce large deformation, and the slope remains in a stable state, as shown in Figure 16.
The development of slopes experiencing a wetting–drying cycle is shown in Figure 17. The soil in front of the crack starts to slip downward, and the crack creates a tear opening that facilitates a soil slip. The tensile crack of the soil above the inclined plane before the crack increases the width of the crack, and the slope-inclined plane begins to slide, forming a sliding surface. When the slip surface moves to a certain extent, the soil behind the crack is pulled, causing the soil behind to slip. Finally, the slope collapses completely.
Figure 18 shows the effect of two cracks on the slope. Since the initial cracks release the stress of the soil, the depth of the second crack becomes smaller, and the width becomes narrower. After the two cracks are produced, they continued to slide in the direction of the initial crack close to the slope surface. During the sliding process, the soil between the secondary crack and the initial crack is pulled, causing deformation. After the second crack is generated, the sliding surface also moves backward, and the soil behind the second crack exhibits a sliding trend. The soil behind it is cracked owing to variations in stress.
As shown in Figure 19, after three wetting–drying cycles, more cracks are generated on the slope, which increased the sliding range and the deformation of the slope. During slope deformation, the slope slip speed increases, the overall stability reduces, and the soil deformation between cracks intensifies. The slope’s state of instability becomes obvious. However, owing to the depth and width of the secondary cracks, their influence on the slope is not as great as that of the initial cracks. Cracks closer to the slope tear more easily from the crack mouth to form slip surfaces. The width and depth of the cracks cause the slip to move toward the internal soil. It can be seen that the presence of cracks significantly influences slope stability. The deeper the crack depth, the wider the crack width, and the closer the crack is to the slope surface, the more prone the slope is to instability.
The expansive soil slope model was established using the PFC particle flow software. The occurrence of slope cracks under different dry–wet cycles was determined by varying the depth, width, and number of cracks. The failure process of a slope with cracks can be observed intuitively by performing simulations, and the influence of cracks on slope failure and the degree of influence of the crack depth, width, and position on the slope can be obtained.
As shown in Figure 20, the sliding soil layer of the slope was divided into three layers from top to bottom, and the average sliding displacement generated by each second of operation was monitored.
Table 4a–c lists the displacements of each layer within 5 s for one, two, and three cracks, respectively. It can be concluded that the sliding displacement distances of the soil at different depths are different. Since the sliding surface of the first layer of soil in the front of the soil slope slides, it drives the movement of the second and third layers of soil behind. The movement of the second and third layers of soil is pulled by the soil behind, which decreases the downward sliding speed and reduces the displacement of the soil. The greater the sliding surface of the soil, the larger the sliding displacement. In contrast, the soil close to the bottom and rear is less prone to sliding. When there is only one crack, the sliding surface above the soil only moved along the crack direction. This is because when the crack expands, the integrity of the soil is destroyed, and a sliding surface develops along the weak part of the destruction. It is also easier for the stress generated in the soil to be released into the cracked part. With an increasing number of cracks, the sliding surface moves backward, the sliding distance, speed, and the number of particles producing a displacement of the soil increase, and the stability of the soil decreases.

5. Conclusions

An indoor wetting–drying cycle test was conducted on an expansive soil slope using a wetting–drying cycle device. The change in water content of the soil at different depths was monitored using a water content sensor, and the following conclusions were drawn:
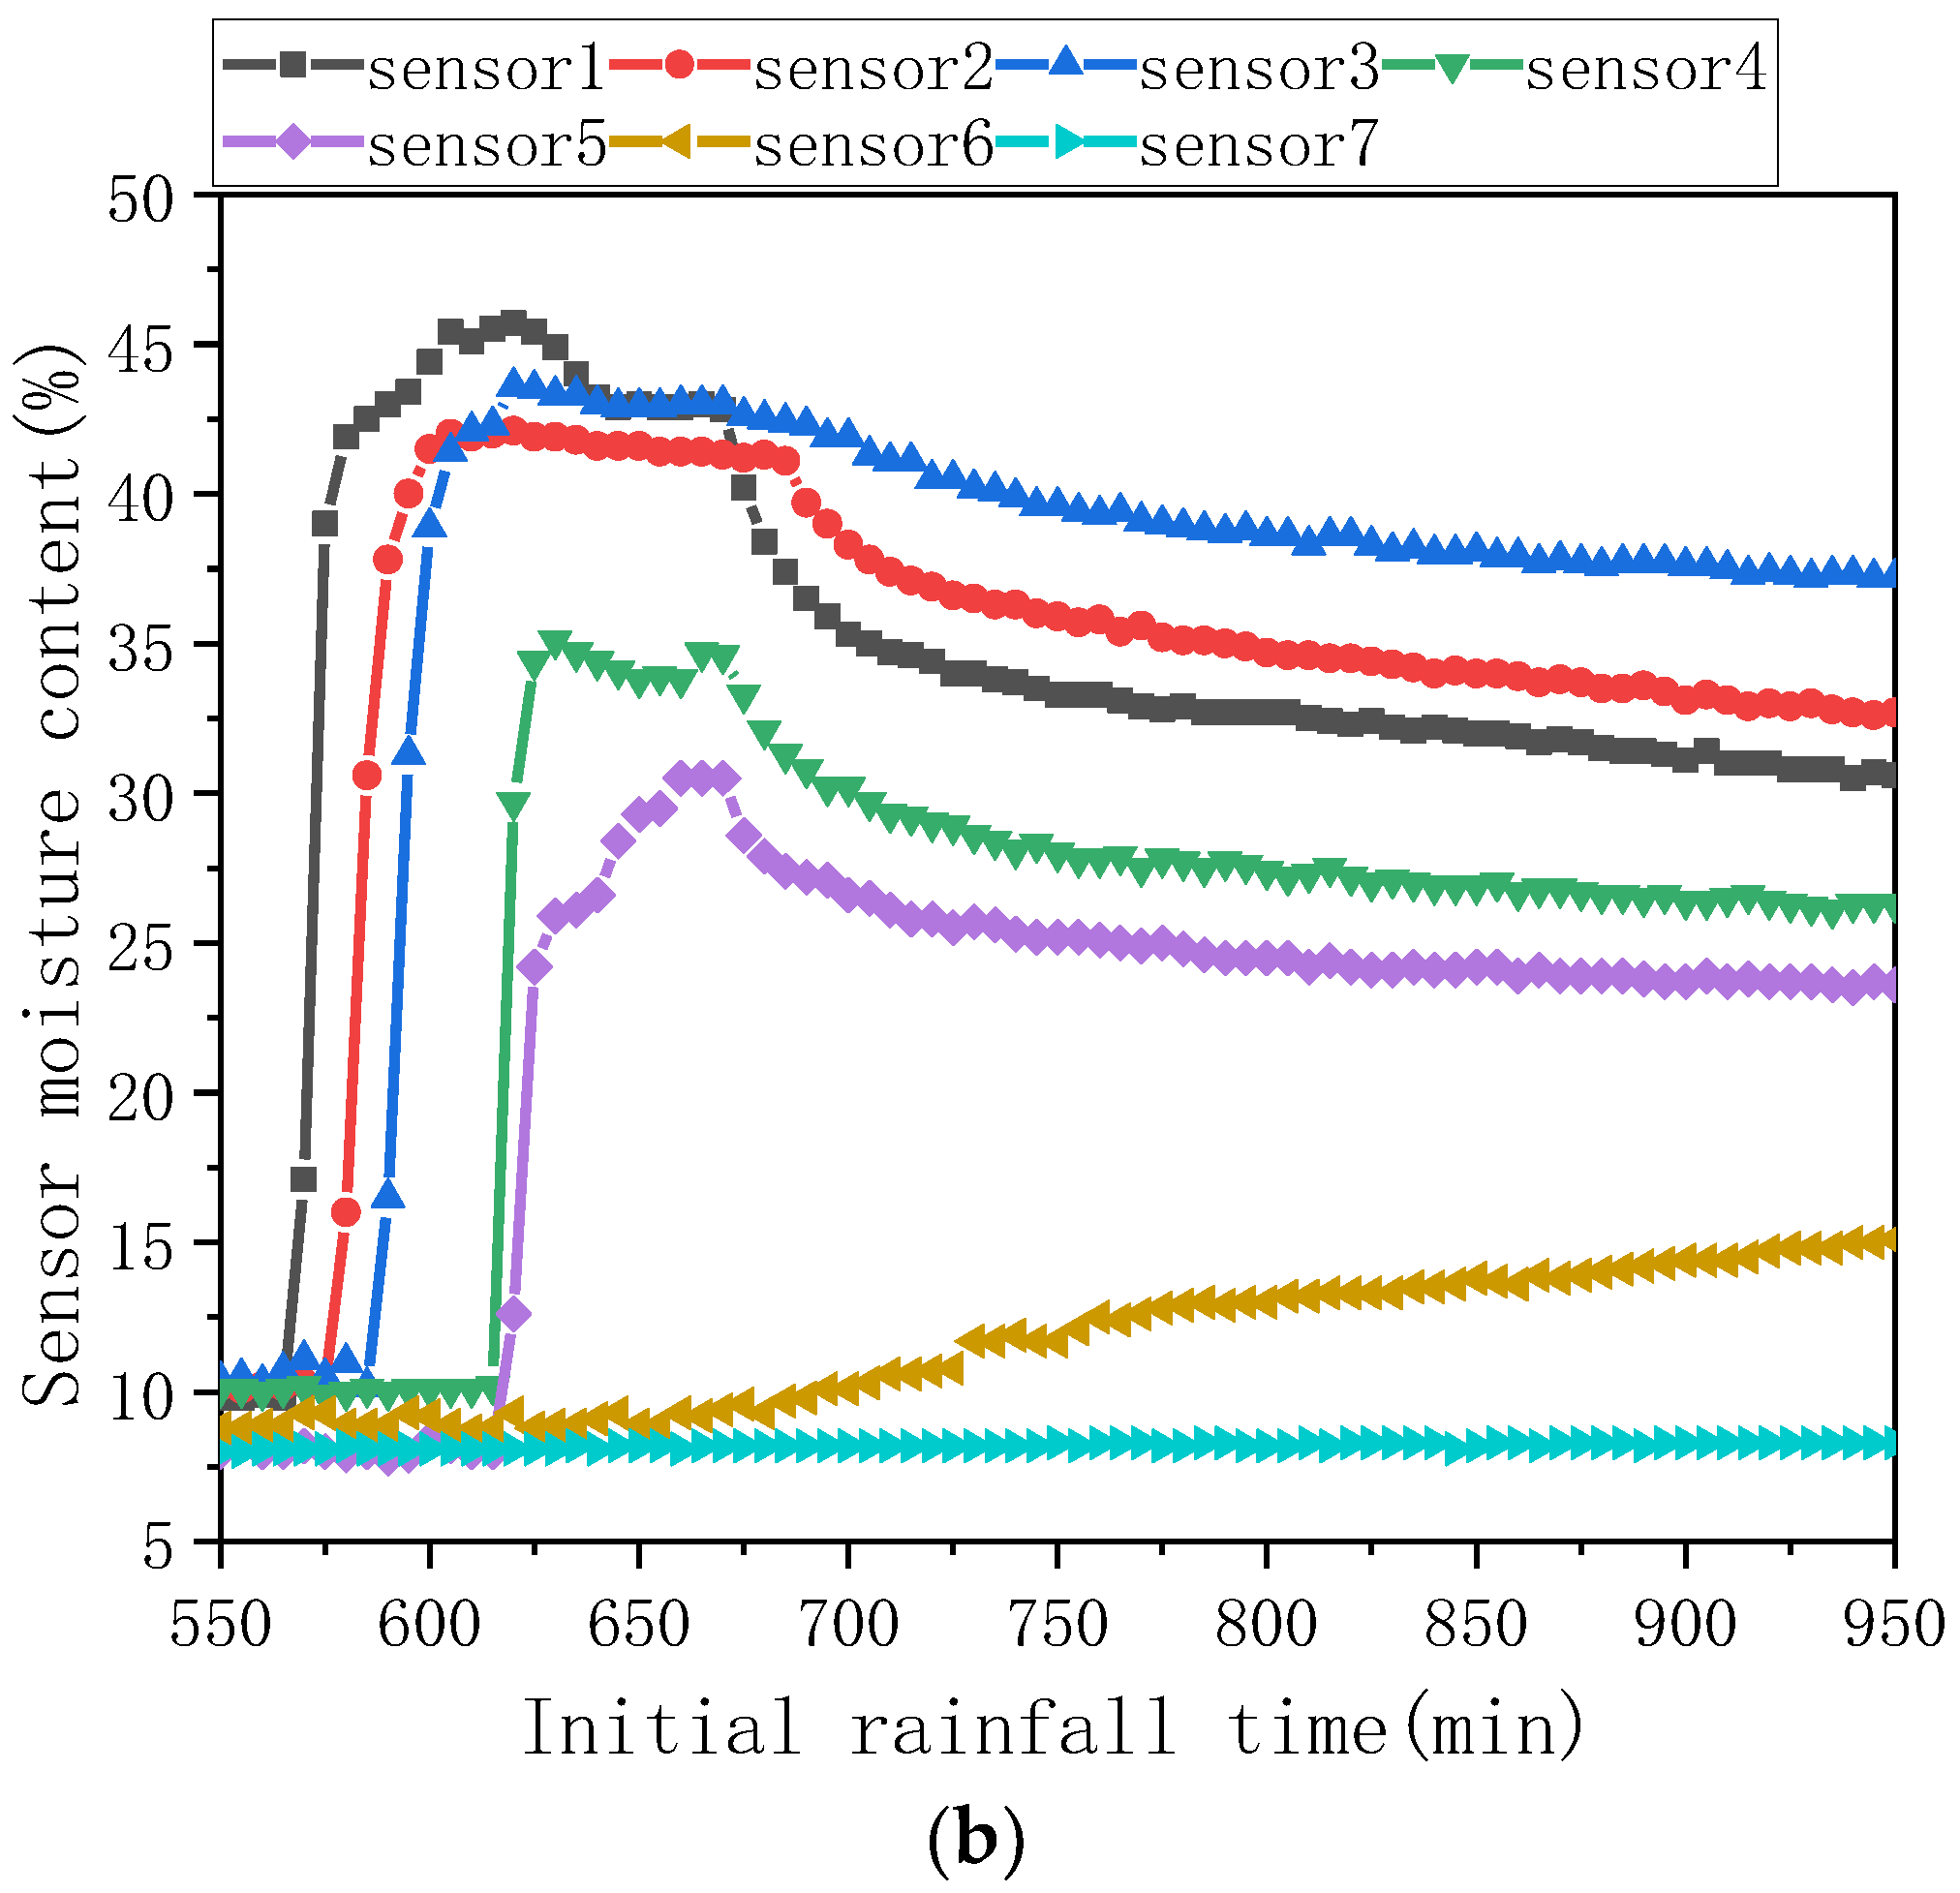
  • With an increasing number of wetting–drying cycles, the infiltration rate of rainwater into the lower layers of the soil was found to be much higher compared to soil without multiple cycles.
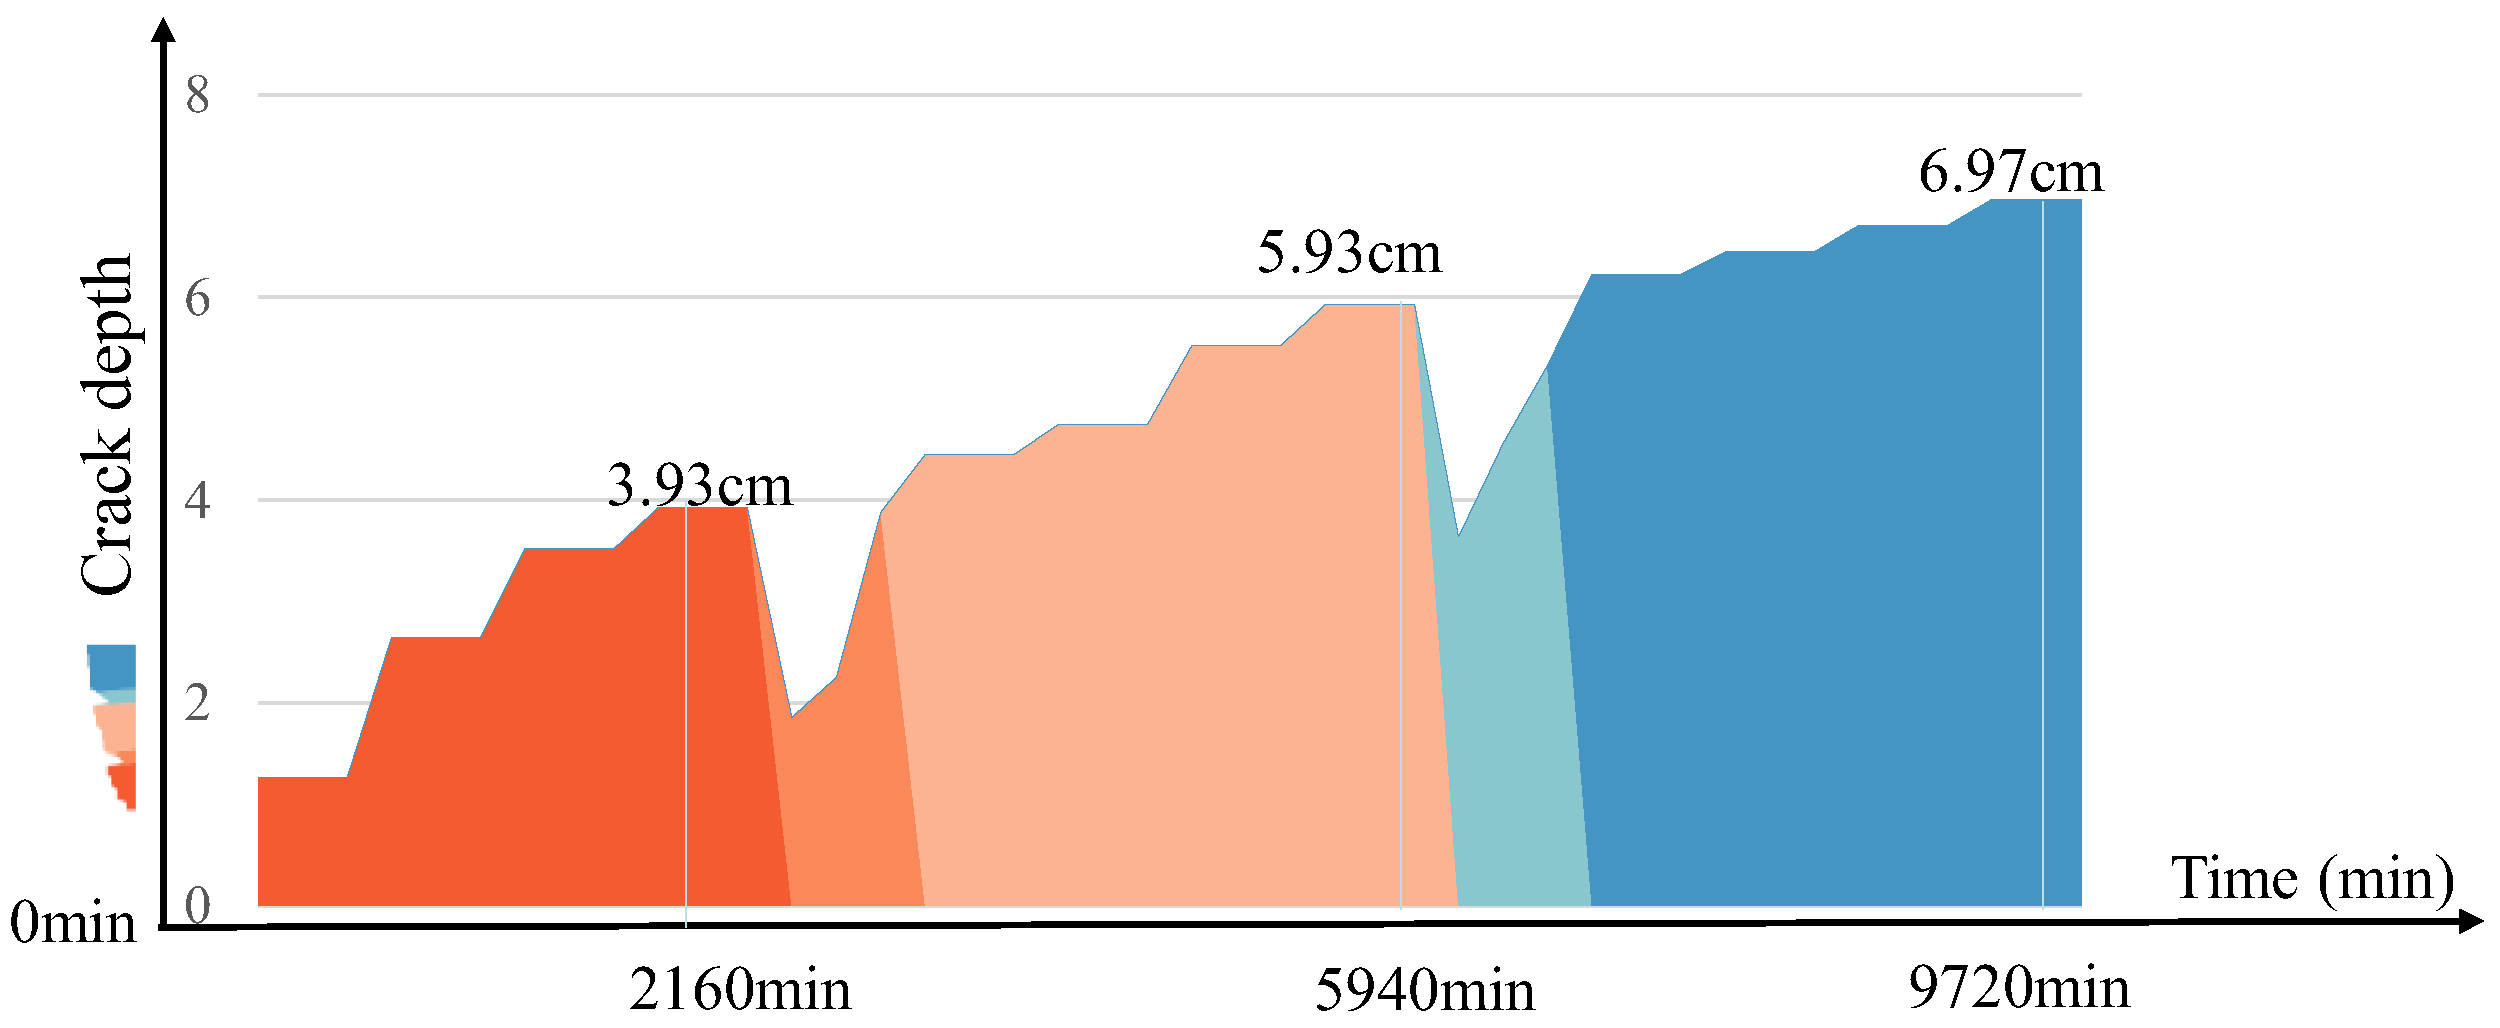
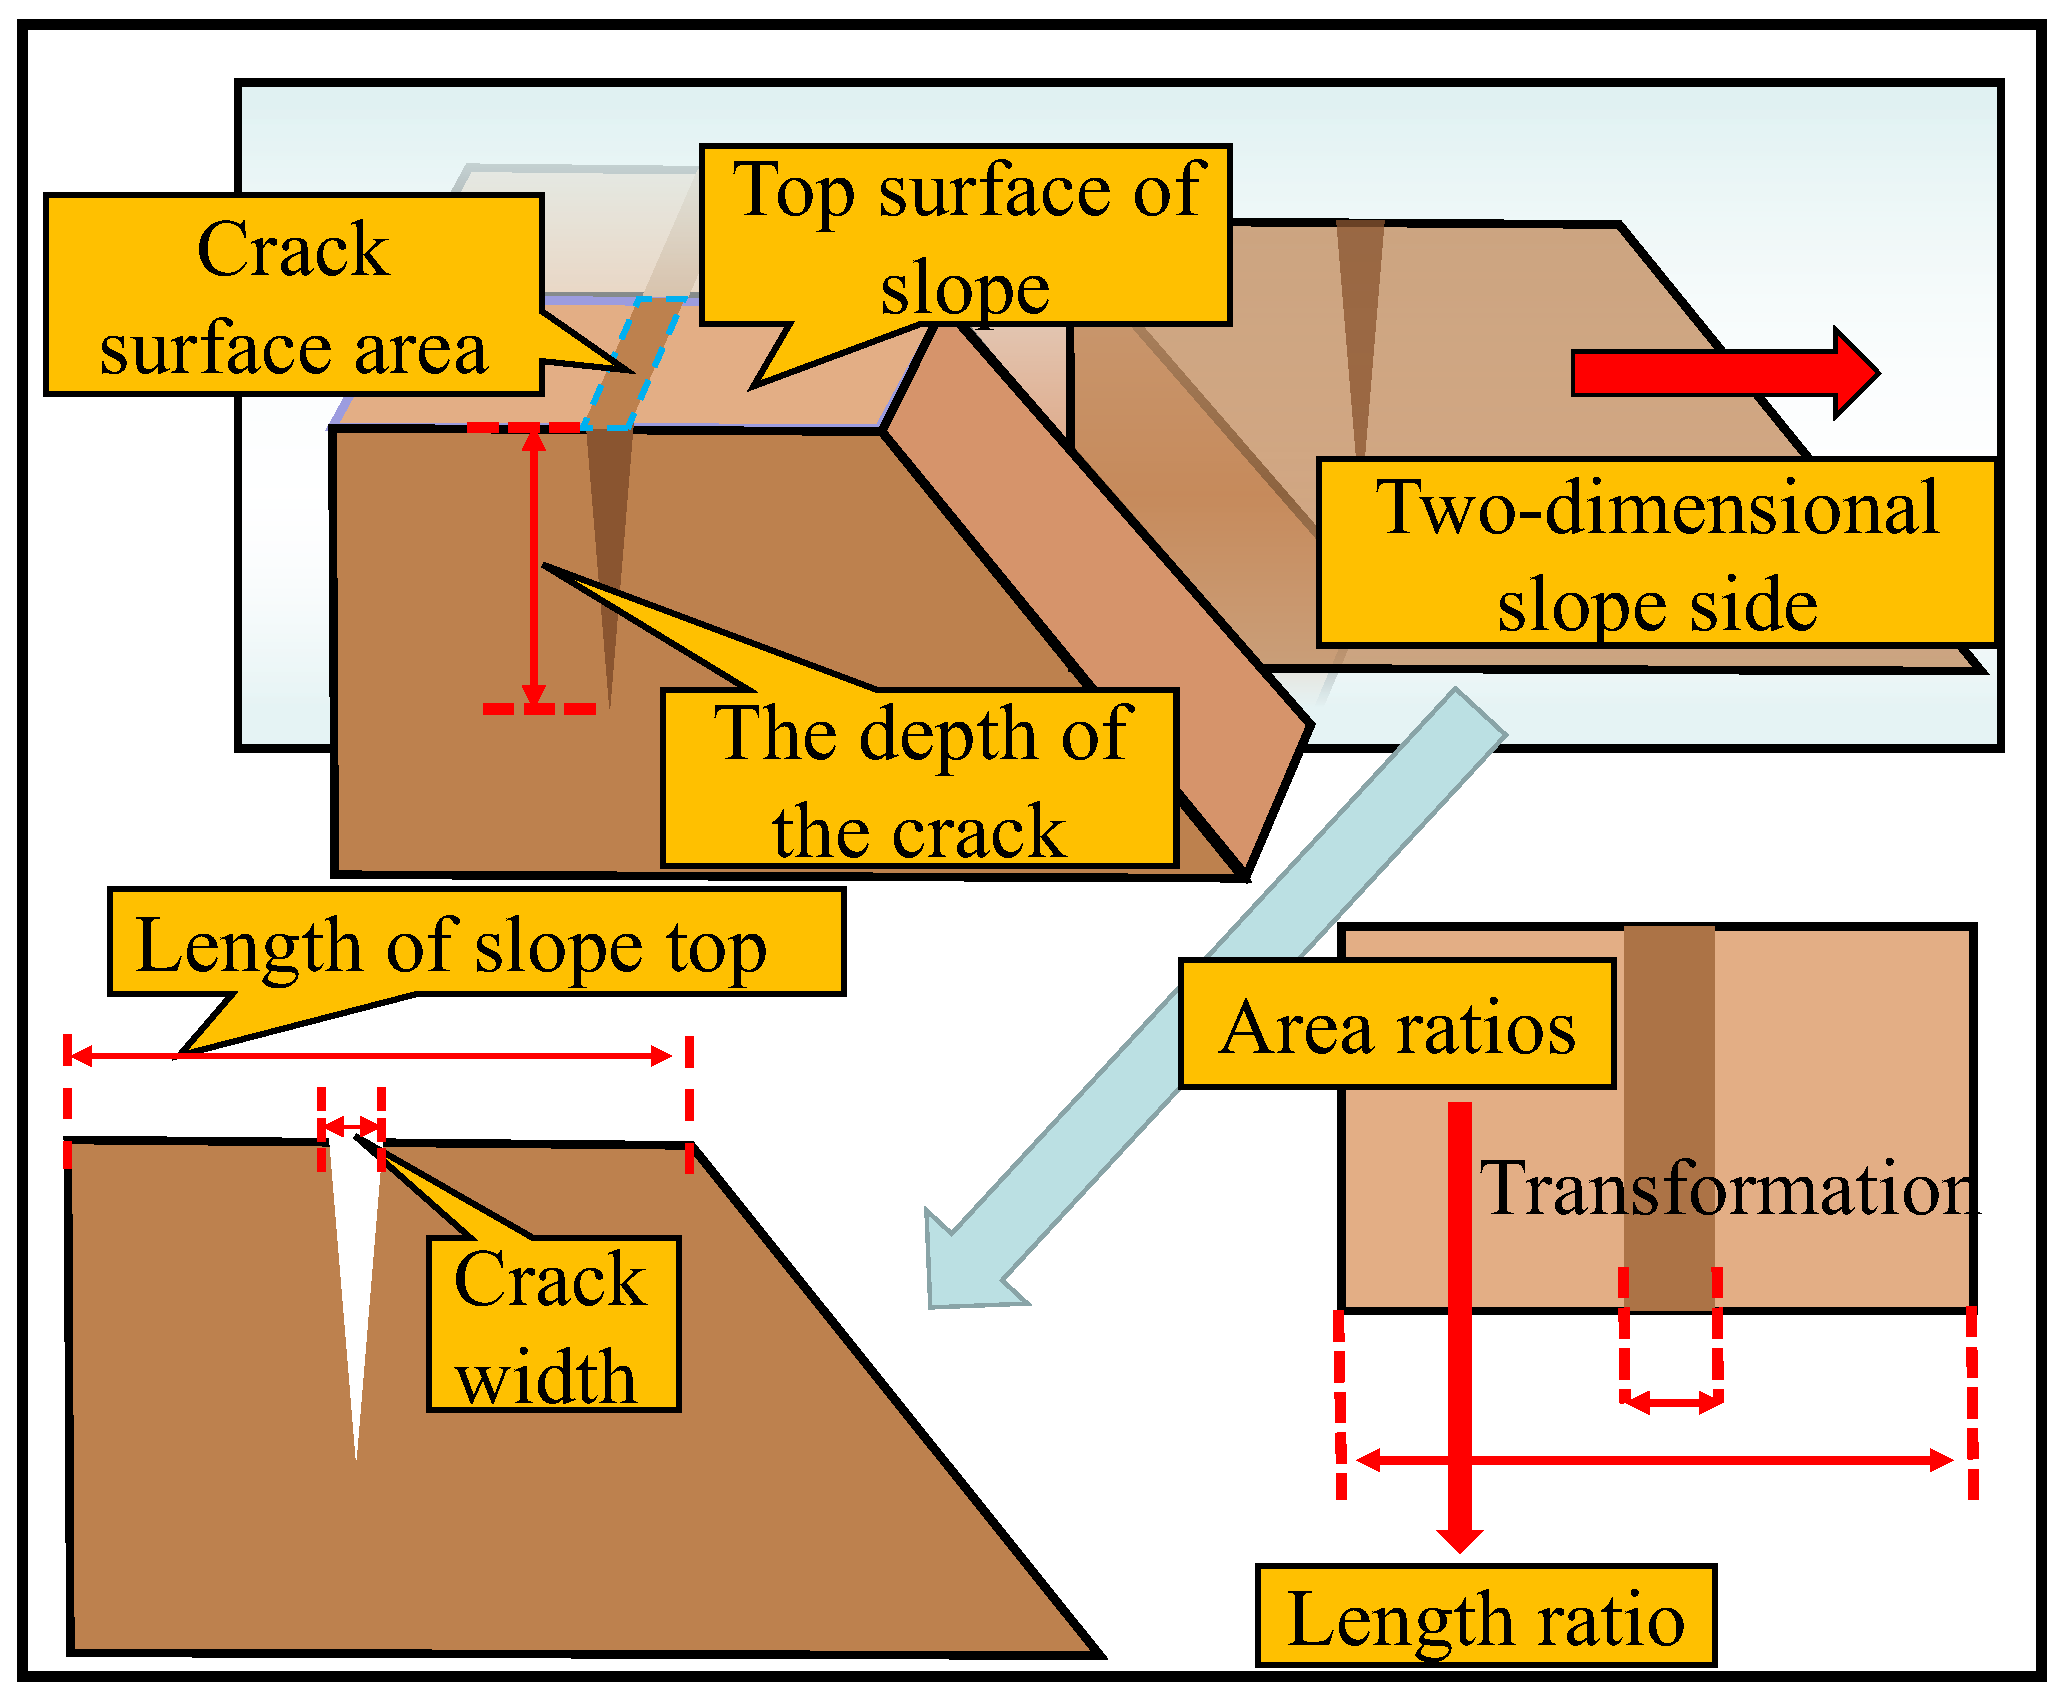
  • A self-made binary image processing system was used to quantify the crack area of the soil, and a crack depth detector was used to measure the crack depth of the slope. It was found that the crack area and depth increased with the number of wetting–drying cycles, but the growth trend decreased.
  • Using the PFC numerical calculation software and taking the quantitative results as simulation parameters, it was observed that the number of cracks and their location significantly influenced slope failure. An increase in the number of wetting–drying cycles led to a greater number of cracks, resulting in significant changes to the slope, an obvious slip, slope instability, and a backward movement of the slip surface.

Author Contributions

Methodology, X.L. (Xiaohua Liu); Software, J.C.; Resources, X.J.; Writing—original draft, X.C.; Writing—review & editing, X.L. (Xiaoshuang Li); Project administration, Q.M. All authors have read and agreed to the published version of the manuscript.

Funding

This research was funded by the National Key R&D Program of China (2017YFC1501201), National Natural Science Foundation of China (Grant Nos. 51974051, 51804051, and 51804222), China Occupational Safety and Health Association (CXCY-2021-19), Natural Science Foundation project of Chongqing Science and Technology Commission (No. cstc2018jcyjAX0231), Chongqing Special Postdoctoral Science Foundation (Grant No.XmT2018017), Post-Funded Projects of Chongqing University of Science and Technology (No.ckhqzz2008005), Self-made Equipment Foundation of Chongqing University of Science and Technology (No. ZZSB2019013), and the Scientific and Technological Research Program of the Chongqing Municipal Education Commission (KJZD-K201901501).This project was also supported by the project of slope safety control and disaster prevention technology innovation team of “Youth Innovation Talent Introduction and Education Plan” of Shandong Colleges and Universities (Grant No. Lu Jiao Ke Han (2021) No. 51), Guizhou Province Science and Technology Planning Project (Grant No. Guizhou science and technology cooperation support (2022) common 229), National Natural Science Foundation of Shandong Province of China (NSFC) (Grant No. ZR202112040076), The State Key Laboratory of Coal Resources and Safe Mining CUMT (SKLCRSM22KF009), the Open Fund of National Engineering and Technology Research Center for Development and Utilization of Phosphate Resources of China (Grant No. funded the research work NECP 2022-04), the Open Fund of Key Laboratory of Geological Hazards on Three Gorges Reservoir Area (China Three Gorges University), and the Ministry of Education (Grant No. 2022KDZ07); 2022 Chongqing Municipal Education Commission Science and Technology Research Plan Project Contract No(KJZD-M202202401).

Institutional Review Board Statement

Not applicable.

Informed Consent Statement

Not applicable.

Data Availability Statement

The original contributions presented in the study are included in the article, further inquiries can be directed to the corresponding authors.

Conflicts of Interest

The authors declare no conflict of interest.

Appendix A

Table A1. Number of drying–wetting cycles and water content, crack, and soil mass data.
Number of Drying–Wetting CyclesCrack Area (m2)Crack Rate%Soil Area
Ratio%
Water
Content%
10.084810.689.431.8
20.112814.185.932.1
30.126415.884.232
Table A2. Relationship between rainfall period and crack depth.
Depth of Crack (cm)Period
1.26Drying time
2.65
3.52
3.93
1.86Rain heals and cracks again
2.25
3.88
4.45Drying time
4.75
5.53
5.93
3.64Rain heals and cracks again
4.56
5.33
6.23Drying time
6.450
6.710
6.970

References

  1. Zienkiewicz, O.C.; Humpheson, C.; Lewis, R.W. Associated and Non-Associated Visco-Plasticity and Plasticity in Soil Mechanics. Geotechnique 1975, 25, 671–689. [Google Scholar] [CrossRef]
  2. Konrad, J.M.; Ayad, R. An Idealized Framework for the Analysis of Cohesive Soils Undergoing Desiccation: Reply (1). Can. Geotech. J. 1998, 35, 1115. [Google Scholar] [CrossRef]
  3. Fredlund, D.G.; Rahardjo, H. Soil Mechanics for Unsaturated Soils; John Wiley & Sons: Hoboken, NJ, USA, 1993. [Google Scholar]
  4. Tang, C.S.; Cheng, Q.; Leng, T.; Shi, B.; Zeng, H.; Inyang, H. Effects of wetting-drying cycles and desiccation cracks on mechanical behavior of an unsaturated soil. CATENA 2020, 194, 104–116. [Google Scholar] [CrossRef]
  5. Zhang, J.; Guang, Z. Study of the Fissures, Volume Change and Permeability of Expansive Soil under Wetting and Drying Cycles. Master’s Dissertation, South China University of Technology, Guangzhou, China, 2010. (In Chinese). [Google Scholar]
  6. Luo, Z.; Wang, S.; Zhang, J.; Yang, Z. Experimental study on thickness effect of crack development in expansive soil. Chin. J. Geotech. Eng. 2020, 42, 1922–1930. [Google Scholar]
  7. Wang, W.; Kong, L.; Zang, M.; Zhang, C. Experimental Research on Crack Extension and Indoor Rainfall Infiltration of Nanyang Expansive Soil. J. Southwest Pet. Univ. 2015, 37, 174–184. (In Chinese) [Google Scholar]
  8. Wang, X.; Yao, Z.; Dang, F.; Dong, Z. Meso-structure evolution of cracked expansive soils. Trans. Chin. Soc. Agric. Eng. 2016, 32, 92–100. [Google Scholar]
  9. Yang, R.; Xiao, P.; Qi, S. Analysis of Slope Stability in Unsaturated Expansive Soil: A Case Study. Front. Earth Sci. 2019, 7, 292. [Google Scholar] [CrossRef]
  10. Huang, R.; Lizhou, W.U. Stability Analysis of Unsaturated Expansive Soil Slope. Earth Sci. Front. 2007, 14, 129–133. [Google Scholar] [CrossRef]
  11. Ma, J.; Chen, S.; Yu, F. Experimental study on the evolution of cracks in cracked soil. Rock Soil Mech. 2007, 141, 2203–2208. [Google Scholar]
  12. Ma, J. Preferential Flow and Stability Analysis Method for Fissure Clay Slopes. Master’s Thesis, Wuhan Institute of Geotechnics, Chinese Academy of Sciences, Wuhan, China, 2007. [Google Scholar]
  13. Yao, Z.; Chen, Z. Experimental study on meso-structure change of remolded expansive soil during drying and wetting. J. Undergr. Space Eng. 2009, 5, 429–434. [Google Scholar]
  14. Chen, Z.; Fang, X.; Zhu, Y.; Qin, B.; Wei, X.; Yao, Z. Study on mesostructure and Evolution of expansive soil and loess. Rock Soil Mech. 2009, 30, 1–11. [Google Scholar]
  15. Cao, L.; Wang, Z.; Zhang, Z. Experimental study on crack evolution characteristics of expansive soil under rainfall and evaporation conditions. Chin. J. Rock Mech. Eng. 2016, 35, 413–421. [Google Scholar]
  16. Luo, Y.; Zhang, J.; Zhou, Z.; Qie, H.; Mi, M.; Shen, J. Study on evolution of critical water content of soil cracking under rainfle-evaporation condition. Rock Soil Mech. 2020, 41, 2592–2600. [Google Scholar]
  17. Xie, C.; Shen, Q.; Wu, Z.; Zhao, Y.; Mei, G. Stability Analysis for the Expansive Soil Slope Considering the Influence of Cracks Based on the Upper Bound Method. IOP Conf. Ser. Earth Environ. Sci. 2018, 189, 2014–2033. [Google Scholar] [CrossRef]
  18. Liu, H.; Yin, Z. Experimental study on the influence of cracks on shear strength of expansive soil. Rock Soil Mech. 2010, 31, 727–731. [Google Scholar]
  19. Chen, X.; Jing, X.; Chen, Y. Tailings Dam-break: The Influence of Slurry with Different Concentrations on Downstream. Front. Earth Sci. 2021, 9, 1176. [Google Scholar] [CrossRef]
  20. Julina, M.; Thyagaraj, T. Determination of Volumetric Shrinkage of an Expansive Soil Using Digital Camera Images. Int. J. Geotech. Eng. 2018, 15, 624–632. [Google Scholar] [CrossRef]
  21. Fityus, S.; Wells, T.; Huang, W. Water Content Measurement in Expansive Soils Using the Neutron Probe. Geotech. Test. J. 2011, 34, 255–264. [Google Scholar]
  22. Inci, G. Numerical Modeling of Desiccation Cracking in Compacted Soils. In Proceedings of the 12th International Conference of International Association for Computer Methods and Advances in Geomechanics (IACMAG), Goa, India, 1–6 October 2008. [Google Scholar]
  23. Sima, J.; Jiang, M.; Zhou, C. Numerical Simulation of Desiccation Cracking in a Thin Clay Layer Using 3D Discrete Element Modelling. Comput. Geotech. 2014, 56, 168–180. [Google Scholar] [CrossRef]
  24. Le, T.C.; Liu, C.; Tang, C.S. Numerical Simulation of Desiccation Cracking in Clayey Soil Using a Multifield Coupling Discrete-Element Model. J. Geotech. Geoenviron. Eng. 2022, 148, 04021183. [Google Scholar] [CrossRef]
  25. Wang, P.; Fu, Q. Influence of Rainfall Infiltration on Stability of Fissured Clay Slope. Highw. Eng. 2013, 38, 165–170+192. [Google Scholar]
  26. Yuan, J.; Lin, Y.; Ding, P.; Han, C. Influence of Fissure Induced Anisotropy on Rainfall Infiltration of Slope. Chin. J. Geotech. Eng. 25, 143–149. 2016, 38, 76–82. [Google Scholar]
  27. Wei, J.; Cao, X.; Yuan, J. Yang, C. Effect of Rainfall/Evaporation on Stability of Expansive Soil Slope. Eng. Investig. 2010, 38, 8–13. [Google Scholar]
  28. Bai, Y.; Wei, B.; Zheng, W. Stability Analysis of Expansive Soil Slope Considering Crack and Expansive Force. Transp. Sci. Technol. Econ. 2020, 22, 49–56. [Google Scholar]
  29. Chen, X.; Jing, X.; Cai, H. Hydraulic Erosion Rate of Reinforced Tailings: Laboratory Investigation and Prediction Model. Adv. Mater. Sci. Eng. 2021, 2, 1–13. [Google Scholar] [CrossRef]
  30. Xiao, F.; Jing, X.; Zhou, Y.; Zhao, S. Study on Influence of Reinforcement Density on Overtopping Failure of Tailings Dam. J. Saf. Sci. Technol. 2016, 12, 68–74. [Google Scholar]
  31. Liu, K.H.; Cai, H.; Jing, X.F. Study on Hydraulic Incipient Motion Model of Reinforced Tailings. Water 2021, 13, 2033. [Google Scholar] [CrossRef]
  32. Sun, K.; Tang, C.; Liu, C.; Li, H.; Wang, P.; Leng, T. Research Method of Soil Cracking. Rock Soil Mech. 2017, 38 (Supp. 1), 11–26. [Google Scholar]
  33. Zhao, G.L.; Shi, J.W.; Zhen, B.Y. Quantitative Analysis of Fracture Evolution of Expansive Soils Under Wetting-Drying Cycles. Rock Soil Mech. 2020, 41, 11. [Google Scholar]
  34. Zhao, G.L.; Shi, J.W.; Ji, W.Z. Thickness Effect on Crack Evolution of Expansive Soil. Chin. J. Geotech. Eng. 2020, 42, 1922–1930. [Google Scholar]
  35. Xiao, F.; Jing, Y.U.L.C.; Dacid, J.W.; Marcelo, L.S.; Hengwei, Z. Overtopping Failure of a Reinforced Tailings Dam: Laboratory Investigation and Forecasting Model of Dam Failure. Water 2019, 11, 315–331. [Google Scholar]
  36. Yin, Z.; Yuan, J.; Wei, J.; Cao, X.; Liu, H.; Xu, S. Influence of Cracks on Stability of Expansive Soil Slope. Chin. J. Geotech. Eng. 2012, 34, 2155–2161. [Google Scholar]
  37. Liu, Y. Study on the Relationship between Water Content and Mechanical Characteristics of Expansive Soil; Southwest Jiaotong University: Chengdu, China, 2013. [Google Scholar]
  38. Tang, C.-s.; Shi, B.; Liu, C. Experimental characterization of shrinkage and desiccation cracking in thin clay layer. Appl. Clay Sci. 2011, 52, 69–77. [Google Scholar] [CrossRef]
  39. Ma, Z.; Shen, J.; Wang, C. Characterization of sustainable mortar containing high-quality recycled manufactured sand crushed from recycled coarse aggregate. Cem. Concr. Compos. 2022, 132, 104629. [Google Scholar] [CrossRef]
  40. Gao, W.; Yang, H.; Hu, R. Soil–rock mixture slope stability analysis by microtremor survey and discrete element method. Bull. Eng. Geol. Environ. 2022, 81, 121. [Google Scholar] [CrossRef]
  41. Lv, Y.; Li, H.; Zhu, X. Discrete element method simulation of random Voronoi grain-based models. Clust. Comput. 2017, 20, 335–345. [Google Scholar] [CrossRef]
  42. Jin, L.; Zeng, Y. Refined simulation for macro-and meso-mechanical properties and failure mechanism of soil-rock mixture by 3d dem. Chin. J. Rock Mech. Eng. 2018, 37, 1540–1550. [Google Scholar]
  43. Xu, G.; Zhong, K.; Fan, J. Stability analysis of cohesive soil embankment slope based on discrete element method. Cent. South Univ. 2020, 27, 1981–1991. [Google Scholar] [CrossRef]
  44. Lin, H.Z. Experimental and Numerical Analysis of Soil Slope Instability Induced by Rainfall; Tsinghua University: Beijing, China, 2007. [Google Scholar]
  45. Wu, S.; Wu, D.; Xiao, F. Rainfall Erosion Predictions for Artificial High-Filled Embankment with Reinforcement. Adv. Mater. Sci. Eng. 2021, 2021, 3648105. [Google Scholar] [CrossRef]
Figure 1. Wetting–drying circulation device.
Sustainability 15 05655 g001
Figure 2. Material diagram of dry–wet circulation device.
Sustainability 15 05655 g002
Figure 3. State of the top of the slope after different cycles.
Sustainability 15 05655 g003
Figure 4. (a) Porous structure of soil; (b) Bubble damage to the soil surface.
Sustainability 15 05655 g004
Figure 5. (a) Relationship between water content and wetting–drying cycle time; (b) Variation in water content during initial rainfall.
Sustainability 15 05655 g005aSustainability 15 05655 g005b
Figure 6. Binary image processing results of the top of the slope.
Sustainability 15 05655 g006
Figure 7. Relationship between drying–wetting cycles and crack area ratio.
Sustainability 15 05655 g007
Figure 8. Crack depth development process.
Sustainability 15 05655 g008
Figure 9. Boundary conditions of the model.
Sustainability 15 05655 g009
Figure 10. Model after shearing.
Sustainability 15 05655 g010
Figure 11. Maximum resultant force on the wall.
Sustainability 15 05655 g011
Figure 12. (a) Numerical simulation shear strength envelope; (b) Measured shear strength envelope of saturated soil.
Sustainability 15 05655 g012
Figure 13. Conversion of slope area ratio to length ratio.
Sustainability 15 05655 g013
Figure 14. (a) Crack lateral transformation; (b) Number and location of cracks.
Sustainability 15 05655 g014
Figure 15. Crack settings for different conditions.
Sustainability 15 05655 g015
Figure 16. Slope without cracks.
Sustainability 15 05655 g016
Figure 17. Development of a slope with a single crack.
Sustainability 15 05655 g017
Figure 18. Development of a slope with two cracks.
Sustainability 15 05655 g018
Figure 19. Development of a slope with three cracks.
Sustainability 15 05655 g019
Figure 20. Sliding soil layer.
Sustainability 15 05655 g020
Table 1. Basic physical parameters of test soil.
Sampling DepthWater ContentSpecific Gravity of Soil ParticlesWet DensityDry DensitySaturation DegreeVoid
Ratio
Free Swelling
Ratio
mW/%Gs ρ 0 /(g/cm3) ρ d /(g/cm3)Sre%
0.525.32.771.731.3869.61.00651
Table 2. Material parameters.
Particle Density (kg/m3)Minimum Particle Size (mm)Maximum Particle Size (mm)Stiffness RatioTangential Cohesive Force (KN)Normal Cohesive Force (kN)Elastic ModulusCoefficient of Friction
2000 22.71221 × 1080.7
Table 3. Slope crack parameter settings for numerical simulation.
Depth of Crack 1 (cm)Depth of Crack 2 (cm)Depth of Crack 3 (cm)Depth of Crack 4 (cm)Depth of Crack 5 (cm)Depth of Crack 6 (cm)
Side slope 16.97007.900
Side slope 26.975.9307.97.050
Side slope 36.975.933.937.97.055.3
Table 4. Slope displacement state.
Number of CracksOne Crack
Layers of SoilFirst LayerSecond LayerThird Layer
Time (s)123451234512345
Displacement (m)0.20.250.30.350.4500.20.250.30.35000.150.20.25
(a)
Number of CracksTwo Cracks
Layers of SoilFirst LayerSecond LayerThird Layer
Time (s)123451234512345
Displacement (m)0.20.250.30.350.4700.20.250.30.35000.150.20.25
(b)
Number of CracksThree Cracks
Layers of SoilFirst LayerSecond LayerThird Layer
Time (s)123451234512345
Displacement (m)0.20.350.60.650.70.150.30.40.450.500.20.30.350.4
(c)
Disclaimer/Publisher’s Note: The statements, opinions and data contained in all publications are solely those of the individual author(s) and contributor(s) and not of MDPI and/or the editor(s). MDPI and/or the editor(s) disclaim responsibility for any injury to people or property resulting from any ideas, methods, instructions or products referred to in the content.

