Abstract
This paper empirically tests the impact mechanism of digital economy development on manufacturing total factor productivity, using data from Chinese manufacturing enterprises from 2011 to 2020, and based on the theoretical framework of the impact of digital economy development on manufacturing total factor productivity. The development of the digital economy has been found to have a significant positive impact on the total factor productivity of the manufacturing industry. The heterogeneity effect demonstrates that the digital economy in coastal areas has a significant effect on the improvement of manufacturing total factor productivity, with the eastern coastal area having the strongest effect; the digital economy in the Yellow River’s middle reaches, the Yangtze River’s middle reaches, and the southwest also having a significant effect, with the effect in the southwest region being more significant; and the digital economy in the northwest and northeast having no effect. Possible reasons include larger bottlenecks in the western region’s labor force structure, technology level, and management capabilities, which may lead to the inability of enterprises to effectively absorb the dividends of digital change and apply the scenarios, thus affecting the release of their productivity effects.
1. Introduction
In recent years, sustainability trends and digitalization phenomena have been changing the economy and society at the global level [1]. Along with the new wave of technological revolution and industrial change sweeping the world, many countries have proposed digital economy development strategies such as “Industrial Internet” and “Industrialization 4.0”, with the goal of achieving economic and social transformation, as well as upgrading and seizing commanding heights of international competition by promoting the digital transformation of the manufacturing industry [2]. At present, the digital economy has become a new driving force for global economic development, and all countries plan to rely on digital technology to realize a new round of industrial transformation and achieve high-quality development of the manufacturing industry [3]. The upgrade of the manufacturing technology level is critical to realizing the leap to the new development mode, and the improvement of the manufacturing TFP (total factor productivity, TFP) is an important reflection of manufacturing technology level improvement [4].
The positive effects of digital economic development on the manufacturing industry are reflected in many aspects, especially in optimizing TFP and unleashing economic vitality. Li L (2018) compared “Made in China 2025” with Germany’s “Industry 4.0” to evaluate China’s development trajectory, and pointed out that China is not a strong player in the high-tech field. Mature industrialized countries such as the United States, Germany, and Japan, have deployed digital technologies comprehensively, effectively promoting innovation in the industrial environment [5]. In addition, the popularization of the Internet can significantly improve the industry’s TFP, and to some extent strengthen the promoting effect of ICT on the industry’s TFP [6,7]. However, there is a time lag of 5–10 years for the promoting effect of information technology on TFP, and the effect is most obvious when the time lag reaches 7 years [8,9]. Micro-level research has shown that data-driven approaches are more effective in promoting enterprise productivity and can effectively reduce costs and increase efficiency [10]. Companies that make full use of computers and the Internet can reduce information asymmetry, lower decision-making costs, and increase production efficiency [11,12]. Acemoglu and Restrepo and Deming and Kahn believe that the digital economy has reshaped the employment structure within the manufacturing industry and comprehensively optimized the level of informatization and automation in the industry, such that simple repetitive work tasks have been replaced by machines and computers, while complex and more technically demanding work tasks have been created [13,14,15].
China’s economy has shifted from a high-speed growth stage to a high-quality development stage, and TFP must be improved as the focus to promote high-quality economic development. Developing the digital economy, accelerating breakthroughs and innovation in new-generation information technology, and promoting deep integration of the digital economy and the manufacturing industry, are critical for China to realize the digital transformation of the manufacturing industry and improve TFP [16]. So, will the digital economy boost manufacturing TFP? What is the underlying mechanism of action? Is there any heterogeneity in the impact of the digital economy on manufacturing TFP in China, given the differences between geographical regions and city levels? What kind of policy framework is required to provide institutional assurance for TFP improvement in the manufacturing industry? The focus of this paper is on these questions. Based on this, this paper calculates the digital economy development index and manufacturing TFP, using panel data from 30 Chinese provinces from 2011 to 2020 and listed manufacturing companies, with the goals of investigating the impact of the digital economy on manufacturing TFP, determining whether this effect varies by region, and proposing digital economy development strategies. The analysis of the correlation mechanism between digital economy development and TFP in the manufacturing industry in existing studies lacks theoretical models to regulate the interpretation.
The main marginal contributions of this article are as follows: Firstly, while there is extensive research on the high-quality development of the manufacturing industry, few studies examine the combination of the development of the digital economy and manufacturing TFP at the micro level. This article fills that gap by studying the impact mechanism of the digital economy on manufacturing TFP from the perspective of digital economic development. A comprehensive analysis of the impact of the development of the digital economy on manufacturing enterprises’ TFP has significant practical significance. Secondly, existing literature on the digital economy mainly relies on qualitative analysis in written form. Even the few studies on the relationship between the digital economy and manufacturing enterprises’ TFP, only discuss the theoretical mechanism of how digitization affects the manufacturing enterprises’ TFP, and such studies lack empirical evidence. This article constructs a comprehensive evaluation system to systematically depict the level of digital economic development by region and empirically analyzes the impact of digital economic development on manufacturing enterprises’ TFP.
2. Theoretical Analysis and Literature Review
2.1. Theoretical Analysis
Digital transformation is increasingly crucial to the upgrading and sustainable development of China’s manufacturing industry, with the rapid development of the digital economy [17]. The emergence of the digital economy has created sufficient and necessary conditions for data to become the fourth new factor after land, capital, and labor. Data (information) collection, aggregation, and analysis have long been an important part of business production and operation, but they have not been recognized as factors by the economics community. With the advent of economic digitalization, the situation has changed dramatically. The digital economy originated with the emergence and accessibility of large amounts of machine-readable information in economic activities, and it evolved along the following lines: (1) Information digitization, i.e., the transformation of mechanical and analog electronic technologies into digital technologies that allow various forms of information to be transformed into processable digital information. (2) The rapid development of computing, communication, and information processing technologies, as well as the spread and development of the Internet and mobile networks, while promoting the development of digital technologies such as the Internet of Things, artificial intelligence, blockchain, and 3D printing, provides ample scenarios for their application. (3) The trend of digitalization of economic activities and the emergence of new data-driven business models have profoundly changed enterprise production organization, operation, and profitability models, as well as consumer communication and consumption patterns, and a country’s economy has gradually demonstrated the characteristics of a digital economy. Data, as a key factor of production in the digital economy, needs to be deeply integrated with other traditional factors of production in order to be useful. Compared with the natural forms of land, capital, and labor, the complexities of data connotation and extension are concentrated in several unique properties of data elements. First, data are inherently non-competitive and can be used multiple times concurrently without losing value. Second, data flow has the potential to generate value, but its value cannot be predicted when the original data is generated. Finally, the value created by data flow is affected by the analytical techniques used to analyze the data. The continuous expansion of data flow scale and the improvement of digital technology capability, frequently produce economies of scale, and the value creation of data elements is directly dependent on the application of digital technology for data.
The deep integration of the digital economy with the manufacturing industry has profoundly changed manufacturing production methods, increased the speed of information and technology production and dissemination, facilitated the generation of new models and business models, and facilitated the realization of effective empowerment of manufacturing TFP [18]. Labor and capital are the two most important traditional factors of production in manufacturing [19,20]. The combination of these two factors can have a multiplier effect on traditional production factors, which is most visible in the promotion of workers’ human capital. From the standpoint of manufacturing workers, workers can apply modern information technology to their own work and development needs, search on the network platform and obtain massive learning resources at a low cost, strengthen theoretical learning, and carry out vocational skills training based on their own needs. Having workers continuously improve their professional skills and overall quality, expands the team of high-quality skilled personnel. Industry 4.0 integrates employees and digitally controlled machines, with the Internet and information technologies. The materials used in production can always be identified; they also have the ability to constantly communicate with each other [21]. From the overall perspective of labor input, high-quality labor factor input brings a significant increase in labor productivity, and at the same time, the technological innovation potential is constantly improved, which enables the development quality of the manufacturing industry. Industry 4.0 solutions allow for communication between humans and machines, creating many opportunities to reduce production costs. Industry 4.0 integrates employees and digitally controlled machines with the Internet and information technologies [22].
The digital economy’s multiplier effect on the capital factor input of the manufacturing industry is primarily reflected in increased R&D investment by enterprises, and the replacement of traditional machinery and equipment with advanced machinery and equipment [23]. On the one hand, the digital economy has the potential to significantly improve workers’ human capital levels and the quality of labor input in the manufacturing industry. At the same time, the increased labor input must be matched by increased physical capital to better promote the development of the manufacturing industry. As a result of the rapid development of the digital economy and the quality of laborers, manufacturing enterprises will invest more capital in technological research and development, which will not only meet the manufacturing highly skilled labor demand for capital but will also optimize the structure of capital usage, improve capital productivity, promote manufacturing enterprise technological progress, and promote the development of the manufacturing industry. In the digital economy, however, companies’ additional capital investments are no longer simply used to purchase traditional industrial equipment, but also to purchase industrial robots to replace traditional equipment, effectively improving economic efficiency. The use of industrial robots optimizes the capital and labor factor allocation structure in manufacturing production, improves the capital-labor ratio, and effectively promotes labor productivity improvement. Furthermore, the widespread use of industrial robots has increased the demand for highly skilled labor in manufacturing enterprises, forcing workers to improve their quality and work skills to meet the manufacturing development needs of the digital economy era. Since China’s economy transitioned from high-speed growth to high-quality development, the digital economy has emerged as the primary driver of economic growth and technological progress. In recent years, Chinese manufacturing enterprises have continued to accelerate the promotion of industrial digital transformation, actively applying big data, blockchain, and other information technology to enterprise development, gradually transforming the digital economy into an important way to promote enterprises to achieve high-quality development. As a result, it is critical to investigate how the digital economy affects enterprise TFP.
According to Chenery’s industrialization stage theory [24], the manufacturing structure will shift from capital-intensive to technology-intensive in the post-industrialization period, and technological progress will become the primary driving force for upgrading the manufacturing structure. With the gradual maturation of the new generation of information technology and its shift to the supply-side application center, the manufacturing industry has emerged as the primary battlefield for the digital economy to play the role of innovation driving, transformation, and upgrading. By enabling the technological upgrade of manufacturing structures, digital technology can improve the efficiency of resource allocation and productivity. The new generation of information technology provides a tool for product information collection and knowledge exchange, as well as integration for product development and design activities, assisting enterprises in developing an open innovation paradigm to improve technological innovation capabilities and TFP through the “innovation incentive effect”. Enterprises can also more accurately grasp customers’ diverse and personalized needs in specific scenarios, providing strong momentum for the manufacturing industry’s total factor improvement through accurate supply and demand matching and real-time response to customer demand (seen in Figure 1).
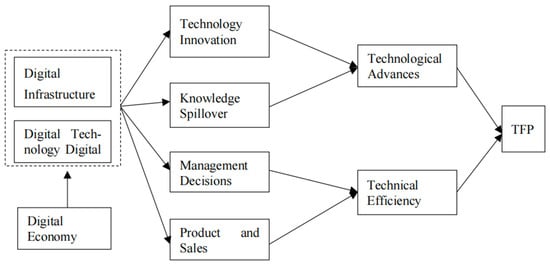
Figure 1.
Influence mechanism of the digital economy on manufacturing industry TFP.
2.2. Literature Review
The digital economy is an expansion and extension of the concept of the information economy [25]. There are narrow and broad connotations of the digital economy, with the narrow meaning referring to digital industrialization or the transformation of the basic technology of the digital economy into a new industrial ecological chain. The digital economy in the broad sense refers to the digitization of industry, that is, the integration of digital technology into traditional industries, thus helping traditional industries to improve quality and increase efficiency, including the construction of new models and new business modes such as industrial Internet and smart manufacturing [26]. With the rapid development of the digital economy, scholars have continuously expanded the scope of research, i.e., from digital industrialization research to industrial digitalization research. Regarding the digital economy measurement method, there are no unified accounting rules yet. Academics are actively investigating and attempting to identify reasonable indicators to measure the digital economy using various methods. Zhang et al. (2016) developed a digital economy development evaluation index system, based on five dimensions: information and communication infrastructure, ICT primary applications, ICT advanced applications, enterprise digital development information, and communication technology industry [27]. Wan (2022) developed a digital economy evaluation index system with 70 measurement indicators spanning three dimensions: digital input, digital governance environment, and digital output from the economic standpoint of investment output [28]. Zhang (2019) assessed the digital economy’s overall development level in terms of both Internet development and digital financial inclusion. To characterize the level of Internet development, indicators in four areas are used: Internet penetration, related practitioners, related output, and cell phone penetration. The China Digital Financial Inclusion Index, which is jointly compiled by Peking University’s Digital Finance Research Center and Ant Financial Services Group, is used to track digital financial development [29]. Jiao (2021) created a comprehensive evaluation index of inter-provincial digital economy development based on four factors–digital foundation, digital application, digital innovation, and digital transformation–and measured China’s digital economy’s development level from 2013 to 2019 [30].
TFP was first proposed by the Dutch economist Tinbergen in 1942, who pioneered the introduction of a time variable in the Cobb-Douglas production function and then studied the fluctuation characteristics and relationship between input factors and productivity, but he only considered the effects of labor and capital on productivity and ignored the effects of other intrinsic factors [31]. On this basis, Hiam Davis, an American economist, modified and improved TFP, by including an analysis of all input factors such as labor, capital, and production materials [32]. In 1956, Robert Solow used the role of technological progress to explain the problem of sustained economic growth in “A Contribution to the Theory of Economic Growth”, and he further decomposed output growth into the sum of capital, labor, and technological progress in “Technical Change and the Aggregate Production Function”, in which he proposed subtracting the weighted average of the growth rate of labor and the growth rate of technological progress, from the residual value of the growth rate of output [33]. A global research boom on TFP was subsequently triggered, and Solow and other economists used it to measure technological progress in a broad sense and to analyze the sources of dynamics of economic output growth [34], and TFP became an important indicator for countries to measure the quality of their own economic development [35]. The social changes include, firstly, consumer activity in the energy market, which is possible thanks to technological changes, and secondly, moving towards reducing the negative impact on the environment. Both trends of these changes interpenetrate and allow for the emergence of energy-friendly technological change for humans and the environment. Technological innovations such as remote meters, devices for remote control and monitoring, and digital twins, when used in the energy sector, allow for increasing the efficiency of the sector, and for its faster development towards zero emissions.
TFP is not only an important concept for evaluating economic development performance and investigating the process of economic growth, but it is also the key to promoting the realization of high-quality social development. Traditional measurement methods mainly fall into two categories: the Solow residual method and the potential output method [36]. The Cobb-Douglas production function, jointly proposed by American mathematician Cobb and economist Douglas in 1928, is the main production function used for measurement using Solow residuals, in addition to: the CES production function jointly proposed by Arrow Chenery, Mihas, and Solow in 1961; the Sato multifactor secondary CES function production function proposed by Sato in 1967; the VES production function proposed by Revankar in 1971; and beyond logarithmic production proposed by L. Christensen, D. Jorgenson, and Lau in 1973. In the potential output method, by estimating the frontier production function, the change of distance between the actual input-output portfolio and the frontier production function is calculated to measure the change of TFP. The frontier production function can be estimated using one of two methods: a parametric method such as stochastic frontier analysis (SFA), or a non-parametric method such as data envelopment analysis (DEA).
Chinese scholars have conducted extensive research on the measurement and decomposition of TFP in the manufacturing industry, primarily using the non-parametric method represented by the OP method to measure manufacturing TFP. Based on the research findings, they have proposed numerous policy recommendations to improve the TFP level of the manufacturing industry, which has accelerated the process of the manufacturing industry’s high-quality development in China. Using data from Chinese industrial enterprises from 1999 to 2007, Lu and Lian calculated the TFP of major Chinese industrial enterprises using the least squares method, fixed effects method, and OP method. A cross-sectional comparison revealed that the OP method outperformed traditional measurement methods in terms of endogeneity and sample selection [37]. According to Li et al., China’s eastern region has the highest manufacturing TFP, the western region has the greatest increase in manufacturing TFP, which is accelerating to catch up with the central and eastern regions, and manufacturing TFP shows a convergent development trend [38]. According to the findings of Li et al., there are significant spatial differences in Chinese manufacturing TFP from 2002 to 2016 [39]. The central and western regions’ economic development is relatively slow in comparison to the eastern region. The two regions promote a significant increase in manufacturing TFP by improving scale efficiency and technological progress, whereas the TFP of the eastern region shows a downward trend due to a decrease in the rate of technological progress.
The impact of the digital economy on manufacturing firms has long been a popular academic research topic. Since 1987, when the eminent economist Solow proposed the information technology productivity paradox that “computers have no effect on productivity”, many scholars have conducted extensive research on the subject, but have yet to reach a consistent conclusion [40]. Based on cross-country panel data, some scholars have discovered possible differences in productivity effects across countries in IT and have attempted to explain the causes of the productivity paradox in terms of bias in IT measurement and potential productivity time lags [41]. The majority of domestic literature affirms the positive impact of information technology or the Internet on regional economic growth and high-quality development in China and seeks to break the productivity paradox through management change, technological innovation, and human capital upgrading [42]. In contrast, there is a lack of direct evidence on whether the digital economy, the developmental form of the new generation of information technology, affects TFP and its underlying mechanisms. It has also been noted that large bottlenecks in Chinese enterprises’ workforce structure, technology level, and management capabilities, may result in their inability to effectively absorb the dividends of digital change and apply the scenarios, affecting the release of their productivity effects. Existing literature primarily conducts theoretical research on the digital economy or develops empirical analysis from a macroeconomic perspective [43]. Some scholars have gradually attempted to investigate the impact of digital transformation from the micro perspective [44,45], but the mechanism of impact on micro-enterprises remains unknown [46]. It has been discovered that the application degree gap of information technology can effectively promote the transformation and upgrading of the manufacturing industry in the process of improving the TFP of technology, capital-intensive, and labor-intensive manufacturing enterprises. Jiao proposed that the digital economy’s impact on the manufacturing industry gradually shifts from value reshaping to value creation, manifesting as factor-driven to innovation-driven, product-oriented to user-experience-oriented, industry-related development to enterprise community development, and competition and cooperation mode to mutualism mode [47]. On this basis, He investigated the impact of the digital economy on China’s manufacturing industry from the standpoint of the global value chain and discovered that digital input was significantly positively correlated with the degree of global medium-high knowledge-intensive manufacturing industry, with the sectors with higher research and development (R&D) intensity, benefiting the most [48]. From the perspective of the industrial chain, the deep integration of the digital economy and the real economy will constitute a new driving force for the transformation and upgrading of the manufacturing industry. In terms of statistical measurement methods for the digital economy, domestic research on the digital economy began late, and no official accounting system for the digital economy has yet been provided.
In conclusion, more research on the impact of the digital economy on manufacturing TFP is needed. First, the existing literature is more theoretical, with few empirical studies focusing on the macro level, and digital indicators used in cities or regions cannot accurately reflect the level of digitalization of micro-enterprises. Existing literature has provided numerous insights into the impact of the digital economy on manufacturing TFP, based on various perspectives and research data. However, the existing literature on the productivity effects of the digital economy, particularly at the micro-empirical level, requires expansion. As a result, this paper examines the impact of the digital economy on the TFP of listed Chinese manufacturing companies, as well as its internal mechanism at the micro-enterprise level.
3. Characteristic Facts and Data Analysis
The fact is, that the digital transformation phenomenon is still developing and emerging [49]. The digital economy is a new economic form that accepts digital knowledge and information as key factors of production, digital technology as the driving force, and modern information networks as important carriers to continuously improve the level of digitalization, networking, and intelligence of the economy and society, as well as accelerate the reconstruction of economic development and governance (China Academy of Information and Communications Technology, 2019). The digital economy has become the field with the most active innovation, the fastest growth rate, and the greatest impact on China’s economic development. Between 2012 and 2021, the scale of China’s digital economy (according to the definition, “digital economy” includes data value, digital industrialization, industry digitization, and digital governance. In view of the availability of data and the limitations of accounting methods, the scale accounting of the digital economy only includes digital industrialization and industry digitization. “Digital industrialization” can be defined as the added value of the information industry, mainly including the electronic information manufacturing industry, the information and communication industry, the Internet industry, and the software service industry. “Industry digitization” is defined as the output increases and efficiency gains from the use of the digital economy and digital products in other non-digital industrial sectors of the national economy.) increased from 11 trillion yuan to more than 45 trillion yuan, with the proportion of GDP increasing from 21.6% to 39.8%. In the national economy, the digital economy has played a more stable role. A new round of scientific and technological revolution and industrial transformation is currently underway, and digital technology is advancing at a breakneck pace. China’s digital infrastructure spans many domains, with the country leading the world in advanced digital technologies such as 5G, cloud computing, big data, and artificial intelligence. The operating revenue of the electronic information manufacturing industry above the designated size increased from 8.5 trillion yuan to 14.1 trillion yuan between 2012 and 2021 (seen in Figure 2). The above-scale electronic information manufacturing value added increased from 12.1% to 15.7%, the fastest growth rate in nearly ten years.
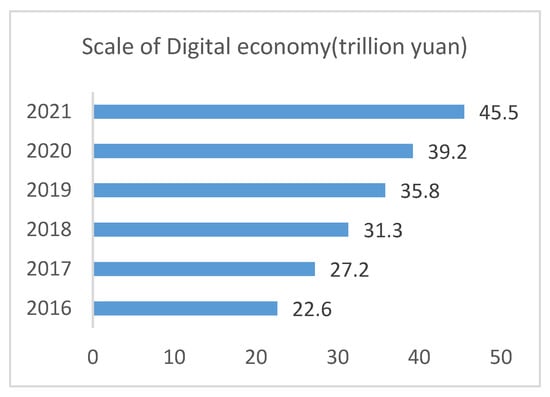
Figure 2.
Scale of China’s digital economy.
According to World Bank and National Bureau of Statistics data (Data source: World Bank and National Bureau of Statistics data), the manufacturing industry in China had a value-added of US $1924.32 billion in 2010, accounting for 18.3% of the total value-added of the manufacturing industry worldwide, making China the country with the largest manufacturing scale in the world. It was 25.6 trillion yuan in 2018, accounting for 28.3% of the global total, close to the combined manufacturing value added of the United States, Germany, and Japan, and it has been the world’s largest manufacturer for nine consecutive years (seen in Figure 3, Figure 4 and Figure 5). As shown in Figure 3, the digital economy accounted for 39.8 percent of GDP in 2021, up from 21.6 percent in 2012. According to the United Nations, China had output in 31 major industries, 179 medium industries, and 609 small industries in the manufacturing sector in 2019, with more than 200 industrial industries consistently ranking first in the world. Although the Chinese manufacturing industry’s share of GDP has slightly decreased and slowed in recent years, it still maintains a growth rate of more than 6%, and a share of around 30% in the national economic system.
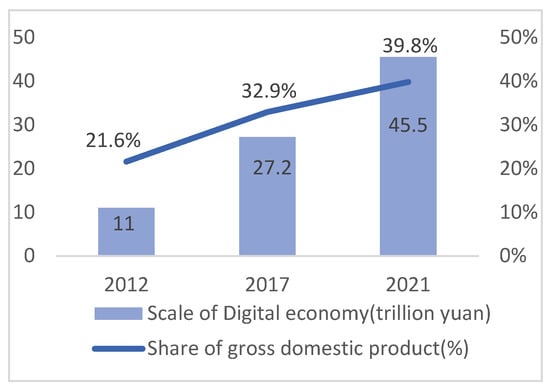
Figure 3.
Scale and proportion of the digital economy in GDP.
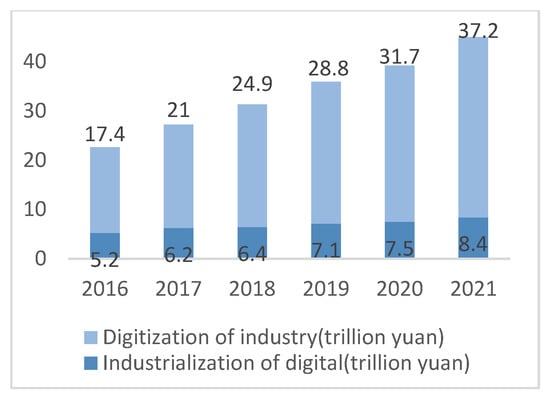
Figure 4.
Internal structure of China’s digital economy.
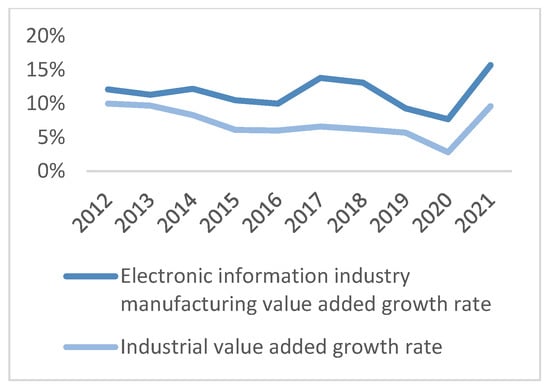
Figure 5.
Electronic information manufacturing and industrial value-added growth rate. Data source: China Academy of Information and Communications Technology.
4. Methodology
4.1. Methodology
- Entropy weight evaluation method. The number of indicators included in the measurement of the digital economy index is large, so the entropy weighting method is selected to determine the weight of each indicator. The entropy method is an objective weighting method, which has the advantage of avoiding subjectivity in weighting, and it is consistent with the mathematical laws, and has a strict mathematical meaning.
Each index is weighed using the entropy weight method in this paper. The weighted sum method is used to calculate the level of development of the digital economy based on the weight of the index.
(1) Establish the index matrix
Assuming that the system includes n objects and m evaluation indicators, an n × m matrix of indicators can be constructed:
where refers to the j-th evaluation index of the i-th evaluation object.
(2) Data Standardization
The indexes need to be normalized to eliminate the influence of dimensions on the results. Suppose the evaluation index of a city is and its standardized value is , then the positive index is:
and the inverse index is:
where, refers to the normalized value of the j-th evaluation index of the i-th evaluation object, refers to the maximum value of the j-th evaluation index of all evaluation objects, and refers to the minimum value of the j-th evaluation index of all evaluation objects.
Thus, the normalized index matrix can be constructed as follows:
(3) Entropy method to determine the weight of indicators
The proportion of the evaluation index of the i-th evaluation object in item j is calculated as:
The entropy value of the j-th evaluation index is calculated as follows:
The weight of the j-th evaluation indicator is calculated as:
(4) Score calculation
The equation calculates a score between 0 and 1. If the value of an indicator is exactly equal to the maximum or minimum value, its normalized value is 1 or 0.
- 2.
- Panel model construction. To verify the impact of the digital economy on promoting TFP in manufacturing, the following model is constructed:
- 3.
- Regional difference analysis. The Gini coefficient is used to quantitatively measure the difference of income distribution. Dagum (1997) proposed the decomposition method of the Gini coefficient, which decomposed the overall Gini coefficient into intra-regional difference , inter-regional difference , and super-variable density contribution , which could reveal the regional difference and the source of the difference in the development of the digital economy [50]. The calculation process is as follows:
(1) Overall Gini coefficient:
(2) Regional difference contribution
(3) Contribution of net value difference between regions
where, represents the relative influence of digital economy development between subgroups and . is defined as the difference in digital economy development level between regions, which can be understood as the mathematical expectation of the sum of sample values of all in subgroups and . is defined as the super variable first moment, which can be understood as the mathematical expectation of summing up the sample values of all in subgroups and . is the cumulative density distribution function of the subgroups and .
4.2. Variable Description
- Explained variable: manufacturing TFP. The research samples for this paper are manufacturing enterprises listed on Shanghai and Shenzhen A-shares from 2011 to 2020. In accordance with existing literature, we process the original data at the enterprise level as follows:
(1) excluding the listed status of *ST, ST, delisting period, suspension of listing, and termination of listing enterprises; (2) excluding enterprises that were listed during the sample selection period; (3) excluding missing major financial data observations, resulting in a sample of 12,092. Furthermore, a 1% tail reduction was applied to each end of the data in order to avoid outlier interference, and the data were obtained from the Wind and CSMAR databases.
The Cobb-Douglas production function is used to estimate the TFP of the whole manufacturing industry by using the data of A-share listed companies.
where represents output, and and represent capital and labor input, respectively. is TFP. By taking the logarithm of Equation (16), it can be transformed into the following linear form:
where, , , , and represent the logarithm form of , , and , respectively. is a random interference term, which satisfies the white noise assumption. Usually, Equation (17) can be estimated to obtain the estimated value of TFP. With the semi-parametric method proposed by Olley and Pakes, the OP method has become the main method to estimate TFP when technological progress is endogenous [51]. Therefore, this paper uses the OP method to calculate the capital-output elasticity , the labor-output elasticity , and TFP .
- 2.
- Core explanatory variables: digital economy (DIGI)
This paper builds on the idea of Liu et al. (2021)’s construction of an indicator system that takes Internet development as the core of measurement and adds digital transactions, as well as Zhao’s (2020) construction method for digital economy indicators and combines relevant data, to measure the comprehensive development level of the digital economy in terms of both Internet development and digital financial inclusion [52]. For Internet development measurement, four indicators are used, namely, Internet penetration rate, related practitioners’ situation, related output situation, and cell phone penetration rate, drawing on the method of Huang et al [53]. The actual contents corresponding to the above 4 indicators are the number of Internet broadband access users per 100 people; the proportion of employees in the computer service and software industry to the number of employees in urban units; the total amount of telecom services per capita; and the number of mobile phone users per 100 people. The original data of the above indicators can be obtained from the China Statistical Yearbook. For digital finance development, the China Digital Inclusive Finance Index is used, which is jointly compiled by the Digital Finance Research Center of Peking University and Ant Financial Services Group [54]. Table 1 shows the main variables.

Table 1.
Evaluation index system.
- 3.
- Control variables: technology research and development (R&D), as measured by R&D expenditures of large industrial enterprises [55]; economic development level (GDP), wherein the level of economic development in a region is expressed as GDP, and foreign direct investment (FDI) is expressed as the total value of foreign capital used in the current fiscal year; level of education (education), as measured by the average number of college students per 100,000 population; and government intervention (finance), as manifested in general budget expenditure.
5. Empirical Results and Analysis
The level of development of China’s digital economy essentially follows a distribution trend of high in the east and low in the west. Figure 6 depicts the digital economy development index ranking of 30 Chinese provinces in 2020, with Beijing having the highest score and Heilongjiang having the lowest [56].
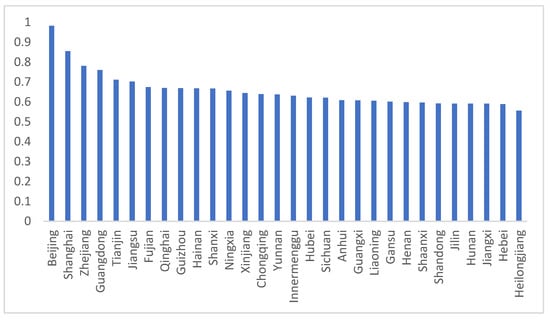
Figure 6.
China’s digital economy index ranking in 2020.
5.1. Sub-Regional Measurement Results
Table 2 displays the output efficiency measurement results for the digital economy in eight economic zones from 2011 to 2020. At the temporal level, there are varying degrees of fluctuation in the efficiency of digital economy output in all regions. The eastern coastal and northwestern regions change the most, while the other economic regions change the least.
Table 2.
Digital Economy Measurement Results.
5.2. Regional Difference Analysis
(1) Overall differences. Table 3 depicts the sources and contributions of overall differences in digital economy output efficiency from 2010 to 2021. The annual average Gini coefficient is 0.101, and the disparity in digital economic development across the eight economic regions is narrowing. The inter-regional difference, hyper density, and intra-regional difference, have the highest contribution rates to the overall Gini coefficient, indicating that the inter-regional difference is the main source of the overall difference.
Table 3.
Sources and Contributions of Overall Differences in Digital Economy from 2011 to 2020.
(2) Intra-regional differences. From 2011 to 2020, Figure 7 depicts the intra-regional Gini coefficients of digital economy output efficiency in the eight economic regions. The hypervariable density contribution, inter-regional variation contribution rate, and intra-regional variation contribution rate are shown in the figure. The average Gini coefficient ranges from small to large in the Yangtze River’s middle reaches, the great Northwest, the great Southwest, the northeast, the Yellow River’s middle reaches, the eastern coast, the southern coast, and the northern coast. It demonstrates that the difference in digital economy between provinces in the Yangtze River’s middle reaches is the smallest, while the difference between provinces in the northern coastal region is the greatest.
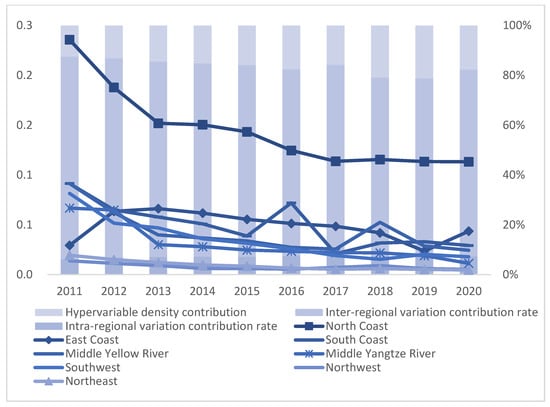
Figure 7.
Gini Coefficient and the contribution rate of the digital economy in eight regions from 2011 to 2020.
(3) Regional differences. Table 4 displays the annual average value of the Gini coefficient among the digital economy regions of the eight major economic zones from 2011 to 2020, reflecting regional differences in digital economy output efficiency. On the eastern coast, the middle reach of the Yellow River has the highest inter-regional Gini coefficient, at 0.1576, while the middle reaches of the Yangtze River southwest have the lowest, at 0.0378. The difference in the digital economy index between the southwest and northwest regions is small overall, but the Gini coefficient between the coastal regions and the southwest and northwest regions, is larger.
Table 4.
Annual Average Gini Coefficient of digital economy in eight economic regions from 2010 to 2021.
(2) Manufacturing TFP
According to the constructed model and combined with the micro panel data at the level of manufacturing enterprises, this paper uses the OP method to measure Chinese manufacturing TFP [57]. As shown in Table 5 and Figure 8.
Table 5.
Manufacturing TFP in the Eight Regions.
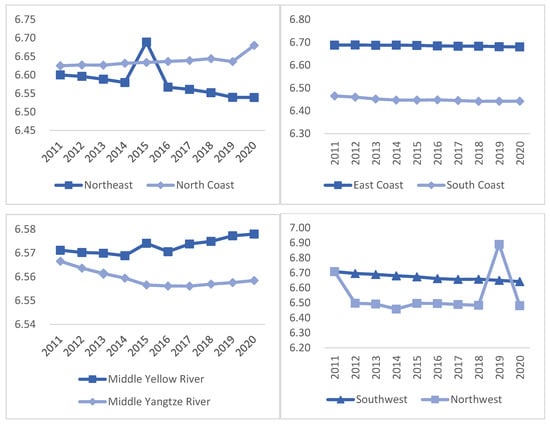
Figure 8.
Manufacturing TFP in eight economic zones from 2011 to 2020.
(3) Baseline regression analysis
Table 6 reports the baseline regression results of this paper. First, as shown in columns (1) and (2), OLS and fixed effects regression are applied to Equation (6) (2). Column (1) displays the regression results using only the core explanatory variables. The digital economy index has been found to significantly positively impact the manufacturing enterprises’ TFP. Column (2) displays the regression results after controlling variables are included. At the 1% level of confidence, it is discovered that the development of the digital economy significantly improves the manufacturing enterprises’ TFP. At the 1% level of significance, the results show a significant and stable positive relationship between the digital economy and manufacturing TFP. Manufacturing TFP will rise as the digital economy develops. In terms of control variables, GDP, Finance, FDI, R&D, and manufacturing TFP, all have a significant positive relationship. The regression results in column (2) show that, after controlling for variables such as GDP, degree of financial development, and FDI, the regression coefficient of the digital economy is 0.0841, which passes the 10% significance level test, that is, for an increase of one unit in the level of development of the digital economy, the level of manufacturing TFP increases by 0.0841.
Table 6.
Baseline regression of digital economy impact on manufacturing TFP.
(4) Robustness test and endogeneity test
Based on the benchmark regression, this paper repeated the above hypothesis testing steps by adding control variables, eliminating the sample of enterprises directly under the central government, adjusting the sample period, and performing subsample regression, to verify the robustness of the regression results. Table 7 displays the regression results. The results of the robustness test show that the sign and significance level of key variables have not changed significantly, indicating that the core conclusion is robust, namely, that the development of the digital economy can significantly improve manufacturing TFP.
Table 7.
Robustness and endogeneity tests.
When performing baseline regressions, there may be endogeneity problems due to omitted variables or mutual causation among variables. To solve the possible endogeneity problem, regression analyses were conducted using the explanatory variables in period t, with the explanatory variables in periods t + 1, t + 2, and t + 3, respectively, and the regression results are presented in columns (1), (2), and (3) of Table 8. The digital economy index is generally consistent with column (2) of Table 6, indicating that the research conclusions of this paper are robust when endogeneity is considered.
Table 8.
Endogeneity test.
(5) Further expansion: Regional heterogeneity analysis
Indeed, due to varying resource endowments and stages of development, there is significant heterogeneity in the regional distribution of both the digital economy and manufacturing TFP. As a result, there may be regional heterogeneity in the impact of digital economy development on manufacturing TFP, which must be thoroughly discussed. The regression analysis of regional heterogeneity is shown in Table 9. The results of models (1), (2), and (3), show that the digital economy has a significant effect on manufacturing TFP in coastal regions, with the greatest effect in the eastern coastal regions. The coastal regions may have a higher level of digital economy development than the central and western regions and inland cities, making the release of the digital economy dividend more appropriate. The results of models (4), (5), and (6), show that the development of the digital economy in the Yellow River’s middle reaches, the Yangtze River’s middle reaches, and the southwest region, also plays a significant role in the improvement of manufacturing TFP, with the southwest region being more significant than the Yellow River’s middle reaches and the Yangtze River’s middle reaches. The results of models (7) and (8) show that the development of the digital economy in the northwest and northeast regions has little impact on manufacturing TFP. The possible reason is that larger bottlenecks in the western region’s labor force structure, technology level, and management capacity, may lead to enterprises’ inability to effectively absorb the dividends of digital change and apply the scenarios, affecting the release of their productivity effects.
Table 9.
Regional heterogeneity analysis.
6. Conclusions and Suggestions
This paper uses data from manufacturing enterprises listed in Shanghai and Shenzhen A-shares from 2011 to 2020, to investigate the impact of digital economy development on manufacturing TFP in each province by establishing a digital economy development evaluation system. The digital economy has a significant impact on manufacturing TFP improvement, and this conclusion holds true even after changing the calculation method, changing the model, and employing the instrumental variables method for robustness testing. It has been discovered that the digital economy in coastal areas has a significant impact on manufacturing TFP improvement, with the eastern coastal areas having the greatest impact. The coastal areas of China may have reached a higher level of digital economy development earlier than the central and western areas and inland cities, allowing the digital economy dividend to be more fully realized. The digital economy in the Yellow River’s middle reaches, the Yangtze River’s middle reaches, and the southwest region, all play important roles in improving manufacturing TFP, with the southwest region being more important than the Yellow River’s and Yangtze River’s middle reaches. The digital economy has no significant impact on manufacturing TFP improvement in the northwest and northeast regions. The possible reason is that larger bottlenecks in the western region’s labor force structure, technology level, and management capabilities, may lead to enterprises’ inability to effectively absorb the dividends of digital change and apply the scenarios, affecting the release of their productivity effects.
Based on the research findings presented above, the following recommendations are made:
- (1)
- Accelerate the development of digital infrastructure to support the development of a strong manufacturing country and a strong digital China network, to consolidate the foundation for development [58]. The western region and the northeast should accelerate the construction of digital infrastructure such as 5G, in order to generate new momentum for development.
- (2)
- It is necessary to seize the opportunity of the digital economy’s rapid development, promote the deep integration of the digital economy and the real economy through data circulation, promote the infiltration, integration, and optimization of data elements and traditional manufacturing production factors, and then improve TFP.
- (3)
- Strengthen the supporting role of digital technology in key generic technologies and cutting-edge leading technologies, accelerate the circulation and transmission of innovation factors in the manufacturing industry, and unleash the superposition and multiplier effect of technological innovation on the development of the manufacturing industry.
Author Contributions
Ideas, Preparation, and creation of the published work, specifically writing the initial draft (including substantive translation), J.C.; Preparation, and creation of the published work by those from the original research group, specifically critical review, commentary, or revision, Q.L.; Conducting a research and investigation process, specifically performing the experiments and data collection, W.T.; Oversight and leadership responsibility for the research activity planning and execution, H.C.; Application of statistical, and mathematical; Acquisition of the financial support for the project leading to this publication, J.L.; Development or design of methodology, Y.D. All authors have read and agreed to the published version of the manuscript.
Funding
This research received no external funding.
Institutional Review Board Statement
Not applicable.
Informed Consent Statement
Not applicable.
Data Availability Statement
Data can be directed to the corresponding author.
Conflicts of Interest
The authors declare no conflict of interest.
References
- Acemoglu, D.; Restrepo, P. Artificial Intelligence, Automation and Work. In The Economics of Artificial Intelligence: An Agenda; NBER Working Papers; University of Chicago Press: Chicago, IL, USA, 2018. [Google Scholar]
- Acemoglu, D.; Restrepo, P. The Race Between Man and Machine: Implications of Technology for Growth, Factor Shares and Employment. Am. Econ. Rev. 2018, 108, 1488–1542. [Google Scholar] [CrossRef]
- Olley, S.; Pakes, A. The Dynamics of Productivity in the Telecommunications. Equipment Industry. Econometrica 1996, 64, 1263–1297. [Google Scholar] [CrossRef]
- Arioli, V.; Ruggeri, G.; Sala, R.; Pirola, F.; Pezzotta, G. A Methodology for the Design and Engineering of Smart Product Service. Systems: An Application in the Manufacturing Sector. Sustainability 2023, 15, 64. [Google Scholar] [CrossRef]
- Badin, L.; Daraio, C.; Simar, L. Explaining inefficiency in nonparametric production models: The state of the art. Ann. Oper. Res. 2014, 214, 5–30. [Google Scholar] [CrossRef]
- Bakhshi, H.; Bravo, B.A.; Mateos, C.J. Inside the Datavores: Estimating the Effect of Data and Online Analytics on Firm Performance R; NESTA: London, UK, 2014. [Google Scholar]
- Borowski, P.F. Digital Transformation and Prosumers Activities in the Energy Sector. In Intelligent Systems in Digital Transformation; Kahraman, C., Haktanır, E., Eds.; Lecture Notes in Networks and Systems; Springer Nature: Berlin, Germany, 2021; Volume 549. [Google Scholar]
- Borowski, P.F. Digitization, digital twins, blockchain, and industry 4.0 as elements of management process in enterprises in the energy sector. Energies 2021, 14, 1885. [Google Scholar] [CrossRef]
- Borowski, P.F. Innovative Processes in Managing an Enterprise from the Energy and Food Sector in the Era of Industry 4.0. Processes 2021, 9, 381. [Google Scholar] [CrossRef]
- Brynjolfsson, E.; Hitt, L.M.; Kim, H.H. Strength in Numbers: How Does Data-Driven Decision-making Affect Firm Performance. SSRN Elibrary 2011, 1819486. [Google Scholar] [CrossRef]
- Brynjolfsson, E.; Hitt, L.M. Beyond computation: Information technology, organizational transformation and business performance. J. Econ. Perspect. 2000, 14, 23–48. [Google Scholar] [CrossRef]
- Cai, Y.; Fu, Y. Technology Effect and Structure Effect in Total Factor Productivity Growth: Based on China’s macro and industrial data and decomposition. Econ. Res. J. 2017, 52, 72–88. [Google Scholar]
- Dang, L.; Li, X.; Shen, S. Digital Transformation of Manufacturing Industry and Its Increasing Complexity of Export Technology. J. Int. Trade. J. 2021, 6, 32–47. [Google Scholar]
- Dagum, C. Decomposition and interpretation of Gini and the generalized entropy inequality measures. Statistic 1997, 57, 295–308. [Google Scholar]
- Deming, D.; Kahn, L.B. Skill Requirements Across Firms and Labor Markets: Evidence from Job Postings for Professionals. J. Labor Econ. 2018, 36, S337–S369. [Google Scholar] [CrossRef]
- Ding, Z. Research on Mechanism of Digital Economy Driving High-quality Economic Development: A theoretical analysis framework. Mod. Econ. Res. J. 2020, 1, 85–92. [Google Scholar]
- Guo, K.; Tian, X. Accelerating the Construction of New Development Patterns and Manufacturing transformation4and upgrading path. China Ind. Econ. 2021, 11, 44–58. [Google Scholar]
- Felipe, J.; McCombie, J. The Illusions of Calculating Total Factor Productivity and Testing Growth Models: From Cobb-Douglas to Solow and to Romer. J. Post Keynes. Econ. 2020, 43, 470–513. [Google Scholar] [CrossRef]
- Fueki, T.; Kawamoto, T. Does information technology raise Japan’s productivity? Jpn. World Econ. 2009, 21, 325–336. [Google Scholar] [CrossRef]
- Guo, M.; Fang, M. Artificial Intelligence and Productivity Paradox: International Experience. Econ. Syst. Reform 2018, 5, 171–178. [Google Scholar]
- He, X.; Liang, Q.; Wang, S. Information Technology, Labor Structure, and Enterprise Productivity: Solving the Puzzle of “Information Technology Productivity Paradox”. Manag. World 2019, 35, 65–80. [Google Scholar]
- Davis, H.S. Productivity Accounting; University of Pennsylvania Press: Philadephia, PA, USA, 1954. [Google Scholar]
- Chenery, H.B. Interactions between industrialization and exports. Am. Econ. Rev. 1980, 70, 281–287. [Google Scholar]
- Huang, Q.; Yu, Y.; Zhang, S.-L. Internet development and Manufacturing productivity improvement: Internal mechanism and Chinese experience. China Ind. Econ. 2019, 8, 5–23. [Google Scholar]
- Ji, K.; Liu, X.; Xu, J. Digital Economy and the Sustainable Development of China’s Manufacturing Industry: From the Perspective of Industry Performance and Green Development. Sustainability 2023, 15, 5121. [Google Scholar] [CrossRef]
- Jiao, S.; Sun, Q. Research on Measurement and Influence Factors of Digital Economy Development in China. World Surv. Res. J. 2021, 7, 13–23. [Google Scholar]
- Jiao, Y. Digital Economy Enabling Manufacturing Transformation: From Value Remodeling to Value Creation. Economist 2020, 6, 87–94. [Google Scholar]
- Li, C.; Li, D.; Zhou, C. Mechanism of Digital Economy driving Manufacturing Transformation and Upgrading: Based on Industrial Chain Perspective. Commer. Res. 2020, 2, 73–82. [Google Scholar]
- Li, Y.; Shi, L.; Li, Y. Measurement and Comparison of Total Factor Productivity Growth in Chinese Manufacturing Industry. Econ. Issues 2020, 3, 83–91. [Google Scholar]
- Li, Z.N.; Pan, W.Q. Econometrics; Higher Education Press: Beijing, China, 2014. [Google Scholar]
- Li, L. China’s Manufacturing Locus in 2025: With a Comparison of “Made-in-China 2025” and “Industry 4.0”. Technol. Forecast. Soc. Chang. 2018, 135, 66–74. [Google Scholar] [CrossRef]
- Liu, S.; Yan, J.; Zhang, S.; Lin, H. Can Digital Transformation of Enterprise Management Improve Input Output Efficiency? Manag. World 2021, 37, 13+170–190. [Google Scholar]
- Lu, X.; Lian, Y. Estimation of Total Factor Productivity of Chinese industrial enterprises: 1999–2007. Econ. Q. 2012, 11, 541–558. [Google Scholar]
- Peron, M.; Fragapane, G.; Sgarbossa, F.; Kay, M. Digital Facility Layout Planning. Sustainability 2020, 12, 3349. [Google Scholar] [CrossRef]
- Pan, M.; Zhao, Y. Internet convergence, human capital structure and total factor productivity in manufacturing. J. Stud. Sci. Sci. 2020, 2171–2182+2219. [Google Scholar]
- Ren, B.; Li, Y. The Determinants of Productivity Quality in High-quality economic development and its improvement path. Econ. Rev. 2018, 7, 27–34. [Google Scholar]
- Rupeika-Apoga, R.; Petrovska, K. Barriers to Sustainable Digital Transformation in Micro-, Small-, and Medium-Sized Enterprises. Sustainability 2022, 14, 13558. [Google Scholar] [CrossRef]
- Simar, L.; Wilson, P.W. Estimation and inference in two-stage, semiparametric models of productive processes. J. Econom. 2007, 136, 31–64. [Google Scholar] [CrossRef]
- Solow, R.M. A Contribution to the Theory of Economic Growth. Q. J. Econ. 1956, 70, 65–94. [Google Scholar] [CrossRef]
- Solow, R.M. Technical Change and the Aggregate Production Function. Rev. Econ. Stat. 1957, 39, 312–320. [Google Scholar] [CrossRef]
- Solow, R.M. We’d better watch out. N. Y. Times Book Rev. 1987, 36, 10007455139. [Google Scholar]
- Tao, C.; Qi, Y. Analysis of the Spatial Difference of Total Factor Productivity in China and its causes. J. Quant. Tech. Econ. 2010, 27, 19–32. [Google Scholar]
- Tinbergen, J. Zur Theorie der Langfristigen Wirtschaftsentwicklung. Weltwirtschaftliches Arch. 1942, 55, 511–549. [Google Scholar]
- Wan, X.; Luo, Y. Measurement of development level of digital economy and its influence on total factor productivity. Reform 2022, 1, 101–118. [Google Scholar]
- Wang, Y.; Kuang, X.; Shao, W. Information technology, Enterprise Flexibility, and Capacity Utilization. World Econ. 2017, 40, 67–90. [Google Scholar]
- Xie, L.; Chen, J.; Wang, S. ICT investment, Internet penetration and total factor productivity. Stat. Res. 2020, 37, 56–67. [Google Scholar]
- Xu, B.; Xie, J. Market Segmentation and Firm productivity: Evidence from Chinese manufacturing firms. World Econ. 2016, 39, 95–122. [Google Scholar]
- Yao, Z. Productivity Growth and Factor Reallocation Effect: An Empirical Study of China. Econ. Res. J. 2009, 44, 130–143. [Google Scholar]
- Yang, G.; Hou, Y. The Use, Technological Upgrading and Economic Growth of Industrial Robots. China Ind. Econ. 2020, 10, 138–156. [Google Scholar]
- Yang, H.; Jiang, L. Digital Economy, Spatial Effect, and Total Factor Productivity. Stat. Res. 2021, 38, 3–15. [Google Scholar]
- Yang, R. Research on the Total Factor Productivity of Chinese manufacturing Enterprises. Econ. Res. J. 2015, 50, 61–74. [Google Scholar]
- Yang, Z.; Chen, J.; Li, J. Global Value Chain in the Era of Digital Economy: Trends, Risks and Countermeasures. Econ. 2022, 2, 64–73. [Google Scholar]
- Zhang, T.; Zhang, S. Biased Policy, Resource Allocation and Efficiency of State-owned Enterprises. Econ. Res. J. 2016, 2, 126–139. [Google Scholar]
- Zhang, X.; Gui, B. Analysis of China’s Total Factor Productivity: A Review and Application of Malmquist Index method. J. Quant. Tech. Econ. 2008, 6, 111–122. [Google Scholar]
- Zhang, Z.; Li, J.; Yan, J.; Luo, Q. Globalization, Technological Progress and Welfare Total Factor Productivity: A Comparative Analysis Based on 183 Countries and Regions. J. Macroecon. Res. 2022, 2, 115–136. [Google Scholar]
- Zhao, C.; Wang, W.; Li, X. How Digital Transformation Affects Enterprise Total Factor Productivity. Financ. Trade Econ. 2021, 42, 114–129. [Google Scholar]
- Zhao, T.; Zhang, Z.; Liang, S. Digital economy, entrepreneurial activity and high-quality development: Empirical evidence from Chinese cities. Manag. World 2020, 4, 65–76. [Google Scholar]
- Zhong, T.; He, L.; Sun, F. Research on the Influence of Industrial Policy on the Total Factor Productivity of Enterprises. Econ. Rev. 2019, 12, 86–98. [Google Scholar]


Disclaimer/Publisher’s Note: The statements, opinions and data contained in all publications are solely those of the individual author(s) and contributor(s) and not of MDPI and/or the editor(s). MDPI and/or the editor(s) disclaim responsibility for any injury to people or property resulting from any ideas, methods, instructions or products referred to in the content. |
© 2023 by the authors. Licensee MDPI, Basel, Switzerland. This article is an open access article distributed under the terms and conditions of the Creative Commons Attribution (CC BY) license (https://creativecommons.org/licenses/by/4.0/).