Article

Urban Flooding Risk Assessment in the Rural-Urban Fringe Based on a Bayesian Classifier

1
College of Architecture and Urban Planning, Guangzhou University, Guangzhou 510006, China
2
Guangdong Provincial Key Laboratory of Petrochemical Pollution Processes and Control, School of Environmental Science and Engineering, Guangdong University of Petrochemical Technology, Maoming 525000, China
3
Faculty of Civil Engineering and Built Environment, University Tun Hussein Onn, Parit Raja 86400, Johor, Malaysia
4
College of Design and Innovation, Tongji University, Shanghai 200093, China
5
School of Civil and Environmental Engineering, Nanyang Technological University, Singapore 639798, Singapore
*
Authors to whom correspondence should be addressed.
Sustainability 2023, 15(7), 5740; https://doi.org/10.3390/su15075740
Submission received: 4 February 2023 / Revised: 16 March 2023 / Accepted: 22 March 2023 / Published: 24 March 2023
(This article belongs to the Section Sustainable Urban and Rural Development)

Abstract

:
Urban flooding disasters have become increasingly frequent in rural-urban fringes due to rapid urbanization, posing a serious threat to the aquatic environment, life security, and social economy. To address this issue, this study proposes a flood disaster risk assessment framework that integrates a Weighted Naive Bayesian (WNB) classifier and a Complex Network Model (CNM). The WNB is employed to predict risk distribution according to the risk factors and flooding events data, while the CNM is used to analyze the composition and correlation of the risk attributes according to its network topology. The rural-urban fringe in the Guangdong–Hong Kong–Macao Greater Bay Area (GBA) is used as a case study. The results indicate that approximately half of the rural-urban fringe is at medium flooding risk, while 25.7% of the investigated areas are at high flooding risk. Through driving-factor analysis, the rural-urban fringe of GBA is divided into 12 clusters driven by multiple factors and 3 clusters driven by a single factor. Two types of cluster influenced by multiple factors were identified: one caused by artificial factors such as road density, fractional vegetation cover, and impervious surface percentage, and the other driven by topographic factors, such as elevation, slope, and distance to waterways. Single factor clusters were mainly based on slope and road density. The proposed flood disaster risk assessment framework integrating WNB and CNM provides a valuable tool to identify high-risk areas and driving factors, facilitating better decision-making and planning for disaster prevention and mitigation in rural-urban fringes.

1. Introduction

Urban flooding, a multifaceted phenomenon encompassing various forms of inundation resulting from intense precipitation or insufficient drainage, poses a significant threat to urban ecological systems, human well-being, and property security [1,2,3]. The magnitude and frequency of urban flooding will be expected to continuously increase due to the global climate change [4,5,6,7,8]. As a complex transition zone in the periphery of growing urban areas, the rural-urban fringe has typical characteristics of strong dynamism, high complexity, and weak protection compared with the urban center and rural areas. The rapid urbanization has resulted in a large number of natural green spaces being occupied by impervious surfaces, posing severe flooding disaster risks compared to rural areas. Additionally, since insufficient fundamental infrastructure exists in the rural-urban fringe compared to urban areas, there would be great opportunity to construct or improve stormwater drainage systems for preventing urban flooding risks. It is therefore relatively easy to reduce the adverse impact of flood disasters on urban development through planning and implementation compared to urban centers. Nevertheless, to date, few studies have been conducted to investigate urban flooding in the rural-urban fringe. As such, it is critical to consider planning and implementing methods for preventing and reducing urban flooding in the rural-urban fringe.
In terms of urban flooding risk assessment, hydrological and hydrodynamic models have been commonly used in the early stages [9,10]. Models such as the Storm Water Management Model (SWMM) and Mike software, which were integrated into the rainfall production confluence computation, have been extensively used to simulate the physical process of urban flooding by computing surface runoff and calculating the confluence and generation of surface runoff [11,12]. Nevertheless, it can be challenging to use these models to simulate spatially distributed hydrological processes at high spatial and temporal resolutions, particularly in highly heterogeneous urbanized regions [13]. Furthermore, the application of these models to large urban areas seems to be limited, mainly due to the disadvantages of being time-consuming, data demanding, and vulnerable to errors [14,15]. Alternately, machine learning (ML) methods can overcome the shortcomings of hydrologic and hydraulic models [16], as they can automatically obtain flood risk characteristics on the basis of intelligent models [17,18,19] and usually require relatively simple spatial data with high performance and reliable generalizations [20,21].
Bayesian Network (BN), a widely used ML tool for evaluating uncertainties during risk evaluations by considering the probability distribution of stochastic variables and their joint probability, could be used for assessing the potential occurrence of disasters [22]. BN has been widely applied to estimate the likelihood of various hazards, owing to its ability to correlate risk attributes with historical disaster data. Jager et al. [23] developed a BN model for evaluating the percentage of affected receptors in different zones of the site by predicting their hazards and damages. Naive Bayesian (NB) is a particular application of BN, which is used to transform a BN’s multidimensional condition into a multiplicative relationship between multiple conditional probability distributions [24,25]. Due to its simplified algorithm structure [26], stable classification efficiency, and less sensitivity to noise, NB can acquire satisfied classification performance in experiments with fewer samples [27]. Yang et al. [28] compared the performance of NB, Support Vector Machine, and Random Forest algorithms for urban waterlogging assessment and found that the NB algorithm outperformed the others with the highest macro-average accuracy. Liu et al. [29] developed a likelihood-based flooding hazard map at a regional scale using NB to simplify the multi-dimensional condition of a BN. However, since the assumption of independent attributes may not be valid in reality, it may be less persuasive to assess flooding risk when using a single NB [30]. Weight Naive Bayesian (WNB) can overcome the defect of NB by assigning weights based on risk factors to attributes [27]. Liu et al. [31] developed a framework for assessing the urban flooding at the Fitzroy River Basin in Queensland, Australia, by integrating WNB, GIS, and remote sensing and revealed that the weights calculated appropriately describe the relationships among factors and confirm that the performance of urban flooding by WNB is better than NB. Thus, WNB can be used to produce a more realistic representation, enhance modeling performance, and mitigate the hypothesis of conditional independence. Tang et al. [32] explored a comprehensive framework for evaluating the spatial likelihood of flood hazards in urban catchments by integrating WNB and Geographic Information Systems (GIS). Therefore, WNBs may be a promising modeling method for assessing flood susceptibility on the rural-urban fringe. Table S1 presents a comparison of the proposed urban flooding risk assessment in the rural-urban fringe based on a Bayesian Classifier with other state-of-the-art studies recently published in the domain.
Identifying flood-driving factors is a key step for exploring feasible and reliable adaptation measures, since the driving factors of urban flooding vary by region due to the specific characteristics of location, especially in regions with complicated geographical environments [33,34]. A flood index can be calculated to reflect a high flooding risk in a specific area, while its values can be neglected in another area [35]. Complex network model (CNM), which is used to identify the driving factors, allows for rapid analysis of complex systems by simplifying the nodes and edges of components and interactions between components (using nonlinear interaction) [36,37]. Furthermore, it is especially suitable for evaluating systemic risks to support decision-makers for formulating adaption strategies [38]. Ellinas et al. [39] developed a CNM to examine the vulnerability of urban flooding and predict wide-scale catastrophe triggered by one-fold mission failure, and the results were presented via a cascading process. Yu et al. [40] proposed a CNM to investigate social risks related to housing redevelopment and urban renovation. In addition, graph-based CNMs have been developed and applied to the resilience assessment of water distribution systems [41], hydraulic behavior evaluation [42], sensor placement [43], and water quality assessment [44]. It is worth noting that CNM has high application potential for assessing the risk of urban flooding, particularly in highly heterogeneous megacities and urban agglomerations. However, to date, few studies have been carried out for systemic flooding risk assessment and identifying driving factors using CNM.
Within this context, this study aimed to (1) propose a comprehensive framework that integrates a Weighted Naive Bayesian (WNB) classifier and a Complex Network Model (CNM) to assess the risk probability of urban flooding and its attributes; (2) identify the drivers of urban flooding in risk-prone rural-urban fringe using the proposed framework; and (3) provide corresponding adaptive strategies based on the identified driving factors. This paper was organized as follows. Section 2 introduced the materials and methods used to propose a comprehensive framework for assessing the risk probability of urban flooding and its attributes. In Section 3, the mapping of urban flooding risk and the analysis of dominant risk attributes were presented and discussed. Section 4 summarized the conclusions.

2. Materials and Methods

2.1. Case Study

With a total area of 56,000 km2, the Guangdong–Hong Kong–Macao Greater Bay Area (GBA), including 11 cities (i.e., Guangzhou, Zhaoqing, Hong Kong, Macao, Foshan, Zhuhai, Huizhou, Shenzhen, Zhongshan, Dongguan, and Jiangmen), is one of China’s three urban agglomerations. The GBA plays a key strategic role in the country’s development with the highest economic output in China. With an average precipitation of 1600–2300 mm per year, the weather in GBA is characterized by uneven rainfall distribution due to its subtropical marine monsoon climate [45]. Consequently, the increased extreme precipitation events have posed high potential flooding risks in GBA [46].
The rural-urban fringe is an important component of the GBA with significant influence on the sustainable development of GBA. Therefore, it is urgent to explore effective strategies for flood disaster adaptation by analyzing the spatial distribution and driving factors of flood disaster risk in the rural-urban fringe of GBA. In this study, geographic information on the rural-urban fringe of GBA was derived from the Department of Natural Resources of Guangdong Province, China (http://nr.gd.gov.cn/ (accessed on 18 May 2022)) [47] (Figure 1).

2.2. Materials

2.2.1. Data

A total of 2593 urban flooding events during the period of 2015–2020 and the relevant driving factors associated with flooding hazards were collected as source data (see Table 1). The data on historical flooding events were obtained from the Water Resources Department of Guangdong Province (http://slt.gd.gov.cn (accessed on 15 March 2021)), Drainage Services Department, Hong Kong (https://www.dsd.gov.hk (accessed on 19 March 2021)), and the Municipal Affairs Bureau, Macau (http://www.iam.gov.mo (accessed on 20 March 2021)), as well as local media reports (https://www.toutiao.com (accessed on 25 March 2021)).
The magnitude of urban flooding is largely dependent on urban sub-catchment characteristics, such as topography, vegetation, and soil characteristics, which may also affect urban flooding. Therefore, seven flood-driving factors, i.e., elevation (DEM), slope (SLOP), the distance from the waterway (DW), road density (RD), fractional vegetation cover (FVC), soil water retention (SWR), and impervious surface percentage (ISP), were selected as flooding risk indexes to determine urban flooding in the present study [29,48].
Table 1. Data sources.
DataFormatData Sources
Flooding pointsShapefileWater Resources Department of Guangdong Province, China (http://swj.gz.gov.cn (accessed on 15 March 2021))
Drainage Services Department, Hong Kong (https://www.dsd.gov.hk (accessed on 19 March 2021))
Municipal Affairs Bureau, Macau (http://www.iam.gov.mo (accessed on 20 March 2021))
TouTiao (https://www.toutiao.com (accessed on 25 March 2021))
Digital elevation modelRasterAdvanced Spaceborne Thermal Emission and Reflection Radiometer Global Digital Elevation Model (ASTER GDEM) 30 m
Waterway networkShapefileOpenStreetMap (https://www.openhistoricalmap.org (accessed on 24 February 2021))
Road networkShapefileOpenStreetMap (https://www.openhistoricalmap.org (accessed on 26 February 2021))
Fractional vegetation coverTifLandsat 8 Operational Land Imager_Thermal Infrared Sensor
Soil typeRasterResource and Environment Science and Data Center, China (https://www.resdc.cn (accessed on 27 February 2021))
Impervious surface percentageRaster[49]

2.2.2. Spatial Distribution of the Driving Factors

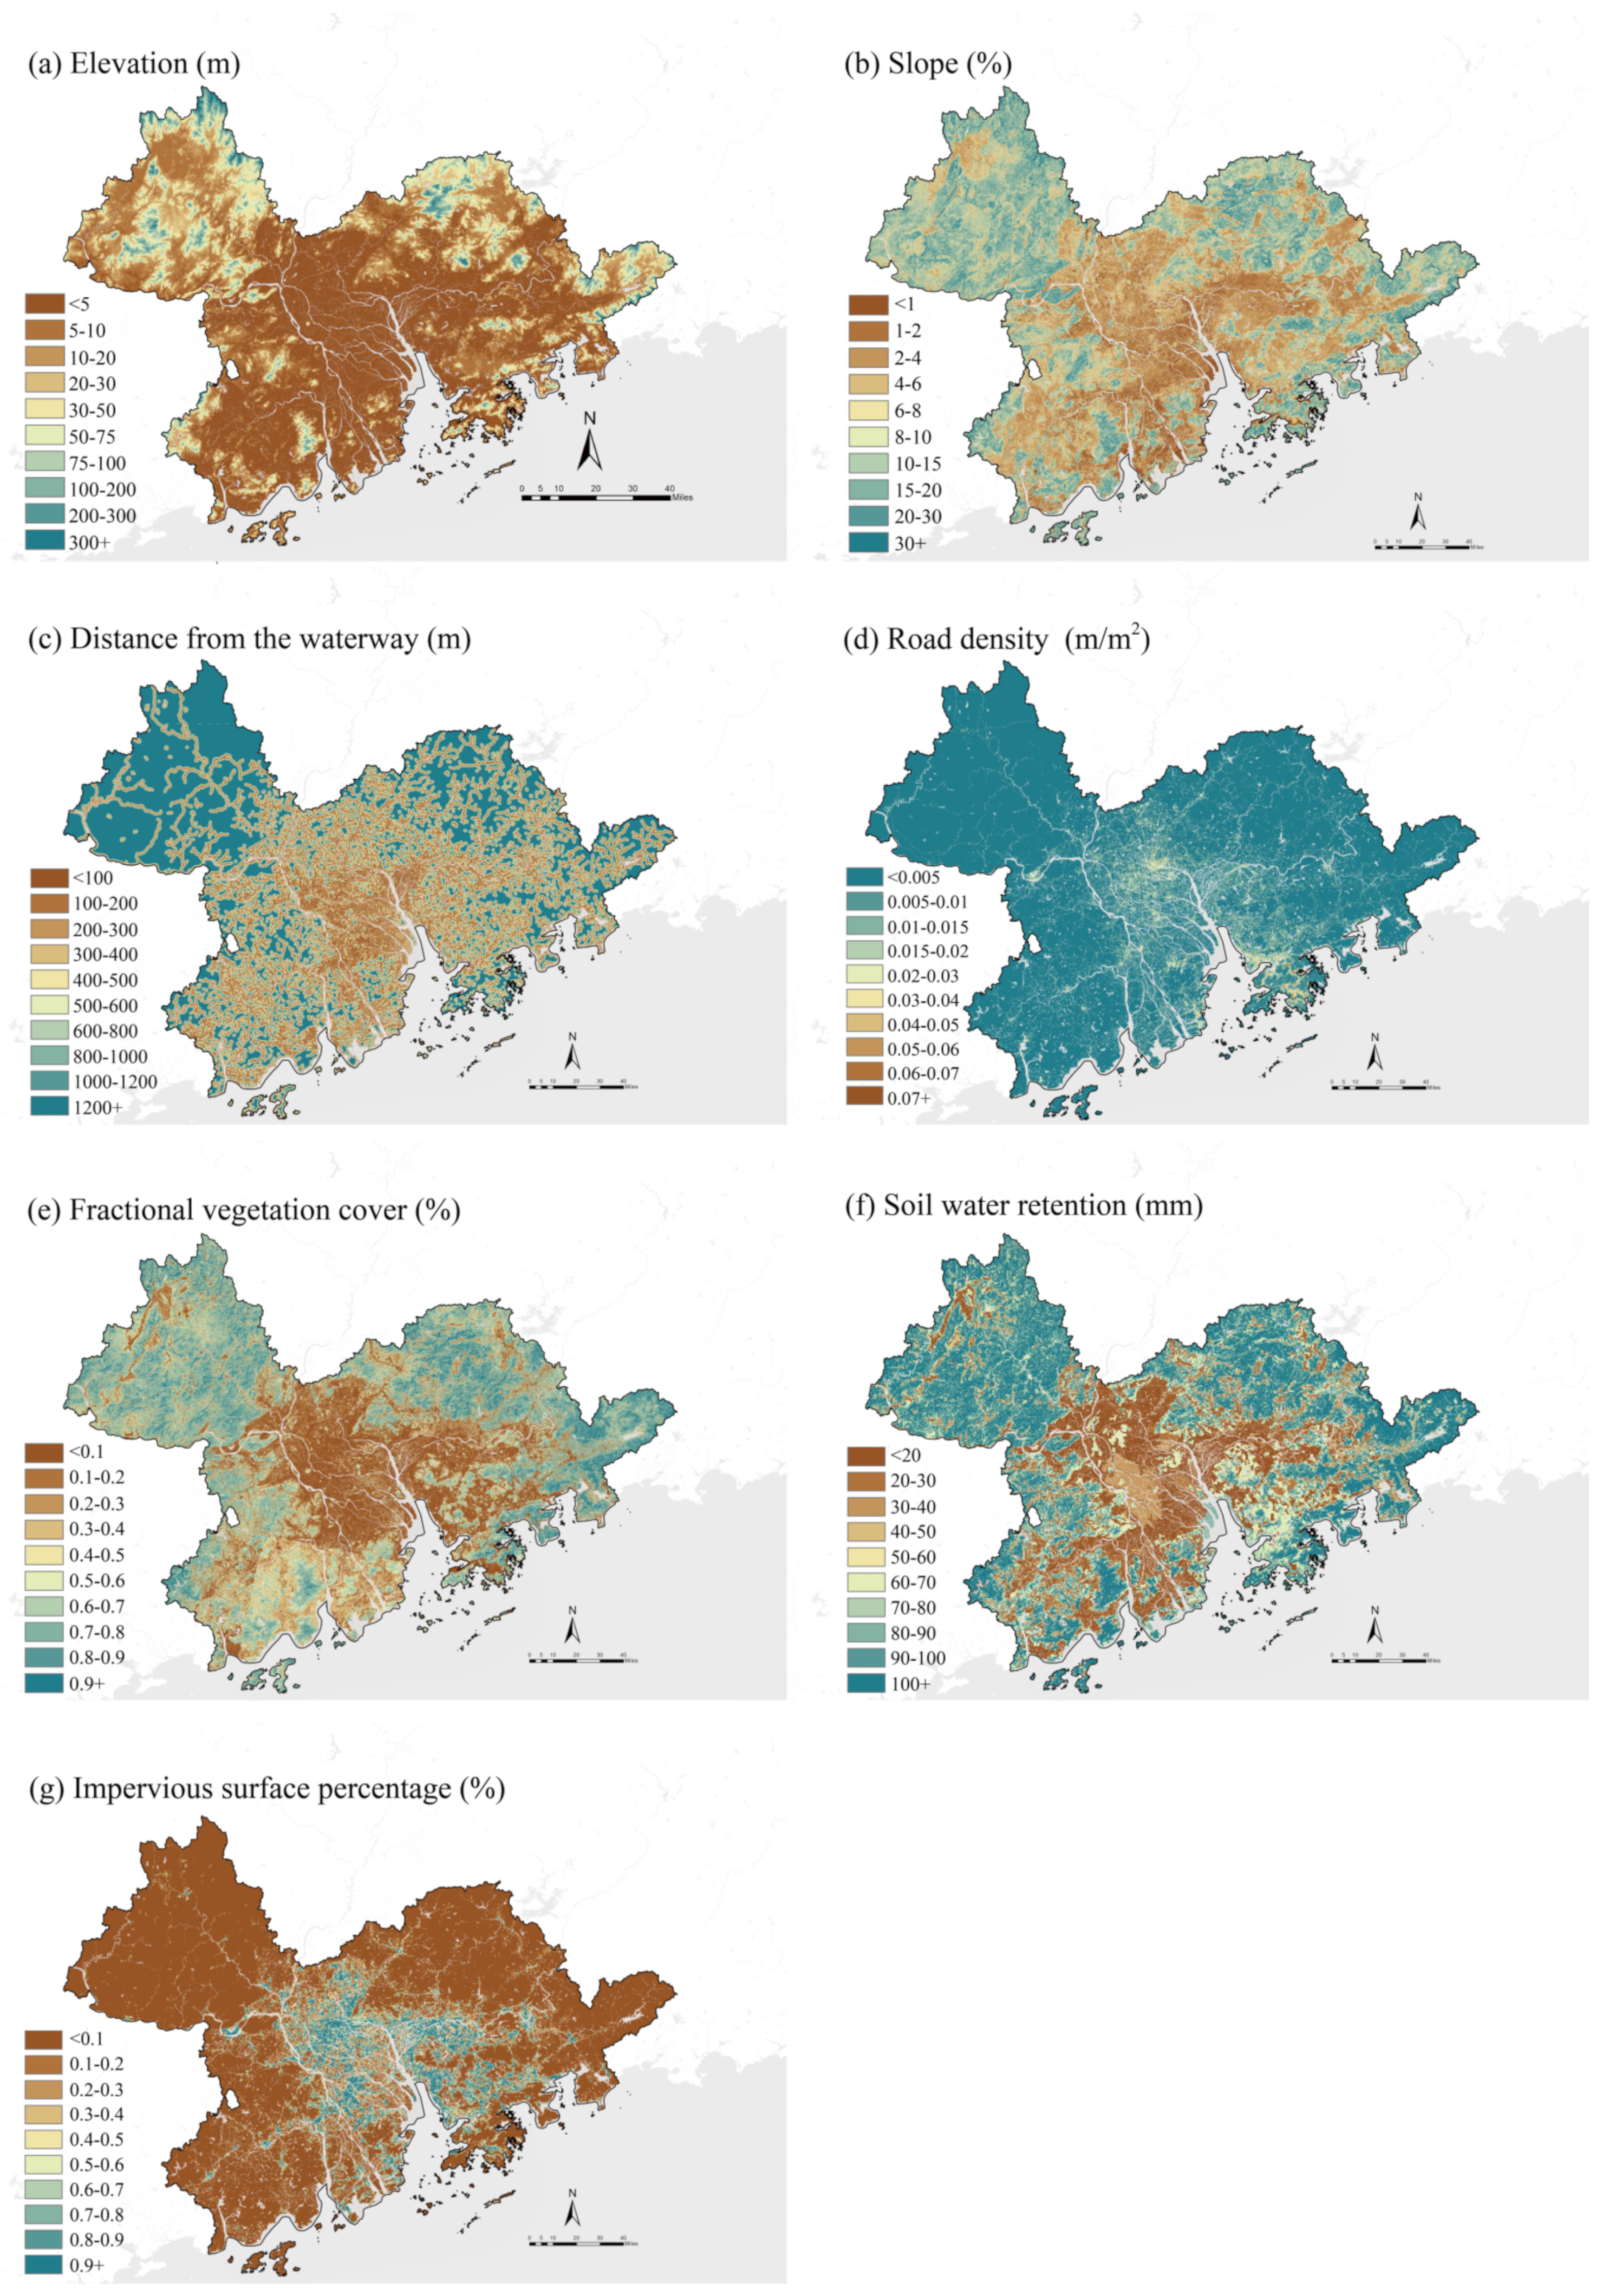
Figure 2 illustrates the spatial distributions of the driving factors, which were used to produce the flow and confluence patterns of surface runoff and distribution of urban flooding hazards. As shown in Figure 2a,b, the spatial distribution of DEM and SLOP in GBA were derived from the Digital Elevation Model. The DW refers to the distance from each grid to the nearest river, obtained by the Euclidean distance tool in GIS, as presented in Figure 2c. The RD, defined as the ratio of the total road length of a region to its surface area, was computed from the road vector files using the mapping analysis tools on the ArcGIS platform, as illustrated in Figure 2d.
(1)
Fractional Vegetation Cover
FVC is the percentage of vertical projections of vegetation (i.e., branches, stems, and leaves) on a land surface, which reflects the growth status of vegetation (Figure 2e). The FVC was calculated by the Normalized Difference Vegetation Index (NDVI), described as the following formula.
F V C = N D V I N D V I m i n N D V I max N D V I m i n
NDVI is multi-spectral data obtained by remote sensing, which consist of linear and nonlinear combinations. The calculation formula is described as follows:
N D V I = N I R R E D N I R + R E D ,
where NIR is the reflection in the near-infrared spectrum and RED is the reflection in the red range of the spectrum.
(2)
Soil Water Retention
Soil Water Retention (SWR) is an important property of the urban underlying surface, which can directly affect the extent of urban flooding risks. Land with a high rate of SWR can absorb more rainwater, indicating that such urban area is at a lower risk of flooding. The spatial distribution of SWR in the investigated area is illustrated in Figure 2f. The potential maximum SWR was calculated cell by cell using a spatial hydrological modelling approach, which is driven by the Soil Conservation Service Curve Number, as described in the following formula.
S W R = 25400 C N 254
where CN is a function related to land use, soil type, and the antecedent moisture condition. CN value can be obtained by combining soil type, FVC, and ISP.
(3)
Impervious surface percentage
Impervious surfaces are mainly man-made structures that are covered by nearly impenetrable materials, such as asphalt, concrete, brick, stone, and roof tops. Owing to the fast progress of urbanization, impervious surfaces can cause potential urban flooding due to the accumulation of stormwater runoff. The ISP was defined as the percentage of impervious surface area per unit area. Urban flooding would be more likely to occur in an area with a large ISP, owing to the efficient infiltration of rainwater. The range of ISP was [0, 1]. The spatial distribution of DEM in the study area was shown in Figure 2g.

2.3. Methodology

2.3.1. Risk Assessment Based on Weighted Naive Bayes

There were three modules for assessment of urban flooding: the determination of weight, the generation of conditional probability tables, and the calculation of risk likelihood.
(1)
The determination of weight
A linear weighting method was employed for combining the Analytic Hierarchy Process (AHP, a subjective weighting process) and the Entropy Weighting (EW, an objective weighting process) method [50]. The integrated weighting can be calculated using Equation (4):
W i = a H i + ( 1 a ) Z i
where W i , H i , and Z i are the integrated weighting, the subjective weighting, and the objective weighting of the i-th risk index, respectively, with 1 ≤ i ≤ 10. The range (from 0 to 1) was set as 0.5 in this study, since the subjective and objective weights are considered equally important, as per Tang et al. [32].
(2)
The generation of conditional probability tables
The critical step in the WNB modeling process was to obtain a reasonable prior probability initially. There were approximately 0.59 million grids generated in GBA, while only 2593 of these were associated with urban flooding events. If all the grids were directly imported into the sample table, the prior probability for the occurrence of urban flooding was very small indeed. Therefore, the model used for predicting urban flooding risks would not be valid. Hence, the use of an iterative and small-scale sampling method was employed to avoid underestimation of prior probability and to obtain a set of reliable conditional probability tables. During each iterative sampling process, 3000 samples were randomly selected from the inundated and non-inundated grids. The total number of iterations was 10,000 to produce appropriate sampling and cap the computational load. The Overall Accuracy coefficient of 0.85 and Kappa coefficient of 0.75 were adopted as threshold evaluative indicators for verifying the sampling tables. The tables of all samples above the threshold were used to calculate the conditional probability table for the attribute.
(3)
The calculation of risk likelihood
The likelihood of urban flooding (or non-flooding) assigned to each influence factor was computed using Equation (5).
L i k e l i h o o d i ( x , y ) = P ( D = d 1 E i ( x , y ) ) P ( D = d 1 E i ( x , y ) ) + P ( D = d 2 E i ( x , y ) )
where E i represents the probability condition for such events and is attributable to one of the index.
The conditional probability P ( D = d j E i ( x , y ) ) for cell ( x , y ) of the region can be determined using Equation (6).
P ( D = d j E i ( x , y ) ) = P ( D = d j ) i 1 n p E i x , y d j w i D = d j = d 1 = w a t e r l o g g i n g , d 2 = n o n w a t e r l o g g i n g
where w i is the weight of the i-th risk index.

2.3.2. Spatial Urban Flooding Assessment within the Framework of a Complex System

(1)
Proximity matrix analysis
To analyze the driving factors of urban flooding at a specific site, it is critical to identify proximity, i.e., the similarity of attributes between two nodes (or townships). The proximity index, a relatedness index developed by Hidalgo, Klinger, Barabasi, and Hausmann [36] reflecting the minimum conditional probability of the co-occurrence of flooding for two adjacent nodes, was adopted to evaluate the similarity of the flooding occurrence. The proximity φi,j can be calculated using Equation (7):
φ i , j = m i n P R C A i = 1 R C A j = 1 , P R C A j = 1 R C A i = 1
where RCAi represents the assigned comparative advantage of the i-th node, the value of factor n in the i-th node is on the top 20% of the severity band, and x(I,n) was assigned a value of 1; otherwise, the value of x(i,n) was assigned the value of 0.
For the topology generation process, a matrix of RCAi,x was initially proposed. Eight variables were selected, with seven independent factors and one dependent factor, “flooding”. A matrix of proximity was established by calculating the minimum conditional probability between nodes. Finally, the network topology of the complex network was developed using the maximum tree.
(2)
Modularization analysis
A modularization algorithm was employed to evaluate the cluster relationship formed by similar “demand” in the network. In a modularization analysis, the Fast Newman, a widely used algorithm for community detection in complex networks, was used to divide the communities by exploring the maximum modularity [51] to cluster nodes in the network and summarize the characteristics of different clusters. Modularity Q can be calculated using Equation (8):
Q = i , j A i , j k i k j 2 m δ c i , c j 2 m
where Q denotes the modularity of a cluster; Aij represents the weighting of the edge between township i and township j; ki is the sum of the weightings of edges attached to township i; ci denotes the cluster to which township i is assigned; and the value of δ(u, v) is 1 if u = v and 0, otherwise, m = (Σij Aij)/2.
(3)
Contribution analysis
The contribution of a single impact factor to cluster is the ratio of the comparative advantages of a single impact factor to the comparative advantages of the cluster. The contribution F k , x can be calculated using Equation (9):
F k , x = x R C A ( k , x ) = 1 k R C A k = 1
where F k , x represents the contribution of the x-th factor in the k-th cluster; k R C A k denotes the sum of the comparative advantages of the k-th cluster; x R C A ( k , x ) presents the sum of the comparative advantages of the x-th factor in the k-th cluster.

3. Results and Discussion

3.1. Weightings and the Best-Estimated Conditional Probability Tables

The weighting of each spatial variable calculated using the linear weighting method is shown in Table 2, illustrating the contributions of the variables to urban flooding events. A higher weighting value indicates a more substantial contribution of a spatial variable to the incident of urban flooding [32]. The results obtained indicate that vegetation and impervious coverage (FVC and ISP) were the most significant spatial variables, while DEM had the least significance associated with urban flooding. Hence, urban inundation hazards were mainly caused by the hydrological effects of urban surface features.
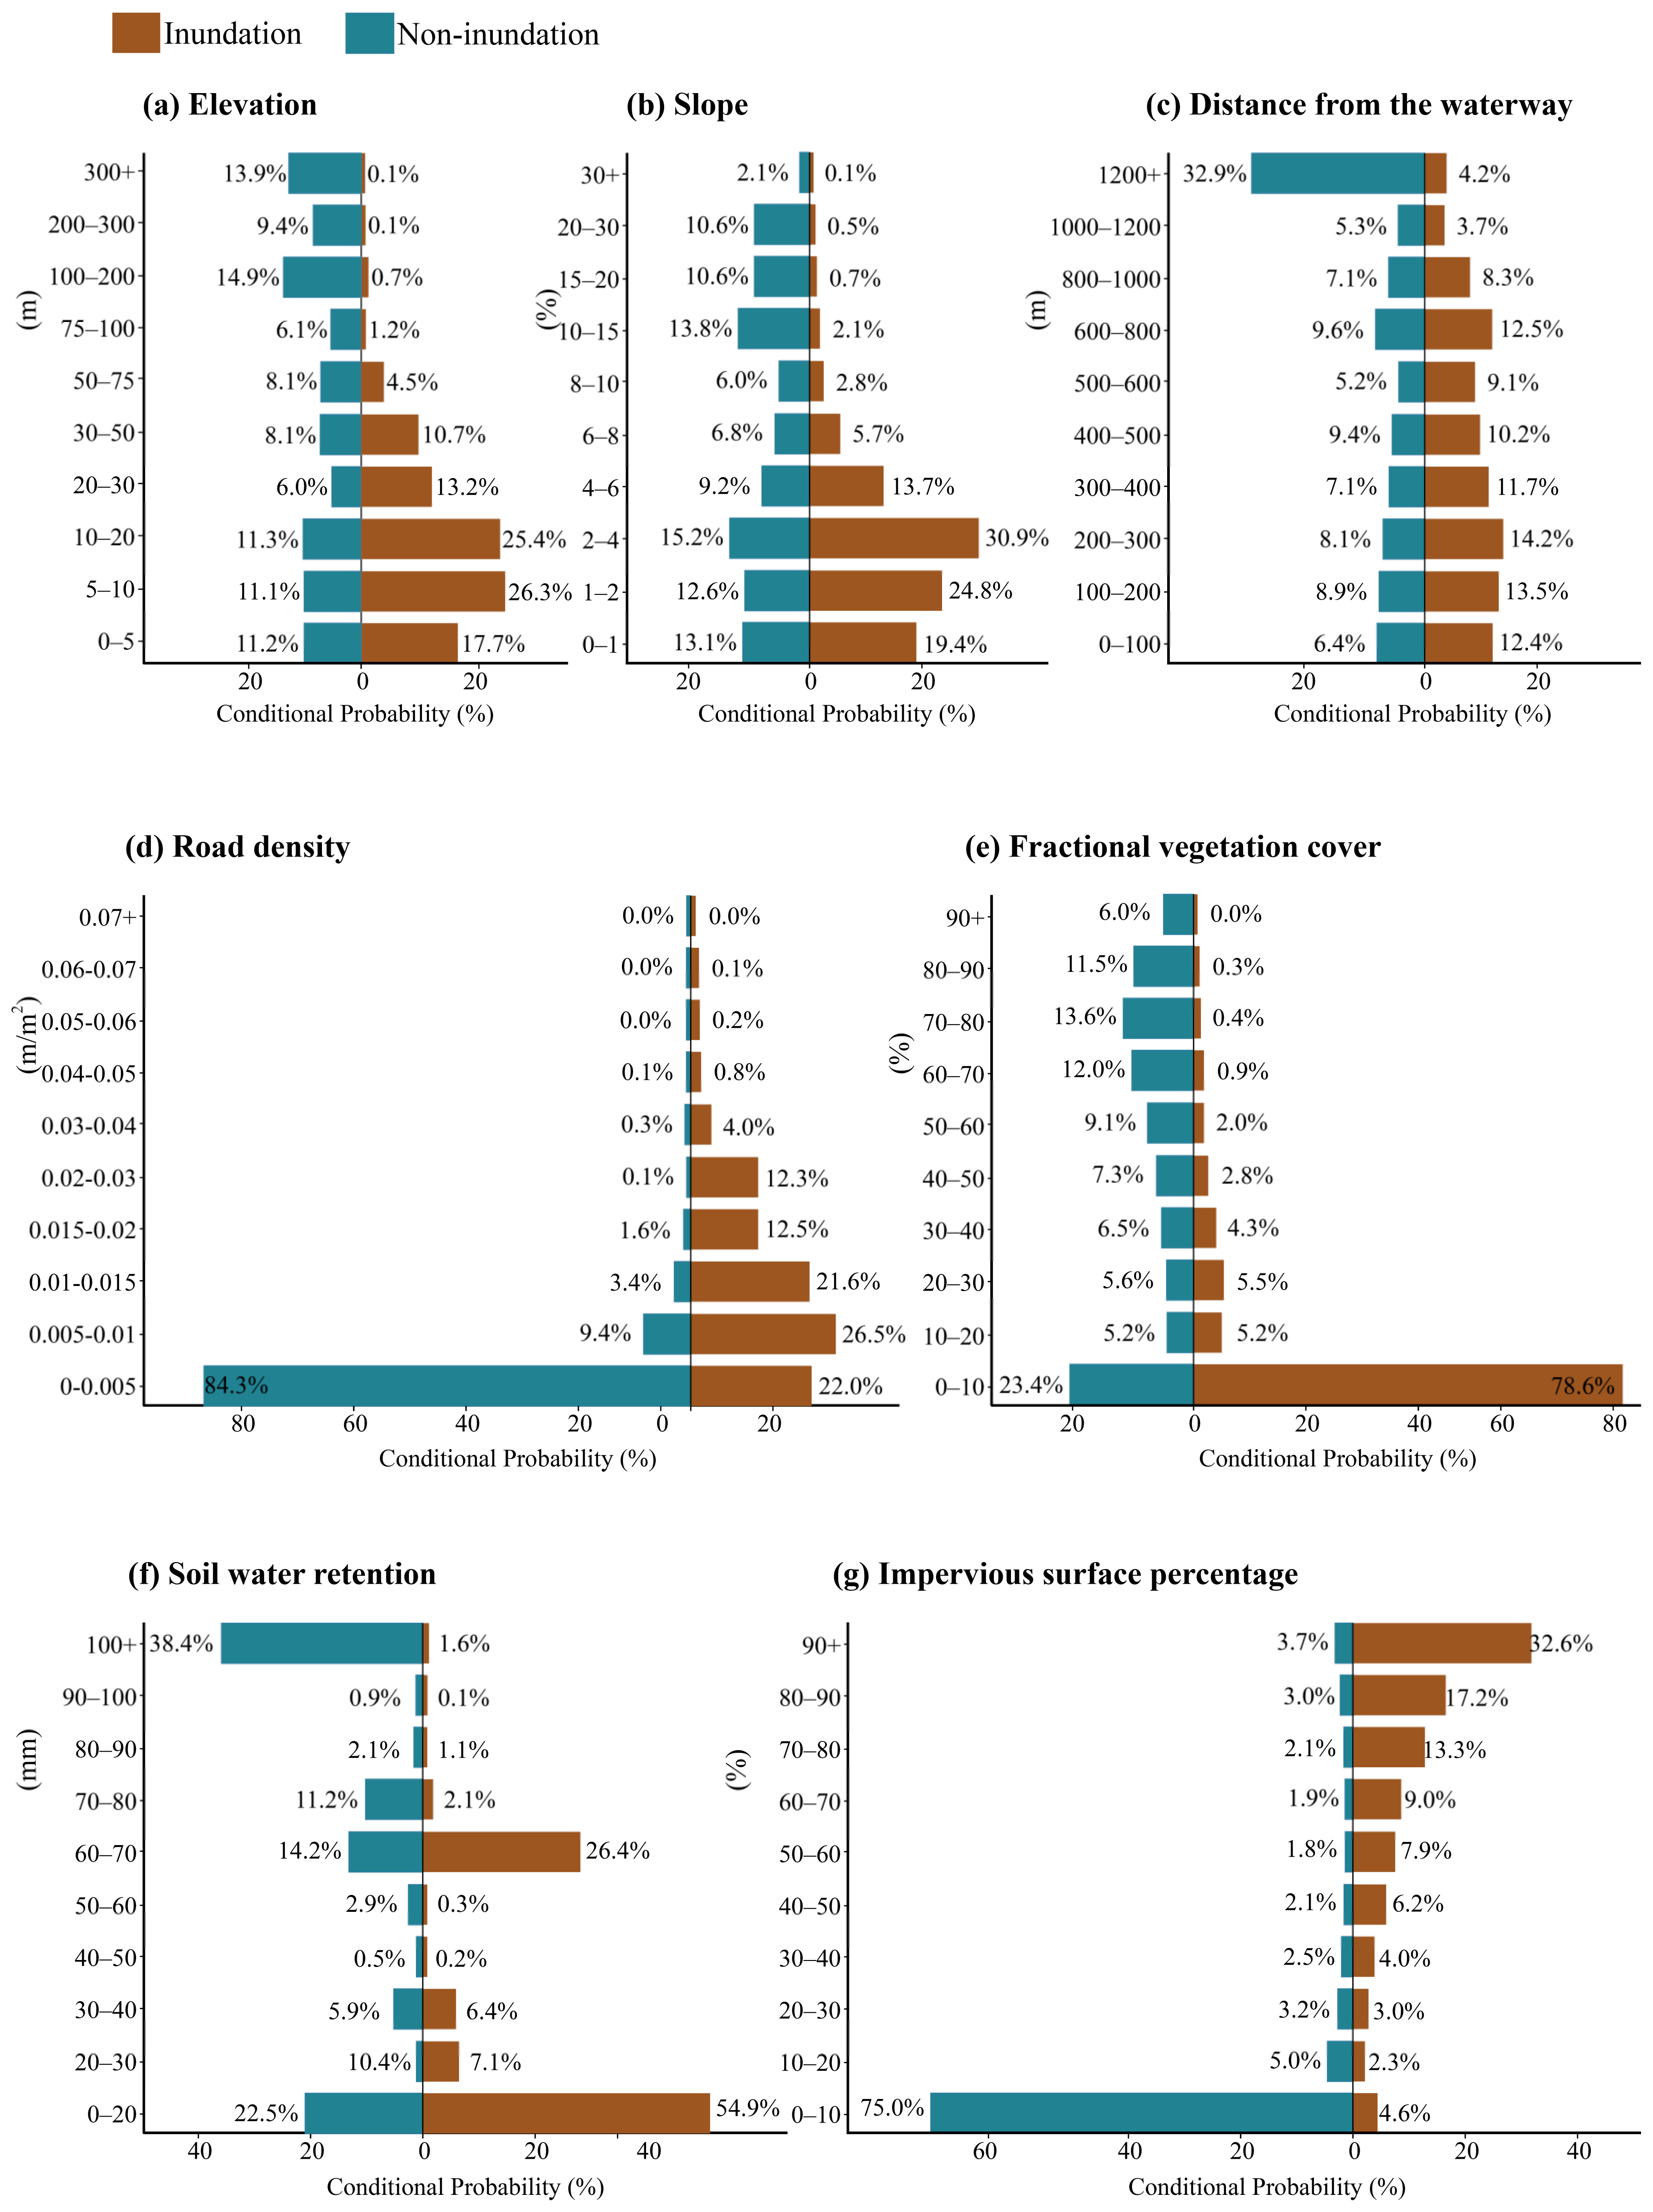
Figure 3 illustrates the changes in the conditional probability of inundation or non-inundation under the conditions of the seven spatial variables identified. Various variables exerted inconsistent effects on the probability of the urban areas with or without flooding risks. Specifically, the conditional probability of inundation decreases with DEM increase, since stormwater runoff flows downhill as expected [52]. As presented in Figure 3b, the conditional probability of inundation decreased with SLOP increase, since relatively flat topography usually drains surface runoff ineffectively and tends to exhibit a higher probability of urban flooding [53,54]. As for DW, the conditional probability was determined to be the greatest when DW was greater than 1200 in non-inundation (Figure 3c). As illustrated in Figure 3d, the probability of non-inundation in a low RD (0–0.005 m/m2) region was 84.2%. As RD increased, this probability decreased, suggesting that urban flooding was unlikely to occur in regions with low RD values. Furthermore, a higher conditional probability of inundation (78.6%) was mainly observed in areas with low FVC (0–10%) (Figure 3e). Thus, it can be speculated that urban flooding risks increased with decreased vegetation coverage. The lower the FVC value, the less favorable the vegetation growth conditions and the higher the flooding risks [55]. On the contrary, with the larger ISP values, the higher conditional probability of urban flooding was observed (Figure 3g). This finding was consistent with previous studies conducted by Zhang et al. [56] and Guo et al. [57].
In urban areas, natural green spaces, such as forests, grasslands, and wetlands, which reduce surface runoff, are often replaced by artificial impervious surfaces, resulting in an increase in stormwater runoff convergence and high urban flooding potential [8,58]. As a whole, these findings indicated that the conditional probability of spatial variables exhibited a clear pattern, highlighting the effectiveness of the variables selected for predicting urban flooding. Among which, the conditional probability of ISP and FVC exhibited the most significant alteration. This finding was consistent with the result of linear weighting, indicating the objectivity of the weight calculation method selected for this study.

3.2. Mapping of Urban Flooding Risk

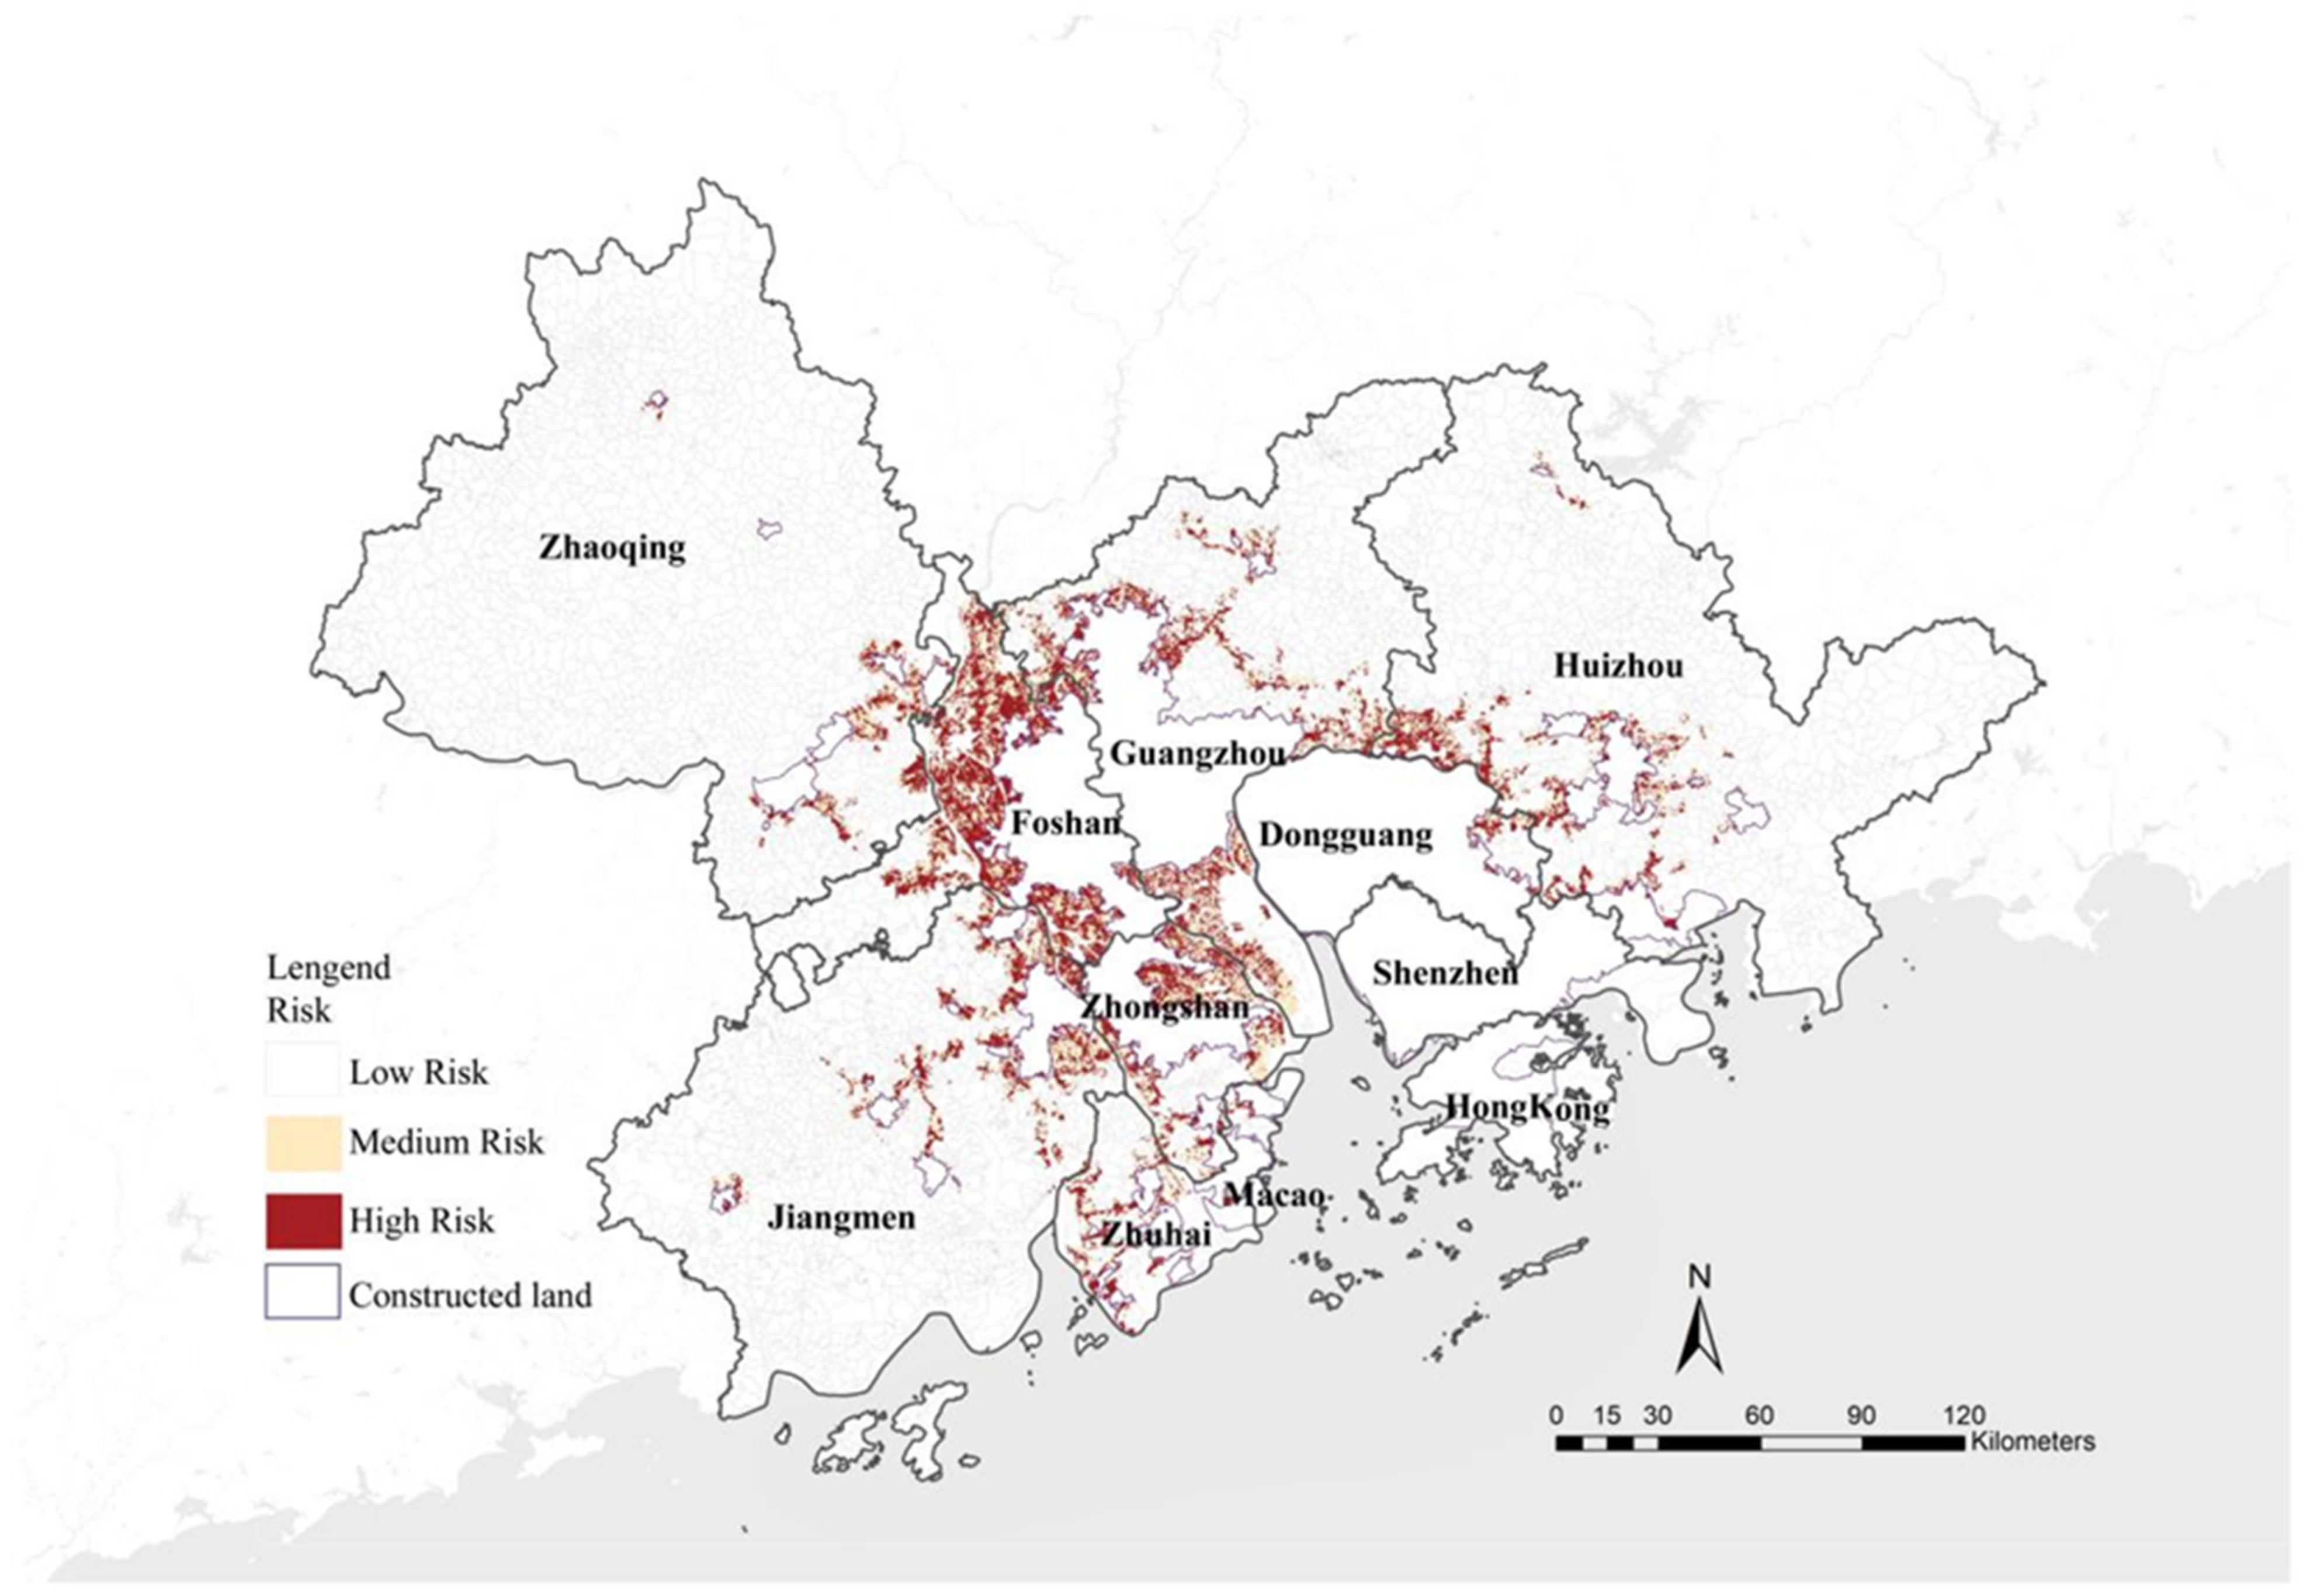
The natural fracture method was used for the classification of flood disaster risk, i.e., low risk (0–23.0%), medium risk (23.0–43.7%), and high risk (43.7–83.2%). As presented in Table 3, there were 3106.4 hm2 of rural-urban fringe with high risk, accounting for 25.7% of the total area of the investigated rural-urban fringe. Nearly half of the rural-urban fringes were under exposure of medium risk. Figure 4 illustrates the spatial distribution of the risk of urban flooding. The areas with high risk were mainly distributed in Foshan, Zhongshan, and Guangzhou. Furthermore, there was a great number of natural green spaces encroaching upon these cities due to the fast urbanization process and the continuous increase in impervious surfaces. In particular, such areas had not yet formed a comprehensive infrastructure system, which cannot effectively manage surface runoff during extreme stormwater event, leading to the occurrence of urban flooding.

3.3. Dominant Risk Attributes Analysis

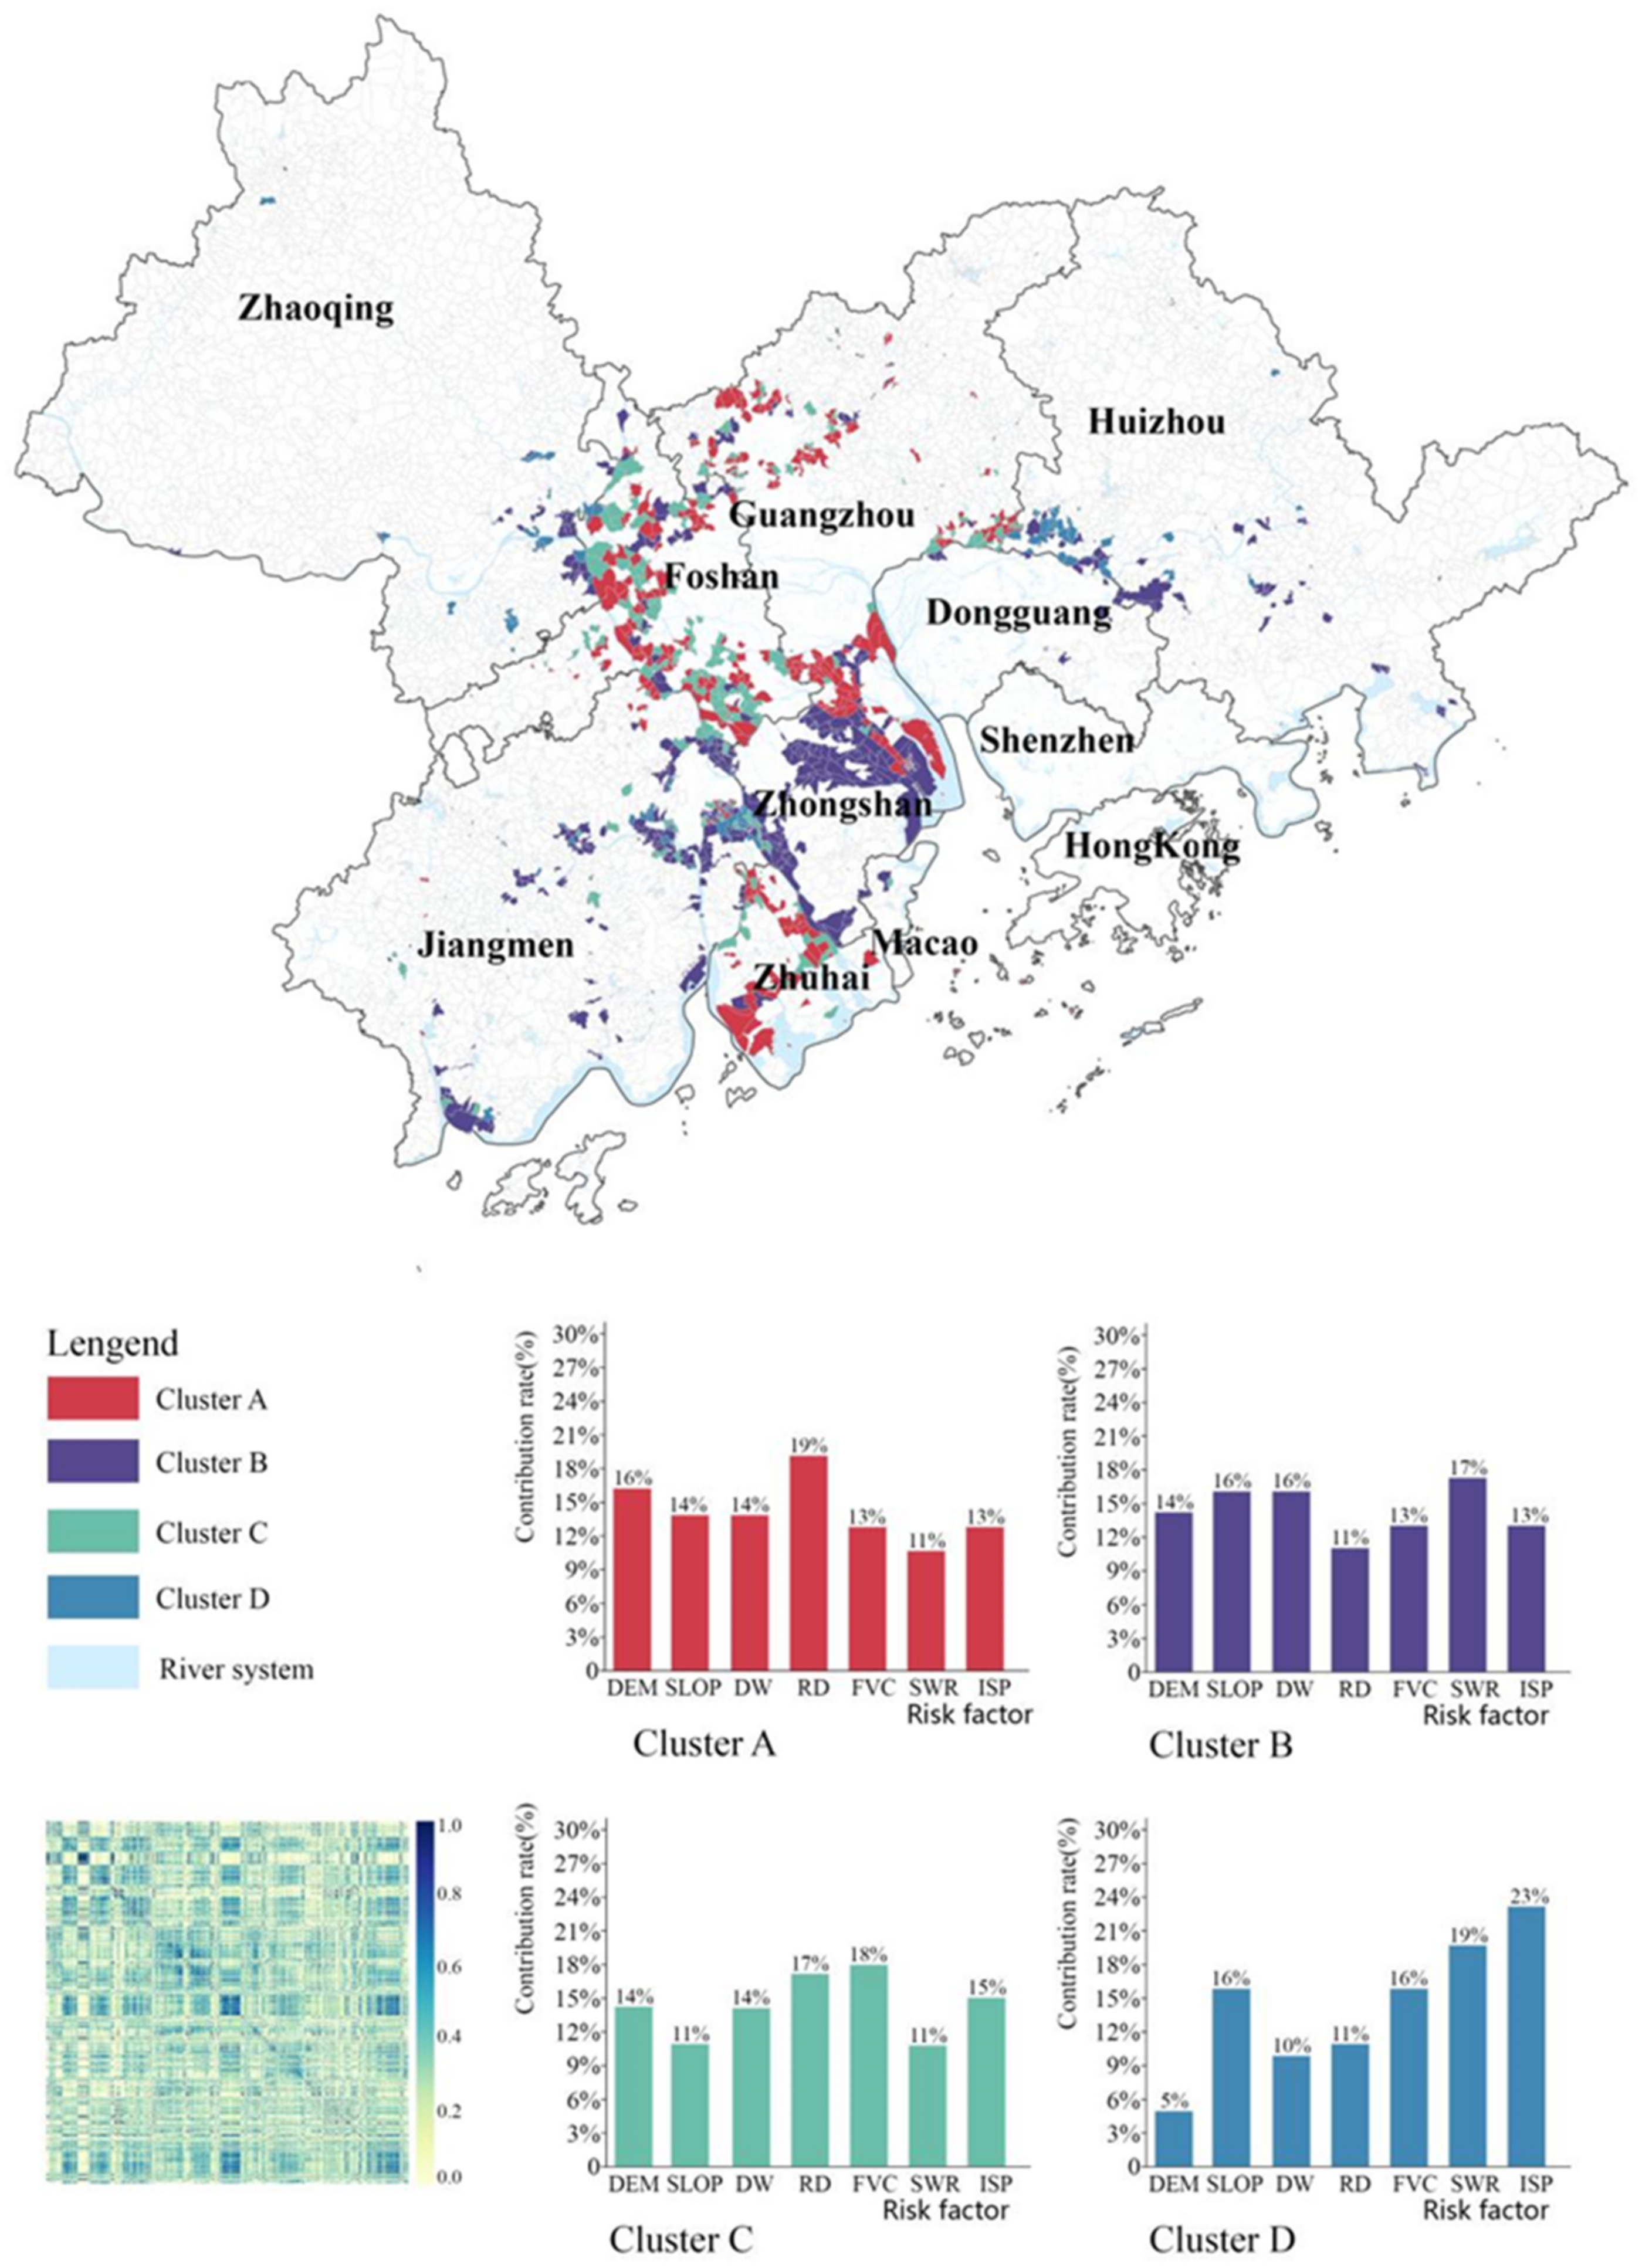
Figure 5 shows the spatial distribution of flood risk and the contribution of driving factors in the rural-urban fringe. Through modular analysis, the villages in the rural-urban fringe with flooding risks were divided into four clusters, and the villages in each cluster had similar urban flooding risk attributes. Cluster A was distributed around the built-up area. Cluster B was mainly centered on the lower reaches of the Pearl River and Xijiang River. Cluster C was mainly distributed in the central area of Foshan, with great construction land represented by village collective industrial parks. Cluster D was mainly located in the area around the industrial zone bordering Huizhou and Dongguan. However, the classification result indicated that the contribution extent of seven driving factors in the four groups was relatively balanced. Therefore, it is necessary to further construct the analysis for network topology of each group to identify the contribution of each driving factor.
Through further analysis of the network topology structure, the 4 clusters were divided into 15 sub-clusters (Figures S1–S4). Among which, 12 were multi-factor-driven and 3 were single-factor-driven (Table 4).

3.3.1. Multi-Factor-Driven Cluster

Clusters A-2 and C-1, driven by RD, FVC, and ISP, were located in Foshan where the rural industrial parks constituted a large amount of ecological spaces and the infrastructure was relatively backward, which made the areas vulnerable to urban flooding during extreme storm events. As a result, the rural regions with sufficient space were able to plan and construct green infrastructure for alleviating the risk of urban flooding. Green infrastructure (i.e., LID) can effectively reduce surface runoff [59].
DEM, SLOP, and DW were the dominant driving factors in Clusters A-3 and B-2. The main areas of clusters A-3 and B-2 were located in the Pearl River estuary, which had a mild topography and a complex network of waterways. Rainstorms can cause flood disasters and large-scale economic losses in this area due to its mild topography and downstream location of the Pearl River system. Thus, adaptive measures, such as constructing drainage and flooding engineering systems, repairing damaged facilities, and updating the infrastructure with inadequate drainage capacity, should be suggested.
Clusters B-1 and D-1 were dominated by RD and ISP. RD contributed 33% of contribution rates for urban flooding risks in both clusters, while ISP contributed 61% of contribution rates in Cluster D-1, far outweighing Cluster B-1 (36%). The reason for this discrepancy was that Cluster D-1 was mainly located in the industrial district, with a larger proportion of impermeable surfaces compared to Cluster B-1, which may increase surface runoff and cause urban flooding [56]. Therefore, the adaptive measures for alleviating flooding risks should be mainly focused on the transformation of industrial areas to reduce the impervious surface and increase green space through ecological design and implementation.
Clusters B-3 and C-3 were driven by DEM and SLOP. The contribution rates of DEM to the two clusters were similar, 25% and 27%, respectively. However, the contribution of SLOP to Cluster B-3 (52%) was much greater than Cluster C-3 (27%). Cluster B-3 was mainly located in the Tonghu Wetland in Huizhou, Nansha Wetland, and Xinhui Yinhu Bay wetland, which are surrounded by mountains with complex topography. Runoff is more likely to be retained in wetland areas with mild topography. By contrast, Cluster C-3 was characterized as a riverbank area. Furthermore, the slope would have a greater impact on Cluster B-3. The main reason for urban flooding in Cluster B-3 was that stormwater runoff from the surrounding mountains was likely to accumulate on the site. In order to reduce the impact of urban flooding, drainage facilities and early warning systems should be constructed and monitored. Low altitude combined with mild topography results in flooding in Cluster C-3, especially due to river backfilling. As such, increasing the construction of flood levees at riverbank can prevent river backfilling, thereby reducing the occurrence of urban flooding.
Cluster B-4, which was located primarily in sandy areas along rivers or coasts, such as tidal flats, was driven by DEM and SWR. Cluster D-2 was mainly situated in rural areas, mixed with industrial and residential areas. Encroached by industrial areas, vegetation coverage was reduced, while the percentage of impervious surfaces was increased. Therefore, future planning should be implemented to reduce surface runoff by controlling the size of industry areas and increasing low-impact development practices [60]. In addition, located near fish ponds, Clusters C-4 and D-4 were primarily driven by DW, FVC, and SWR. Overflowing rivers caused flood disasters; thus, strengthened strategies, such as water-body conservation, flood risk monitoring, and early warning, should be formulated.

3.3.2. Single-Factor-Driven Cluster

Clusters A-1, C-2, and D-3 were single-factor-driven clusters. Cluster A-1 was primarily located around a major transportation hub (i.e., Guangzhou Baiyun International Airport) with numerous complicated connecting roads. Therefore, the occurrence of urban flooding can be reduced by increasing the construction of drainage infrastructure. By contrast, Cluster C-2 was a well-developed rural settlement. Cluster D-3 was mainly distributed at the foot of Luofu Mountain with mild terrain. The flood risk was mainly driven by SLOP in Cluster D-3. However, it is nearly impossible to change the terrain on a large scale. Therefore, it is necessary to increase the construction of drainage facilities and flooding monitoring as well as early warning of flood risk.

4. Conclusions

In order to predict flood risk scientifically and effectively, adaptive measures should be taken according to different risk conditions to effectively reduce the occurrence of flood disasters. In the present study, a comprehensive framework was explored for the comprehensive analysis of urban flooding risk distribution and risk-driving factors, using the integrated WNB model and CNM. This framework can be used to estimate flood risk probability in data-poor regions, generate flood hazard risk maps, and analyze the relationship between flood risk and its driving factors. In the case study areas of the rural-urban fringe in the GBA, the findings indicated that (1) the rural-urban fringe in the GBA is at serious risk of urban flooding: there were 3106.4 hm2 with high risk, accounting for 25.7% of the total area of the investigated rural-urban fringe; (2) the higher conditional probability of inundation was primarily observed in locations with low values for DEM, SLOP, and FVC and high values for ISP; (3) most flooding risks were mainly associated with multi-factor-driven clusters on the rural-urban fringe. In terms of multi-factor-driven clusters, there were essentially two classifications, i.e., artificial-factor-driven (such as RD, FVC, and ISP) and topographic-factor-driven (such as DEM, SLOP, and DW). The areas with single-factor-driven were predominated by SLOP and RD, respectively. According to the findings of the assessment, which clearly show the likelihood of flooding disasters in various regions and their drivers, territorial planning can adopt targeted and differentiated measures to implement flood disaster risk adaptation planning. However, certain limitations existed, such as the reliance on accurate and reliable input data. The accuracy of the model was directly proportional to the accuracy of the input data. Acceptable deviations in the output accuracy of WNB indicated that the framework was feasible and could produce reliable assessments of urban flooding.

Supplementary Materials

The following supporting information can be downloaded at: https://www.mdpi.com/article/10.3390/su15075740/s1. Table S1: A comparison of the proposed urban flooding risk assessment in the rural-urban fringe based on a Bayesian Classifier with other state-of-the-art studies recently published in the domain. Figure S1: The spatial distribution of flood risk and contribution of driven factors in Cluster A. Figure S2: The spatial distribution of flood risk and contribution of driven factors in Cluster B. Figure S3: The spatial distribution of flood risk and contribution of driven factors in Cluster C. Figure S4: The spatial distribution of flood risk and contribution of driven factors in Cluster D. References [22,23,24,25,27,28,31,32] are mentioned in Supplementary file.

Author Contributions

Conceptualization, M.W. and J.L.; methodology, M.W., X.F., J.L. and S.K.T.; software, X.F., F.C., J.S. and S.Z.; validation, D.Z., J.S. and S.Z.; formal analysis, X.F.; investigation, X.F. and F.C.; resources, J.L.; data curation, X.F. and F.C.; writing—original draft preparation, M.W. and X.F.; visualization, X.F. and Y.Z.; supervision, M.W., D.Z., J.L. and S.K.T. All authors have read and agreed to the published version of the manuscript.

Funding

This research was funded by the Natural Science Foundation of Guangdong Province, China [grant number 2023A1515030158] and Science and Technology Program of Guangzhou, China [grant number 202201010431].

Institutional Review Board Statement

Not applicable.

Informed Consent Statement

The study did not involve humans.

Data Availability Statement

The study did not report any publicly archived datasets.

Conflicts of Interest

Authors declare neither conflict of interest nor competing interest.

References

  1. Stefanidis, S.; Stathis, D. Assessment of flood hazard based on natural and anthropogenic factors using analytic hierarchy process (AHP). Nat. Hazards 2013, 68, 569–585. [Google Scholar] [CrossRef]
  2. Zheng, F.F.; Westra, S.; Leonard, M.; Sisson, S.A. Modeling dependence between extreme rainfall and storm surge to estimate coastal flooding risk. Water Resour. Res. 2014, 50, 2050–2071. [Google Scholar] [CrossRef]
  3. Wang, M.; Jiang, Z.Y.; Zhang, D.Q.; Zhang, Y.; Liu, M.; Rao, Q.Y.; Li, J.J.; Tan, S.K. Optimization of integrating life cycle cost and systematic resilience for grey-green stormwater infrastructure. Sustain. Cities Soc. 2023, 90, 104379. [Google Scholar] [CrossRef]
  4. Wang, M.; Liu, M.; Zhang, D.; Qi, J.; Fu, W.; Zhang, Y.; Rao, Q.; Bakhshipour, A.; Tan, S.K. Assessing and Optimizing the Hydrological Performance of Grey-Green Infrastructure Systems in Response to Climate Change and Non-Stationary Time Series. Water Res. 2023, 232, 119720. [Google Scholar] [CrossRef] [PubMed]
  5. Zhang, W.; Villarini, G.; Vecchi, G.A.; Smith, J.A. Urbanization exacerbated the rainfall and flooding caused by hurricane Harvey in Houston. Nature 2018, 563, 384–388. [Google Scholar] [CrossRef]
  6. Nafchi, R.F.; Yaghoobi, P.; Vanani, H.R.; Ostad-Ali-Askari, K.; Nouri, J.; Maghsoudlou, B. Eco-hydrologic stability zonation of dams and power plants using the combined models of SMCE and CEQUALW2. Appl. Water Sci. 2021, 11, 109. [Google Scholar] [CrossRef]
  7. Wang, M.; Liu, M.; Zhang, D.Q.; Zhang, Y.; Su, J.; Zhou, S.Q.; Bakhshipour, A.E.; Tan, S.K. Assessing hydrological performance for optimized integrated grey-green infrastructure in response to climate change based on shared socio-economic pathways. Sustain. Cities Soc. 2023, 91, 104436. [Google Scholar] [CrossRef]
  8. Zhang, Y.; Wang, M.; Zhang, D.Q.; Lu, Z.M.; Bakhshipour, A.E.; Liu, M.; Jiang, Z.Y.; Li, J.J.; Tan, S.K. Multi-stage planning of LID-GREI urban drainage systems in response to land-use changes. Sci. Total Environ. 2023, 859, 160214. [Google Scholar] [CrossRef]
  9. Hong, H.Y.; Tsangaratos, P.; Ilia, I.; Liu, J.Z.; Zhu, A.X.; Chen, W. Application of fuzzy weight of evidence and data mining techniques in construction of flood susceptibility map of Poyang County, China. Sci. Total Environ. 2018, 625, 575–588. [Google Scholar] [CrossRef]
  10. Nafchi, R.F.; Samadi-Boroujeni, H.; Vanani, H.R.; Ostad-Ali-Askari, K.; Brojeni, M.K. Laboratory investigation on erosion threshold shear stress of cohesive sediment in Karkheh Dam. Environ. Earth Sci. 2021, 80, 681. [Google Scholar] [CrossRef]
  11. Rossman, L.A. Storm Water Management Model User’s Manual, Version 5.0; National Risk Management Research Laboratory, Office of Research and Development, US Environmental Protection Agency: Washington, DC, USA, 2010. [Google Scholar]
  12. Shayannejad, M.; Ghobadi, M.; Ostad-Ali-Askari, K. Modeling of Surface Flow and Infiltration During Surface Irrigation Advance Based on Numerical Solution of Saint-Venant Equations Using Preissmann’s Scheme. Pure Appl. Geophys. 2022, 179, 1103–1113. [Google Scholar] [CrossRef]
  13. Salvadore, E.; Bronders, J.; Batelaan, O. Hydrological modelling of urbanized catchments: A review and future directions. J. Hydrol. 2015, 529, 62–81. [Google Scholar] [CrossRef]
  14. Chen, A.S.; Evans, B.; Djordjevic, S.; Savic, D.A. Multi-layered coarse grid modelling in 2D urban flood simulations. J. Hydrol. 2012, 470, 1–11. [Google Scholar] [CrossRef] [Green Version]
  15. Kourtis, I.M.; Tsihrintzis, V.A. Adaptation of urban drainage networks to climate change: A review. Sci. Total Environ. 2021, 771, 145431. [Google Scholar] [CrossRef]
  16. Zhou, S.Q.; Liu, Z.Y.; Wang, M.; Gan, W.; Zhao, Z.C.; Wu, Z.Q. Impacts of building configurations on urban stormwater management at a block scale using XGBoost. Sustain. Cities Soc. 2022, 87, 104235. [Google Scholar] [CrossRef]
  17. Ghosh, S.; Das, A. Wetland conversion risk assessment of East Kolkata Wetland: A Ramsar site using random forest and support vector machine model. J. Clean. Prod. 2020, 275, 123475. [Google Scholar] [CrossRef]
  18. Islam, A.M.T.; Talukdar, S.; Mahato, S.; Kundu, S.; Eibek, K.U.; Pham, Q.B.; Kuriqi, A.; Linh, N.T.T. Flood susceptibility modelling using advanced ensemble machine learning models. Geosci. Front. 2021, 12, 101075. [Google Scholar] [CrossRef]
  19. Seleem, O.; Ayzel, G.; de Souza, A.C.T.; Bronstert, A.; Heistermann, M. Towards urban flood susceptibility mapping using data-driven models in Berlin, Germany. Geomat. Nat. Hazards Risk 2022, 13, 1640–1662. [Google Scholar] [CrossRef]
  20. Ostad-Ali-Askari, K.; Shayannejad, M.; Ghorbanizadeh-Kharazi, H. Artificial neural network for modeling nitrate pollution of groundwater in marginal area of Zayandeh-rood River, Isfahan, Iran. KSCE J. Civ. Eng. 2017, 21, 134–140. [Google Scholar] [CrossRef]
  21. Rahmati, O.; Darabi, H.; Panahi, M.; Kalantari, Z.; Naghibi, S.A.; Ferreira, C.S.S.; Kornejady, A.; Karimidastenaei, Z.; Mohammadi, F.; Stefanidis, S.; et al. Development of novel hybridized models for urban flood susceptibility mapping. Sci. Rep. 2020, 10, 12937. [Google Scholar] [CrossRef]
  22. Tang, X.Z.; Li, J.F.; Liu, M.N.; Liu, W.; Hong, H.Y. Flood susceptibility assessment based on a novel random Naive Bayes method: A comparison between different factor discretization methods. Catena 2020, 190, 104536. [Google Scholar] [CrossRef]
  23. Jager, W.S.; Christie, E.K.; Hanea, A.M.; den Heijer, C.; Spencer, T. A Bayesian network approach for coastal risk analysis and decision making. Coast. Eng. 2018, 134, 48–61. [Google Scholar] [CrossRef] [Green Version]
  24. Wang, H.F.; Zhao, Y.J.; Zhou, Y.H.; Wang, H.L. Prediction of urban water accumulation points and water accumulation process based on machine learning. Earth Sci. Inform. 2021, 14, 2329. [Google Scholar] [CrossRef]
  25. Huang, S.Q.; Wang, H.M.; Xu, Y.J.; She, J.W.; Huang, J. Key Disaster-Causing Factors Chains on Urban Flood Risk Based on Bayesian Network. Land 2021, 10, 210. [Google Scholar] [CrossRef]
  26. Naghibi, S.A.; Moghaddam, D.D.; Kalantar, B.; Pradhan, B.; Kisi, O. A comparative assessment of GIS-based data mining models and a novel ensemble model in groundwater well potential mapping. J. Hydrol. 2017, 548, 471–483. [Google Scholar] [CrossRef]
  27. Tang, X.Z.; Shu, Y.Q.; Liu, W.; Li, J.F.; Liu, M.N.; Yu, H.F. An Optimized Weighted Naive Bayes Method for Flood Risk Assessment. Risk Anal. 2021, 41, 2301–2321. [Google Scholar] [CrossRef]
  28. Xiao, Y.; Li, B.Q.; Gong, Z.W. Real-time identification of urban rainstorm waterlogging disasters based on Weibo big data. Nat. Hazards 2018, 94, 833–842. [Google Scholar] [CrossRef]
  29. Liu, R.; Chen, Y.; Wu, J.P.; Gao, L.; Barrett, D.; Xu, T.B.; Li, L.Y.; Huang, C.; Yu, J. Assessing spatial likelihood of flooding hazard using naïve Bayes and GIS: A case study in Bowen Basin, Australia. Stoch. Environ. Res. Risk Assess. 2016, 30, 1575–1590. [Google Scholar] [CrossRef]
  30. Jin, F.F.; Pei, L.D.; Chen, H.Y.; Zhou, L.G. Interval-valued intuitionistic fuzzy continuous weighted entropy and its application to multi-criteria fuzzy group decision making. Knowl. Based Syst. 2014, 59, 132–141. [Google Scholar] [CrossRef]
  31. Liu, R.; Chen, Y.; Wu, J.P.; Gao, L.; Barrett, D.; Xu, T.B.; Li, X.J.; Li, L.Y.; Huang, C.; Yu, J. Integrating Entropy-Based Naive Bayes and GIS for Spatial Evaluation of Flood Hazard. Risk Anal. 2017, 37, 756–773. [Google Scholar] [CrossRef]
  32. Tang, X.Z.; Shu, Y.Q.; Lian, Y.Q.; Zhao, Y.L.; Fu, Y.C. A spatial assessment of urban waterlogging risk based on a Weighted Naive Bayes classifier. Sci. Total Environ. 2018, 630, 264–274. [Google Scholar] [CrossRef] [PubMed]
  33. Lai, C.G.; Chen, X.H.; Chen, X.Y.; Wang, Z.L.; Wu, X.S.; Zhao, S.W. A fuzzy comprehensive evaluation model for flood risk based on the combination weight of game theory. Nat. Hazards 2015, 77, 1243–1259. [Google Scholar] [CrossRef]
  34. Liu, F.; Liu, X.D.; Xu, T.; Yang, G.; Zhao, Y.L. Driving Factors and Risk Assessment of Rainstorm Waterlogging in Urban Agglomeration Areas: A Case Study of the Guangdong-Hong Kong-Macao Greater Bay Area, China. Water 2021, 13, 770. [Google Scholar] [CrossRef]
  35. Kia, M.B.; Pirasteh, S.; Pradhan, B.; Mahmud, A.R.; Sulaiman, W.N.A.; Moradi, A. An artificial neural network model for flood simulation using GIS: Johor River Basin, Malaysia. Environ. Earth Sci. 2012, 67, 251–264. [Google Scholar] [CrossRef]
  36. Hidalgo, C.A.; Klinger, B.; Barabasi, A.L.; Hausmann, R. The product space conditions the development of nations. Science 2007, 317, 482–487. [Google Scholar] [CrossRef] [Green Version]
  37. Vespignani, A. Modelling dynamical processes in complex socio-technical systems. Nat. Phys. 2012, 8, 32–39. [Google Scholar] [CrossRef]
  38. Yang, X.L.; Zhou, B.T.; Xu, Y.; Han, Z.Y. CMIP6 Evaluation and Projection of Temperature and Precipitation over China. Adv. Atmos. Sci. 2021, 38, 817–830. [Google Scholar] [CrossRef]
  39. Ellinas, C.; Allan, N.; Durugbo, C.; Johansson, A. How Robust Is Your Project? From Local Failures to Global Catastrophes: A Complex Networks Approach to Project Systemic Risk. PLoS ONE 2015, 10, e0142469. [Google Scholar] [CrossRef] [Green Version]
  40. Yu, T.; Shen, G.Q.P.; Shi, Q.; Lai, X.D.; Li, C.Z.D.; Xu, K.X. Managing social risks at the housing demolition stage of urban redevelopment projects: A stakeholder-oriented study using social network analysis. Int. J. Proj. Manag. 2017, 35, 925–941. [Google Scholar] [CrossRef]
  41. Di Nardo, A.; Di Natale, M.; Giudicianni, C.; Greco, R.; Santonastaso, G.F. Complex network and fractal theory for the assessment of water distribution network resilience to pipe failures. Water Sci. Technol. Water Supply 2018, 18, 767–777. [Google Scholar] [CrossRef]
  42. Giustolisi, O.; Ridolfi, L.; Simone, A. Tailoring Centrality Metrics for Water Distribution Networks. Water Resour. Res. 2019, 55, 2348–2369. [Google Scholar] [CrossRef]
  43. Giudicianni, C.; Herrera, M.; Di Nardo, A.; Greco, R.; Creaco, E.; Scala, A. Topological Placement of Quality Sensors in Water-Distribution Networks without the Recourse to Hydraulic Modeling. J. Water Resour. Plan. Manag. 2020, 146, 04020030. [Google Scholar] [CrossRef]
  44. Sitzenfrei, R.; Wang, Q.; Kapelan, Z.; Savic, D. Using Complex Network Analysis for Optimization of Water Distribution Networks. Water Resour. Res. 2020, 56, e2020WR027929. [Google Scholar] [CrossRef]
  45. Wang, Y.J.; Han, Z.Y.; Gao, R. Changes of extreme high temperature and heavy precipitation in the Guangdong-Hong Kong-Macao Greater Bay Area. Geomat. Nat. Hazards Risk 2021, 12, 1101–1126. [Google Scholar] [CrossRef]
  46. Wu, X.D.; Kumar, V.; Quinlan, J.R.; Ghosh, J.; Yang, Q.; Motoda, H.; McLachlan, G.J.; Ng, A.; Liu, B.; Yu, P.S.; et al. Top 10 algorithms in data mining. Knowl. Inf. Syst. 2008, 14, 1–37. [Google Scholar] [CrossRef] [Green Version]
  47. Zhang, L.L.; She, J.Y.; Li, R.; Chen, D.Y. Study on demarcation of urban-rural fringe based on gravity model. J. Cent. South Univ. For. Technol. 2017, 37, 99–104. [Google Scholar]
  48. Khosravi, K.; Shahabi, H.; Pham, B.T.; Adamowski, J.; Shirzadi, A.; Pradhan, B.; Dou, J.; Ly, H.B.; Grof, G.; Ho, H.L.; et al. A comparative assessment of flood susceptibility modeling using Multi-Criteria Decision-Making Analysis and Machine Learning Methods. J. Hydrol. 2019, 573, 311–323. [Google Scholar] [CrossRef]
  49. Zhang, X.; Liu, L.Y.; Wu, C.S.; Chen, X.D.; Gao, Y.; Xie, S.; Zhang, B. Development of a global 30 m impervious surface map using multisource and multitemporal remote sensing datasets with the Google Earth Engine platform. Earth Syst. Sci. Data 2020, 12, 1625–1648. [Google Scholar] [CrossRef]
  50. Zeng, J.J.; Huang, G.R. Set pair analysis for karst waterlogging risk assessment based on AHP and entropy weight. Hydrol. Res. 2018, 49, 1143–1155. [Google Scholar] [CrossRef]
  51. Newman, M.E.J. Fast algorithm for detecting community structure in networks. Phys. Rev. E 2004, 69, 066133. [Google Scholar] [CrossRef] [Green Version]
  52. Tehrany, M.S.; Pradhan, B.; Mansor, S.; Ahmad, N. Flood susceptibility assessment using GIS-based support vector machine model with different kernel types. Catena 2015, 125, 91–101. [Google Scholar] [CrossRef]
  53. Bui, D.T.; Khosravi, K.; Shahabi, H.; Daggupati, P.; Adamowski, J.F.; Melesse, A.M.; Pham, B.T.; Pourghasemi, H.R.; Mahmoudi, M.; Bahrami, S.; et al. Flood Spatial Modeling in Northern Iran Using Remote Sensing and GIS: A Comparison between Evidential Belief Functions and Its Ensemble with a Multivariate Logistic Regression Model. Remote Sens. 2019, 11, 1589. [Google Scholar] [CrossRef] [Green Version]
  54. Tang, X.Z.; Hong, H.Y.; Shu, Y.Q.; Tang, H.J.; Li, J.F.; Liu, W. Urban waterlogging susceptibility assessment based on a PSO-SVM method using a novel repeatedly random sampling idea to select negative samples. J. Hydrol. 2019, 576, 583–595. [Google Scholar] [CrossRef]
  55. Fang, Z.C.; Wang, Y.; Peng, L.; Hong, H.Y. Predicting flood susceptibility using LSTM neural networks. J. Hydrol. 2021, 594, 125734. [Google Scholar] [CrossRef]
  56. Zhang, B.; Xie, G.D.; Li, N.; Wang, S. Effect of urban green space changes on the role of rainwater runoff reduction in Beijing, China. Landsc. Urban Plann. 2015, 140, 8–16. [Google Scholar] [CrossRef]
  57. Guo, A.D.; Yang, J.; Xiao, X.M.; Xia, J.H.; Jin, C.; Li, X.M. Influences of urban spatial form on urban heat island effects at the community level in China. Sustain. Cities Soc. 2020, 53, 101972. [Google Scholar] [CrossRef]
  58. Huong, H.T.L.; Pathirana, A. Urbanization and climate change impacts on future urban flooding in Can Tho city, Vietnam. Hydrol. Earth Syst. Sci. 2013, 17, 379–394. [Google Scholar] [CrossRef] [Green Version]
  59. Wang, M.; Zhang, Y.; Bakhshipour, A.E.; Liu, M.; Rao, Q.Y.; Lu, Z.M. Designing coupled LID-GREI urban drainage systems: Resilience assessment and decision-making framework. Sci. Total Environ. 2022, 834, 155267. [Google Scholar] [CrossRef]
  60. Wang, M.; Zhang, D.Q.; Su, J.; Dong, J.W.; Tan, S.K. Assessing hydrological effects and performance of low impact development practices based on future scenarios modeling. J. Clean. Prod. 2018, 179, 12–23. [Google Scholar] [CrossRef]
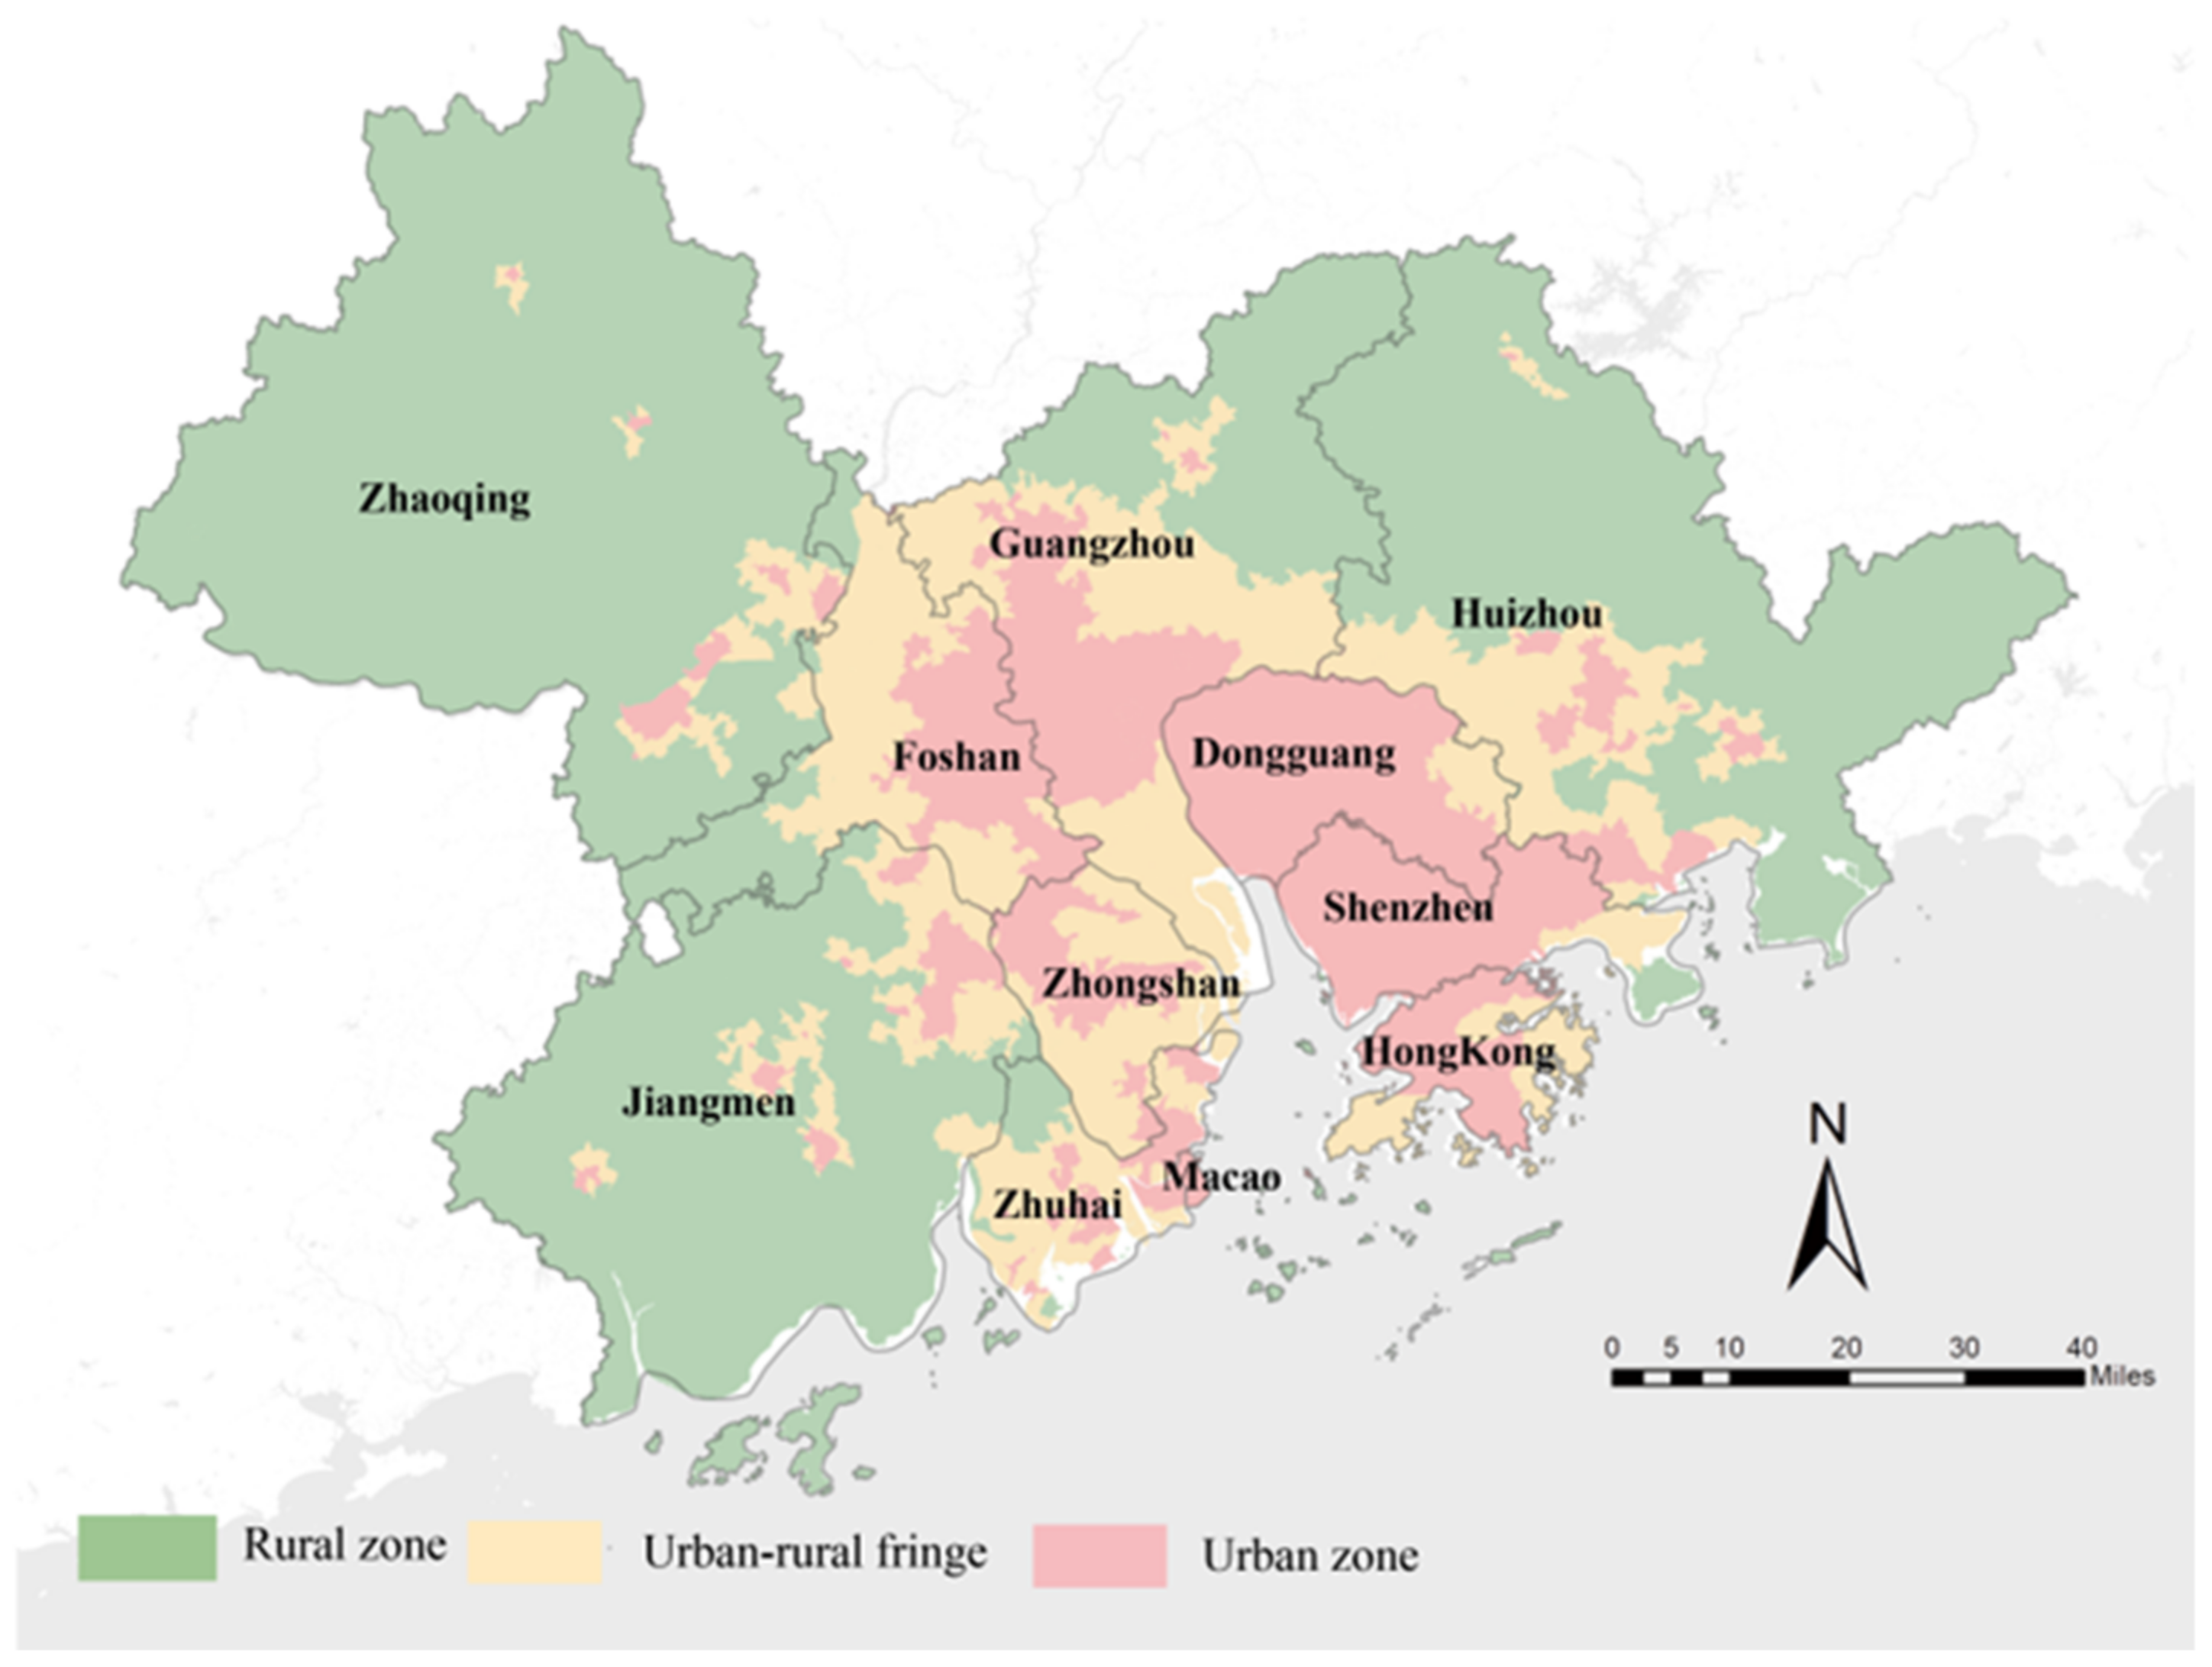
Figure 1. Rural zone, urban-rural fringe, and urban zone in GBA.
Sustainability 15 05740 g001
Figure 2. The spatial distribution of elevation; slope; distance from the waterway; road density; fractional vegetation cover; soil water retention; and impervious surface percentage on GBA.
Sustainability 15 05740 g002
Figure 3. Conditional probability for each risk factor.
Sustainability 15 05740 g003
Figure 4. Spatial distribution of urban flooding risks.
Sustainability 15 05740 g004
Figure 5. Spatial distribution of urban flooding risk and contribution of driving factors in rural-urban fringe in the GBA. Note: DEM, Digital Elevation Model; SLOP, Slope; DW, Distance from the Waterway; RD, Road Density; FVC, Fractional Vegetation Cover; SWR, Soil Water Retention; ISP, Impervious Surface Percentage.
Sustainability 15 05740 g005
Table 2. Weights for each factor from the AHP, EW, and linear weighting methods.
MethodDEMSLOPDWRDFVCSWRISP
AHP5.0%5.3%8.6%8.8%28.7%12.7%30.8%
EW0.3%0.3%0.2%6.4%46.9%0.4%45.5%
Linear weighting2.6%2.8%4.4%7.6%37.9%6.6%38.1%
Note: The abbreviations are as follows: AHP, Analytic Hierarchy Process; EW, Entropy Weighting; DEM, Digital Elevation Model; SLOP, Slope; DW, Distance from the Waterway; RD, Road Density; FVC, Fractional Vegetation Cover; SWR, Soil Water Retention; ISP, Impervious Surface Percentage.
Table 3. Risk classification.
ClassLow RiskMedium RiskHigh Risk
Risk range0–23.0%23.0–43.7%>43.7%
Area (hm2)3212.95776.33106.4
Proportion (%)26.6%47.5%25.7%
Table 4. Driving factor analysis.
Multi-Factor-DrivenSingle-Factor-Driven
Artificial FactorTopographic FactorArtificial FactorTopographic Factor
Driving factorRD,
FVC,
ISP
RD,
ISP
SWRDW,
FVC,
SWR
FVC,
ISP
DEM,
SLOP,
DW
DEM,
SLOP
RDSLOP
ClusterA-2,
C-1
B-1,
D-1
B-4C-4,
D-4
D-2A-3,
B-2
B-3,
C-3
A-1,
C-2
D-3
Quantity21425591901644116315820
Note: DEM, Digital Elevation Model; SLOP, Slope; DW, Distance from the Waterway; RD, Road Density; FVC, Fractional Vegetation Cover; SWR, Soil Water Retention; ISP, Impervious Surface Percentage.
Disclaimer/Publisher’s Note: The statements, opinions and data contained in all publications are solely those of the individual author(s) and contributor(s) and not of MDPI and/or the editor(s). MDPI and/or the editor(s) disclaim responsibility for any injury to people or property resulting from any ideas, methods, instructions or products referred to in the content.