Abstract
The unreasonable setting of thermal insulation layer in high cold tunnels not only increases the maintenance cost of tunnels, but also weakens the anti-freezing and cold resistance of the tunnels. In order to optimize the setting of thermal insulation layer in an Alpine tunnel, relying on Dabanshan tunnel in Qinghai Province, three schemes of radial and longitudinal thermal insulation region of thermal insulation layer were adopted, and the temperature field of the surrounding rock was numerically analyzed. The results show that the uneven region scheme of 9 cm-8 cm-7 cm and 10 cm-9 cm-8 cm insulation layer can effectively reduce the freezing area of the lining and the surrounding rock, the freezing region at the tunnel entrance is significantly reduced, and there is no lining freezing region within the depth of 30–750 M. The research results can provide guidance for the partition wall setting of radial and longitudinal insulation layers of Alpine tunnels. In addition, it has considerable economic advantages for the reduction in engineering construction costs.
1. Introduction
Many alpine tunnels are distributed in northwest and northeast China, and some of them have a service life of less than 8 months each year due to structural cracks, water leakage and ice damage (Figure 1). The thermal insulation layer is very important for the freezing prevention of tunnels in cold regions, and its reasonable design can effectively reduce the freezing damage of tunnels [1,2,3].
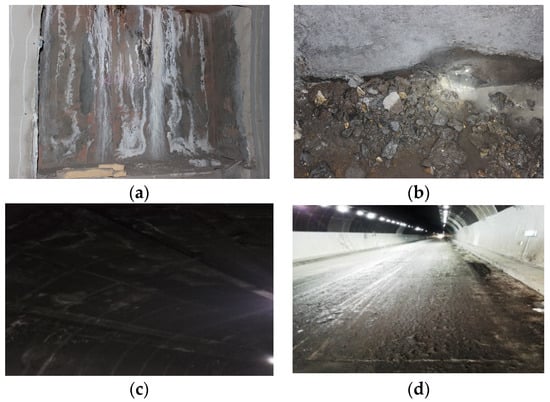
Figure 1.
Freezing damage of tunnels in cold regions. (a): lining icing; (b): side wall icing; (c): vault freezing; (d): road icing.
Previous scholars have conducted field investigations on dozens of tunnels (Qingshashan Tunnel, Lajishan Tunnel, Changlashan Tunnel, Dabanshan Tunnel, Zhaguoshan Tunnel and Hongtu Mountain Tunnel) in Qinghai Province, China. To some extent, these tunnels have suffered different degrees of frost damage, especially at the tunnel entrance [4,5]. Among them, the Osaka Mountain Tunnel was set up with a 5 cm polyurethane thermal insulation layer and double-layer thermal insulation method. In 2009, the disease inspection of the Osaka Mountain Tunnel, which had been put into operation, found that there were 86 water leaks on the side wall and arch crown of the tunnel, and some of the tunnel lining structures were severely frost-heaving. In March 2016, the inspection found that the wall of the tunnel was still frozen in many places, and there were large ice bodies at the entrance of the tunnel that lasted for several months. It was also found that there was an ice layer behind the insulation layer of the lining surface at 575 m from the tunnel entrance, which buried great hidden dangers for the cracking of the lining concrete. However, the insulation layer of these tunnels were arranged with equal thickness, indicating that this method of setting insulation layer cannot effectively reduce the frost damage [6]. A comprehensive understanding of the temperature field in the cold tunnel is very important for the insulation layer. Many scholars have made significant progress in the study of the temperature field in the cold tunnel, including analytical solutions [7,8], numerical simulations [9,10] and experimental research [11,12]. Krarti and Kreider (1996) proposed a computational model of temperature amplitude and average temperature in an underground tunnel [6]. Zhou et al. (2014) used the mathematical optimization model to obtain the design parameters of a uniform insulation layer [13]. Feng et al. (2016) studied the reliability of the 5 cm thick insulation layer in the Yushimolegai tunnel [10]. Prashantk and Singh (2009) applied the superposition principle and the separation variable method to obtain the analytic solution of transient temperature field of circular section at the convective boundary [14]. Based on heat transfer theory, Lai et al. (1999) used the finite element formula to conduct a nonlinear analysis of the temperature field, seepage field and stress field related problems in the cold region tunnel [15].
At present, the research on the setting of thermal insulation layer has been widely carried out in tunnels in cold regions at home and abroad [16,17] to prevent freezing damage of tunnels in cold areas. Lu et al. (2012) improved the drainage system to achieve a good waterproof effect and designed a strip local insulation layer to solve the problem of ice formation in the drainage pipe during cold and warm periods [18]. On the basis of thermal conductivity seepage theory, Xuefu et al. (2007) studied the influence of thermal insulation layer on controlling water leakage in permafrost tunnels by considering the coupling effect of seepage and temperature field, and the three dimensional nonlinear analysis of Kunlun mountain tunnel with and without insulation layer is carried out, respectively [19]. Mie put forward a method for protecting tunnels from frost damage with a thermal insulation layer [20]. Ji et al. (2012) classified the tunnel frost damage, and discussed the causes of the frost damage, especially the causes of the frost damage of the lining structure, and divided the frost damage into two categories: the external frost damage of the lining and the internal frost damage. At the same time, in view of the frequent occurrence of cracks in tunnel lining in cold regions, some measures to prevent cracks were proposed [21]. Liu et al. (2018) carried out model tests under different air temperature and inlet wind speed, and established the radial three domain control equation and the longitudinal parabolic control equation of the freezing front [4]. The accuracy of the equation was verified by comparing the research results with the field measurement results. Cai et al. (2018) established the analytical solution of the single tube freezing temperature field considering the constant soil freezing temperature and freezing tube wall temperature [22]. In seasonally frozen areas, the drainage ditches of highway tunnels are usually set below the maximum frost depth. This has seriously increased the cost, difficulty and time of tunnel construction, and affected the stability of surrounding rock and the safety of tunnel structure. In order to solve these difficulties, Zhou et al. (2022) established a transient heat transfer model including heat conduction and phase transition, taking a tunnel in the northwest as the research object. Then, the influence of different water volumes and thermal insulation technology on the minimum buried depth of central drainage ditch were studied [23]. The anti-freezing effects of the inner insulation layer, the outer insulation layer and the inverted arch were discussed. To facilitate tunnel construction, experts usually set a layout with equal longitudinal thickness or trapezoidal layout and radial thickness of the tunnel. This layout ignores the temperature difference of the tunnel section and does not consider the problem of the uneven radial thickness of the tunnel insulation layer in cold areas. Anti-freezing insulation technology is a systematic project. In the past, the research on insulation layer has always been carried out independently, resulting in the scheme being too conservative and ignoring the influence and internal connection of uneven insulation settings. At present, there are no standards and specifications to follow for the design and construction of anti-freezing insulation layers of tunnels located at high altitude and in cold regions. Tunnel designers can only refer to the layout method of insulation layer of built tunnels with less frost damage. However, the natural conditions in each region are different. After the tunnel is completed, some tunnels still suffer from different degrees of frost damage, which brings great losses to people’s life and property safety.
This study was conducted with the aim of obtaining an economical and effective tunnel insulation scheme that can prevent frost damage. Based on the research of Dabanshan Tunnel in Qinghai Province, the control equations of surrounding rock and air flow in the high and cold tunnel are preliminarily obtained. According to the original design plan of Dabanshan Tunnel, three insulation layer schemes are determined. Finally, a series of numerical simulations are carried out for three insulation layer schemes, and the corresponding surrounding rock temperature and lining temperature are analyzed. The research results can be used to estimate the radial and longitudinal thickness of the insulation layer of the cold tunnel, Regarding sustainable development, a good insulation layer thickness setting can help improve the service life of the tunnel. In terms of tunnel later maintenance, it has the advantages of low cost and low maintenance frequency, meeting the dual carbon environmental protection effect, and has strong guiding significance for safe tunnel construction and reducing tunnel freezing damage. it has strong guiding significance for the safe construction of tunnels and the reduction of freezing damage in tunnels.
2. Heat Transfer Control Equation of High and Cold Tunnel under Wind Flow Field
When studying the temperature field and reasonable cold prevention measures, the surrounding rock geothermal and tunnel clearance ventilation should be considered. The tunnel temperature field is divided into two parts: the surrounding rock temperature field and the tunnel clearance airflow temperature field. Freeze–thaw damage of tunnel surrounding rock occurs every year in cold regions.
Figure 2 shows the frost damage to the inner wall and insulation layer of the on-site tunnel.
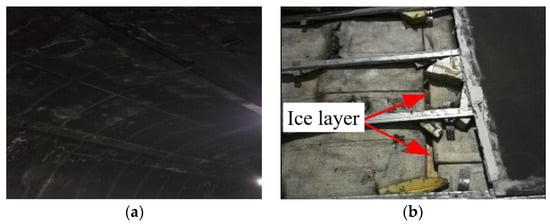
Figure 2.
Site tunnel inner wall icing and insulation layer layout. (a) tunnel wall icing; (b) tunnel insulation layer icing.
Therefore, the problems that are discussed in this paper involve phase change heat transfer, and the following assumptions need to be made:
(a) The air flow in the tunnel is stable and incompressible;
(b) Surrounding rock and gas flow are continuous media;
(c) Air flow must follow the conservation of energy;
(d) The thermophysical parameters of unfrozen and frozen surrounding rocks remain unchanged;
(e) Heat transfer is achieved through heat conduction [9].
Therefore, this problem is a heat transfer problem with phase change. The energy control equations of the transient temperature field with phase change are [24]:
note: f and u represent frozen and unfrozen state, respectively; Cf, Tf and λf are the volume heat capacity, temperature and thermal conductivity of the surrounding rock in the freezing region.
At the frozen front position, S(t) shall meet the conditions of energy conservation and continuity, namely [24]:
note: n, L and Tm are the normal direction, latent heat per unit volume and annual average temperature of the frozen front position, respectively.
At the fixed boundary, the boundary conditions are expressed as follows:
where α is the thermal diffusion coefficient; Ta represents the equilibrium temperature without convection.
The initial condition is:
note: T0 is the initial temperature of surrounding rock.
Using the sensible heat capacity method [4], it is assumed that the phase change occurs within a certain temperature range (Tm ± ∆T). When constructing the equivalent heat capacity, the influence of the interval temperature should be included. The following heat capacity and thermal conductivity equations can be assumed [25]:
Using Equations (3)–(8), Equations (1) and (2) are abbreviated as:
According to the monitoring data, the sine function is used to fit the airflow temperature curve in the high-cold tunnel. The airflow temperature function is as follows [26]:
Convert Equation (10) to the following form:
where z is the longitudinal distance along the tunnel;
Tv represents temperature amplitude;
d0 is a constant;
() indicates the period of temperature change.
If the radius around the tunnel is not uniform, it is difficult to study the freezing theory, including the heat conduction and heat convection between the surrounding rock and the air flow. In addition, the theory of tube freezing has matured in cold regions. Therefore, for convenience, the section shape of the tunnel is simplified to a circle, and the longitudinal heat transfer model of the tunnel is shown in Figure 3.
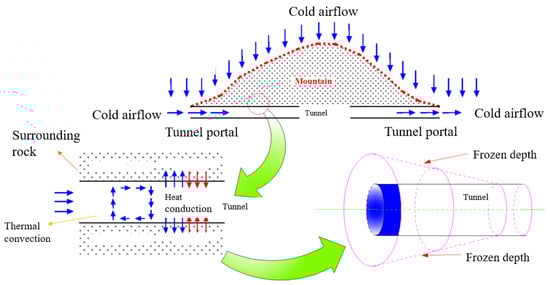
Figure 3.
Longitudinal heat transfer model of tunnel.
The energy conservation equation of air flow in the tunnel is as follows:
where Ca is the heat capacity of the air flow in the tunnel;
A is the tunnel section area;
la is the arc length of the section in the tunnel;
hf is the thermal convection coefficient between surrounding rock and air flow.
From the monitoring data of Dabanshan Tunnel, it can be seen that the wind speed has an exponential relationship with the longitudinal distance of the tunnel. Therefore, we introduce a new equation, which can be obtained from the following equation:
where g is the longitudinal distance along the tunnel; av and bv are coefficients of the equation.
Therefore, Equation (11) can be simplified as follows:
Take Formulae (2) and (3) into Formula (5) to obtain the following expression:
where a, ks and l are equivalent radius, thermal conductivity and radius affected by the surrounding rock temperature field.
From Tm = Tm0, Z = 0, we can obtain:
where Tm0 is the initial annual average temperature.
Rl is the freezing depth outside the tunnel.
According to the boundary condition (Tv = Tv0, z = 0), the temperature amplitude Tv can be derived as follows:
where Tv0 is the initial temperature amplitude.
Therefore, the longitudinal temperature field adopts the following formula.
The thermal conductivity and specific heat of surrounding rock vary with temperature. In addition, the freeze–thaw interface is also moving.
Therefore, the energy conservation condition at the boundary is nonlinear. The nonlinearity of this problem is very strong, and it is difficult to obtain the analytical solution. Therefore, numerical solutions can be obtained using numerical methods. In this paper, the Galerkin method can be used to obtain the finite element equation of the problem, as shown below [27]:
where Ni and Nja are the shape functions of the element.
3. Establishment of a Numerical Model
3.1. Introduction to Dabanshan Tunnel
Dabanshan Tunnel is an important part of the Xining–Xizang Highway. The freezing period is about 228 days, the average freezing depth is about 3–4.5 m, and the winter temperature is as low as −25.6 °C. The altitude is about 3792.75 m.
The Osaka Mountain Tunnel has an altitude of 3792.75 m, an annual average temperature of −3.4 °C, an average temperature of −15.2 °C in January, an average temperature of 7 °C in July, an average annual maximum temperature of 15.8 °C, an average annual minimum temperature of −25.6 °C, an extreme maximum temperature of 22.5 °C, and an extreme minimum temperature of −34 °C. Figure 4 shows the geographical and geomorphic conditions around the Daban Mountain Tunnel.
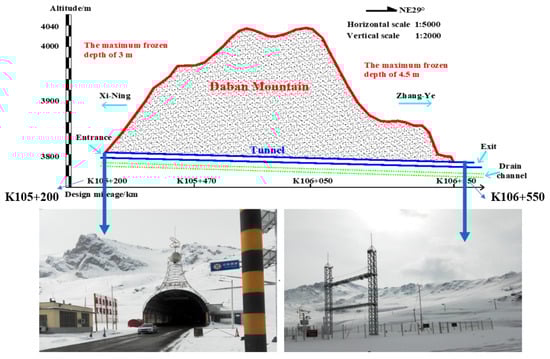
Figure 4.
Geomorphic conditions around Daban Mountain Tunnel.
3.2. Calculation Model
Considering the difference of the influence of ventilation conditions on the temperature field of the deep surrounding rock of the tunnel and the calculation range of the frozen soil layer of the tunnel site, the three-dimensional model is adopted in the simulation calculation stage to ensure the accuracy of the calculation results.
Using the finite element software ANSYS, the three-dimensional numerical simulation calculation of the temperature of the tunnel lining and surrounding rock structure system under the open system is carried out with the insulation layer, lining and surrounding rock system of the 3 m tunnel model as the object.
Due to the large number of model elements and the large amount of calculation, in order to simplify the calculation, the following assumptions are made in the calculation process:
(1) The thermophysical parameters of the material (thermal conductivity, specific heat capacity, surface heat transfer coefficient, convective heat transfer coefficient, etc.) do not change with the temperature and are constant.
(2) It is assumed that the surrounding rock, lining, concrete and thermal insulation materials of the tunnel are homogeneous and isotropic.
(3) In order to simplify the calculation, it is assumed that the original ground temperature of the formation will remain unchanged along the depth direction after reaching a certain depth.
The calculation range of the whole model is determined as shown in Figure 5, and its unit division and calculation section are shown in Figure 6.
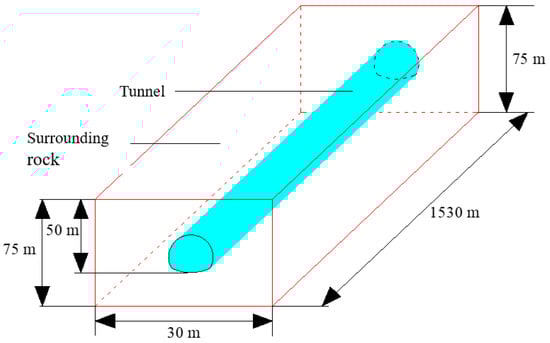
Figure 5.
Calculation range of model tunnel.
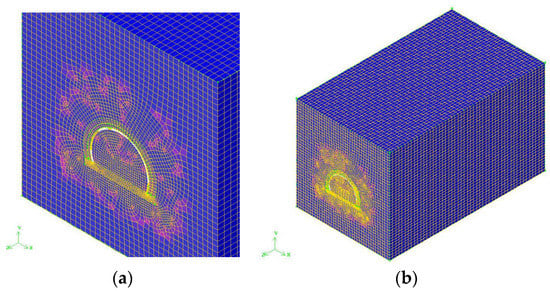
Figure 6.
Grid division of calculation model: (a) part; (b) whole.
3.3. Model Boundary Conditions and Parameters
The inner diameter of the Dabanshan tunnel on site is 4.54 m. To facilitate numerical calculation, the inner diameter of the Dabanshan tunnel numerical model is simplified to 4.5 m, and the convective heat transfer coefficient between surrounding rock and air flow is hf = h = 15.0 W/(m °C).
The phase change volume latent heat ρL = 46.44 × 10⁶ J/m3. The initial temperature of the surrounding rock, lining and insulation is 5 °C. The inlet of the model cylinder is air boundary, the outlet of the air duct is the outlet pressure boundary. The tunnel wall is a convective heat transfer boundary, and the air temperature at the tunnel inlet and outlet is −10.6 °C. Table 1 shows the thermodynamic parameters of the calculation model. According to the on-site monitoring data, the average wind speed at the inlet and outlet is 4.2 m/s. The wind speed in the tunnel decreases exponentially with the increase in depth, and finally tends to be stable in the tunnel. Table 1 shows the detailed thermal parameters of the calculation model. The operation time of the temperature calculated by the numerical model is 5 years, and the calculation results are based on December 31 of the fourth year.

Table 1.
Thermal parameters of the calculation model.
According to the temperature monitoring data, the inlet and outlet temperature functions are as follows:
According to the field data, there are two abrupt points of longitudinal freezing depth along the tunnel (150–200 m entrance and 450–500 m entrance). The 5 cm insulation layer used in Dabanshan Tunnel cannot prevent frost damage. Therefore, the insulation layer section points are set at 200, 500, 1000 and 1300 m from the tunnel entrance (Table 2). The setting of longitudinal and radial insulation layers is uneven, as shown in Figure 7. See Figure 8 for the thickness of the longitudinal insulation layer in each area.
Table 2.
Longitudinal insulation scheme.
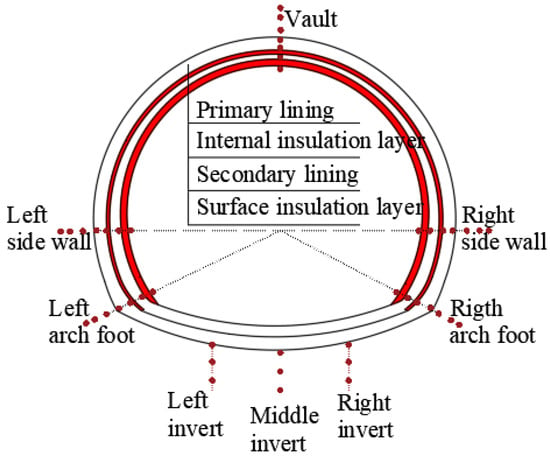
Figure 7.
Setting of the radial insulation layer.
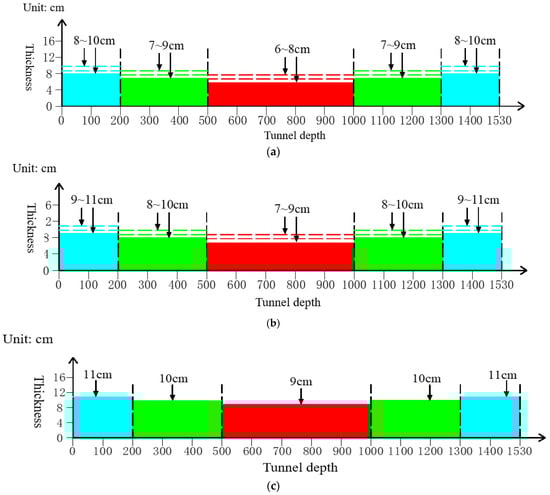
Figure 8.
Setting range of longitudinal insulation thickness: (a) region I; (b) region II; (c) footing extension area.
4. Result Analysis
Due to the long longitudinal length of the tunnel, the distribution of the longitudinal temperature nephogram is not obvious. The profile nephogram of the three schemes is shown in Figure 9, Figure 10 and Figure 11. When the distance from the entrance is 5 m to 750 m, the temperature in the tunnel of the first scheme (the second and the third schemes) increases from −15.2 °C (−15 °C, −14.9 °C) to −8.4 °C (−8.2 °C, −8.0 °C). With the increase in the longitudinal length of the tunnel, the temperature disturbance gradually decreases, and with the increase in the depth of the surrounding rock, the temperature change becomes more obvious. At 750 m from the entrance, in the second scheme, the frozen region of the inverted arch slowly shrinks and disappears in the vault. In the third scheme, the frozen area of the vault and sidewall at 30 m from the entrance disappears. However, to some extent, the frozen area of the inverted arch still exists. Therefore, the thermal insulation layer has an obvious thermal insulation effect. In addition, it can be clearly seen from the numerical nephogram that the pavement and subgrade are obviously frozen (the temperature is below zero), This phenomenon is normal, and the numerical simulation is also in line with the actual situation of the tunnel site in cold regions of China. From the perspective of cold regions, the negative temperature of the road surface has little impact on driving, only affecting the tire friction during driving.
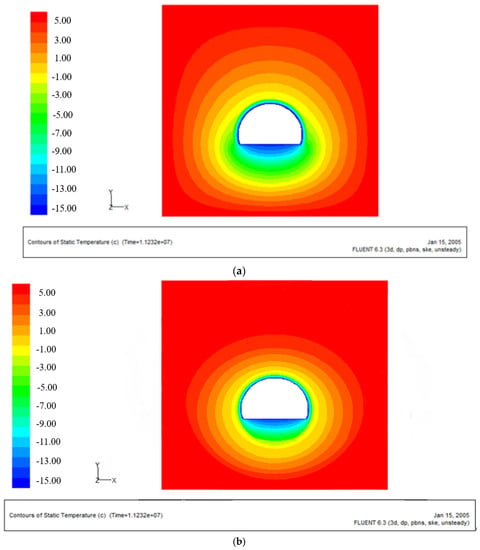
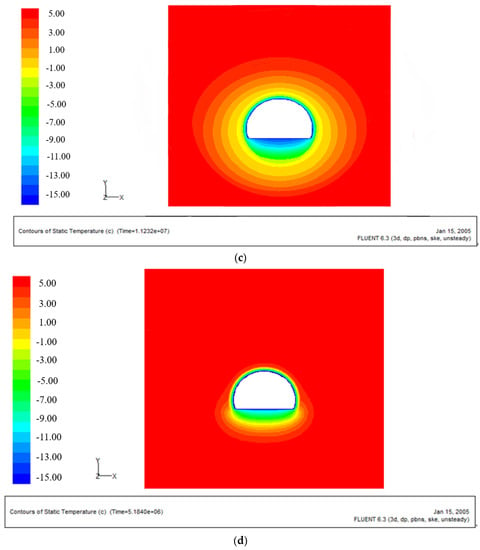
Figure 9.
Cloud diagram of temperature field of different tunnel sections (first scheme): (a) section at 5 m depth of tunnel; (b) section at 200 m depth of tunnel; (c) section at 500 m depth of tunnel; (d) section at 750 m depth of tunnel.
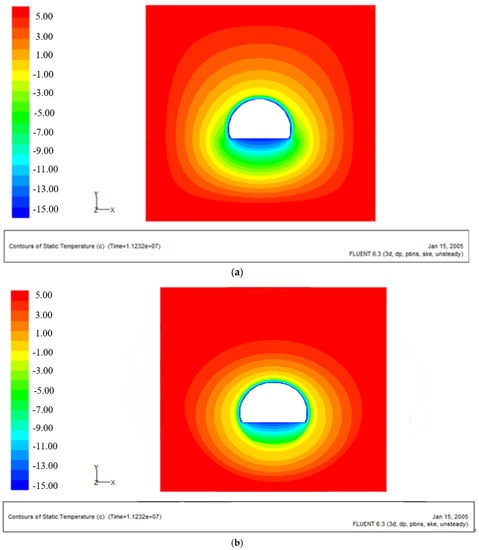
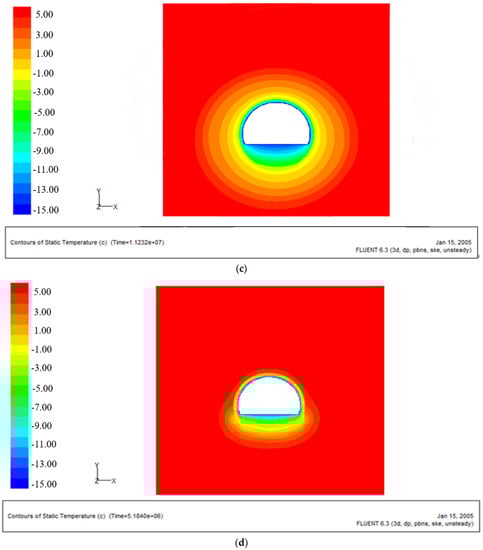
Figure 10.
Cloud diagram of temperature field of different tunnel sections (second scheme): (a) section at 5 m depth of tunnel; (b) section at 200 m depth of tunnel; (c) section at 500 m depth of tunnel; (d) section at 750 m depth of tunnel.
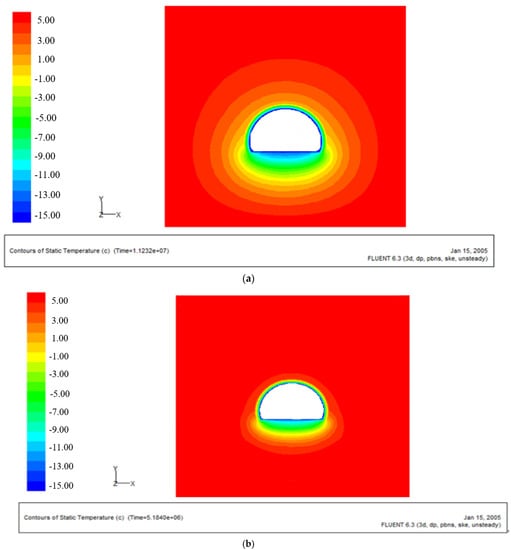
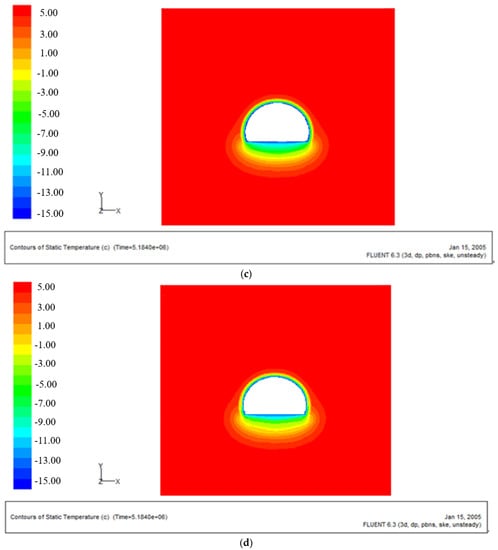
Figure 11.
Cloud diagram of temperature field of different tunnel sections (third scheme): (a) section at 5 m depth of tunnel; (b) section at 200 m depth of tunnel; (c) section at 500 m depth of tunnel; (d) section at 750 m depth of tunnel.
In order to clearly understand the simulation effect of temperature field, the average freezing depth of different sections along the tunnel is extracted, as shown in Figure 12, Figure 13 and Figure 14. Compared with the 5 cm thick insulation layer, the effect of the first scheme is shown in Figure 12, and the blue area represents the frozen area. The longitudinal distance is 0–200 m: in the first area, the thickness of the insulation layer increases by 3 cm, and the freezing depth begins to change at 50 m from the tunnel entrance; at a distance of 200 m, the freezing depth of the first domain is 73 cm less than that of the monitoring data of Dabanshan Tunnel, and the freezing depth of the second domain is reduced to 41 cm. The longitudinal distance is 200–500 m: in the first area, with the increase of 2 cm thickness, the frozen depth at 200 m from the tunnel entrance gradually decreases; however, there is a frozen area inside the lining; at 500 m, the freezing distance in the first area is shortened by 15 cm compared with the monitoring data of Dabanshan Tunnel, and the freezing depth in the second area is shortened to 17 cm. With the increase in tunnel depth, the temperature changes greatly. Due to the thickness of the insulation layer and the characteristics of the lining concrete inside the tunnel, the temperature change only has a frost damage effect on the tunnel, and has a small impact on the cracking of the tunnel lining [28].
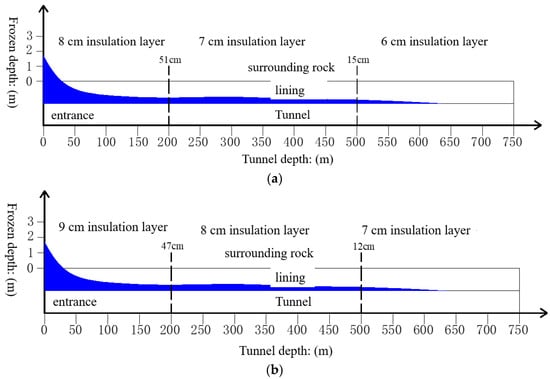
Figure 12.
Longitudinal frozen depth (first scheme): (a) first domain; (b) second domain.
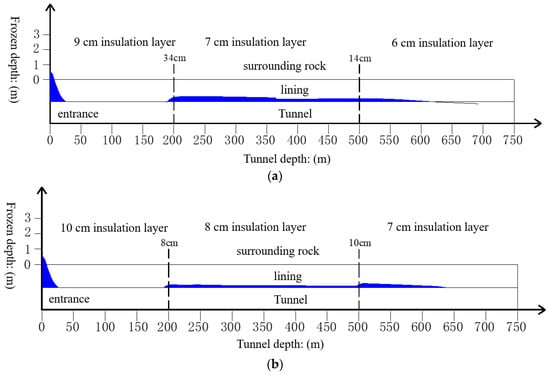
Figure 13.
Longitudinal frozen depth (second scheme): (a) first domain; (b) second domain.
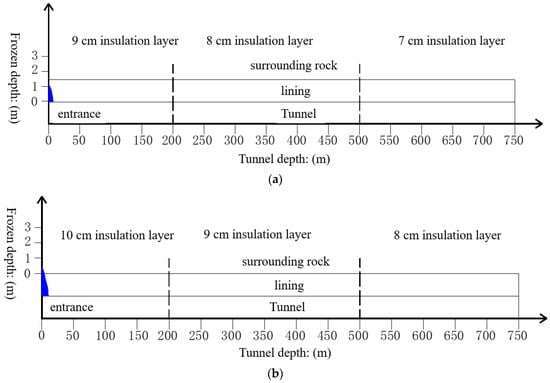
Figure 14.
Longitudinal frozen depth (third scheme): (a) first domain; (b) second domain.
The longitudinal distance is 500–750 m: in the first region, the thickness of the insulation layer is increased by 2 cm, reducing the length of the freezing depth to 630 m. Considering the symmetry, the freeze–thaw damage of the lining will not occur at the distance of 630–900 m (the first area) and 640–900 m (the second area) in the tunnel.
Similarly, compared with the 5 cm thick insulation layer, the effect of the second scheme can be obtained in Figure 13.
The longitudinal distance is 0–200 m: the thickness of the insulation layer is 9 cm and 10 cm. The first and second regions have no lined frozen region (the longitudinal distance is 25–190 m). Only a small part of the tunnel entrance is affected by cold air, which indicates that the insulation layer scheme is reasonable within the range of 25–190 m.
In the second scheme, the freezing distance of the first region is close to that of the first scheme, but the freezing tunnel is affected by a 9 cm thick insulation layer of 34 cm. In the second area, the freezing depth at 200 m and 500 m from the tunnel entrance reaches 8 cm and 5 cm, respectively.
Longitudinal distance 500–750 m: the freezing depth of the first and second regions is close to the first scheme. However, in the second region, the freezing depth is 10 cm, which is affected by the 8 cm thick insulation layer.
Similarly, the effect of the third scheme can be obtained in Figure 14. Compared with the 5 cm thick insulation layer, except for the small region around the tunnel entrance affected by cold air, there is no lining freezing region at the longitudinal distance of 30–750 m, which indicates that this scheme can effectively protect the lining and surrounding rock from freezing and thawing damage.
To sum up, taking Osaka Mountain Tunnel as an example, the temperature field of three insulation layer layout schemes is simulated numerically, the frozen front data at different positions are extracted, and the following conclusions are obtained: In Scheme III, the thickness of thermal insulation layer is not affected by freezing and thawing. Except for a small section of surrounding rock at the tunnel entrance, the surrounding rock and lining in the tunnel are essentially not affected by freezing and thawing, which indicates that the thermal insulation layer in Scheme III can achieve a good thermal insulation effect when the wind speed is 4.2 m/s. The specific thickness and length of the insulation layer are shown in Table 3, and the three-dimensional insulation layer of the tunnel is shown in Figure 15.
Table 3.
Layout section and thickness of tunnel longitudinal insulation layer thickness.
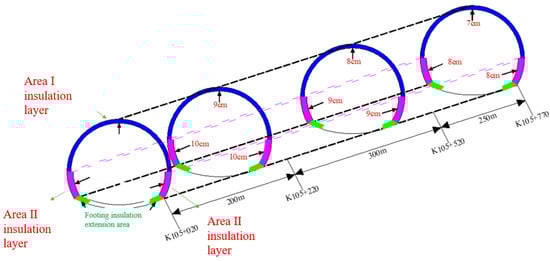
Figure 15.
Layout of tunnel three-dimensional insulation layer.
The overlapping position with variable thickness of insulation layer is a weak link, which is greatly affected by construction factors. Therefore, it is necessary to properly extend the thermal insulation allowance at the overlapping position. Figure 16 and Figure 17 shows the recommended margin.
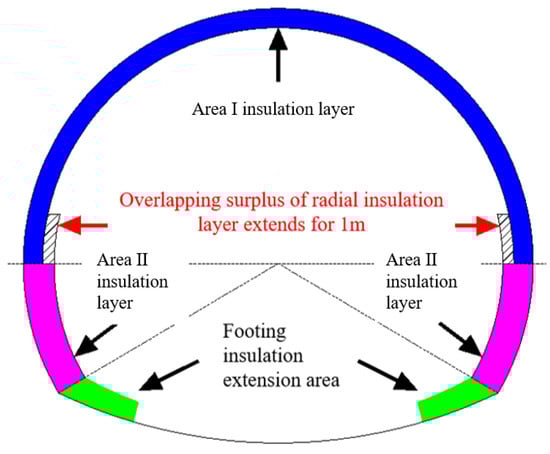
Figure 16.
Radial insulation overlap extension.
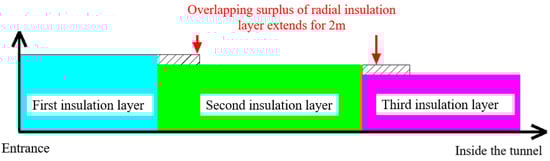
Figure 17.
Longitudinal insulation layer lap extension.
The difference in the thickness of the insulation layer at the overlap may increase the difficulty in the construction of the tunnel insulation layer, and thus increase the project cost. In addition, the overlap of the insulation layer may become a high incidence region of penetration; therefore, the waterproof requirements of the overlap will be higher.
5. Conclusions
(1) The vertical section position of insulation layer (200 m, 500 m, 1000 m, 1300 m) is determined according to the longitudinal freezing depth change curve of Osaka Mountain Tunnel in December and November.
(2) The uneven zoning scheme of 9 cm-8 cm-7 cm and 10 cm-9 cm-8 cm insulation layer can effectively reduce the freezing area of lining and surrounding rock. The freezing region at the tunnel entrance is significantly reduced, and there is no lining freezing region within the depth of 30–750 m.
(3) Based on three thermal insulation layer layout schemes, the temperature field of Osaka Mountain Tunnel is simulated and analyzed, and the thermal insulation effects of the three schemes are compared and selected. The thermal insulation layer layout schemes of 9 cm-8 cm-7 cm and 10 cm-9 cm-8 cm are determined. The thermal insulation layer layout scheme can effectively prevent the damage of Osaka Mountain Tunnel lining and surrounding rock from freezing and thawing.
Author Contributions
Methodology, T.L.; Software, J.Z.; Investigation, L.L.; Writing—original draft, Z.L. All authors have read and agreed to the published version of the manuscript.
Funding
This research received no external funding.
Institutional Review Board Statement
Not applicable.
Informed Consent Statement
Not applicable.
Data Availability Statement
We declare that we have no financial and personal relationships with other people or organizations that can inappropriately influence our work, there is no professional or other personal interest of any nature or kind in any product, service and/or company that could be construed as influencing the position presented in, or the review of, the manuscript entitled.
Conflicts of Interest
The authors declare no conflict of interest.
References
- Inokuma, A.; Inano, S. Road tunnels in Japan: Deterioration and countermeasures. Tunn. Undergr. Space Technol. 1996, 11, 305–309. [Google Scholar] [CrossRef]
- Zhang, M.; Bi, J.; Chen, W.; Zhang, X.; Lu, J. Evaluation of calculation models for the thermal conductivity of soils. Int. Commun. Heat Mass 2018, 94, 14–23. [Google Scholar] [CrossRef]
- Liu, X.; Congress, S.S.C.; Cai, G.; Liu, L.; Puppala, A.J. Evaluating the thermal performance of unsaturated bentonite-sand-graphite as buffer material for waste repository using an improved prediction model. Can. Geotech. J. 2022, 60, 3. [Google Scholar] [CrossRef]
- Liu, L.; Li, Z.; Liu, X.; Li, Y. Frost front research of a cold-region tunnel considering ventilation based on a physical model test. Tunn. Undergr. Space Technol. 2018, 77, 261–279. [Google Scholar] [CrossRef]
- He, C.X.; Wu, Z.W. Preliminary prediction for the freezing–thawing situation in rock surrounding DabanShan tunnel. In The Dissertations of the Fifth National Conference on Glaciology and Geocryology; Culture Press of Gansu: Lanzhou, China, 1996; pp. 419–425. [Google Scholar]
- Krarti, M.; Kreider, J.F. Analytical model for heat transfer in an underground air tunnel. Energy Convers. Manag. 1996, 37, 1561–1574. [Google Scholar] [CrossRef]
- He, C.; Wu, Z.; Zhu, L. A convection-conduction model for analysis of the freeze-thaw conditions in the surrounding rock wall of a tunnel in permafrost regions. Sci. China Ser. D Earth Sci. 1999, 42, 1–8. [Google Scholar] [CrossRef]
- Lai, Y.M.; Liu, S.Y.; Wu, Z.W.; Yu, W.B. Approximate analytical solution for temperature fields in cold regions circular tunnels. Cold Reg. Sci. Technol. 2002, 34, 43–49. [Google Scholar]
- Zeng, Y.; Liu, K.; Zhou, X.; Fan, L. Tunnel temperature fields analysis under the couple effect of convection-conduction in cold regions. Appl. Therm. Eng. 2017, 120, 378–392. [Google Scholar] [CrossRef]
- Feng, Q.; Jiang, B.S.; Zhang, Q.; Wang, G. Reliability research on the 5-cm-thick insulation layer used in the Yuximolegai tunnel based on a physical model test. Cold Reg. Sci. Technol. 2016, 124, 54–66. [Google Scholar] [CrossRef]
- Wu, H.; Zhong, Y.; Xu, W.; Shi, W.; Shi, X.; Liu, T. Experimental investigation of ground and air temperature fields of a cold-region road tunnel in NW China. Adv. Civ. Eng. 2020, 2020, 4732490. [Google Scholar] [CrossRef]
- Li, Y.; Qi, D.; Yan, H.; Zhang, J. Experimental Study on Heat Transfer Process Optimization of Heat Storage Wall of the Heat Pump in Tunnel Surrounding Rock in the Cold Region. Geofluids 2022, 2022, 5224154. [Google Scholar] [CrossRef]
- Zhou, Y.; Zhang, X.; Deng, J. A mathematical optimization model of insulation layer’s parameters in seasonally frozen tunnel engineering. Cold Reg. Sci. Technol. 2014, 101, 73–80. [Google Scholar] [CrossRef]
- Jain, P.K.; Singh, S. Analytical solution to transient asymmetric heat conduction in a multilayer annulus. J. Heat Transfer. 2009, 131, 011304. [Google Scholar] [CrossRef]
- Lai, Y.M.; Wu, Z.; Zhu, Y.; Zhu, L. Nonlinear analysis for the coupled problem of temperature and seepage fields in cold regions tunnels. Cold Reg. Sci. Technol. 1999, 29, 89–96. [Google Scholar] [CrossRef]
- Song, H.; Ye, C.L.; Mi, J.F. Numerical analysis of optimization design for insulation layer in cold regions tunnel. In Advanced Materials Research; Trans Tech Publications Ltd.: Zurich, Switzerland, 2015; Volume 1065, pp. 368–372. [Google Scholar]
- Xia, C.-C.; Fan, D.-F.; Han, C.-L. Piecewise calculation method for insulation layer thickness in cold region tunnels. China J. Highw. Transp. 2013, 26, 131. [Google Scholar]
- Lu, K.C.; Ma, C.C.; Ji, Z.; Xu, P. Strip Insulating Layer in Tunnel in Cold Region and its Temperature Field Analysis. In Applied Mechanics and Materials; Trans Tech Publications Ltd.: Zurich, Switzerland, 2012; Volume 170, pp. 1679–1684. [Google Scholar]
- Xuefu, Z.; Jianzhang, X.; Yaonan, Z.; Shengxie, X. Study of the function of the insulation layer for treating water leakage in permafrost tunnels. Appl. Therm. Eng. 2007, 27, 637–645. [Google Scholar] [CrossRef]
- Mie, F.M. The frost proof problem on the drainage ditch in the cold region tunnel. In Proceedings of the Second National Conference on Permafrost, Lanzhou, China, 1–6 July 1983; Gansu People’s Publish House: Lanzhou, China, 1983; pp. 405–411. [Google Scholar]
- Ji, Z.; Lu, K.C.; Ma, C.C. Classification, causes of tunnel frost damages in cold region and several new technologies to prevent them. In Applied Mechanics and Materials; Trans Tech Publications Ltd.: Zurich, Switzerland, 2012; Volume 170, pp. 1504–1510. [Google Scholar]
- Cai, H.; Xu, L.; Yang, Y.; Li, L. Analytical solution and numerical simulation of the liquid nitrogen freezing-temperature field of a single pipe. AIP Adv. 2018, 8, 055119. [Google Scholar] [CrossRef]
- Zhou, Y.; Li, M.; Zhang, D.; Suo, X.; Zhang, X.; Dong, K. Optimal Design of Central Drainage Ditch Buried Depth for Highway Tunnel in Seasonally Frozen Region. KSCE J. Civ. Eng. 2022, 26, 1674–1682. [Google Scholar] [CrossRef]
- Bonacina, C.; Comini, G.; Fasano, A.; Primicerio, M. Numerical solution of phase-change problems. Int. J. Heat Mass Transf. 1973, 16, 1825–1832. [Google Scholar] [CrossRef]
- Zhang, X.F.; Lai, Y.; Yang, F.; Yu, W. Numerical analysis on freezing-thawing situation of tunnel’s surrounding rock in cold regions. J. China Railw. Soc. 2002, 24, 92–96. [Google Scholar]
- Xia, C.C.; Zhang, G.Z.; Xiao, S.G. Analytical solution to temperature fields of tunnel in cold region considering lining and insulation layer. Chin. J. Rock Mech. Eng. 2010, 29, 1767–1773. [Google Scholar]
- Zhu, P.; Xie, S.; Wang, X. A stabilizer-free C0 weak Galerkin method for the biharmonic equations. Sci. China Math. 2022, 66, 627–646. [Google Scholar] [CrossRef]
- Kim, K.; Cho, H.; Sohn, D.; Lee, J. The use of expansive chemical agents for concrete demolition: Example of practical design and application. Constr. Build. Mater. 2021, 272, 121849. [Google Scholar] [CrossRef]


Disclaimer/Publisher’s Note: The statements, opinions and data contained in all publications are solely those of the individual author(s) and contributor(s) and not of MDPI and/or the editor(s). MDPI and/or the editor(s) disclaim responsibility for any injury to people or property resulting from any ideas, methods, instructions or products referred to in the content. |
© 2023 by the authors. Licensee MDPI, Basel, Switzerland. This article is an open access article distributed under the terms and conditions of the Creative Commons Attribution (CC BY) license (https://creativecommons.org/licenses/by/4.0/).