Article

Asset Structure, Asset Utilization Efficiency, and Carbon Emission Performance: Evidence from Panel Data of China’s Low-Carbon Industry

School of Economics and Management, North China Electric Power University, Beijing 102206, China
*
Author to whom correspondence should be addressed.
Sustainability 2023, 15(7), 6264; https://doi.org/10.3390/su15076264
Submission received: 6 February 2023 / Revised: 24 March 2023 / Accepted: 3 April 2023 / Published: 6 April 2023
(This article belongs to the Section Economic and Business Aspects of Sustainability)

Abstract

:
With the development of a low-carbon economy, corporate carbon emission performance has become an important premise for green financing. Compared with high-carbon industries, companies in low-carbon industries have their own carbon advantages and receive less attention. In order to highlight the value of carbon emission performance in low-carbon industries, further investigation on the basis of low-carbon industries is still needed. In terms of fixed assets, which are indicators for an important source of carbon emissions in intensive carbon industries, this study explores the relationship between asset structure, asset utilization efficiency, and carbon emission performance in low-carbon industries. This study selects Chinese listed companies from low-carbon industries that have disclosed their carbon emission performance from 2010 to 2021 as samples. The panel model is used for regression analysis, and then the Arellano-Bover/Blundell-Bond panel dynamic data model is used to solve the problem of endogeneity. The results show that the higher the fixed asset ratio, the worse the carbon emission performance. Asset utilization efficiency weakens the inhibitory effect of the fixed asset ratio on carbon emission performance. This study verifies the significant impact of fixed assets on the carbon emission performance of low-carbon industries as well as the promotion effect of asset utilization efficiency on carbon emission performance. Further investigation verified the promoting effect of corporate growth capabilities on carbon emission performance with two mechanisms, namely the relationship between fixed assets (independent variable)-asset utilization efficiency and (mediator)-corporate growth capabilities (dependent variable) or the relationship between asset utilization efficiency (independent variable)-corporate growth capabilities and (mediator)-fixed assets (dependent variable) from perspectives of enterprise value and expansion. This study expands the influencing factors of carbon emissions in low-carbon industries and is a theoretical supplement to a large number of high-carbon studies. At the same time, it also has certain implications for the carbon emission management practices of enterprises in low-carbon industries. It also reveals the urgency for the government and research institutions to clarify the carbon emission capacity of different fixed assets. Thus, it is convenient for low-carbon industries and high-carbon industries to carry out more refined carbon management and give full play to their carbon advantages.

1. Introduction

Excessive carbon emissions have become a key factor in environmental degradation and have impeded the sustainable development of China’s industry [1]. The transportation, heating, power supply, ferrous metal processing, non-metallic mineral manufacturing, and other manufacturing industries, as key links in the industrial chain, are also the main sources of carbon emissions, which hinder the green and high-quality development of the industry [2,3,4,5,6]. Most high-carbon industries have a relatively high ratio of fixed assets to total assets, and a large amount of fixed asset investment exacerbates carbon emissions. With the implementation of a series of environmental regulation policies and the development of a carbon emission trading market, the carbon predominance of enterprises in high-carbon industries and low-carbon industries is valued, which also improves their fixed asset investment efficiency to a certain extent [7,8].
The upgrading of traditional industries has begun to shift to green productivity practices, such as green finance and green innovation, which are important to achieve the goal of sustainable development [9]. In the development of a low-carbon economy, the commercial value of carbon dominance increases. However, the research on carbon emissions has mainly focused on high-energy-consuming industries, and it is easy to ignore the contribution of low-carbon industries. Considering the proportion of low-carbon industries such as equipment manufacturing, production, and supply of water and gas in the national economy, the government has paid increasing attention to low energy consumption and industrial environmental pollution, and low-carbon industries have received more and more attention in terms of carbon predominance [10,11]. With the gradual expansion of the service objects of green finance to low-carbon industries and the popularization of low-carbon consumption concepts, carbon emission performance is becoming more and more important for green financing in low-carbon industries [12,13,14].
Enterprise carbon emission performance is a bridge connecting enterprises and societies, which can convey the efforts made in resource conservation and environmental protection and enhance the corporate image [15]. However, corporate carbon reduction comes at a cost. For example, if the business performance is not ideal, the firm does not have enough confidence and capital to reduce carbon emissions in the current period. Good business performance can promote the carbon emission reduction of enterprises [16]. Among them, fixed assets other than current assets are the basis for long-term operation and use of enterprises and the prerequisite for enterprises to achieve optimal asset allocation [17]. However, excessive fixed assets will weaken the business ability of low-carbon enterprises [18]. Inferred from the relationship between carbon emission performance and the carbon predominance of low-carbon industries and the impact of fixed assets on the carbon emissions of high-carbon industries, this study asks whether fixed assets affect the carbon emissions of low-carbon industries, which plays an important role in reflecting the carbon emission capacity of fixed assets in low-carbon industries. In addition, the asset utilization efficiency of enterprises symbolizes the operation ability of enterprises and can promote better planning and management of enterprises, which will improve corporate profitability and business performance [19,20]. Combined with the influence of operating performance on carbon emission performance and asset utilization efficiency on operating performance, this study attempts to find the promotion effect of asset utilization efficiency on carbon emission performance. Based on the above analysis, this study raises the following questions:
(1) Is the worse carbon emission performance of enterprises in low-carbon industries associated with a higher fixed asset ratio? (2) Does asset utilization efficiency positively affect the carbon emission performance of enterprises in low-carbon industries? (3) Can asset utilization efficiency inhibit the negative impact of fixed assets on the carbon emission performance of enterprises in low-carbon industries? (4) Does corporate growth play a role in the relationship between fixed assets and asset utilization efficiency?
This study essentially explores the factors influencing the carbon emission performance of low-carbon industries from the perspectives of asset structure (financing needs and corporate expansion) and asset utilization (enterprise value). This is thought-provoking for promoting carbon emission research in low-carbon industries and is a theoretical supplement to studies for high-carbon industries. At the same time, it also has certain implications for the carbon emission management practices of enterprises in low-carbon industries. It also reveals the urgency for the government and research institutions to clarify the carbon emission capacity of different fixed assets. Thus, it is convenient for practitioners of carbon emission reduction management, low-carbon industries, and high-carbon industries to carry out more refined carbon management and give full play to their carbon advantages.
The paper proceeds as follows: First, after a literature review on the subject studied, research hypotheses were proposed. Next, we present research methodology, including empirical data collection, variables and constructions of empirical models, and empirical results as well as findings. Finally, we discuss our findings in the light of the theoretical frameworks employed and highlight the contributions, limitations, and suggestions for future study.

2. Review of Literature

2.1. Carbon Emissions and Influencing Factors

Carbon emissions, as the result of combustion, energy usage, and enterprises’ low-carbon behaviors, are important indicators for achieving carbon emission reduction and carbon neutrality goals [21,22,23]. At present, the topics about carbon emissions focus on measurement methods for carbon emissions and influencing factors for carbon emissions [24,25,26]. Among them, the measurement methods of carbon performance include multi-criteria decision-making, a carbon performance evaluation model for suppliers, and a carbon performance evaluation system based on the project process in energy utilization [27,28]. A large number of studies have been conducted on the influencing factors of carbon emissions, mainly financial performance, industry carbon intensity, and energy or environmental management.
However, due to the methods and factors selected, the previous results are quite different. Carbon emissions measured by the equivalent level of carbon dioxide emissions of a company are inversely related to financial performance; that is, carbon performance is generally positively related to financial performance [29]. While some results are not consistent. The coal consumption rate of power generation will significantly promote the growth of carbon emissions in the power industry, and the industrial structure is one of the important driving factors affecting the change in carbon emissions [30]. Carbon emission performance is influenced by enterprise energy choice, abatement investment, and internal carbon management, including internal carbon pricing, corporate climate targets, establishing corporate GHG emission inventories, and so on [31,32,33,34].

2.2. Asset Structure, Enterprise Performance, and Carbon Emissions

Asset structure, capital structure, firm size, corporate growth, and investment decisions will have an impact on the value of enterprises [35]. Moreover, the performance of small and medium-sized enterprises is affected by the balance of fixed assets, current assets, inventory, accounts receivable, equity, and liabilities [36]. From the perspective of organizational theory, current ratio, asset-liability ratio, net profit, fixed asset turnover, and other indicators are very important for the complete economic evaluation of the company [37]. In terms of corporate governance, firm size and asset structure have a key impact on performance [38]. The exposure to carbon intensive industries such as fossil fuels and metals has a negative impact on the financial performance of the portfolio of socially responsible mutual funds, and in regions with high per capita carbon dioxide emissions, this impact is more likely to be affected by carbon intensive industries [39]. The analysis of corporate asset structure is helpful for studying the relationship between corporate financial performance and carbon emission performance.
By reviewing the above literature, we can see that many scholars take different industries as research samples and put more emphasis on asset structure for enterprise operation. For funds that focus on social responsibility, their financial performance is significantly affected by investing in carbon-intensive industries. Asset structure is an important manifestation of the implementation of internal resource allocation [40]. Although studies on factors affecting asset structure, such as fixed asset ratio, quick ratio, and asset-liability ratio, have been detailed [41,42,43], the literature that directly considers the relationship between asset structure and corporate carbon emissions is still rare. Under the situation of low-carbon development and a carbon emission reduction goal, enterprises adjust their investment and asset structure, increase cash holdings, and increase their quick ratio to cope with uncertain risks [44,45]. Uncertain risks from carbon emissions faced by enterprises in recent years have adverse effects on climate change and fossil fuel use [46]. They may reduce the related risk tolerance of long-term investment and further adjust the structure of long-term investment, such as the fixed asset ratio.

2.3. Corporate Financial Performance, Asset Utilization Efficiency, and Carbon Emissions

Some studies have found that asset utilization efficiency has a positive effect on corporate financial performance. For example, a company’s operating profit margin and high total asset turnover (i.e., asset utilization efficiency) are the main factors causing differences in corporate financial performance [47]. Corporate social responsibility (including carbon performance) activities have a positive effect on financial performance [47,48]. GHG emissions management in non-energy intensive firms rather than energy intensive firms improves net sales divided by raw material costs (a financial performance measurement) through increasing demand and productivity [49]. The implementation of a pilot emission trading system has a promoting role in improving financial performance such as firms’ operating efficiency (Tobin’s Q) through emissions reduction, and the effect is less significant for energy industries [50,51].
The relationship between carbon performance and corporate operating efficiency as well as financial performance, as well as the relationship between corporate operating efficiency and financial performance, are linked to the relationship between asset utilization efficiency and carbon emission performance. The less efficient asset utilization is, the greater the change in carbon emissions [29,43]. Moreover, the impact of corporate carbon emission intensity on asset utilization efficiency, such as return on assets and return on equity, is not significant [52]. The relationship between carbon emissions and corporate financial performance is not linear and may not be applicable to all industries and performance indicators [53]. Some scholars found that the effect of corporate carbon efforts on corporate economic and financial performance is also not significant [54].
The relationship between corporate asset utilization efficiency and carbon emissions is complex and unclear. For example, the increase in carbon emissions continuously reduces the value of enterprises [55]. However, in the mining industry, greenhouse gas emissions are positive for financial performance [56]. The relationship between carbon performance and financial performance is positive for industries with good carbon performance themselves. Furthermore, the relationship between carbon performance and stock market performance is U-shaped, but solely for manufacturing industries [53]. Therefore, the relationship between asset utilization efficiency and carbon performance is significantly affected by industry pollution.
To sum up, research on carbon emission performance in low-carbon industries is small in number and lacks depth. The relevant studies showed that energy use characteristics, industrial structure, financial performance, and emission reduction investment in enterprises significantly affect carbon emission performance [29,30,31,32,33,34]. In previous studies, the relationships between financial performance, enterprise value, green investment, and carbon emission performance were often studied, which reflected the possible indirect relationships between asset structure, asset use efficiency, and carbon emission performance. However, there were few in-depth direct studies. Moreover, the relationships between asset structure, asset utilization efficiency, and carbon emission are inseparable from enterprise value and financing needs, which may be associated with corporate growth capability. In view of the fact that financial performance measurement in previous relevant studies is more reflected in market financial performance (Tobin’s q) and based on accounting financial indicators (ROA), this study explores the mechanism of action between asset structure as well as asset utilization efficiency rather than broad financial performance indicators and carbon emissions of low-carbon industries. This study attempts to broaden the knowledge of the effects of asset structure (fixed assets) and asset utilization efficiency on carbon performance in low-carbon industries.

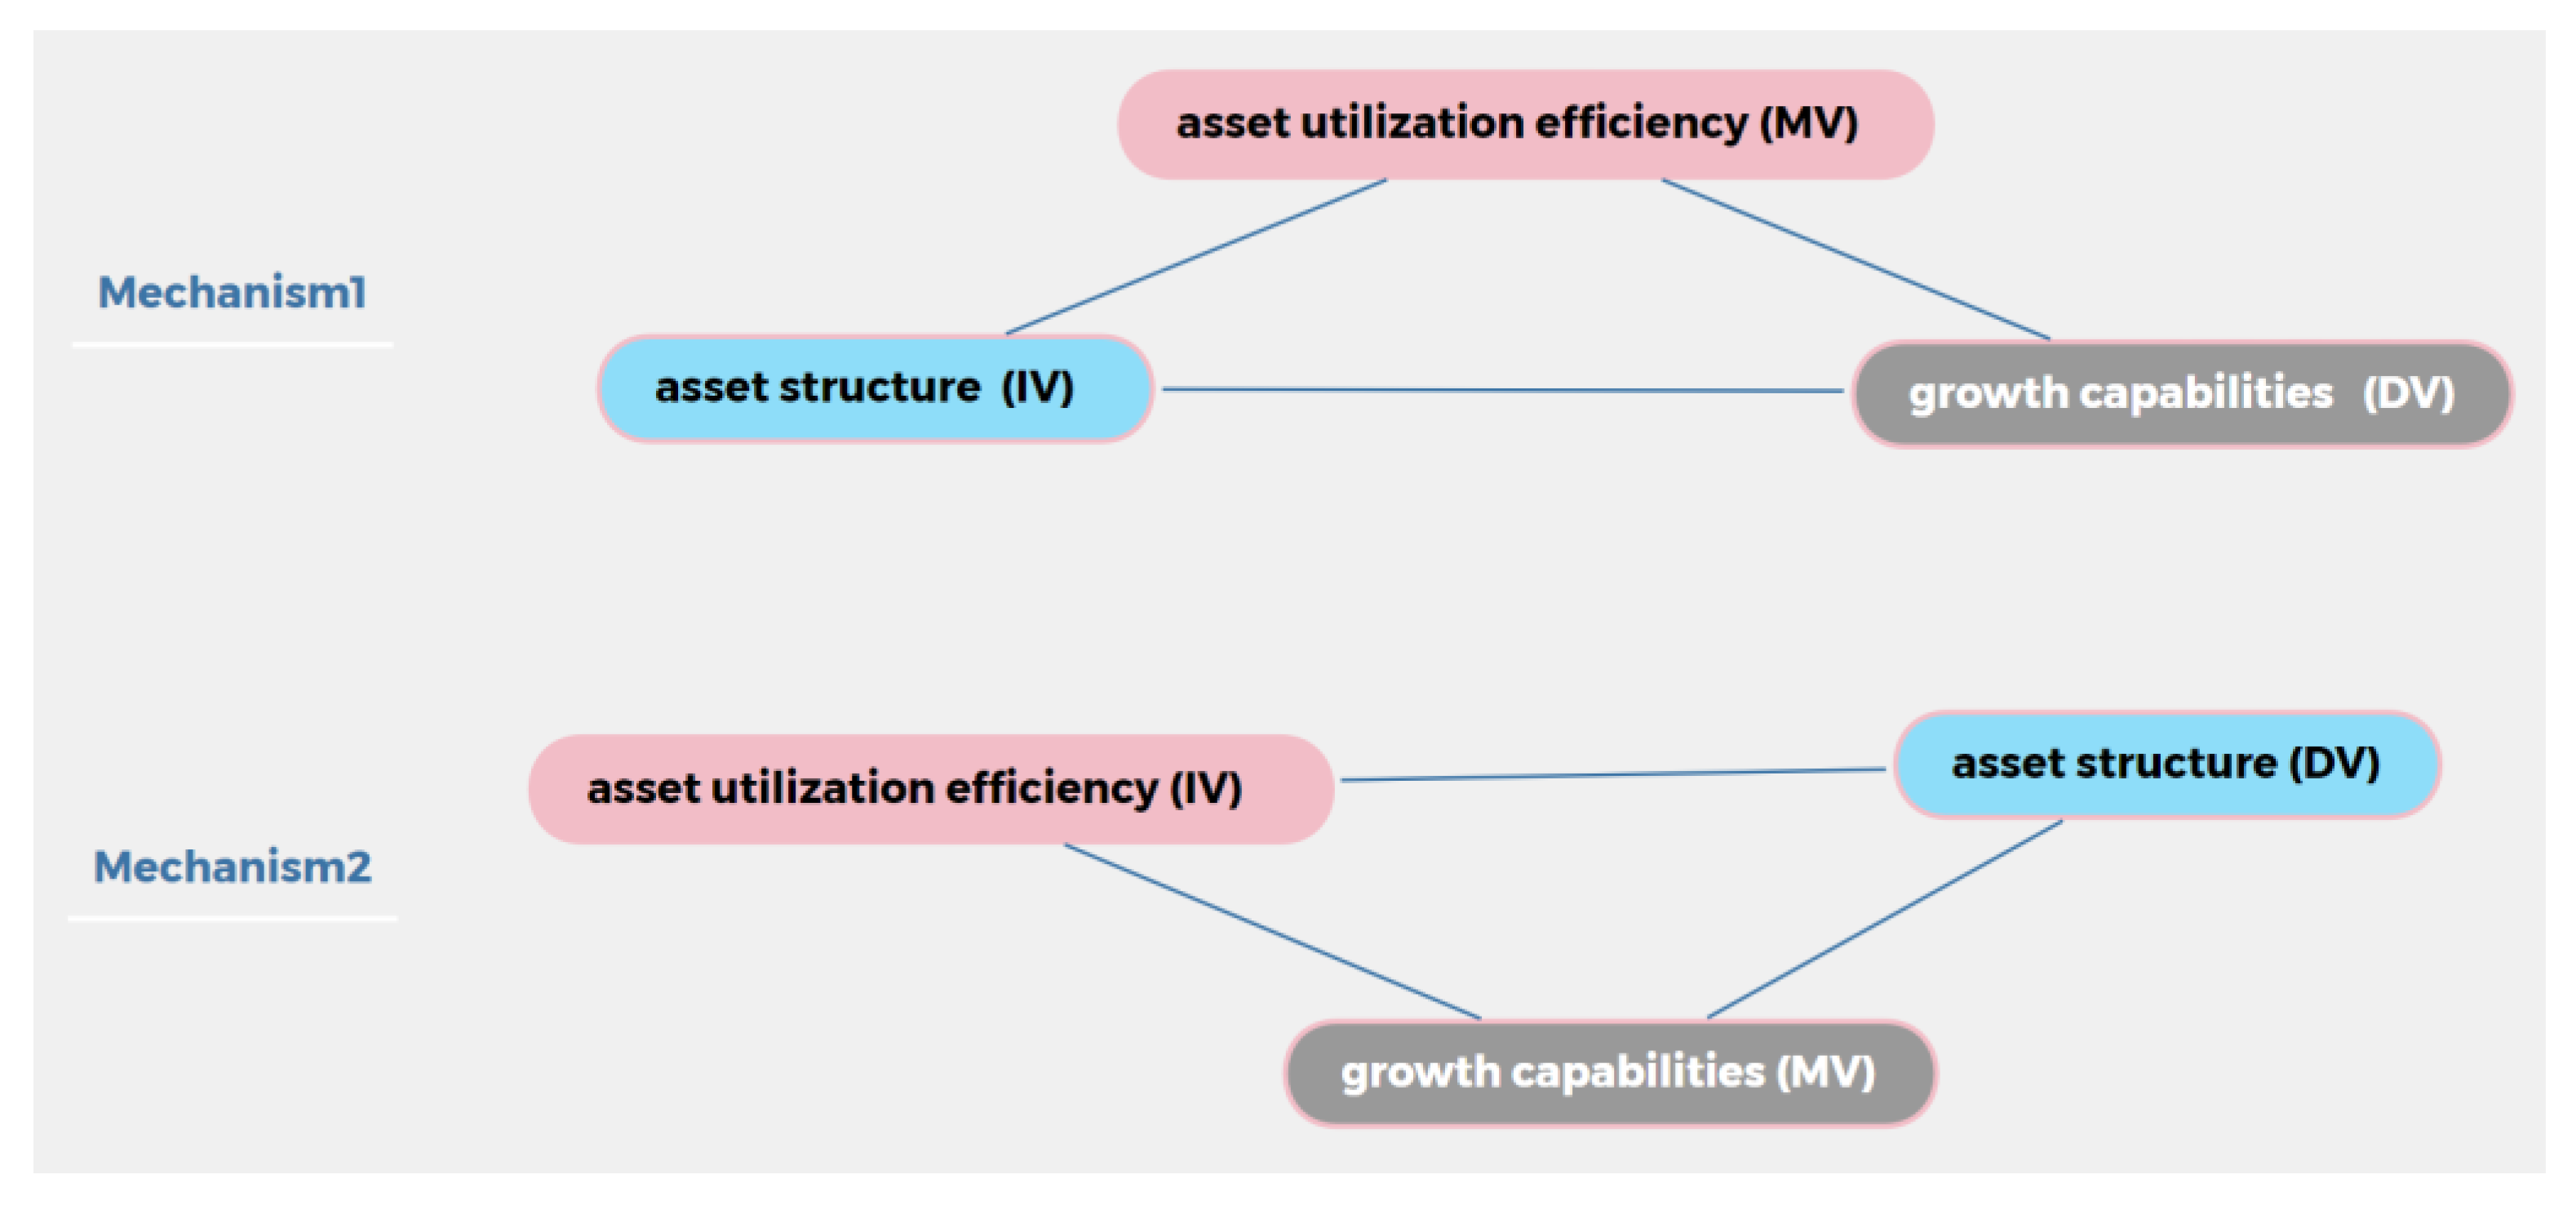
2.4. Research Hypothesis

In recent years, extreme climate events such as global warming and glacier melting have compounded the conflict between humans and the environment. Enterprises in low-carbon industries should also perform the social responsibilities of environmental protection, energy conservation, and emission reduction. According to the theory of sustainable development, in the presence of carbon regulation, carbon emission performance will have a certain impact on the value of enterprises. On the one hand, as the low-carbon industries are less affected by carbon regulation, the effect of carbon emission performance on corporate growth capability or enterprise value in low-carbon industries may not be as good as that in high-carbon industries. On the other hand, long-term investment structures such as the fixed asset ratio hinder corporate growth capability or firm value from the perspective of the application of funds. Therefore, based on the above analysis, Hypothesis 1 is put forward:
Hypothesis 1 (H1).
The fixed asset ratio of firms in low-carbon industries has a negative effect on carbon emission performance.
The impact of climate-related risks on enterprises is an important concern for their external stakeholders [57]. From the demand side, consumers begin to consider low-carbon and energy-saving products as part of their purchase decisions. The efficiency theory also indicates that low-carbon industries have carbon advantages, which are more likely to improve resource productivity and asset utilization efficiency with less cost and promote carbon emission performance in the development of a low-carbon economy [58]. Therefore, based on the above analysis, Hypothesis 2 is proposed:
Hypothesis 2 (H2).
Asset utilization efficiency of enterprises has a positive effect on carbon emission performance in low-carbon industries.
Instrumental stakeholder theory is an important branch of stakeholder theory [59], which argues that effective relationships between firms and key stakeholders (such as climate-friendly practices linked to economic performance) contribute to market success and thus promote financial performance [60]. A company’s reputation is affected by its environmental status [61]. Firstly, good carbon emission performance has a positive impact on the company’s reputation. In order to have a good reputation, enterprises in low-carbon industries will pursue better carbon emission performance, which will put forward higher requirements on asset utilization efficiency. Secondly, good carbon emission performance can reduce the cost of conforming to climate policy [62]. The greater the ability of enterprises to mitigate these environmental costs, the higher the efficiency of enterprises’ asset utilization, and the more likely investors are to raise the value assessment of enterprises [63]. Finally, firms in low-carbon industries will be more sensitive to changes in their carbon emissions performance compared to their fixed asset ratio and total asset turnover in order to avoid the risk of carbon regulation. The improved asset utilization efficiency will further enhance the corporate value of enterprises and help adjust and maintain the industrial advantage of their carbon emission performance. Therefore, based on the above analysis, this paper puts forward hypothesis 3:
Hypothesis 3 (H3).
Asset utilization efficiency of enterprises weakens the inhibitory effect in the relationship between fixed asset ratio and carbon emission performance in low-carbon industries.

3. Research Methods

3.1. Samples

Samples are from 2010 to 2021, with a total of 44 Chinese listed companies. There are 17 low-carbon industries: gas production and supply, food manufacturing, wine and beverage manufacturing, refined tea manufacturing, ferrous metals mining and dressing, manufacture of general machinery, manufacture of medicines, metal products manufacturing, car industry, non-ferrous metal mining and dressing, manufacture of electrical machinery and equipment, manufacture of instruments and meters, manufacture of electronic equipment, water production and supply, financial industry, chemical fiber manufacturing, special purpose equipment, and transportation equipment industries [64,65]. The observations are 179, as shown in Table 1.

3.2. Variables

3.2.1. Explained Variable

The dependent variable is carbon emission performance. Carbon emission performance refers to corporate emission advantage in the process of applying low-carbon technologies, energy restructuring, low-carbon projects, and so on. Comprehensively considering the size of firms, this study selected carbon emission intensity, namely the ratio of carbon emission to enterprise operating revenue, as an indicator of carbon emission performance. The sum of carbon emissions from Scope 1 and Scope 2 other than Scope 3 is used in order to maintain consistency with the scope of carbon emissions disclosed by most enterprises and widely used disclosure guidelines regarding the difficulty of quantifying carbon emissions in Scope 3 [66,67]. In detail, Scope 1 refers to the direct emissions generated by directly controlled or owned emission sources, including combustion, etc., and Scope 2 refers to indirect emissions, including the indirect emissions generated by the purchased power for the enterprise’s own use, such as steam, heating, cool air, etc. Scope 3 is indirect emissions other than Scope 2, including all emissions that may be produced upstream or downstream. The calculation methods considering emission source, conversion coefficient, and so on have been demonstrated in corporate social responsibility reports in research samples.

3.2.2. Explanatory Variables

The explanatory variables are asset structure and asset utilization efficiency. The asset structure of an enterprise reflects the resource allocation preferences, such as fixed assets, current assets, current liabilities, and inventory. Candidate explanations are that the capital occupied by different forms of assets may reflect the characteristics or business model of the enterprise. For example, an enterprise with a higher proportion of fixed assets means that it is mainly productive, has less high-tech, and so on. Different resource allocation preferences affect the energy use characteristics and production characteristics of enterprises, thus affecting the carbon emission performance of enterprises. As one of the indicators of asset liquidity, the fixed asset ratio is very important. The fixed asset ratio has industry characteristics. Since the direct or indirect carbon emissions of fixed assets are one of the main sources of carbon emissions for enterprises, the fixed asset ratio is of great significance for analyzing the carbon emission capacity of fixed assets in low-carbon industries. In this study, the fixed asset ratio is defined as the long-term occupation of capital and measured by the ratio of fixed assets to total assets.
Asset utilization efficiency refers to the effectiveness (output) and adequacy (input) of asset utilization. Furthermore, as a kind of measurement of sales ability and asset investment benefit, total asset turnover has a positive correlation with enterprise value. Many scholars use total asset turnover as an evaluation for asset utilization efficiency, profitability, and enterprise value [63,68]. Hussein Alsufy (2019) studied the status of the asset structure of the market based on the total asset turnover [69]. Therefore, the total asset turnover can be used as an important basis for judging the efficiency of asset utilization.

3.2.3. Control Variables

Investors are willing to recognize enterprises with better performance in GHG emissions and transparency, regardless of lower returns [70]. Zhang also found positive relationships between carbon and financial performance only on the occasion of carbon performance beyond a threshold [71]. From the perspective of corporate growth, the connections of growth are in line with carbon performance [72]. Good governance, including managerial ownership, is positively related to environmental performance. This paper also takes equity concentration to represent an aspect of corporate governance and adds stock liquidity and sustainable growth rate (see Table 2) [73].

3.3. Model Construction

Panel fixed-effect and random-effect models were used in this study to analyze individual and time effects in the panel data models.
C a r b o E m i t = + β 1 F i x e d R a i t + β 2 T o t a l R a i t + β 3 F i x i t T o t i t + β 4 A s s e t i t + β 5 S a l e s i t + β 6 R O A i t + β 7 S u s t a G r i t + β 8 S h a r e R a 1 i t + β 9 S h a r e R a 5 i t + β 10 T r a d a S P i t + v i + ϵ i t
In the model, C a r b o E m i t , F i x e d R a i t and T o t a l R a i t represent carbon emission performance, asset structure, and asset utilization efficiency for company i in year t, respectively. F i x i t T o t i t   i s   t h e   i n t e r a c t i o n   t e r m   f o r   F i x e d R a i t and T o t a l R a i t , v i is the unit-specific error term, ϵ i t is the “usual” error term with the usual properties.
Considering that carbon performance is calculated by carbon emissions and operating revenues, which may be related to the sustainable growth rate and operating revenue. Self-selection bias may exist in this study. In order to solve the problem of self-selection bias, the sustainable growth rate, operating revenue, and ROA were set as endogenous variables in this study. The analysis is also conducted using Arellano-Bover/Blundell-Bond estimation, which is designed for datasets with many panels and few periods and fits a linear dynamic panel-data model where the unobserved panel-level effects are correlated with the lags of the dependent variable. Through statistical analysis, two conditions (no autocorrelation in the idiosyncratic errors and panel-level effects being uncorrelated with the first difference of the first observation of the dependent variable) are satisfied in the model. It means that the instrumental variables are strongly correlated with the endogenous explanatory variables, and the instrumental variables are exogenous. The Arellano-Bond test for zero autocorrelation in first-differenced errors (Arellano-Bond test ZAR1) and the Sargan test are required to satisfy the two conditions of overidentifying restrictions (Sargan test OVRID). In this study, the first lag term, second lag term, and third lag term of the explained variables were put into the model.
Model 2:
C a r b o E m i t = j = 3 p α j C a r b o E m i , t j + β 1 S u s t a G r i t + β 2 S h a r e R a 1 i t + β 3 S h a r e R a 5 i t + β 4 T r a d a S P i t + ω 1 F i x e d R a i t + ω 2 T o t a l R a i t + ω 3 F i x i t T o t i t + ω 4 A s s e t i t + ω 5 S a l e s i t + ω 6 R O A i t + v i + ϵ i t
where C a r b o E m i , t j represents lagged terms for C a r b o E m i t , α j are p parameters to be estimated, β is a vector of a parameter of strictly exogenous estimated covariates, ω is a vector of a parameter of predetermined covariates, v i is the panel-level effect (which may be correlated with the covariates), and ϵ i t is an i.i.d. over the whole sample or come from a low-order moving-average process. The v i and ϵ i t are assumed to be independent for each i over all t .

4. Empirical Results

In this study, the maximum and minimum normalization methods were used to reverse the carbon emission intensity of the original data. The correlation coefficient is Pearson’s coefficient. Fixed-effects random-effects linear models were adopted in regression analysis, and Arellano-Bover/Blundell-Bond estimation with dynamic panel data was adopted to solve the problem of endogeneity. The statistical software is Stata 14.

4.1. Descriptive Results

The carbon emission intensity ranged from 0.001 to 10.96, with an average of 0.533. The average fixed asset ratio was 0.132. The total asset turnover is 0.58, as shown in Table 3. The standard deviation of operating income and assets is large. The logarithmic processing is performed before subsequent analysis.
There is a significant negative correlation between carbon emission performance and fixed asset ratio, with a coefficient of −0.514, which lays the foundation for subsequent regression, as shown in Table 4. The carbon emission performance is also significantly positively correlated with operating revenue, assets, sustainable growth rate, and the share ratio of the top five shareholders, but significantly negatively correlated with ROA and the share ratio of A-shares in circulation. The ratio of fixed assets is significantly positively correlated with the turnover of total assets, with a coefficient of 0.400. The turnover of total assets is significantly positively correlated with ROA, sustainable growth rate, etc.

4.2. Regression Analysis

The fixed-effect linear model and the random-effect model need to be tested and compared in the selection process. Various statistical methods were adopted in this study, including the Wald statistic test of overidentifying restrictions, the Sargan-Hansen statistic, etc., to determine which panel model is more applicable. In fixed-effect linear model estimation, the F test indicates that the individual effect is significant with F (43, 125) = 3.31, p < 0.05. In panel random-effects model estimation, Breusch and Pagan’s Lagrangian multiplier test for random-effects shows that chibar2 (01) = 22.69, p < 0.05. Namely, the random effect was significant. It is necessary to consider individual effects and random effects. A modified Wald test for groupwise heteroskedasticity in a fixed-effect regression model verified that heteroskedasticity existed. The Wald statistic test of overidentifying restrictions and the Sargan-Hansen statistic show that p = 0.1336. The modified Hausman test, robust Hausman test, and bootstrap Hausman test also show that random effects are applied. In the Wooldridge test for autocorrelation in the panel data, F (1, 29) = 327.841, p = 0.0000, there is a first-order autocorrelation. The fit panel-data models by using the GLS (general least squares principle), namely FGLS, show that the coefficient of fixed asset ratio is −0.005, and the coefficient of interaction between fixed asset ratio and asset use efficiency is 0.004, as seen in Table 5. Results showed that the effect of the fixed asset ratio on carbon emission performance is weakened by asset use efficiency.
And the cross-level interaction effect can be seen in Figure 1. When the ratio of fixed assets is low, the higher the efficiency of asset use, the worse the carbon emission performance. When the ratio of fixed assets is higher, the higher the asset utilization efficiency, the better the carbon emission performance. Under the condition of low asset utilization efficiency, carbon emission performance changes more obviously with the change in fixed asset ratio.

4.3. Robustness Check

In theory, the fixed asset ratio and the quick asset ratio are both aspects of asset structure and two aspects of asset liquidity. When the total assets are fixed, the more fixed assets there are, the fewer current assets there may be. That is, there may be a contradictory relationship between the fixed assets and the current assets. Statistically, there was a significant negative correlation between the fixed asset ratio and the quick asset ratio (−0.333), p < 0.001. Replace the fixed asset ratio with the quick asset ratio (QuassRa) in the robustness check. Heteroscedasticity exists (chi2 (45) = 1.1 × 10³2, p = 0.0000). The Wald statistic test of overidentifying restrictions is adopted; Sargan-Hansen statistic p = 0.0132. The fixed-effect model is applicable. The Wooldridge test for autocorrelation in panel data shows that sequence autocorrelation exists, F (1, 29) = 276.202, p = 0.0000. Fit panel-data models using GLS show that the coefficient of quick asset ratio is 0.037 and the coefficient of interaction between quick asset ratio and asset use efficiency (Qua × Tot) is 0.048, as seen in Table 6. Asset use efficiency enhances the promotion effect of a quick asset ratio on carbon emission performance. Due to the negative correlation between the replacement indicator and the original indicator, the influence direction is opposite. That is, the robustness results are consistent with the original conclusions.

4.4. Endogeneity Test

All Ti-5 lags of the dependent variable and lags of the endogenous variables and those of the predetermined variables were taken as instrumental variables, as shown in Table 7. Results showed that conclusions were consistent (see Table 8).
The results show that the carbon emission performance of low-carbon industries is significantly affected by fixed assets and asset utilization efficiency. It is inconsistent with research predictions.

4.5. Further Investigation

From the perspective of carbon emissions, the existence of fixed assets is still an important factor affecting the carbon emissions of enterprises. The reason why asset utilization efficiency weakens the inhibition effect of the fixed asset ratio on carbon emission performance might be associated with corporate growth capabilities, as can be seen in previous estimation results of correlation analysis and regression analysis. Specifically, carbon emission performance is positively correlated with enterprise growth capacity. The growth capacity is positively correlated with asset utilization efficiency but not significantly correlated with asset structure (fixed asset ratio). Moreover, the correlation between asset utilization efficiency and carbon emission performance is not significant. The correlation results are shown in Figure 2.
Therefore, we investigated the relationship between asset structure, asset utilization efficiency, and growth capabilities. Inferred from the enterprise value maximization principle, asset structure and asset utilization efficiency may have a significant effect on corporate growth capabilities. In terms of financing needs and expansion, asset utilization efficiency and growth capabilities will benefit the asset structure. The mechanisms are shown in Figure 3. Since there is a potential positive relationship between growth capabilities and carbon emission performance, we proposed the following hypotheses:
Hypothesis 4 (H4).
Asset utilization efficiency may have a mediating effect on the relationship between asset structure and corporate growth capabilities in low-carbon industries.
Hypothesis 5 (H5).
Corporate growth capability has a mediating effect on the relationship between asset utilization efficiency and asset structure in low-carbon industries.
In the empirical test, a linear model with Ordinary Least Squares (standard error type) was used. The stepwise regression method and the bootstrap method were used to test the mediating effect and obtain robust results. The regression results are seen in Table 9 and Table 10. Mediation effects with asset utilization efficiency accounted for 6.91% of the total effect. Bootstrap (frequency in sampling set at 1000) results show that the bias-corrected confidence interval of the direct effect is [−0.0047, −0.0013], excluding 0. Specifically, the regression coefficient was statistically significant. There is a partial mediation effect. Similarly, the mediating effect of corporate growth capability accounted for −26.993 * 0.072/−9.447 = 20.57%. Bootstrap (frequency in sampling set at 1000) results show that the bias-corrected confidence interval of the direct effect is [−13.1454, −1.5140], excluding 0. There is a partial mediation effect. That is, relationships between asset utilization efficiency and asset structure, or between asset structure and growth capability, are determined, while relationships between asset utilization efficiency and growth capability are dependent on different mechanisms.
These two mechanisms reflect the relationship between growth or enterprise value and carbon emission performance and the relationship between asset structure and carbon emission performance from two perspectives. They both support the standpoint that corporate growth promotes corporate carbon emission performance.

5. Conclusions and Discussion

From the perspective of enterprise asset structure and asset operation efficiency, this study explores the essential impact of asset utilization efficiency and asset structure on the carbon emission performance of low-carbon industries. This study selected samples of Chinese listed companies in low-carbon industries from 2010–2021 and applied equal statistical methods to ensure the robustness of the results and solve the endogeneity problem caused by the self-selection bias.
The inhibitory effect of fixed asset ratio on carbon emission performance and the moderating effect of asset utilization efficiency on the relationship between fixed asset ratio and carbon emission performance were verified in the low-carbon industry. Specifically, asset utilization efficiency weakens the inhibition effect of the fixed asset ratio on carbon emission performance. Hypothesis 1 and hypothesis 3 are verified. Although fixed assets in low-carbon industries do not directly emit more greenhouse gases than those in high-carbon industries, the results of this study still confirm the direct impact of fixed assets on the carbon emission performance of low-carbon industries, which is consistent with the conclusions of previous studies on related factors [39,48,49]. The underlying factor may be indirect carbon emissions from electricity consumption. Fortunately, asset use efficiency can mitigate the negative impact of fixed assets on carbon emission performance. That is, the increase in operating revenue or profit still has a significant impact on the carbon emission performance (derived from the reverse processing of carbon emission intensity data) of the low-carbon industry. In detail, when the ratio of fixed assets is low, the higher the asset utilization efficiency, the worse the carbon emission performance. When the ratio of fixed assets is high, the higher the asset utilization efficiency, the better the carbon emission performance. Under the condition of low asset utilization efficiency, other than high asset utilization efficiency, carbon emission performance changes more obviously with the change in fixed asset ratio.
And the reason why asset utilization efficiency weakens the inhibition effect of the fixed asset ratio on carbon emission performance is associated with corporate growth capabilities, as can be seen in further mechanism investigation from the perspectives of the enterprise value maximization principle and financing needs related to expansion. Hypothesis 4 and hypothesis 5 are verified. They both support the standpoint that corporate growth promotes corporate carbon emission performance. This has certain enlightenment for the low-carbon industry’s carbon (emission) management practice and also reveals the urgency for the government and research institutions to specify the carbon emission levels of different fixed assets. Thus, it is convenient to standardize low-carbon and high-carbon industries for more detailed carbon management and give full play to their own carbon advantages.
Research limitations include small samples and missing variables. Hypothesis 2 has not been verified. That is, the effect of asset utilization efficiency on carbon emission performance is not significant in low-carbon industries. The results of further mechanism research showed a clear relationship between asset utilization efficiency and asset structure and an unclear relationship between firm growth capability and asset utilization efficiency. Therefore, there are at least two mechanisms to be explored (asset utilization efficiency and carbon emission performance as mechanism 1, and growth capability and asset utilization efficiency as mechanism 2). Future research should closely investigate the relationship between factors related to asset utilization efficiency, such as innovation capability (especially valuable in enterprise value enhancement), and carbon emission performance. Moreover, distinguishing between fixed assets directly relevant to production activity and other activities to verify carbon emission resources is important for carbon emission resource segmentation and accurate planning for carbon emission reductions in low-carbon industries.

Author Contributions

Conceptualization, E.D. and J.S.; methodology, software, validation, and formal analysis, E.D.; writing—original draft preparation, E.D., L.Z. and F.C.; investigation and resources, X.Z. and P.L.; writing—review and editing, and supervision, E.D. and J.S. All authors have read and agreed to the published version of the manuscript.

Funding

This article is supported by the Fundamental Research Funds for the Central Universities (2019FR001).

Institutional Review Board Statement

Not applicable.

Informed Consent Statement

Not applicable.

Data Availability Statement

Financial data are from the RESSET database (http://www.resset.cn/). And the carbon emission data are collected from corporate social reports.

Conflicts of Interest

The authors declare no conflict of interest.

References

  1. Li, W.; Wang, W.; Wang, Y.; Ali, M. Historical Growth in Total Factor Carbon Productivity of the Chinese Industry—A Comprehensive Analysis. J. Clean. Prod. 2018, 170, 471–485. [Google Scholar] [CrossRef]
  2. Zhu, C.; Wang, M.; Du, W. Prediction on Peak Values of Carbon Dioxide Emissions from the Chinese Transportation Industry Based on the SVR Model and Scenario Analysis. J. Adv. Transp. 2020, 2020, 8848149. [Google Scholar] [CrossRef]
  3. Jiang, T.; Yang, J.; Huang, S. Evolution and Driving Factors of CO2 Emissions Structure in China’s Heating and Power Industries: The Supply-Side and Demand-Side Dual Perspectives. J. Clean. Prod. 2020, 264, 121507. [Google Scholar] [CrossRef]
  4. Emrouznejad, A.; Yang, G. A Framework for Measuring Global Malmquist–Luenberger Productivity Index with CO2 Emissions on Chinese Manufacturing Industries. Energy 2016, 115, 840–856. [Google Scholar] [CrossRef] [Green Version]
  5. Wang, X.; Zhang, L.; Qin, Y.; Zhang, J. Analysis of China’s Manufacturing Industry Carbon Lock-in and Its Influencing Factors. Sustainability 2020, 12, 1502. [Google Scholar] [CrossRef] [Green Version]
  6. Liu, J.; Wei, D.; Wu, L.; Yang, H.; Song, X. Synergy and Heterogeneity of Driving Factors of Carbon Emissions in China’s Energy-Intensive Industries. Ecol. Indic. 2022, 142, 109161. [Google Scholar] [CrossRef]
  7. Dong, H.; Liu, W.; Liu, Y.; Xiong, Z. Fixed Asset Changes with Carbon Regulation: The Cases of China. J. Environ. Manag. 2022, 306, 114494. [Google Scholar] [CrossRef]
  8. Wang, W.; Zhang, Y.-J. Does China’s Carbon Emissions Trading Scheme Affect the Market Power of High-Carbon Enterprises? Energy Econ. 2022, 108, 105906. [Google Scholar] [CrossRef]
  9. Jiakui, C.; Abbas, J.; Najam, H.; Liu, J.; Abbas, J. Green Technological Innovation, Green Finance, and Financial Development and Their Role in Green Total Factor Productivity: Empirical Insights from China. J. Clean. Prod. 2022, 382, 135131. [Google Scholar] [CrossRef]
  10. Yu, J.; Yu, Y.; Jiang, T. Structural Factors Influencing Energy Carbon Emissions in China’s Service Industry: An Input–Output Perspective. Environ. Sci. Pollut. Res. 2022, 29, 49361–49372. [Google Scholar] [CrossRef]
  11. Jing, M.; Zheng, W. Economic Development Advantages of Low-Carbon Economy under Waterway Transportation. IOP Conf. Ser. Mater. Sci. Eng. 2020, 780, 062029. [Google Scholar] [CrossRef]
  12. He, Z.; Liu, Z.; Wu, H.; Gu, X.; Zhao, Y.; Yue, X. Research on the Impact of Green Finance and Fintech in Smart City. Complexity 2020, 2020, 6673386. [Google Scholar] [CrossRef]
  13. Chen, H.; Long, R.; Niu, W.; Feng, Q.; Yang, R. How Does Individual Low-Carbon Consumption Behavior Occur?—An Analysis Based on Attitude Process. Appl. Eng. 2014, 116, 376–386. [Google Scholar] [CrossRef]
  14. Song, Y.; Li, Y.; Liu, T. Carbon Asset Remolding and Potential Benefit Measurement of Machinery Products in the Light of Lean Production and Low-Carbon Investment. Technol. Forecast. Soc. Chang. 2022, 186, 122166. [Google Scholar] [CrossRef]
  15. Ashraf, N.; Comyns, B.; Tariq, S.; Chaudhry, H.R. Carbon performance of firms in developing countries: The role of financial slack, carbon prices and dense network. J. Clean. Prod. 2020, 253, 119846. [Google Scholar] [CrossRef]
  16. Miah, M.D.; Hasan, R.; Usman, M. Carbon Emissions and Firm Performance: Evidence from Financial and Non-Financial Firms from Selected Emerging Economies. Sustainability 2021, 13, 13281. [Google Scholar] [CrossRef]
  17. Mubeen, R.; Han, D.; Abbas, J.; Hussain, I. The Effects of Market Competition, Capital Structure, and CEO Duality on Firm Performance: A Mediation Analysis by Incorporating the GMM Model Technique. Sustainability 2020, 12, 3480. [Google Scholar] [CrossRef] [Green Version]
  18. Parvin, S.S.; Hossain, B.; Mohiuddin, M.; Cao, Q. Capital Structure, Financial Performance, and Sustainability of Micro-Finance Institutions (MFIs) in Bangladesh. Sustainability 2020, 12, 6222. [Google Scholar] [CrossRef]
  19. Ju, S.; Tang, H. Competition and operating efficiency of manufacturing companies in E-commerce environment: Empirical evidence from Chinese garment companies. Appl. Econ. 2022, 55, 2113–2128. [Google Scholar] [CrossRef]
  20. Santos, E.; Lisboa, I.; Eugénio, T. The Financial Performance of Family versus Non-Family Firms Operating in Nautical Tourism. Sustainability 2022, 14, 1693. [Google Scholar] [CrossRef]
  21. Xu, T.; Kang, C.; Zhang, H. China’s Efforts towards Carbon Neutrality: Does Energy-Saving and Emission-Reduction Policy Mitigate Carbon Emissions? J. Environ. Manag. 2022, 316, 115286. [Google Scholar] [CrossRef] [PubMed]
  22. Wang, H.; Gu, K.; Sun, H.; Xiao, H. Reconfirmation of the Symbiosis on Carbon Emissions and Air Pollution: A Spatial Spillover Perspective. Sci. Total Environ. 2023, 858, 159906. [Google Scholar] [CrossRef]
  23. Yang, Z.; Gao, W.; Han, Q.; Qi, L.; Cui, Y.; Chen, Y. Digitalization and Carbon Emissions: How Does Digital City Construction Affect China’s Carbon Emission Reduction? Sustain. Cites Soc. 2022, 87, 104201. [Google Scholar] [CrossRef]
  24. Avenyo, E.K.; Tregenna, F. Greening Manufacturing: Technology Intensity and Carbon Dioxide Emissions in Developing Countries. Appl. Energy 2022, 324, 119726. [Google Scholar] [CrossRef]
  25. Mirziyoyeva, Z.; Salahodjaev, R. Renewable Energy and CO2 Emissions Intensity in the Top Carbon Intense Countries. Renew. Energy 2022, 192, 507–512. [Google Scholar] [CrossRef]
  26. Pan, X.; Uddin, M.K.; Ai, B.; Pan, X.; Saima, U. Influential Factors of Carbon Emissions Intensity in OECD Countries: Evidence from Symbolic Regression. J. Clean. Prod. 2019, 220, 1194–1201. [Google Scholar] [CrossRef]
  27. Kuo, R.J.; Hsu, C.W.; Chen, Y.L. Integration of Fuzzy ANP and Fuzzy TOPSIS for Evaluating Carbon Performance of Suppliers. Int. J. Environ. Sci. Technol. 2015, 12, 3863–3876. [Google Scholar] [CrossRef] [Green Version]
  28. Li, L.; Fan, F.; Ma, L.; Tang, Z. Energy Utilization Evaluation of Carbon Performance in Public Projects by FAHP and Cloud Model. Sustainability 2016, 8, 630. [Google Scholar] [CrossRef] [Green Version]
  29. Busch, T.; Lewandowski, S. Corporate Carbon and Financial Performance: A Meta-Analysis. J. Ind. Ecol. 2017, 22, 745–759. [Google Scholar] [CrossRef]
  30. Yan, D.; Lei, Y.; Li, L. Driving Factor Analysis of Carbon Emissions in China’s Power Sector for Low-Carbon Economy. Math. Probl. Eng. 2017, 2017, 4954217. [Google Scholar] [CrossRef] [Green Version]
  31. Parthan, B.; Osterkorn, M.; Kennedy, M.; Hoskyns, S.J.; Bazilian, M.; Monga, P. Lessons for Low-Carbon Energy Transition: Experience from the Renewable Energy and Energy Efficiency Partnership (REEEP). Energy Sustain. Dev. 2010, 14, 83–93. [Google Scholar] [CrossRef]
  32. Alam, M.S.; Safiullah, M.; Islam, M.S. Cash-Rich Firms and Carbon Emissions. Int. Rev. Financ. Anal. 2022, 81, 102106. [Google Scholar] [CrossRef]
  33. Clarkson, P.M.; Li, Y.; Richardson, G.D.; Vasvari, F.P. Does It Really Pay to Be Green? Determinants and Consequences of Proactive Environmental Strategies. J. Account. Public Policy 2011, 30, 122–144. [Google Scholar] [CrossRef]
  34. Zhu, B.; Xu, C.; Wang, P.; Zhang, L. How Does Internal Carbon Pricing Affect Corporate Environmental Performance? J. Bus. Res. 2022, 145, 65–77. [Google Scholar] [CrossRef]
  35. Ukhriyawati, C.; Ratnawati, T.; Riyadi, S. The Influence of Asset Structure, Capital Structure, Risk Management and Good Corporate Governance on Financial Performance and Value of the Firm through Earnings and Free Cash Flow as an Intervening Variable in Banking Companies Listed in Indonesia Stock Exchange. Int. J. Proj. Manag. 2017, 12, 249. [Google Scholar] [CrossRef] [Green Version]
  36. Batrancea, I.; Morar, I.-D.; Masca, E.; Catalin, S.; Bechis, L. Econometric Modeling of SME Performance. Case of Romania. Sustainability 2018, 10, 192. [Google Scholar] [CrossRef] [Green Version]
  37. Meng, Q.; Zhou, Y. Enterprise Economic Performance Evaluation Based on 5 G Network and Embedded Processing System. Microprocess. Microsyst. 2021, 80, 103603. [Google Scholar] [CrossRef]
  38. Susan, M. The Impact of Corporate Governance, Capital Structure, Company Size, and Assets Structure on Financial Performance: A Study on the Corporate Governance Perception Index Participants. Int. J. Trade Glob. Mark. 2022, 15, 42. [Google Scholar] [CrossRef]
  39. Muñoz, F. Carbon-Intensive Industries in Socially Responsible Mutual Funds’ Portfolios. Int. Rev. Financ. Anal. 2021, 75, 101740. [Google Scholar] [CrossRef]
  40. Coase, R.H. The Nature of the Firm. Economica 1937, 4, 386–405. [Google Scholar] [CrossRef]
  41. Ganda, F. Carbon Performance, Company Financial Performance, Financial Value, and Transmission Channel: An Analysis of South African Listed Companies. Environ. Sci. Pollut. Res. 2022, 29, 28166–28179. [Google Scholar] [CrossRef] [PubMed]
  42. Lewandowski, S. Corporate Carbon and Financial Performance: The Role of Emission Reductions. Bus. Strategy Environ. 2017, 26, 1196–1211. [Google Scholar] [CrossRef]
  43. Yagi, M.; Managi, S. Decomposition Analysis of Corporate Carbon Dioxide and Greenhouse Gas Emissions in Japan: Integrating Corporate Environmental and Financial Performances. Bus. Strategy Environ. 2018, 27, 1476–1492. [Google Scholar] [CrossRef]
  44. Hanlon, M.; Maydew, E.L.; Saavedra, D. The Taxman Cometh: Does Tax Uncertainty Affect Corporate Cash Holdings? Rev. Account. Stud. 2017, 22, 1198–1228. [Google Scholar] [CrossRef] [Green Version]
  45. Riddick, L.A.; Whited, T.M. The Corporate Propensity to Save. J. Finance 2007, 64, 1729–1766. [Google Scholar] [CrossRef]
  46. Hoffmann, V.H.; Busch, T. Corporate Carbon Performance Indicators. J. Ind. Ecol. 2008, 12, 505–520. [Google Scholar] [CrossRef]
  47. Akguc, S.; Al Rahahleh, N. Effect of Shariah Compliance on Operating Performance: Evidence from GCC Countries. Emerg. Mark. Financ. Trade 2018, 54, 2874–2896. [Google Scholar] [CrossRef]
  48. Huang, J. Corporate Social Responsibility and Financial Performance: The Moderating Role of the Turnover of Local Officials. Finance Res. Lett. 2021, 46, 102497. [Google Scholar] [CrossRef]
  49. Nishitani, K.; Kaneko, S.; Komatsu, S.; Fujii, H. How Does a Firm’s Management of Greenhouse Gas Emissions Influence Its Economic Performance? Analyzing Effects through Demand and Productivity in Japanese Manufacturing Firms. J. Product. Anal. 2014, 42, 355–366. [Google Scholar] [CrossRef]
  50. Yu, P.; Hao, R.; Cai, Z.; Sun, Y.; Zhang, X. Does Emission Trading System Achieve the Win-Win of Carbon Emission Reduction and Financial Performance Improvement?—Evidence from Chinese A-Share Listed Firms in Industrial Sector. J. Clean. Prod. 2022, 333, 130121. [Google Scholar] [CrossRef]
  51. Chen, Y.; Xu, Z.; Zhang, Z.; Ye, W.; Yang, Y.; Gong, Z. Does the Carbon Emission Trading Scheme Boost Corporate Environmental and Financial Performance in China? J. Clean. Prod. 2022, 368, 133151. [Google Scholar] [CrossRef]
  52. Alvarez, I.G. Impact of CO2 Emission Variation on Firm Performance. Bus. Strategy Environ. 2012, 21, 435–454. [Google Scholar] [CrossRef]
  53. Trumpp, C.; Guenther, T. Too Little or Too Much? Exploring U-Shaped Relationships between Corporate Environmental Performance and Corporate Financial Performance. Bus. Strategy Environ. 2015, 26, 49–68. [Google Scholar] [CrossRef]
  54. de Lima, C.R.M.; Barbosa, S.B.; de Castro Sobrosa Neto, R.; Bazil, D.G.; de Andrade Guerra, J.B.S.O. Corporate Financial Performance: A Study Based on the Carbon Efficient Index (ICO2) of Brazil Stock Exchange. Environ. Dev. Sustain. 2021, 24, 4323–4354. [Google Scholar] [CrossRef]
  55. Lee, K.-H.; Min, B.; Yook, K.-H. The Impacts of Carbon (CO2) Emissions and Environmental Research and Development (R&D) Investment on Firm Performance. Int. J. Prod. Econ. 2015, 167, 1–11. [Google Scholar] [CrossRef]
  56. Wang, L.; Li, S.; Gao, S. Do Greenhouse Gas Emissions Affect Financial Performance?—An Empirical Examination of Australian Public Firms. Bus. Strategy Environ. 2013, 23, 505–519. [Google Scholar] [CrossRef]
  57. Sohl, T.; Vroom, G.; McCann, B.T. Business Model Diversification and Firm Performance: A Demand-Side Perspective. Strateg. Entrep. J. 2020, 14, 198–223. [Google Scholar] [CrossRef]
  58. Shrivastava, P. Environmental Technologies and Competitive Advantage. Strateg. Manag. J. 1995, 16, 183–200. [Google Scholar] [CrossRef]
  59. Freeman, R.E. Strategic Management; Cambridge University Press: Cambridge, UK, 2009. [Google Scholar] [CrossRef]
  60. Delmas, M.A.; Nairn-Birch, N.; Lim, J. Dynamics of Environmental and Financial Performance. Organ. Environ. 2015, 28, 374–393. [Google Scholar] [CrossRef]
  61. Hart, S.L.; Ahuja, G. Does It Pay to Be Green? An Empirical Examination of the Relationship between Emission Reduction and Firm Performance. Bus. Strategy Environ. 1996, 5, 30–37. [Google Scholar] [CrossRef]
  62. Hughes, K.E., II; Reynolds, J.K. Uncertainty Associated with Future Environmental Costs and the Market’s Differential Response to Earnings Information. J. Bus. Financ. Account. 2001, 28, 1351–1386. [Google Scholar] [CrossRef]
  63. Ichsani, S.; Zaenudin, A.I.N.; Damayanti, G.N.; Tresia, V.; Putri, V.A. The Effect of Financial Ratio on Firm Value: Empirical Evidence from Listed Firms in the IDX30 Index. J. Asian Financ. Econ. Bus. 2021, 8, 103–112. [Google Scholar] [CrossRef]
  64. Ritchie, H.; Roser, M.; Rosado, P. CO2 and Greenhouse Gas Emissions. Our World in Data. 2020. Available online: https://ourworldindata.org/co2-and-greenhouse-gas-emissions (accessed on 2 April 2023).
  65. Shan, Y.; Guan, D.; Zheng, H.; Ou, J.; Li, Y.; Meng, J.; Mi, Z.; Liu, Z.; Zhang, Q. China CO2 emission accounts 2016–2017. Sci Data 2020, 7, 54. [Google Scholar] [CrossRef] [PubMed] [Green Version]
  66. Belkhir, L.; Bernard, S.; Abdelgadir, S. Does GRI Reporting Impact Environmental Sustainability? A Cross-Industry Analysis of CO2 Emissions Performance between GRI-Reporting and Non-Reporting Companies. Manag. Environ. Qual. Int. J. 2017, 28, 138–155. [Google Scholar] [CrossRef]
  67. Greenhouse Gas Protocol. 2015. Available online: https://ghgprotocol.org/sites/default/files/standards/ghg-protocol-revised.pdf (accessed on 12 December 2022).
  68. Shahnia, C.; Purnamasari, E.D.; Hakim, L.; Endri, E. Determinant of Profitability: Evidence from Trading, Service and Investment Companies in Indonesia. Accounting 2020, 6, 787–794. [Google Scholar] [CrossRef]
  69. Hussein Alsufy, F.J. The Impact of Capital Structure Components on the Total Assets Turnover: Evidence from Amman Stock Exchange. Int. Bus. Res. 2019, 12, 71. [Google Scholar] [CrossRef]
  70. Alessi, L.; Ossola, E.; Panzica, R. What Greenium Matters in the Stock Market? The Role of Greenhouse Gas Emissions and Environmental Disclosures. J. Financ. Stab. 2021, 54, 100869. [Google Scholar] [CrossRef]
  71. Zhang, T. The Impact of Carbon Emission Constraints to Enterprise Performance Based on Threshold Regression. Master’s Thesis, Shandong Normal University, Jinan, China, 2015. [Google Scholar] [CrossRef]
  72. Zhang, W.; Lin, W.; Li, Z. How the Growth Rate Influences Low-Carbon Sustainable Production Performance under Different Disposabilities in China’s Manufacturing Industries? J. Clean. Prod. 2020, 249, 119349. [Google Scholar] [CrossRef]
  73. Cong, Y.; Freedman, M. Corporate Governance and Environmental Performance and Disclosures. Adv. Account. 2011, 27, 223–232. [Google Scholar] [CrossRef]
Figure 1. The cross-level interaction effect.
Sustainability 15 06264 g001
Figure 2. Correlation estimations.
Sustainability 15 06264 g002
Figure 3. Mechanism potential.
Sustainability 15 06264 g003
Table 1. Samples’ description.
SectorsFrequencyPercentCumulation
Gas production and supply industry42.232.23
Food manufacturing industry42.234.47
Wine, beverage, and refined tea manufacturing industry52.797.26
Ferrous metals mining and dressing63.3510.61
Manufacture of general machinery1810.0620.67
Manufacture of medicines95.0325.70
Metal products manufacturing52.7928.49
Car industry105.5934.08
Non-ferrous metal mining and dressing105.5939.66
Manufacture of electrical machinery and equipment95.0344.69
Manufacture of instruments and meters42.2346.93
Manufacture of electronic equipment2111.7358.66
Water production and supply52.7961.45
Financial industry5027.9389.39
Chemical fiber manufacturing industry31.6891.06
Special purpose equipment 147.8298.88
Transportation equipment21.12100.00
Total179100.00
Table 2. Description of variables.
VariablesProxy VariablesSymbolicsExplanations
Explained variableCarbon Emission PerformanceCarbon Emission Intensity (Contrary indicator) CarboEmCorporate emission advantage in the process of applying low-carbon technologies, energy restructuring, low-carbon projects, and so on.
Explanatory variablesAsset structureFixed asset ratioFixedRaLong-term occupation of capital and measured by the ratio of fixed assets to total assets.
Asset utilization efficiencyTotal asset turnover ratioTotalRaThe match between asset investment scale and sales.
Control variablesSizeAssetAssetResources formed by past transactions or events of the enterprise, owned or controlled by the enterprise, and expected to bring economic benefits to the enterprise.
ProfitabilityOperating incomeSales Income from the main business or other businesses.
Return on total assetsROARatio of net profit to average total assets.
Growth capabilitiesSustainable growth rateSustaGr(current net profit/beginning shareholders’ equity) × current earnings retention rate.
Equity concentrationShareholding ratio of the first largest shareholderShareRa1The shareholding distribution of major shareholders can measure the shareholding structure and stability of the company.
SR of the top 5 shareholders ShareRa5
Stock liquidityProportion of tradable A-sharesTradaSPRMB ordinary stocks.
Table 3. Estimation of Variables.
VariablesObsMeanStd. Dev.MinMax
CarboEm1790.5331.7180.00110.96
FixedRa1790.1320.1260.0010.487
TotalRa1790.580.5030.0241.814
Sales (a million yuan)179723.521162.00518.3658242.46
Asset (a million yuan)17912,104.71336,348.17856.345221,244
ROA1790.0360.04−0.1360.141
SustaGr1790.0780.088−0.3950.299
ShareRa11790.4010.1790.1210.885
ShareRa51790.6700.1780.3040.988
TradaSP1791.1364.9066.274
Table 4. Correlation coefficients.
Variables(1)(2)(3)(4)(5)(6)(7)(8)(9)(10)
(1) CarboEm1.000
(2) FixedRa−0.514 ***1.000
(0.000)
(3) TotalRa0.0970.400 ***1.000
(0.197)(0.000)
(4) Sales0.422 ***−0.301 ***0.0091.000
(0.000)(0.000)(0.900)
(5) Asset0.313 ***−0.581 ***−0.576 ***0.752 ***1.000
(0.000)(0.000)(0.000)(0.000)
(6) ROA−0.196 ***0.287 ***0.447 ***−0.044−0.271 ***1.000
(0.009)(0.000)(0.000)(0.544)(0.000)
(7) SustaGr0.322 ***−0.1400.288 ***0.280 ***0.1050.602 ***1.000
(0.000)(0.062)(0.000)(0.000)(0.162)(0.000)
(8) ShareRa10.042−0.131 *0.200 ***0.024−0.0590.0500.149 **1.000
(0.578)(0.081)(0.007)(0.749)(0.430)(0.502)(0.047)
(9) ShareRa50.210 ***−0.303 ***−0.0180.1200.151 **−0.0730.142 *0.778 ***1.000
(0.005)(0.000)(0.806)(0.111)(0.044)(0.331)(0.058)(0.000)
(10) TradaSP−0.252 ***0.196 ***0.072−0.260−0.2710.118−0.141−0.247−0.4651.000
(0.001)(0.009)(0.336)(0.000)(0.000)(0.117)(0.061)(0.001)(0.000)
*** p < 0.01, ** p < 0.05, * p < 0.1.
Table 5. Regression results.
(1) Fixed-Effect Model 1(2) Random-Effect Model 1(3) FGLS (Feasible General Least Square Estimation) Model 1
VariablesCarboEm
FixedRa−0.001−0.005 ***−0.003 ***
(−0.58)(−4.59)(−4.63)
TotalRa0.0070.0030.024
(0.05)(0.05)(1.14)
Fix × Tot0.009 *0.009 ***0.004 ***
(1.97)(3.84)(2.74)
Sales0.0710.076 **0.018 *
(1.08)(2.44)(1.84)
Asset−0.030−0.057 **−0.014 *
(−0.40)(−2.12)(−1.68)
ROA−0.019 **−0.017 ***−0.005 **
(−2.37)(−4.53)(−2.41)
SustaGr0.473 **0.461 ***0.127 **
(2.14)(4.13)(2.32)
ShareRa10.054−0.220 *−0.059
(0.22)(−1.66)(−1.28)
ShareRa50.3600.283 **0.067
(1.21)(2.06)(1.45)
TradaSP0.0010.0010.000
(1.30)(0.88)(0.39)
Constant0.1500.572 ***0.888 ***
(0.32)(3.81)(15.19)
Observations179179171 (8 observations dropped because only 1 obs in group)
R-squared(within)0.1180.087
Number of idcode444436
idcode FEYESYESYES
year FEYESYESYES
t-statistics in parentheses. *** p < 0.01, ** p < 0.05, * p < 0.1.
Table 6. Robustness regression.
(1) Fixed-Effect Model 1(2) Random-Effect Model 1(3) FGLS (Feasible General Least Square Estimation) Model 1
VariablesCarboEm
QuassRa0.0250.075 **0.037 ***
(0.53)(2.45)(3.13)
TotalRa0.0560.169 **0.061 **
(0.41)(2.23)(2.47)
Qua × Tot0.0060.111 *0.048 **
(0.07)(1.79)(2.24)
Sales0.1060.008−0.002
(1.62)(0.25)(−0.21)
Asset−0.0820.0150.010
(−1.24)(0.54)(1.29)
ROA−0.015 *−0.022 ***−0.008 ***
(−1.95)(−5.13)(−3.29)
SustaGr0.369 *0.600 ***0.175 ***
(1.71)(4.84)(3.01)
ShareRa10.002−0.280 *−0.117 **
(0.01)(−1.92)(−2.18)
ShareRa50.3710.305 **0.101 *
(1.23)(2.01)(1.87)
TradaSP0.001−0.000−0.000
(1.04)(−0.05)(−0.48)
Constant0.3280.2090.739 ***
(0.76)(1.43)(11.41)
Observations179179171 (8 observations dropped because there was only 1 obs in the group)
R-squared0.094 0.047
Number of idcode444436
idcode FEYESYESYES
Year FEYESYESYES
t-statistics in parentheses. *** p < 0.01, ** p < 0.05, * p < 0.1.
Table 7. Instrumental variables.
InstrumentsGMM-TypeStandard
For difference equationsL (2/.).CarboEm L(1/.).ShareRa1 L(1/.).ShareRa5 L(1/.).TradaSP L(2/.).SustaGr L(2/.).Sales L(2/.).ROAD.TotalRa D.FixedRa D. Fix × Tot D.Sales D.Asset D.ROA D.SustaGr D.ShareRa1 D.ShareRa5 D.TradaSP
For level equationsLD.CarboEm D.ShareRa1 D.ShareRa5 D.TradaSP LD.SustaGr LD.Sales LD.ROA_cons
Table 8. Regression results.
Arellano-Bover/Blundell-Bond Panel Dynamic Data Model 2
VariablesCarboEm
L0.732 ***
(21.55)
0.786 ***
(23.28)
L20.345 ***
(2.68)
0.097
(1.06)
L3−0.334 **
(−2.50)
−0.146 **
(−2.40)
FixedRa−0.002 ***
(−4.89)
-
QuassRa-0.020
(0.98)
TotalRa0.004
(0.12)
-
Fix *Tot0.002 **
(2.44)
-
Qua *Tot-0.055 **
(2.55)
Sales0.020
(1.62)
0.001
(0.13)
L1Sales −0.009
(−1.50)
Asset−0.017
(−1.54)
0.007
(1.53)
ROA−0.004 ***
(−3.16)
−0.011 ***
(−4.93)
L1ROA-0.004 **
(2.36)
SustaGr−0.115 **
(−2.52)
0.124 *
(1.72)
L1SustaGr-0.001
(0.01)
ShareRa10.003
(0.08)
−0.098 **
(−2.52)
L1ShareRa1-0.062 **
(2.04)
ShareRa50.007
(0.39)
0.04
(1.01)
L1ShareRa5-−0.049
(−1.30)
TradaSP0
(−0.78)
0.002 *
(1.70)
L1TradaSP-−0.002
(−1.57)
Constant0.364 ***
(9.77)
0.166 **
(2.24)
Mean dep0.9590.959
SD dep 0.1160.116
Number of obs5353
Number of instruments6262
Chi-square193,200.636694,132.917
Arellano-Bond test ZAR12Z= −0.920, p = 0.3572Z = −1.380, p = 0.168
Sargan test OVRIDchi2
(48) = 25.301, p = 0.997
chi2
(42) = 19.078, p = 0.999
t-statistics in parentheses. *** p < 0.01, ** p < 0.05, * p < 0.10.
Table 9. Regression results of the mediating effect of asset utilization efficiency.
Linear Model (with Ordinary Least Squares)
SustaGrTotalRaSustaGr
FixedRa−0.003 ***−0.005 ***−0.003 ***
(0.001)(0.002)(0.001)
TotalRa 0.045
(0.034)
Sales0.030 ***0.373 ***0.014
(0.009)(0.020)(0.015)
Asset−0.009−0.326 ***0.006
(0.007)(0.016)(0.013)
ROA0.021 ***0.018 ***0.020 ***
(0.002)(0.004)(0.002)
ShareRa10.0100.323 **−0.004
(0.069)(0.155)(0.069)
ShareRa50.022−0.1800.030
(0.076)(0.171)(0.076)
TradaSP−0.001 *−0.001−0.001
(0.000)(0.001)(0.000)
_cons0.515 ***0.753 ***0.482 ***
(0.075)(0.170)(0.079)
N179.000179.000179.000
r20.5360.8220.541
Standard errors in parentheses. * p < 0.1, ** p < 0.05, *** p < 0.01.
Table 10. Regression results from the mediating effect of corporate growth capability.
Linear Model (with Ordinary Least Squares)
FixedRaSustaGrFixedRa
TotalRa−9.447 ***0.072 **−7.494 **
(3.279)(0.034)(3.196)
SustaGr--−26.993 ***
--(7.050)
Sales6.122 ***−0.0046.001 ***
(1.463)(0.015)(1.408)
Asset−7.507 ***0.028 **−6.756 ***
(1.153)(0.012)(1.127)
ROA0.409 **0.019 ***0.924 ***
(0.182)(0.002)(0.221)
ShareRa10.913−0.0070.721
(6.905)(0.072)(6.645)
ShareRa5−16.500 **0.079−14.372 **
(7.420)(0.077)(7.162)
TradaSP−0.039−0.001−0.054
(0.041)(0.000)(0.040)
_cons48.188 ***0.340 ***57.363 ***
(6.973)(0.073)(7.125)
N179.000179.000179.000
r20.4630.5020.506
Standard errors in parentheses. ** p < 0.05, *** p < 0.01.
Disclaimer/Publisher’s Note: The statements, opinions and data contained in all publications are solely those of the individual author(s) and contributor(s) and not of MDPI and/or the editor(s). MDPI and/or the editor(s) disclaim responsibility for any injury to people or property resulting from any ideas, methods, instructions or products referred to in the content.

