Article

A Numerical Method for Conformal Mapping of Closed Box Girder Bridges and Its Application

1
Department of Bridge Engineering, Southwest Jiaotong University, Chengdu 610031, China
2
China 19th Metallurgical Corporation, Chengdu 610031, China
*
Author to whom correspondence should be addressed.
Sustainability 2023, 15(7), 6291; https://doi.org/10.3390/su15076291
Submission received: 6 January 2023 / Revised: 21 February 2023 / Accepted: 3 April 2023 / Published: 6 April 2023

Abstract

:
Conformal mapping has achieved many successes in engineering. It can help to solve some complex fluid flow problems. This study proposed a numerical method for conformal mapping of closed box girder bridges and applied it to flutter performance prediction, which is crucial for ensuring the safety and sustainability of bridge structures. The characteristics of conformal mapping coefficients for the closed box were investigated. Thereafter, a numerical method through searching the conformal mapping coefficients was presented. The results show that the proposed numerical method has a smaller error in the existing research. The conformal mapping of six practical bridges agrees well with the closed box girder shapes, indicating the validity of the proposed method. The flutter prediction results by the proposed method are consistent with the wind tunnel test. The conformal mapping and flutter calculations took no more than ten seconds, showing high computing efficiency. This method is easier to understand and implement without complex mathematical derivation, which is helpful for the extensive application of conformal mapping in bridge engineering.

1. Introduction

Bridge structures are a critical component of transportation infrastructure and have a significant impact on the sustainability of society, the economy, and the environment. The growing length of the bridge span makes the wind action gradually become the key factor in bridge design [1,2]. During the entire life cycle, bridges can experience violent vibrations and sustain serious damages due to unsteady wind loads [3,4], compromising their structural safety and undermining their sustainability. At present, wind tunnel tests and computational fluid dynamics simulation are the prevailing methods used to determine the wind load on structures [5,6,7]. However, both methods have their limitations: wind tunnel tests can be costly, while CFD simulation is time-consuming. The conformal mapping method offers a more efficient approach to analyzing wind force. Therefore, it is of great significance to study the conformal mapping of closed box girders.
Conformal mapping is an outstanding method of analysis with many successful applications in engineering. Many complicated problems, for instance, the fluid flow problem, can be simplified by mapping a complex domain to a regular region. The Joukowski transformation is one of the conformal mappings which helps obtain the flows around airfoils [8,9]. Poozesh and Mirzaei [10] applied the Joukowski transform to quickly generate a mesh grid for flow simulations around airfoils. Malonek and De Almeida [11] proposed a generalized Joukowski transformation mathematical model with high dimensions. In addition, conformal mapping was employed to analyze the stress distributions of solid structures. Jia et al. [12] proposed an analytical function expressed as a power series to compute the gravity-induced underground stress distribution of the elastic half-plane with slope. The results produced by the analytical model are consistent with the numerical solution. Kuliyev [13] presented a conformal mapping function to determine the stress–strain state of the bending beam. The majority of conventional conformal mappings concentrate on the mappings on a planar domain. Gu et al. [14] introduced conformal mapping on three-dimensional objects. In addition, conformal mapping also achieves great success in hydrodynamics [15], heat transfer [16], and electromagnetics [17] fields.
There are many studies that focus on the conformal mapping of closed-form shape bodies. Natarajan et al. [18] proposed a numerical conformal mapping method on arbitrary polygonal inner domains, which does not need a two-level isoparametric mapping. Wang et al. [19] presented a mathematical method based on the Schwarz–Christoffel transform [20] and successfully mapped the strip polygon to a rectangular region. The shape of a closed box girder in bridge engineering commonly takes the form of a symmetrical convex hexagon. It is one of the two main girder types of long-span bridges. Wu et al. [21] derived a direct iteration expression for conformal mapping of the closed box girder, which does not need to mutually interpolate between even and odd points. The initial iteration points were defined through an ellipse transformation. Nevertheless, there are many complicated mathematical derivations in the existing conformal mapping methods. Furthermore, in order to minimize mapping errors, a larger number of series is often required.
To ensure the sustainability of bridges throughout their lifecycle, it is crucial to determine the structural wind loads. This study presents a numerical method for calculating the conformal mapping of closed box girders, which is simple to understand and implement due to the absence of complex derivation. Using the numerical method, the flutter performance of closed box girders was analyzed. The paper is organized as follows. In Section 2, the characteristics of the conformal mapping coefficients were analyzed. Afterward, the numerical method was proposed and verified in Section 3. Section 4 investigated the application of the numerical method in flutter performance estimation. Finally, some main conclusions of this study were summarized.

2. Characteristics of the Conformal Mapping Coefficients

Conformal mapping uses functions of complex variables to map one region of the complex plane onto another region that is easier to analyze. The conformal mapping function from a unit circle to a closed box girder is shown in Figure 1, which can be expressed as the Laurent series [21]:
z = k = 1 n c k ζ 2 k ,
where z and ζ are points on the closed box and unit circle, respectively; c k = a k + i b k (k = 1,2,…,n) is the conformal mapping coefficient; n is the series number.
The points on the unit circle can be expressed as ζ = cosθ + i sinθ, where θ denotes the phase angle. Substituting it into Equation (1), then we obtain:
x = k = 1 n a k cos 2 k θ b k sin 2 k θ ,
y = k = 1 n a k sin 2 k θ + b k cos 2 k θ .
For a long-span bridge, the shape of the closed box is usually symmetrical with respect to the y-axis. Thus, we can always find a point z 2 = x 2 + i y 2 , which is the symmetry of the other point z 1 = x 1 + i y 1 about the y-axis. That is, we have x 1 = − x 2 and y 1 = y 2 . Assume that the arguments of their mapping points on the unit circle are θ 1 and θ 2 . Substituting θ 2 = π − θ 1 into Equation (2), we have:
x 1 = k = 1 n a k cos 2 k θ 1 b k sin 2 k θ 1 ,
y 1 = k = 1 n a k sin 2 k θ 1 + b k cos 2 k θ 1 ,
x 2 = k = 1 n cos k π a k cos 2 k θ 1 + b k sin 2 k θ 1 ,
y 2 = k = 1 n cos k π a k sin 2 k θ 1 + b k cos 2 k θ 1 .
To investigate the characteristics of conformal mapping coefficients a k and b k , add x 1 and x 2 , then we have:
x 1 + x 2 = k = 1 n a k cos 2 k θ 1 b k sin 2 k θ 1 + k = 1 n a k cos 2 k π θ 1 b k sin 2 k π θ 1 = 1 + cos 2 k π k = 1 n a k cos 2 k θ 1 1 cos 2 k π k = 1 n b k sin 2 k θ 1
When k is an even number, x 1 + x 2 = 2 k = 1 n a k cos 2 k θ 1 = 0 is true for any k only if a k = 0. On the contrary, when k is an odd number, x 1 + x 2 = 2 k = 1 n b k sin 2 k θ 1 = 0 is true for any k only if b k = 0. Therefore, c k = a k is true when k is an odd number, or c k = i b k is true when k is an even number. The same conclusion can also be obtained through the calculation of y 1 y 2 = 0.
The Great Belt East Bridge (GBEB) [22], a long-span suspension bridge located in Danmark with a main span length of 1624 m, is one of the most famous bridges in the world. The shape of the closed box girder of GBEB, which has a width of 31.0 m and a height of 4.4 m, respectively, was selected to verify the above finding. The conformal mapping coefficients when n = 10 are listed in Table 1 based on the Direct Iteration Conformal Mapping method (DICM) by Wu et al. [21]. Upon analyzing the results, it was observed that the values of a k converge to zero when k is an even number, and the values of b k tend towards zero when k is an odd number. These results provide strong evidence that the conclusion drawn previously is indeed valid.
Through Table 1, we also found that the absolute values of a k and b k generally decrease with the increase of k. Meanwhile, the coefficients a 1 and a 3 are close to (B + H)/4 and (B − H)/4, respectively, where B and H are the width and height of the closed box. To study the range of a k and b k , 493 thousand box girders are generated to calculate Equation (1). The sizes of these box girders were B [15, 60], H [2.5, 6.0], Bu [0.75B, B], B d 0.2 B u , B u , and H d 0.5 H , H 0.5 B u tan 0.02 , where B u is the width of the upper deck of the closed box, B d is the width of the lower deck of the closed box, and H d is the height from the triangular fairing to the lower deck of the closed box, as displayed in Figure 2. The shapes of these box girders almost include all possible closed box girder designs.
The results of a k and b k (k ≤ 50) are rendered in Figure 3. However, since the values of coefficients a 1 and a 3 exceed those of the other coefficients, they are not included in Figure 3. Instead, they will be analyzed in greater detail below. It is noted that a k range between −1 and 1 when k ≥ 5, while b k ranges from −2 and 2 when k ≥ 2. The range of a k and b k are limited and substantially diminishing with the increase of k. This can be attributed to the decreasing index of the Laurent series in Equation (1), which causes ζ2−k to grow exponentially. As a result, a k and b k must be reduced in order to counteract this effect and maintain equilibrium.
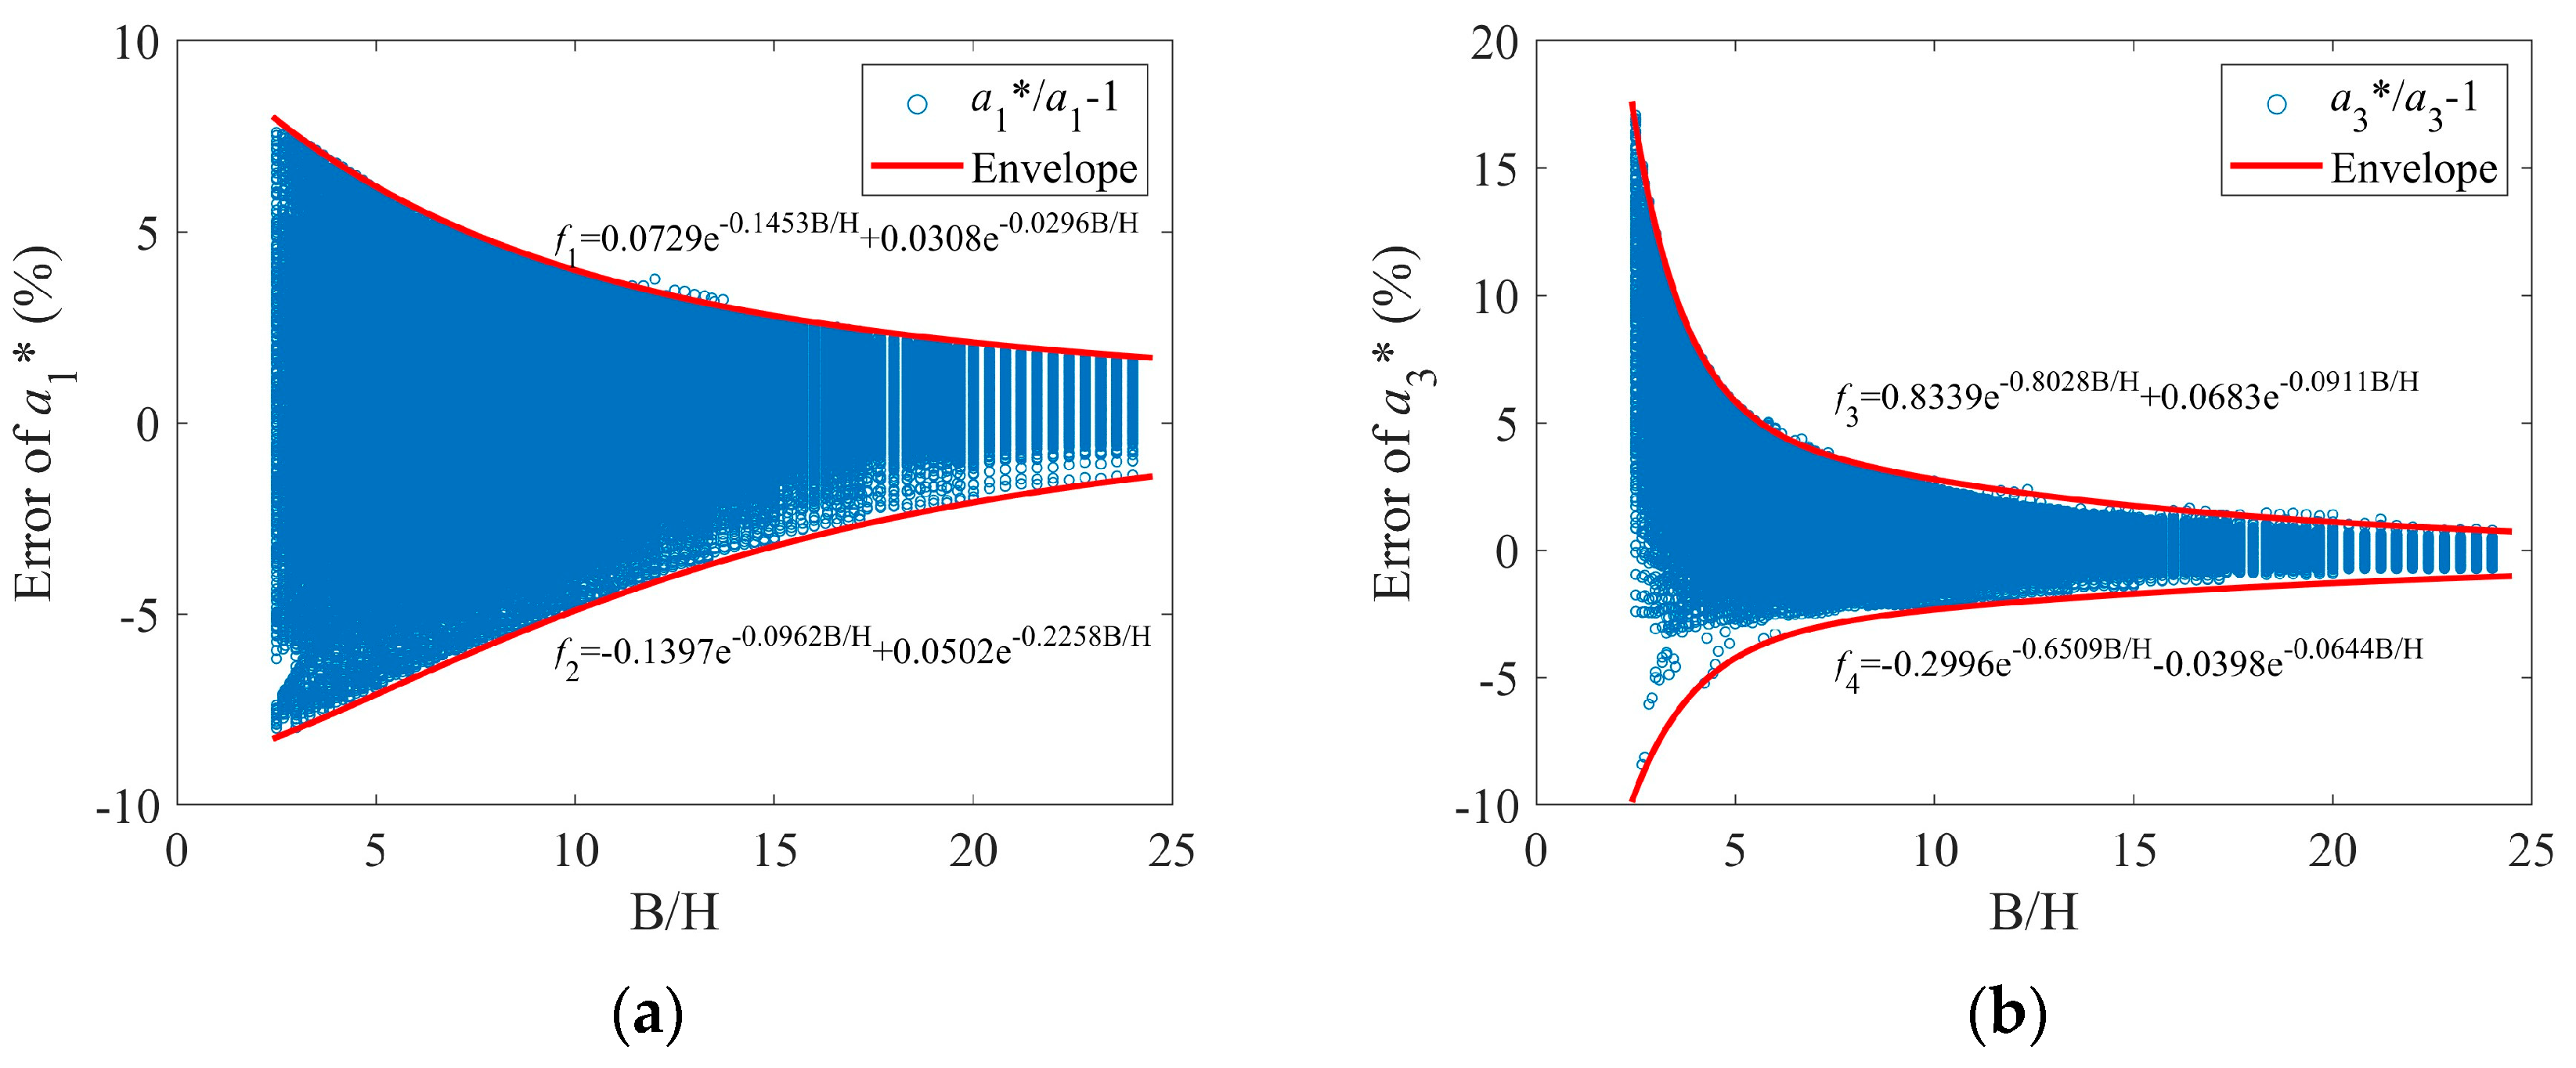
To study the characteristics of a 1 and a 3 , let a 1 = W + H 4 , a 3 = W H 4 . Divide a 1 and a 3 by a 1 * and a 3 * , respectively. The percentage error of a 1 * and a 3 * are shown in Figure 4. The results indicate that, in most cases, the error of a 1 * and a 3 * remains within ±5%, especially when the aspect ratio B/H is larger than 10, implying a high level of accurate prediction. Moreover, as the aspect ratio B/H increases, the distribution range of the error for a 1 * and a 3 * gradually becomes narrower. The envelope of the error distribution can be expressed as Equation (9). To facilitate further analysis, the range of conformal mapping coefficients is listed in Table 2.
f 1 = 0.0729 e 0.1453 B / H + 0.0308 e 0.0296 B / H ,
f 2 = 0.1397 e 0.0962 B / H + 0.0502 e 0.2258 B / H ,
f 3 = 0.8339 e 0.8028 B / H + 0.0683 e 0.0911 B / H ,
f 4 = 0.2996 e 0.6509 B / H 0.0398 e 0.0644 B / H .

3. Numerical Method for Conformal Mapping Coefficients

3.1. Dichotomy Method

On the basis of the Riemann Mapping Theorem [23], there exists a unique conformal mapping between the unit circle and the closed box girder. Therefore, it is possible to find the optimal combinations of a k and b k for Equation (1) by searching coefficients within the range in Table 2.
According to the formula of distance from a point to a line segment, we have:
ε m c k = k = 1 n A cos 2 k θ m + B sin 2 k θ m A 2 + B 2 ,
where ε m denotes the distance from a mapping point to the boundary of the closed box, and A and B denote the coefficients of the line segment equation. For a specific mapping point, ε m c k is a constant, which means that the position of this point is linearly related to coefficients a k and b k . Hence, there exists a unique point with the minimum distance from the boundary of the bridge box girder when we search a particular coefficient of a k and b k . To find this point, the Dichotomy Method (DM) is a good choice. However, due to different phase angles θ m , the maximum ε m of all points is no longer linearly related to the coefficient a k and b k . The DM may miss the final optimal solution in the process of iteration, as shown in Figure 5. The blue points denote the endpoints of the search interval. The orange points indicate the optimal solution of a k and b k in the current search interval. The green points represent the final optimal solution for n = 50 in Equation (1) by DICM [21]. In the l iteration, the combination of a k and b k with the minimum ε m a x is chosen, which are marked by red points as they are closer to the orange points. However, the orange and green points may have large errors, resulting in the computation of an incorrect interval in the next iteration, such as c j + 1 .
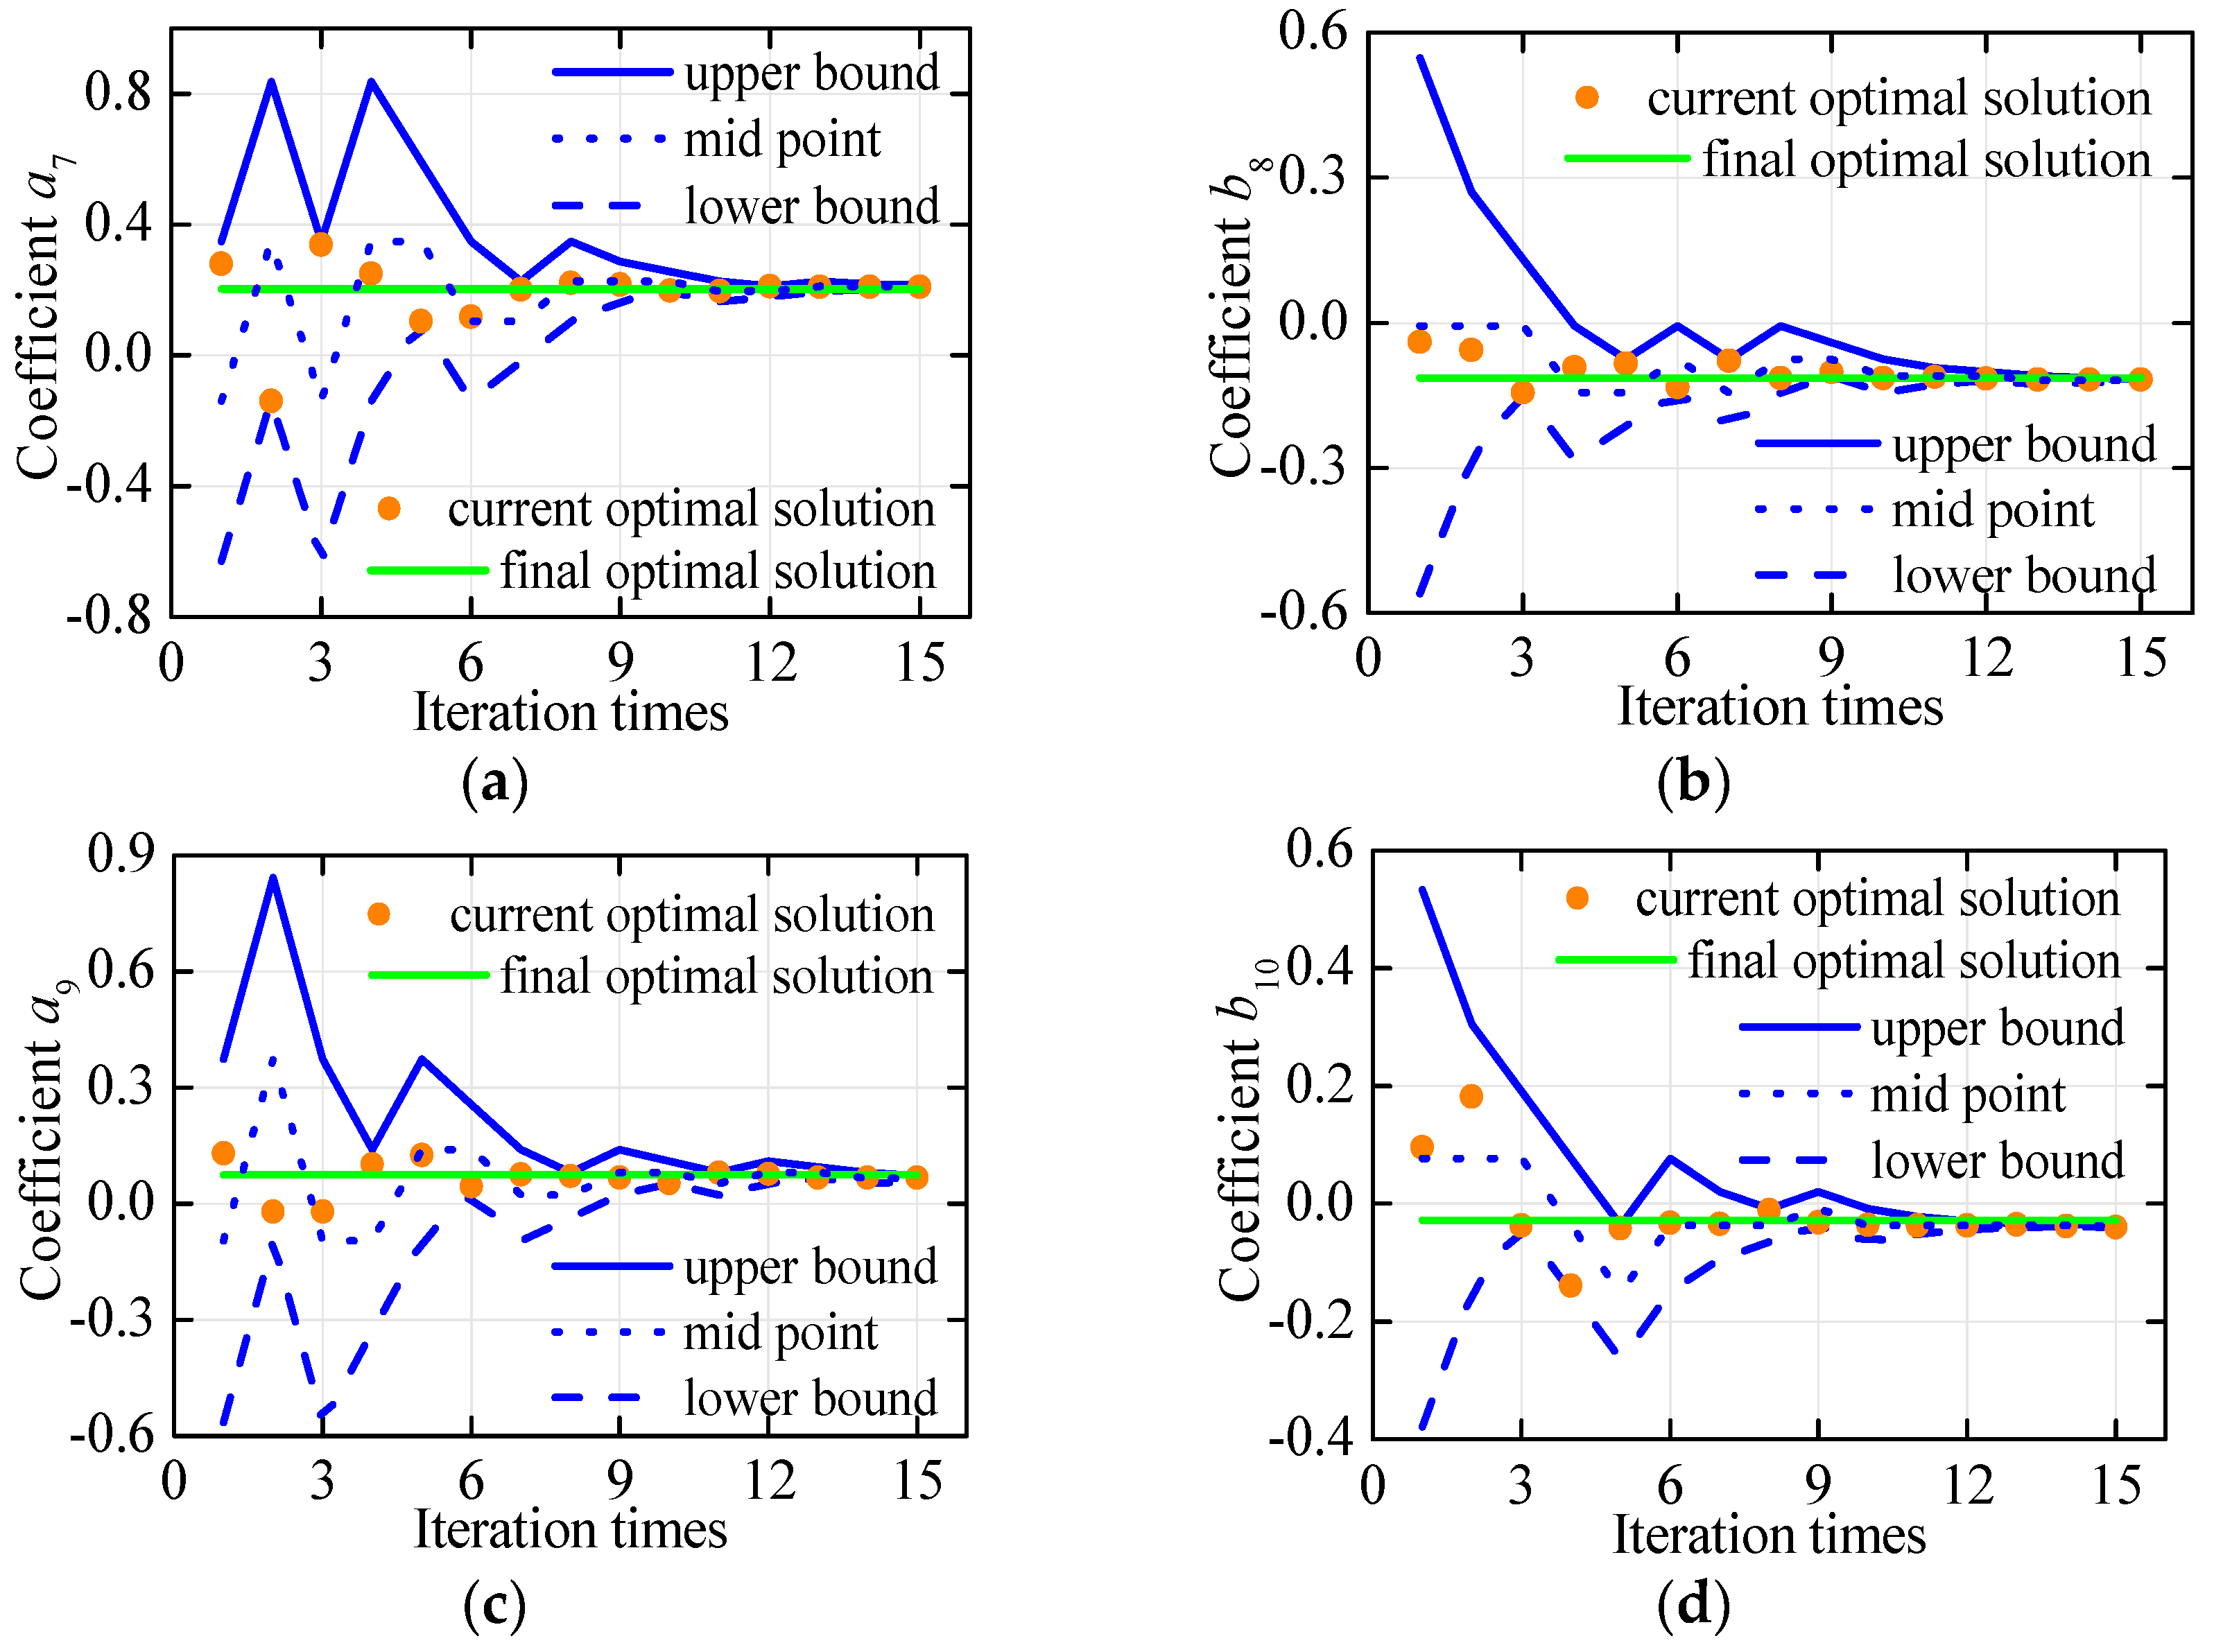
The search histories of the coefficients a 7 to b 10 by the DM are revealed in Figure 6. After conducting no more than five iterations, it has been observed that the search intervals of various coefficients tend to deviate from the final optimal solution and cannot be corrected back. This phenomenon is a result of a flaw in the DM process, as shown in the c j + 1 process illustrated in Figure 5. The incorrect coefficients can have an interactive impact on the iterations of other coefficients, resulting in a cascading effect of solution errors. This ultimately leads to an increase in the number of coefficients containing inaccuracies, which can have detrimental effects on the accuracy of conformal mapping.

3.2. Improved Dichotomy Method

In view of the above problems, this paper proposes an Improved Dichotomy Method (IDM). As shown in Figure 7, the meaning of colors is the same as that in Figure 5. To begin with, we select the endpoints and midpoints of the interval of coefficients for our search. In each iteration, we evaluate the midpoint of the interval and determine whether it represents the best combination. If it does, we take this midpoint as the center and divide the interval in half, resulting in a reduced interval for the next iteration, such as cj. If the midpoint is not the best combination, keep the interval length unchanged and choose the endpoint that is closer to the orange point as the new midpoint for the next iteration, denoted as cj+1.
As before, the search processes of the coefficients a 7 to b 10 are displayed in Figure 8. It is of particular interest that the IDM adjusts the search interval many times during the iteration depending on the position of the currently selected coefficient. This adaptive behavior allows the IDM to effectively explore the search space and converge towards the optimal solution in a more efficient manner. Compared with the DM in Figure 6, the results searched by the IDM are much closer to the final optimal solutions. The IDM’s ability to dynamically adjust the search interval offers a distinct advantage over the DM, enabling it to find optimal solutions with improved accuracy.
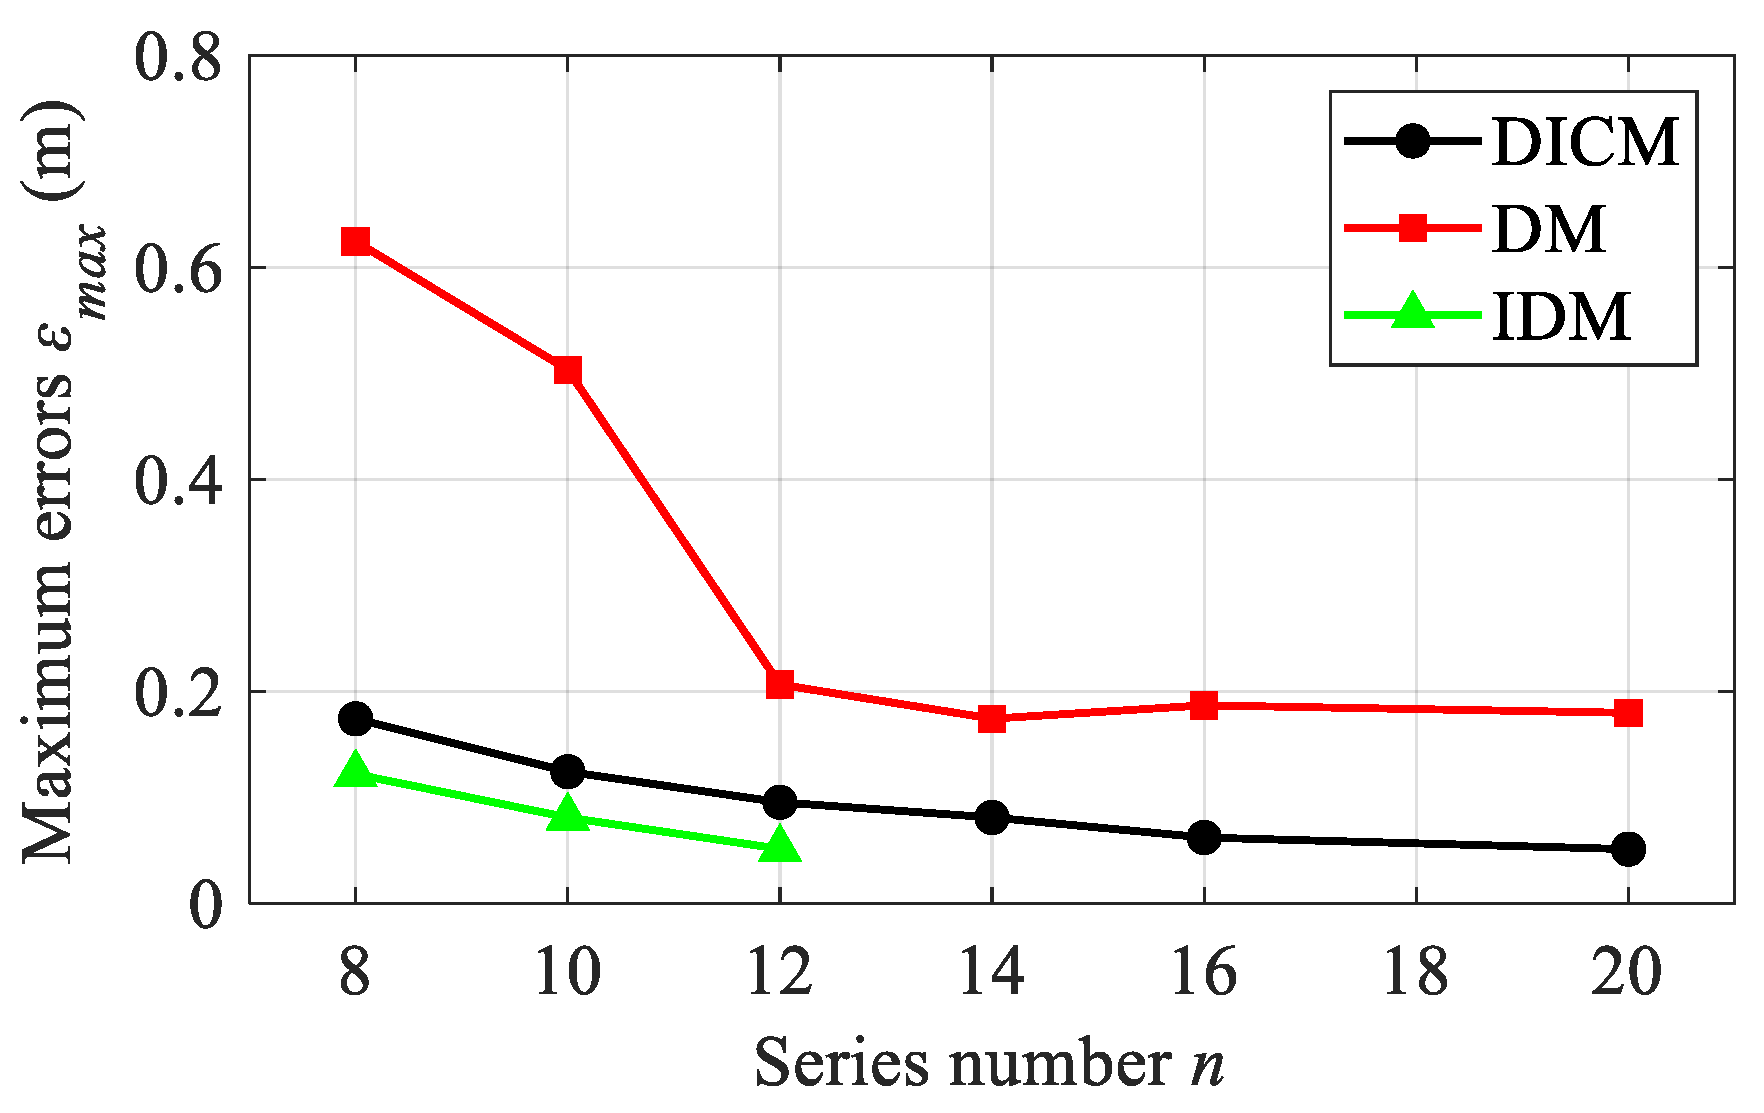
The maximum errors ε m a x of different methods are presented in Figure 9. The results indicate that the DM exhibits the poorest performance in error controlling. Notably, for n ≥ 14, as a result of the errors of coefficients, the maximum error of the DM tends to remain stable rather than decrease. On the other hand, the IDM proves to be the most effective in controlling errors. Nevertheless, due to the huge amount of calculation, the computation of the IDM requires a substantial amount of time, exceeding 7000 s when n > 12, making it excessively time-consuming.

3.3. Sliding Searching Method

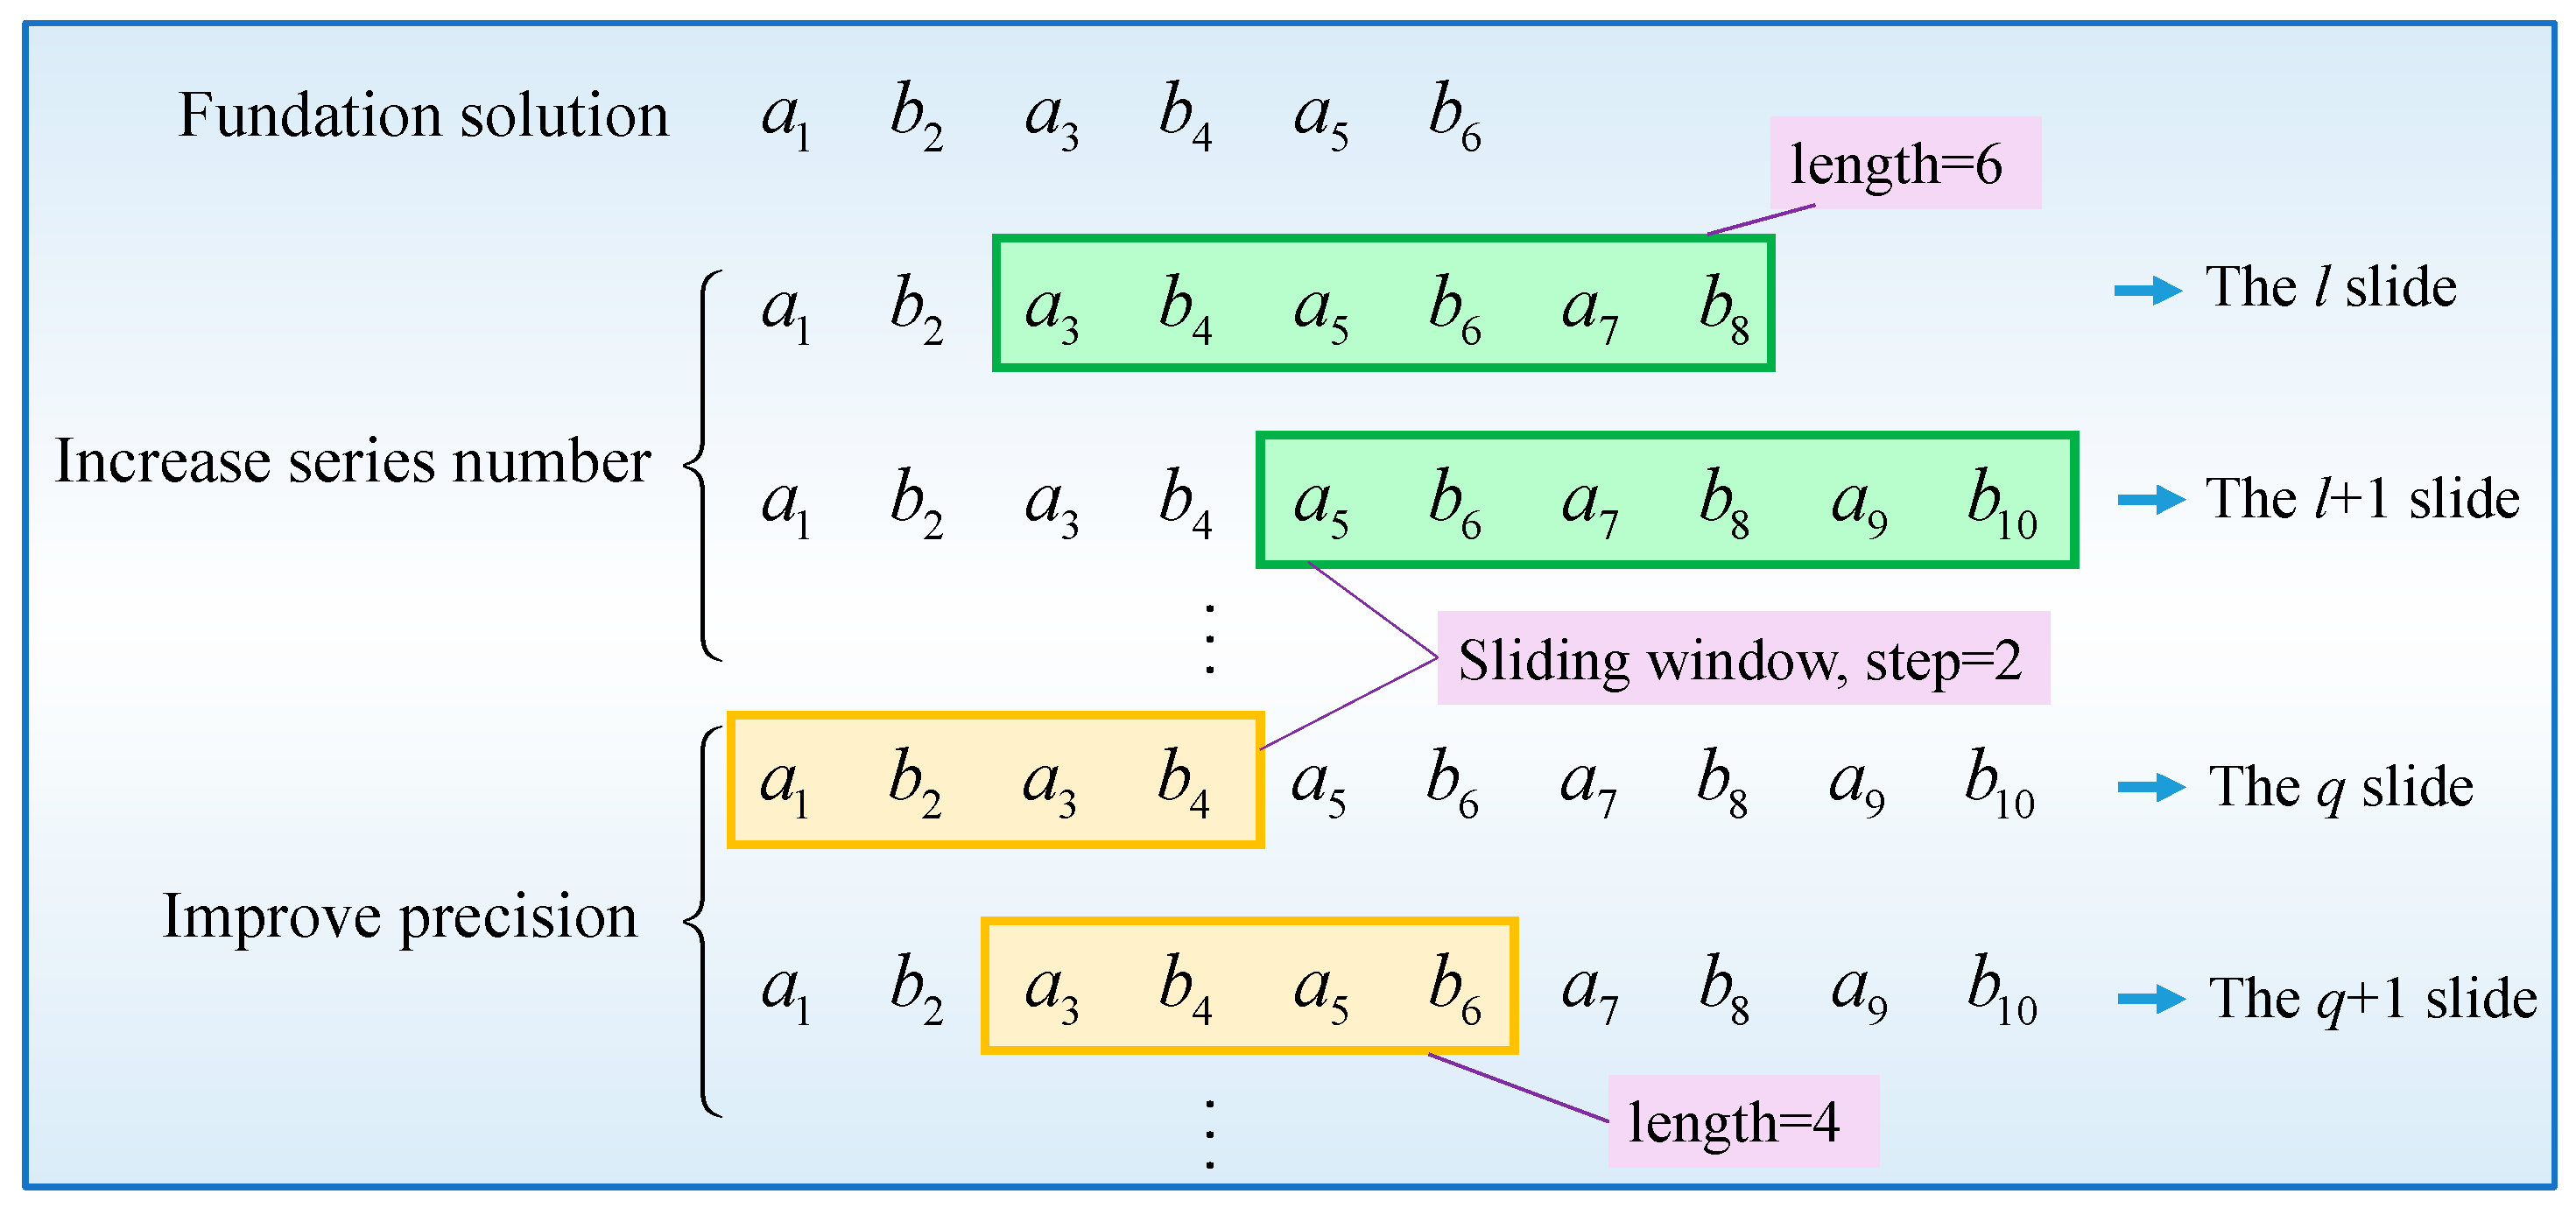
To speed up the solution, here we propose a Sliding Searching Method (SSM). As depicted in Figure 10, this method involves three main steps. The first step entails the computation of several foundation coefficients through the use of the IDM process. The foundation coefficients are the basis of subsequent calculations. Secondly, we select a specific number of coefficients to quantify the length of the sliding window. To increase the serial number, start with a coefficient, leave the coefficients in front of the window unchanged, and calculate coefficients within the window using the IDM. Subsequently, proceed to displace the window by a predetermined step to a new coefficient, followed by a recalculation of the coefficients contained within the updated window. Repeat the above procedures until the serial number meets the requirements. Finally, for the sake of higher precision, we introduce a new sliding window and recalculate coefficients within it. After several times of sliding and circular computations, the precision of coefficients can be significantly improved.
Take the GBEG as an instance, the length and step of the first sliding window are six and two, respectively. The series number increasing process starts from a 5 . The length and step of the second sliding window are four and two, starting from a 1 and repeating the sliding three times. For n = 12, it only takes 5.85 s in a personal computer (CPU: AMD-R9−5950X @3.4GHz) to finish the computation, which is much less than that of IDM. The maximum errors ε m a x and time consumption of different methods are shown in Figure 11. The results reveal that the time consumption of DICM [21] is so short that it can be neglected. The time consumption of the SSM is higher than that of the DICM and linearly increases with respect to n. Nevertheless, the calculation time for a closed box usually does not exceed 20 s. On the other hand, the SSM can reduce the maximum error, making the increase in the acceptable calculation time worthwhile. In other words, with the same ε max , the SSM needs less series number n, bringing a briefer Equation (1).
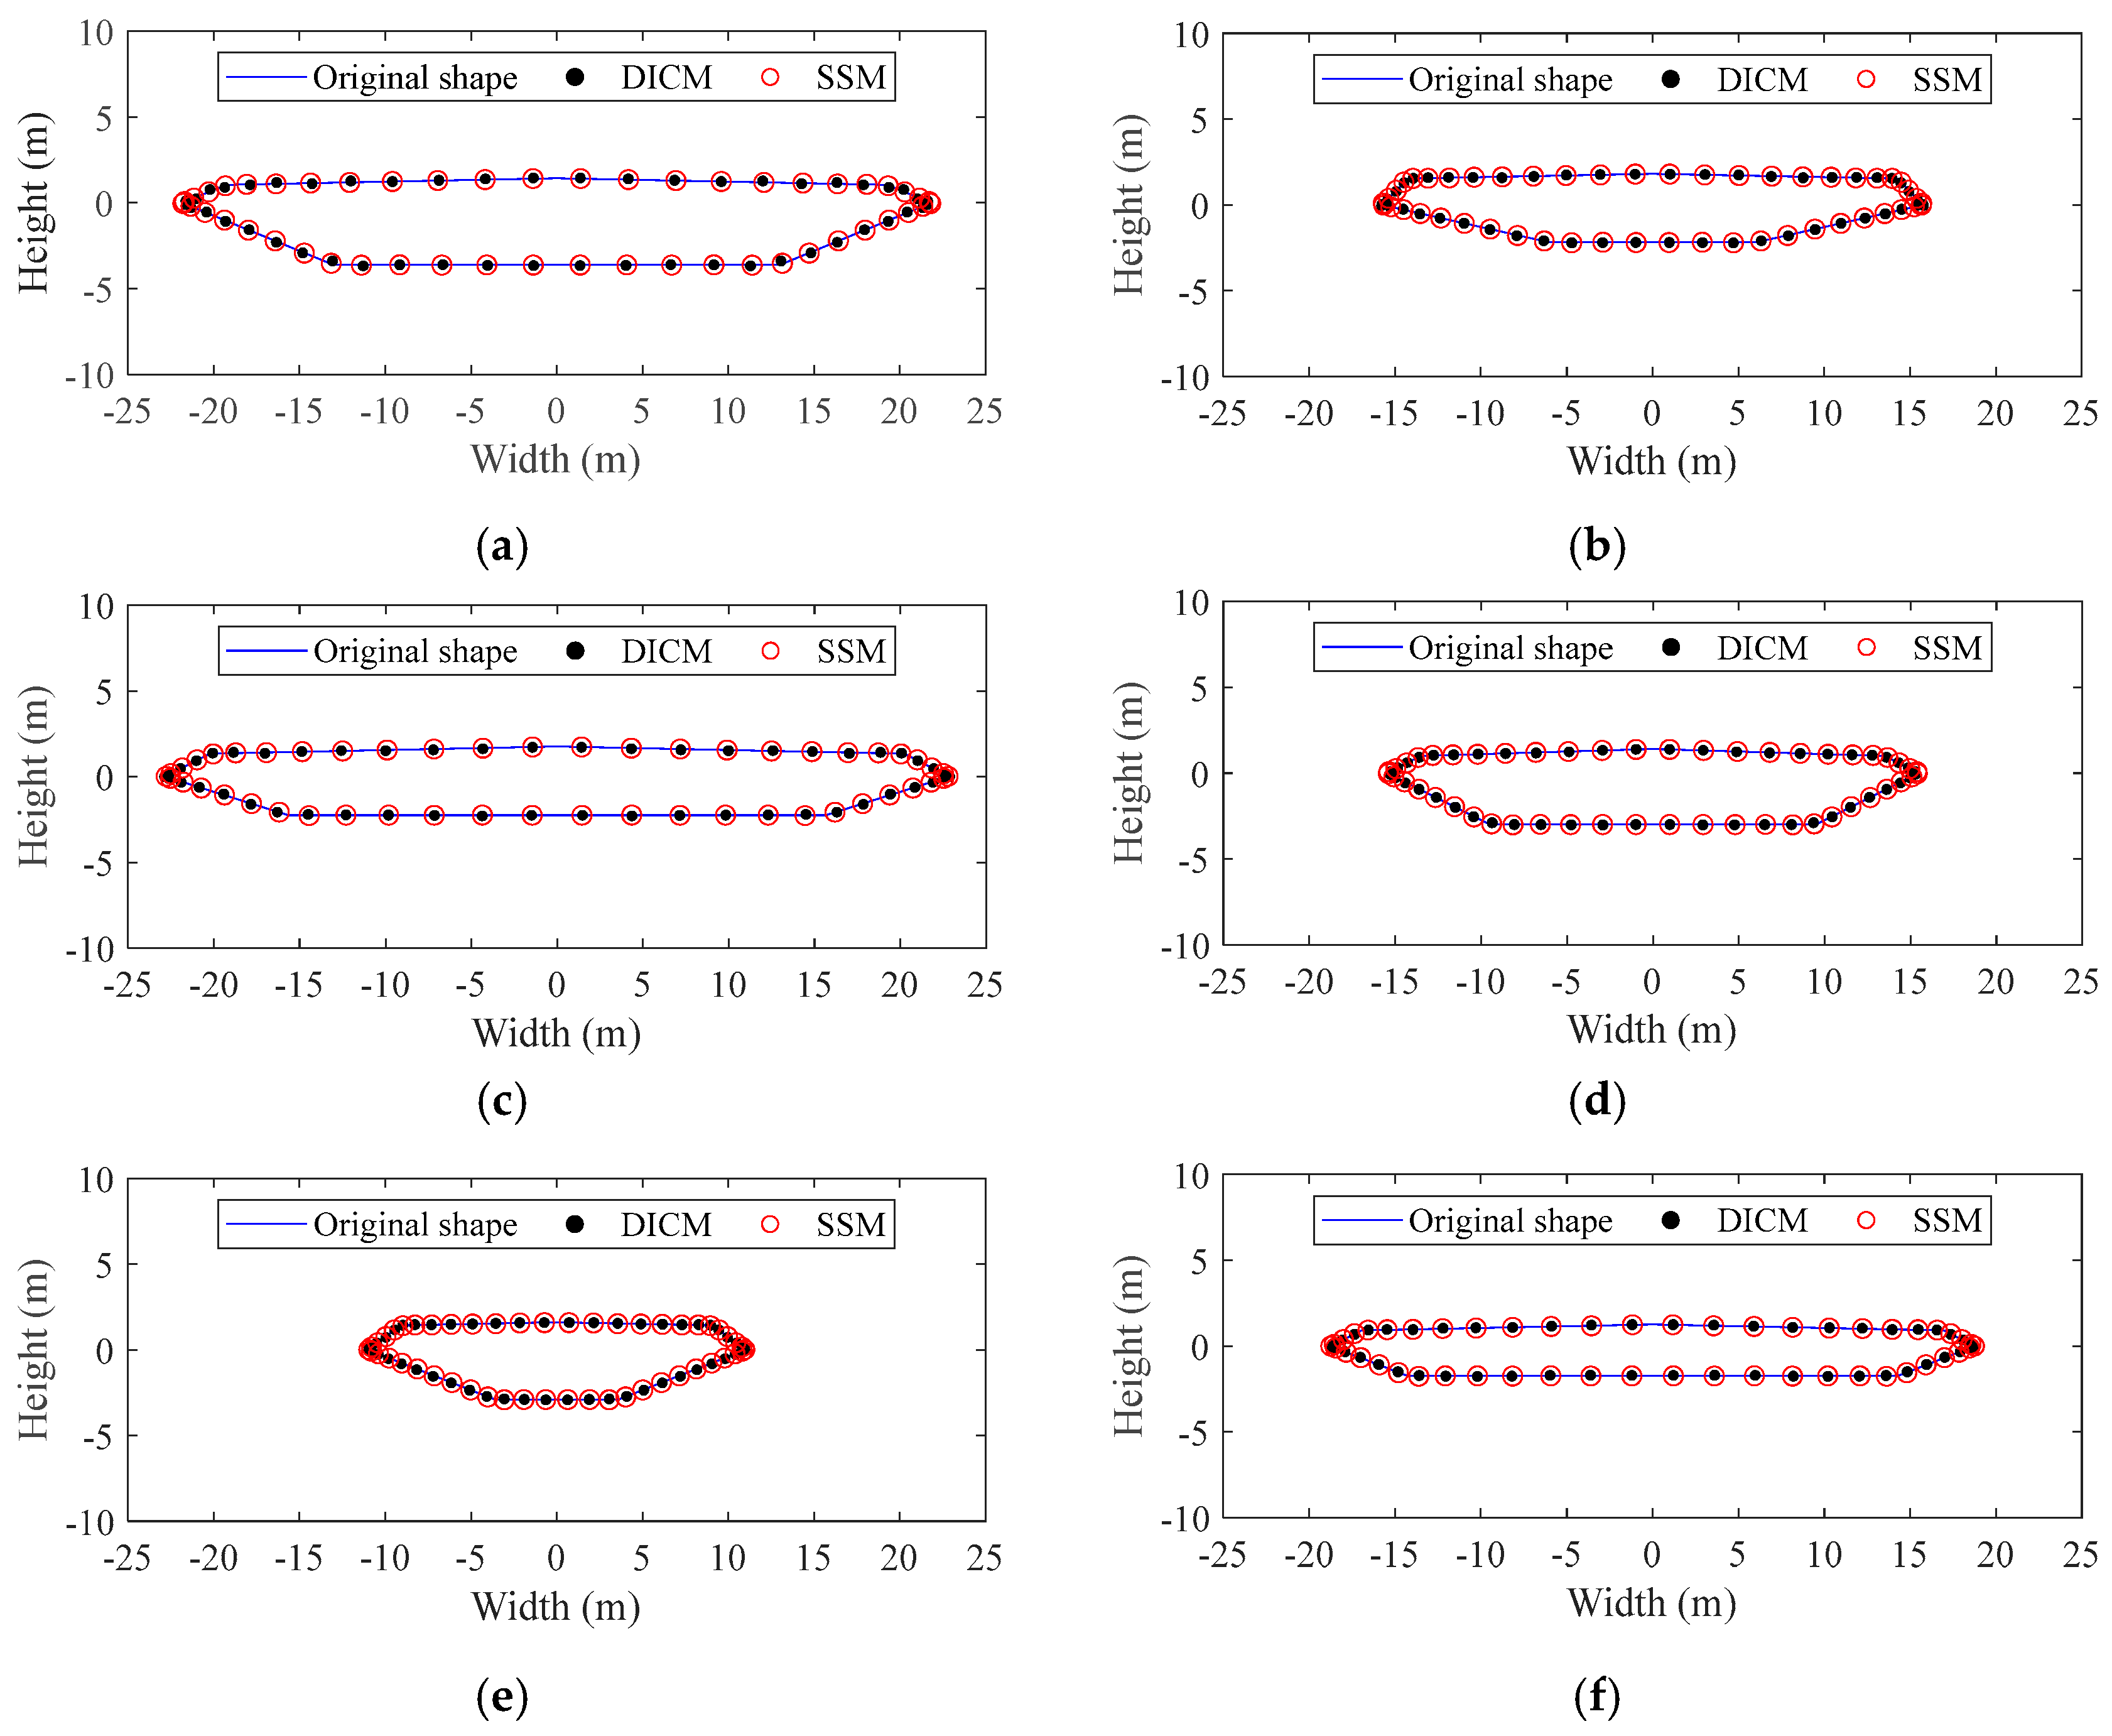
To further verify the validity of SSM, the conformal mapping points using DICM and SSM are compared in six closed box girder bridges, as displayed in Figure 12. The six closed boxes have large differences in shape, such as width, height, and the inclination of the lower web. Therefore, they are highly representative. The series number n is set to 24 because the maximum error ε m a x of the two methods is very close, as presented in Figure 11. The results clearly demonstrate a high level of consistency between the mapping points calculated by DICM and SSM and the original shape. The mapping points by the two methods agree very well. There are no abnormal phenomena, such as disorderly distribution and accumulation of mapping points, implying that SSM is an effective approach for performing conformal mapping calculations.

4. Application

Bridge flutter is a phenomenon that occurs when a bridge’s structure vibrates in response to strong wind. This can cause the bridge to sway or oscillate violently, which can cause damage and even collapse of bridge structures. With the increase of the span length of the bridge, the flutter performance has gradually become one of the control factors of bridge design [28,29,30,31]. A bridge that is able to withstand wind load is less likely to require frequent repairs or replacements, which can be expensive and have negative environmental impacts. Hence, the design of a bridge that can prevent flutter vibration throughout its entire life cycle is crucial for promoting sustainability.
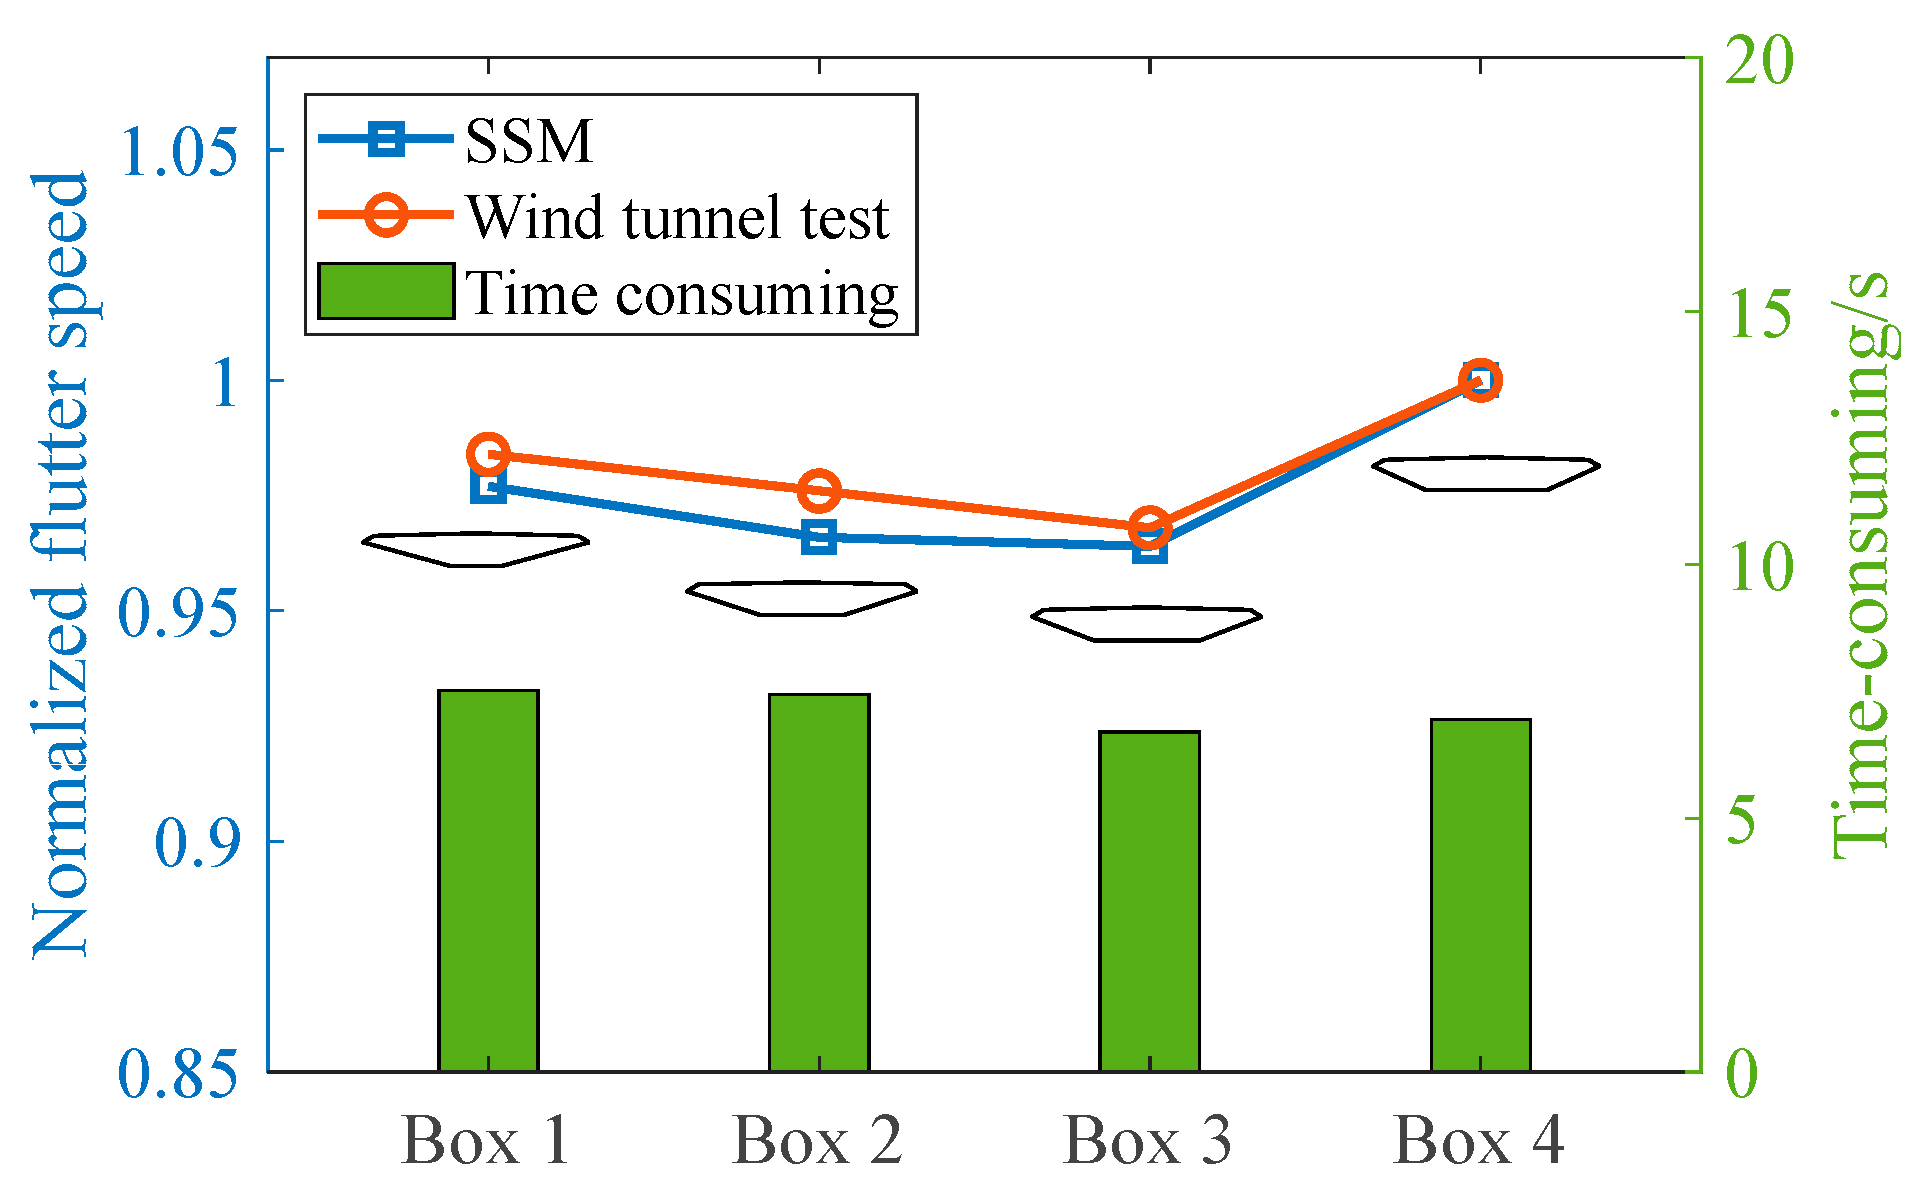
The flutter critical wind speed of a bridge is strongly linked to the shape of a closed box girder. In this study, SSM was utilized to assess the flutter performance of four closed-box girders. First, the conformal mapping coefficients of the closed boxes are calculated using SSM. Subsequently, the flutter derivatives of the closed boxes are computed. Finally, the flutter critical wind speeds are determined. The shapes of the closed box girders, method for acquiring flutter derivatives, dynamic parameters for flutter analysis, and wind tunnel test data remain consistent with those presented in reference [21], in which the wind tunnel test was conducted at the XNJD−2 wind tunnel of Southwest Jiaotong University. Additionally, according to Figure 11, the mapping error calculated using SSM remains relatively stable beyond an n value of 12. From the perspective of computational efficiency, the series number n is set to 12 in this study.
The flutter prediction results obtained from SSM are exhibited in Figure 13, in which the flutter wind speeds are normalized using the results of Box 4. It is demonstrated that, among the four closed boxes, Box 4 outperforms the other three closed boxes, while Box 3 exhibits the weakest flutter performance. Moreover, the flutter critical wind speed calculated by SSM are in agreement with those obtained from the wind tunnel test, confirming the effectiveness of SSM in flutter performance estimation of closed box girder bridges. The SSM method exhibits exceptional efficiency, with a computation time of fewer than 10 s for calculating the flutter wind speed of a closed box girder. Given its satisfactory accuracy and efficiency levels, the proposed SSM is well suited for preliminary girder shape selection in the design of closed-box girder bridges. Furthermore, there is no complex derivation for SSM. Thus, it is uncomplicated to understand and implement SSM, which can help the application of conformal mapping in bridge engineering.

5. Conclusions

The investigation of wind load on structures holds paramount significance for ensuring the safety and sustainability of bridges. This study investigates the characteristics of the conformal mapping coefficients from a unit circle to closed box girders, which is essential for analyzing wind load. Based on the distribution range of the conformal mapping coefficients, a numerical method, the Sliding Searching Method (SSM), was proposed to calculate the coefficients. Finally, the application of SSM in flutter prediction was studied. The main conclusions are summarized below:
(1)
For conformal mapping of the closed box girder, the coefficients a k → 0 when series number k is an even number and b k → 0 when k is an odd number. This will help to reduce the computation time of the solving of the conformal mapping coefficient.
(2)
The range of coefficients a k and b k are limited and substantially diminishing with the increase of the series number. Especially the coefficients a 1 and a 3 are closely related to the width and height of the closed box.
(3)
The SSM can calculate the coefficient solution with high accuracy when the number of series is small. The mapping points by SSM are very consistent with six practical box-girder shapes, indicating the effectiveness of SSM. The SSM manifests good simplicity and easy comprehensibility without convoluted mathematical operations and deductions.
(4)
The estimation of flutter performances by SSM agrees well with wind tunnel tests and only takes several seconds. The satisfactory accuracy and efficiency make the SSM a good method for girder shape selection in the preliminary design stage of a closed-box girder bridge.
(5)
The limitation of this study is that SSM can take tens of seconds when the number of series is large due to the increase in the calculation. In future research, we will delve deeper into the relationship between the shape of the closed-box girder and the mapping coefficient. This can contribute to decreasing the number of iterations required by the SSM and enhance its overall efficiency.

Author Contributions

Conceptualization, L.W.; methodology, L.W.; validation, L.W. and J.Z.; investigation, J.Z.; writing—Original draft preparation, L.W.; writing—Review and editing, Z.Z. and M.Z.; supervision, Z.Z. and M.Z. All authors have read and agreed to the published version of the manuscript.

Funding

This research received no external funding.

Institutional Review Board Statement

Not applicable.

Informed Consent Statement

Not applicable.

Data Availability Statement

The data presented in this study are available on request from the corresponding author.

Conflicts of Interest

The authors declare no conflict of interest.

References

  1. Li, Y.; Jiang, F.; Zhang, M.; Dai, Y.; Qin, J.; Zhang, J. Observations of Periodic Thermally-Developed Winds beside a Bridge Region in Mountain Terrain Based on Field Measurement. J. Wind Eng. Ind. Aerodyn. 2022, 225, 104996. [Google Scholar] [CrossRef]
  2. Zhang, J.; Zhang, M.; Jiang, X.; Wu, L.; Qin, J.; Li, Y. Pair-Copula-Based Trivariate Joint Probability Model of Wind Speed, Wind Direction and Angle of Attack. J. Wind Eng. Ind. Aerodyn. 2022, 225, 105010. [Google Scholar] [CrossRef]
  3. Amman, O.H.; von Kármán, T.; Woodruff, G.B. The Failure of the Tacoma Narrows Bridge; Federal Works Agency: Washington, DC, USA, 1941. [Google Scholar]
  4. Cui, C.; Ma, R.; Hu, X.; He, W. Vibration Analysis for Pendent Pedestrian Path of a Long-Span Extradosed Bridge. Sustainability 2019, 11, 4664. [Google Scholar] [CrossRef] [Green Version]
  5. Li, Y.; Chen, X.; Yu, C.; Togbenou, K.; Wang, B.; Zhu, L. Effects of Wind Fairing Angle on Aerodynamic Characteristics and Dynamic Responses of a Streamlined Trapezoidal Box Girder. J. Wind Eng. Ind. Aerodyn. 2018, 177, 69–78. [Google Scholar] [CrossRef]
  6. Wang, Z.; Tang, H.; Li, Y.; Guo, J.; Liu, Z. Windproof Ability of Aerodynamic Measures to Improve the Wind Environment above a Truss Girder. Wind Struct. 2021, 32, 423–437. [Google Scholar]
  7. Ke, Y.; Shen, G.; Yang, X.; Xie, J. Effects of Surface-Attached Vertical Ribs on Wind Loads and Wind-Induced Responses of High-Rise Buildings. Sustainability 2022, 14, 11394. [Google Scholar] [CrossRef]
  8. Selig, M.S.; Maughmer, M.D. Multipoint Inverse Airfoil Design Method Based on Conformal Mapping. AIAA J. 1992, 30, 1162–1170. [Google Scholar] [CrossRef]
  9. Chen, H.; Jaworski, J.W. Aeroelastic Interactions and Trajectory Selection of Vortex Gusts Impinging upon Joukowski Airfoils. J. Fluids Struct. 2020, 96, 103026. [Google Scholar] [CrossRef]
  10. Poozesh, A.; Mirzaei, M. Flow Simulation Around Cambered Airfoil by Using Conformal Mapping and Intermediate Domain in Lattice Boltzmann Method. J. Stat. Phys. 2017, 166, 354–367. [Google Scholar] [CrossRef]
  11. Malonek, H.R.; De Almeida, R. A Note on a Generalized Joukowski Transformation. Appl. Math. Lett. 2010, 23, 1174–1178. [Google Scholar] [CrossRef] [Green Version]
  12. Jia, X.; Lu, A.; Cai, H.; Ma, Y. An Analytical Method for Solving Gravity-Induced Stresses in Slope. Appl. Math. Model. 2021, 98, 665–679. [Google Scholar] [CrossRef]
  13. Kuliyev, S.A. Conformal Mapping Function of a Complex Domain and Its Application. Arch. Appl. Mech. 2020, 90, 993–1003. [Google Scholar] [CrossRef]
  14. Gu, X.D.; Zeng, W.; Luo, F.; Yau, S.-T. Numerical Computation of Surface Conformal Mappings. Comput. Methods Funct. Theory 2012, 11, 747–787. [Google Scholar] [CrossRef]
  15. Dyachenko, A.I.; Lushnikov, P.M.; Zakharov, V.E. Non-Canonical Hamiltonian Structure and Poisson Bracket for Two-Dimensional Hydrodynamics with Free Surface. J. Fluids Struct. 2019, 869, 526–552. [Google Scholar] [CrossRef] [Green Version]
  16. Song, K.; Yin, D.; Dai, M.; Schiavone, P. Design of Non-Circular Nanoinhomogeneities with Uniform Heat Flux in Two-Dimensional Heat Conduction. Int. J. Heat Mass Transf. 2021, 166, 120789. [Google Scholar] [CrossRef]
  17. Chui, S.T.; Chen, X.; Liu, M.; Lin, Z.; Zi, J. Scattering of Electromagnetic Waves from a Cone with Conformal Mapping: Application to Scanning near-Field Optical Microscope. Phys. Rev. B 2018, 97, 081406. [Google Scholar] [CrossRef] [Green Version]
  18. Natarajan, S.; Bordas, S.; Mahapatra, D.R. Numerical Integration over Arbitrary Polygonal Domains Based on Schwarz–Christoffel Conformal Mapping. Int. J. Numer. Meth. Eng. 2009, 80, 103–134. [Google Scholar] [CrossRef]
  19. Wang, Y.; Feng, B.; Duan, Q.; Cao, F. Numerical Calculation Method for the Boundary of Closed Polygon and Rectangle Region. In Proceedings of the 2020 International Conference on Computer Information and Big Data Applications (CIBDA), Guiyang, China, 17–19 April 2020; pp. 421–424. [Google Scholar]
  20. Driscoll, T.A.; Trefethen, L.N. Schwarz-Christoffel Mapping; Cambridge University Press: Cambridge, UK, 2002; Volume 8, ISBN 978-1-139-43392-1. [Google Scholar]
  21. Wu, L.; Ju, J.W.; Zhang, M.; Li, Y.; Qi, J. Aerostatic Pressure of Streamlined Box Girder Based on Conformal Mapping Method and Its Application. Wind Struct. 2022, 35, 243–253. [Google Scholar] [CrossRef]
  22. Kuroda, S. Numerical Simulation of Flow around a Box Girder of a Long Span Suspension Bridge. J. Wind Eng. Ind. Aerodyn. 1997, 67–68, 239–252. [Google Scholar] [CrossRef]
  23. Walsh, J.L. History of the Riemann Mapping Theorem. Am. Math. Month. 1973, 80, 270–276. [Google Scholar] [CrossRef]
  24. Fujino, Y.; Iwamoto, M.; Ito, M.; Hikami, Y. Wind Tunnel Experiments Using 3D Models and Response Prediction for a Long-Span Suspension Bridge. J. Wind Eng. Ind. Aerodyn. 1992, 42, 1333–1344. [Google Scholar] [CrossRef]
  25. Wang, X.; Fei, P.; Zhang, X.; Dong, Y.; Melchy, O.D. Design and Construction of the Second Humen Bridge, China. Proc. Inst. Civ. Eng.-Civ. Eng. 2019, 172, 161–166. [Google Scholar] [CrossRef]
  26. Adanur, S.; Günaydin, M.; Altunişik, A.C.; Sevim, B. Construction Stage Analysis of Humber Suspension Bridge. Appl. Math. Model. 2012, 36, 5492–5505. [Google Scholar] [CrossRef]
  27. Zhu, Y.-F.; Ren, W.-X.; Wang, Y.-F. Structural Health Monitoring on Yangluo Yangtze River Bridge: Implementation and Demonstration. Adv. Struct. Eng. 2022, 25, 1431–1448. [Google Scholar] [CrossRef]
  28. Wu, L.; Woody Ju, J.; Zhang, J.; Zhang, M.; Li, Y. Vibration Phase Difference Analysis of Long-Span Suspension Bridge during Flutter. Eng. Struct. 2023, 276, 115351. [Google Scholar] [CrossRef]
  29. Tang, H.; Zhang, H.; Mo, W.; Li, Y. Flutter Performance of Box Girders with Different Wind Fairings at Large Angles of Attack. Wind Struct. 2021, 32, 509–520. [Google Scholar] [CrossRef]
  30. Hu, P.; Han, Y.; Cai, C.S.; Cheng, W. Wind Characteristics and Flutter Performance of a Long-Span Suspension Bridge Located in a Deep-Cutting Gorge. Eng. Struct. 2021, 233, 111841. [Google Scholar] [CrossRef]
  31. Zhang, M.; Xu, F. Tuned Mass Damper for Self-Excited Vibration Control: Optimization Involving Nonlinear Aeroelastic Effect. J. Wind Eng. Ind. Aerodyn. 2022, 220, 104836. [Google Scholar] [CrossRef]
Figure 1. Conformal mapping from a unit circle to a closed box.
Sustainability 15 06291 g001
Figure 2. Parameters of the bridge box girder.
Sustainability 15 06291 g002
Figure 3. The range of conformal mapping coefficients a k and b k ; (a) Coefficients a k ; (b) Coefficients b k .
Sustainability 15 06291 g003
Figure 4. The percentage error of a 1 and a 3 ; (a) Error of a 1 ; (b) Error of a 3 .
Sustainability 15 06291 g004
Figure 5. The search process by the DM.
Sustainability 15 06291 g005
Figure 6. The search history of the coefficients by the DM. (a) Coefficient a 7 ; (b) Coefficient b 8 ; (c) Coefficient a 9 ; (d) Coefficient b 10 .
Sustainability 15 06291 g006
Figure 7. The search process by the IDM.
Sustainability 15 06291 g007
Figure 8. The search history of the coefficients by the IDM; (a) Coefficient a 7 ; (b) Coefficient b 8 ; (c) Coefficient a 9 ; (d) Coefficient b 10 .
Sustainability 15 06291 g008
Figure 9. Maximum errors of different methods.
Sustainability 15 06291 g009
Figure 10. The process of the SSM.
Sustainability 15 06291 g010
Figure 11. Maximum errors and time consumption of different methods.
Sustainability 15 06291 g011
Figure 12. Comparison of conformal mapping points using different methods; (a) Akashi Strait Bridge (Box scheme) [24]; (b) Xianxin Road Bridge [21]; (c) Second Humen Bridge [25]; (d) Great Belt East Bridge [22]; (e) Humber Bridge [26]; (f) Yangluo Yangtze River Bridge [27].
Sustainability 15 06291 g012
Figure 13. Flutter performance prediction.
Sustainability 15 06291 g013
Table 1. The results of coefficients a k and b k (n = 10).
k12345678910
a k 8.7621−1.5 × 10−46.42134.4 × 10−5−0.0841−4.6 × 10−60.1502−2.9 × 10−50.0771−4.6 × 10⁻⁵
b k 5.3 × 10⁻⁴−0.5759−4.2 × 10−40.44112.6 × 10−50.1616−6.1 × 10⁻⁵−0.0881−3.1 × 10⁻⁵−0.0450
Table 2. The range of conformal mapping coefficients.
j12345
a2j−1( f 2 ~ f 1 ) a 1 * ( f 4 ~ f 3 ) a 3 * −0.8770~0.6097−0.6294~0.3481−0.5646~0.3740
b2j−2.3874~0.6518−0.0434~1.2909−0.4762~0.5408−0.5597~0.5474−0.3782~0.5328
j678910
a2j−1−0.5535~0.4761−0.4523~0.4350−0.4178~0.3847−0.3804~0.3798−0.3688~0.3697
b2j−0.4501~0.4792−0.4060~0.4203−0.3597~0.4136−0.3711~0.3768−0.3180~0.3512
j1112131415
a2j−1−0.3596~0.2913−0.3104~0.3328−0.3018~0.2942−0.2155~0.2098−0.2327~0.2414
b2j−0.3369~0.3004−0.3136~0.3040−0.3038~0.2854−0.2887~0.2736−0.2467~0.2545
j1617181920
a2j−1−0.2364~0.2441−0.2077~0.2158−0.2057~0.1724−0.1789~0.1484−0.1593~0.1736
b2j−0.2195~0.2164−0.1991~0.2090−0.1667~0.1845−0.1609~0.1605−0.1621~0.1557
j2122232425
a2j−1−0.1441~0.1503−0.1280~0.1342−0.1164~0.1223−0.1068~0.0982−0.0873~0.0886
b2j−0.1557~0.1277−0.1138~0.1116−0.1438~0.1371−0.1458~0.1411−0.0861~0.0832
Disclaimer/Publisher’s Note: The statements, opinions and data contained in all publications are solely those of the individual author(s) and contributor(s) and not of MDPI and/or the editor(s). MDPI and/or the editor(s) disclaim responsibility for any injury to people or property resulting from any ideas, methods, instructions or products referred to in the content.