Abstract
(1) Background: Extension educators are uniquely positioned to assist with sustainable community-based food environment change, especially related to obesity prevention efforts, because they are located in almost every county in the U.S. Extension educators strive to build resilient communities by improving food access and bridging various actors involved in the food systems. Needs assessments of desired educational program resources by priority populations, such as those in rural areas, are needed to ensure effective food access and nutrition literacy programs are established based on clientele needs. (2) Methods: Using a non-probability opt-in survey, data were collected from 780 rural residents in a U.S. state facing challenges with obesity rates due to lack of access to healthy, nutritious food to identify barriers to accessing fresh produce and desired educational program resources. (3) Results: The need for socioeconomic and market-based solutions within the built environment indicated educators should increase partnerships with economic resource organizations to enhance community resilience related to food access. (4) Conclusions: An increased understanding can enhance the efficacy of the resources Extension educators offer, resulting in improved food access and security by directly addressing clientele’s demonstrated needs.
1. Introduction
Increasing resources related to food and nutrition is key for comprehensive approaches for community socioeconomic development [1]. Specifically, issues of access, affordability, and availability of nutrient-dense food by low-income and rural communities has been a concern of advocates, policymakers, and the general public [2]. Extension educators are poised to bring those working to improve food systems and public health together to help address the need for diet-related chronic disease prevention in the United States (U.S.), due to their expertise, research-based programming, community connections, and ability to enact change through regional, state, and national networks [3]. One method for increasing Extension educator’s impact at the nexus of public health and the food system is to “address health disparities by developing equal access to healthy food in communities across (the U.S.)” [3]. However, to ensure equitable access, Extension educators should identify the needs of rural audiences related to the programmatic resources they desire to help reduce the occurrence of diet-related chronic disease.
With limited financial and human resources, time-sensitive implementation targets, and funding agency requirements, Extension educators often lack opportunities to plan, design, and evaluate audience needs before program implementation [4]. However, achieving community-based health intervention outcomes depends on appropriately planned, cost-efficient, and high-quality needs assessment at the early stages of intervention [5]. Despite potentially high time and financial costs, conducting needs assessments prior to program implementation may save costs over the long term and create more effective and sustainable Extension programs [6].
1.1. Cooperative Extension
Cooperative Extension services (henceforth called Extension) were one of the first university engagement models in the U.S., aiming to bring evidence-based research to the public [7]. Extension is a “public-funded, non-formal educational system that links the education and research resources of the United States Department of Agriculture, land-grant universities, and county administrative units” [7]. Extension systems across the U.S. are working more closely with emerging food systems work combined with their traditional mandate of educating communities about food and agriculture [8]. The role of Extension educators is to provide resources and knowledge to enhance the resilience of their clientele—whether those clients are agricultural producers, food systems actors, or community members [9]. As Extension evolves to meet the needs of a diversified public, it is important to determine successful strategies to most effectively serve clientele while operating under limited time and resources [10,11]. Specifically, there is a research gap identifying the program types needed to address the intersection of food access and obesity prevention. One method for addressing diverse audience needs is the needs assessment model which allows for direct, community-facing programming to help fulfill specific and culturally relevant needs of underreached audiences [11,12,13].
Needs Assessment
Needs assessments have different applications depending on context; however, their primary function is “simply a tool for making better decisions” [14]. As a decision-making tool, needs assessments have become a critical element for development projects across the globe to help align existing resources with implementation strategies, clarify existing problems and opportunities, and justify decision making [15]. The United Nations Development Program (UNDP) prioritizes the necessity of needs assessment as a first step of problem identification during the planning phase and the main guiding source for identifying the critical issues in communities, capturing problems affecting communities as a whole, and those who are considered marginalized and vulnerable groups [16].
Extension educators must continually generate programs and identify resources that are relevant to the needs of their clientele [7]. Needs assessments are valuable tools for Extension educators to ensure they design programs that fit identified community needs, especially in rural areas and with underserved audiences [17]. Donaldson et al. [18] found a needed capacity for Extension educators to address a diverse array of audiences. Specifically, there were demonstrated needs for promoting resilient and responsive rural communities in the U.S. Needs assessments not only account for demonstrated program area needs, they also provide insight into the social, historical, economic, educational, and political factors of a community or identified audience [7].
Funding agencies such as the CDC have predominately focused on reducing diet-related chronic disease in urban areas through their High Obesity Program (HOP) funding line. This leaves a gap for understanding the needs of rural audiences, specifically related to programmatic resources offered by Extension. Thus, needs assessments of rural audiences are needed to direct broader, regional and/or state-level Extension efforts to be responsive to localized needs assessments by county-level Extension staff [19]. Needs assessments are also a tool to help increase interest in community programs delivered by Extension by making programs relevant to the goals, needs, and values of an audience [7]. When creating Extension programs, especially those intended to impact or change behavior [10], educators should be cognizant of the ways in which a program interacts with an audience’s sociocultural values to ensure culturally responsive and effective programming efforts [20,21].
1.2. Conceptual Frameworks
Audience segmentation and buyer personas were used collectively to develop a conceptual framework for this study.
1.2.1. Audience Segmentation
Audience segmentation is a framework used in communication and marketing strategies to increase targeted messaging effectiveness for specific audiences [22]. The goal of audience segmentation is to create strategic messages aiming to increase knowledge, modify attitudes, and enhance enduring behavior changes among an audience [22]. Tailoring messages and recruitment strategies to meet the needs of and accessibility to specific audiences is critical to ensure Extension program resources are responsive to intended audiences and their specific needs [22,23,24].
Social marketing strategies align with the mission of Extension education as a tool for implementing strategic behavior change through an audience-centered approach that benefits audiences in local communities best positioned to make impactful change [25,26,27]. Extension educators can benefit from the use of social marketing and audience segmentation strategies [23,28,29] as they incorporate evidence-based information for a target audience, tailored messaging strategies related to a selected audience’s group characteristics and demonstrated needs, and the use of those strategies to remove perceived barriers to behavior change [26,30,31,32]. Audience segmentation has been used by Extension educators to share scientific and evidence-based information across diverse population segments [26,33], while it has also been used to identify the communication preferences of specific audiences to receive community information [34].
Through social marketing, Extension educators work to reduce perceived barriers to behavior change (such as engaging in a predetermined outcome or Extension program) and thus lead to increased adoption of behaviors, similar to traditional methods of marketing commercial products to the public [26,32]. Through audience segmentation, Extension educators can enhance program development—in alignment with the purpose of a needs assessment [7]—to increase effective resource allocation in programs tailored to audience’s motivations, values, beliefs, and interests [24,30,33,35].
Demographic variables are often insufficient to create effective campaigns for specific audiences. While researchers may begin by analyzing demographics, they must subsequently identify and use additional variables in their analysis, such as barriers to food access or knowledge, to further segment and target specific audiences [22]. Therefore, audience segmentation strategies not only help create more effective messaging strategies; using audience segments identified through rigorous research help create audience profiles, such as personas, that can increase effective educational and communication outreach for organizations [36,37,38].
1.2.2. Buyer Personas
Buyer personas are a strategy borrowed from the marketing field [39], much like audience segmentation [28]. Buyer personas aim to create communication and marketing strategies which are intended to make specific audiences feel a message was created specifically for them [39]. According to Revella [39],
Built around a story about your customers’ buying decision, the buyer persona reveals insight into your buyer’s expectations and concerns as they decide whether to do business with you, choose your competitor, or simply opt to do nothing at all.
Buyer personas have been used in the social marketing of health-related initiatives [40] and thus may have strong applicability to Extension education efforts at the intersection of the food system and health and wellness [3]. However, research on buyer personas is limited in academic and peer-reviewed literature; currently buyer personas are a largely practitioner-based method [40]. Thus, the current study examined the potential of buyer personas—or in the case of Extension education, client personas—of those most and least likely to participate in Extension education programs related to food access in rural areas.
The use of buyer personas in Extension programming should be used with caution as to not make abstract or conjectural personas, or even stereotypes, without significant evidence to back up any assertions used to construct the personas [41]. However, having an archetype of a potential buyer, or client, can help create outreach strategies to promote Extension services to those with whom Extension educators hope to engage [39]. For example, Stearns and Rabinowitz [42] surveyed undergraduates to build buyer personas of the group consuming less milk than others in years past. Because undergraduates are a population that fails to reach calcium recommendations, Stearns and Rabinowitz [42] recommended Extension programs emphasize the health and nutrition benefits of milk in order to connect with these specific personas that consume less milk based on their needs and interests. Extension continually faces a call to increase their engagement across audiences through managing their communication activities in order to translate into actualized service [43].
1.3. Purpose and Research Objectives
The purpose of the current study was to determine Extension program and resource needs for rural residents in a U.S. state facing challenges with obesity rates due to lack of access to healthy, nutritious food to identify barriers related to food access and availability. The five objectives that guided the study were to:
- Describe respondents’ self-reported barriers to accessing nutrient-dense food;
- Describe respondents’ self-reported likelihood to use Extension food access resources;
- Identify distinct clusters/personas of respondents based on likelihood of using Extension program resources for food access;
- Examine associations between respondent demographics and likelihood of using Extension program resources for food access;
- Determine whether a relationship exists between cluster/persona membership and experiencing barriers to accessing nutrient-dense food.
2. Materials and Methods
The quantitative study presented here was part of a larger research project to explore the Extension resource and communication needs of rural audiences in Georgia. The research design consisted of an online survey of rural Georgia residents. Georgia has one of the highest rates of rural obesity and diet-related chronic disease and is located in the region (Southeastern U.S.) that reflects this high prevalence, making it an informative example for other Extension educators across the Southeastern region. Respondents were asked to identify their knowledge of nutrition information, barriers to accessing nutrient-dense food, and preferred Extension resources for increasing food access and affordability, and self-reported demographic characteristics.
2.1. Data Collection and Sampling Procedures
Survey methods have been identified as an efficient tool for conducting needs assessments [7]. Thus, data for the needs assessment were collected via an online survey instrument using non-probability opt-in sampling methods in November 2022 through Qualtrics, an online survey company. The use of non-probability sampling techniques is often used in public opinion research. Population estimates based on these sampling methods have been found to be greater than or equal to those derived from probability sampling techniques [44]. Lamm and Lamm [45] and Gibson et al. [46] reported that non-probability sampling techniques have also helped create targeted and effective Extension programs and thus provided support for the use of this technique in the current study.
To engage in non-probability sampling procedures, survey respondents were recruited by Qualtrics and compensated thusly for their participation according to the company’s standard protocols. Qualtrics recruited participants based on representative weighting for sex, age, race/ethnicity, and zip code for rural Georgia residents.
2.1.1. Instrument
Respondents self-reported barriers to incorporating fruits and vegetables into their diet were measured with 16 items on a five-point Likert scale, using the prompt: “please indicate how often each of the following items make it challenging for you to get fruits and vegetables”. Items included: low wages/income, prices of fruits and vegetables, limited transportation, distance to store, lack of time to prepare foods, physical disabilities, limited access to or no available kitchen/cooking equipment, do not know how to prepare and cook meals with fruits and vegetables, not enough resources for purchasing fruits and vegetables (e.g., out of Supplemental Nutrition Assistance Program [SNAP] benefits), not enough places that take government benefits for fruits and vegetables (Women, Infant, Children [WIC] Benefits and/or SNAP), not enough time to eat fruits and vegetables at work or school, no refrigeration at work or school, problems with teeth or gums, do not like fruits, do not like vegetables, and other. The scale response items were 1—never, 2—occasionally, 3—some of the time, 4—most of the time, or 5—all of the time. Scale items were adapted from the Missoula Food Bank [47] community food insecurity survey. A scale for barriers to incorporating fruits and vegetables into diet was created based on the average of the 16 items (α = 0.92) and used to address research objective five.
Respondents self-reported likelihood of using food access resources if available in their community was measured with 10 items on a five-point Likert-scale. Items included: free cooking classes, farmers’ market coupons, free classes on home gardening, free or discounted weekly box of fresh fruits and vegetables, fresh fruits and vegetables available in gas stations/convenience stores, mobile trucks or food markets, community gardens, free nutrition classes, free programs for chronic disease prevention, and free exercise classes. The scale limits were 1—extremely unlikely, 2—unlikely, 3—neither likely nor unlikely, 4—likely, or 5—extremely likely. Real limits of the scale were 1.00–1.50 (never), 1.60–2.50 (occasionally), 2.60–3.50 (some of the time), 3.60–4.50 (most of the time), and 4.60–5.00 (all of the time). Scale items were adapted from the “Carolina Farm Stewards Association’s Beaufort Health Food Action Plan—Healthy, Fresh, Local Food Community Survey” [48]. Data for demographic questions were collected through check-all-that-apply questions for race and multiple-choice questions for gender, ethnicity, age, marital status, and education level.
The instrument was reviewed for face and content validity by a panel of experts in agricultural and natural resource communication, nutrition, health promotion, Extension education, and survey design prior to pilot testing. The research design was approved by the University of Georgia Institutional Review Board (Protocol #00005553) in alignment with institutional human subjects’ research requirements. The instrument was pilot tested (n = 20) with individuals who were representative of the sample. All scales were deemed reliable (α > 0.70) [49] and the instrument was not changed after the pilot test.
2.1.2. Data Analysis
Data analytic procedures included descriptive statistics, cluster analyses, and inferential statistics using SPSS version 26. Descriptive statistics were used to address research objectives one and two. Hierarchical and K-means cluster analyses were used to identify distinct groups of respondents who could be categorized as having a low, medium, or high likelihood of using Extension food access resources. Cluster analyses help researchers to organize and reduce large data sets into smaller segments, called maximally dissimilar groups, based on respondents’ response patterns in the data set [50,51]. Respondents were segmented into classificatory groups based on the clustered scale (likelihood of using Extension food access resources) which can bolster audience segmentation practices to create more effective Extension outreach strategies [24,52].
A hierarchical cluster analysis (HCA) using Ward’s method with squared Euclidean distance was used to identify the number of clusters needed based on the represented maximum dissimilarity among data points [51]. Ward’s method often creates similarly sized clusters but may be susceptible to or influenced by outliers in the data [52]. Within the HCA, the number of subgroups were selected based on the largest distance between clusters, represented through vertical lines, on the dendrogram produced in the analysis (Figure 1) [51].
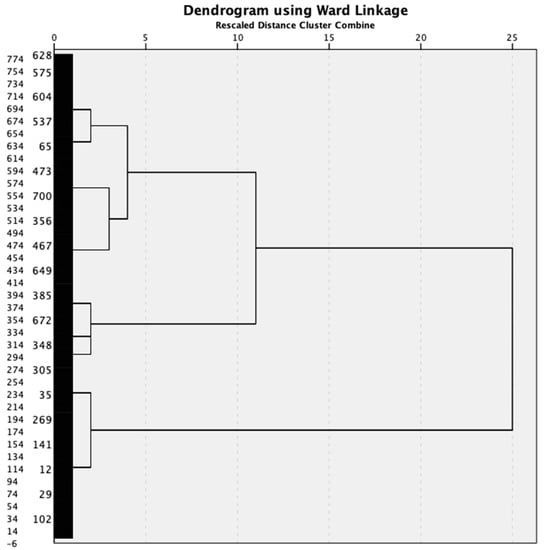
Figure 1.
Dendrogram for hierarchical cluster analysis using Ward’s linkage.
A K-means cluster analysis was then run based on the subgroup determination in the HCA [27,46,50]. Maximum iterations were adjusted from 10 to 99 to avoid early convergence [46], which occurred after 13 iterations. Cluster categories (low, medium, and high likelihood of using Extension food access resources) were determined through the means of each cluster membership category. Chi-squared tests of association were conducted to test for associations between demographic characteristics and the three clusters (low, medium, and high likelihood of using Extension food access resources). Cramer’s V (F) was used to describe effect size. An ANOVA was then run to determine if there were differences between cluster membership for Extension resource use and perceived barriers to incorporating fruits and vegetables into one’s diet.
3. Results
3.1. Sample
A total of 780 respondents, all rural Georgia residents, made up the sample. Qualtrics recruited respondents from zip codes in Georgia identified as rural by the United States Department of Agriculture. Table 1 presents frequencies and percentages for respondent demographic characteristics. A majority of respondents identified as White (75.6%) and female (69.6%), were between 30 and 59 years old (59.7%), made less than USD 60,000 for annual family income (73.1%), and either received a high school degree/GED or completed some college (61.2%; see Table 1).

Table 1.
Demographic characteristics of respondents (N = 780).
3.2. Barriers to Accessing Nutrient-Dense Food
Respondents were asked to identify the frequency they experienced various barriers to incorporating nutrient-dense foods into their diet (Table 2). The items with the highest frequencies included prices of fruits and vegetables and low wages/income.
Table 2.
Barriers to integrating fruits and vegetables into diet (N = 780).
3.3. Extension Resources
Respondents were asked to indicate the likelihood of using Extension resources if available in their community (Table 3). The items with the highest frequencies for likelihood of use included free or discounted weekly box of fresh fruits and vegetables, farmers’ market coupons, and mobile trucks or food markets.
Table 3.
Likelihood of using Extension program resources (N = 780).
3.4. Cluster Analysis
Three distinct clusters were identified through the cluster analysis. The first cluster represented the group with the lowest likelihood (group mean) of using the Extension resources listed in Table 4 (M = 2.02, SD = 0.49) and were, on average, unlikely to use the resources. The second cluster two represented the group with the middle likelihood of using the resources (M = 3.24, SD = 0.33) and were, on average, neither likely nor unlikely to use the resources. Cluster three represented the group with the highest likelihood of using the resources (M = 4.36, SD = 0.33), and were, on average, likely to use the resources.
Table 4.
Chi-squared analyses of demographic characteristics and cluster membership (N = 780).
3.4.1. Associations between Demographics and Cluster Membership
There were observed associations between sex, age, marital status, employment, receiving SNAP benefits, and education level (Table 4). Cramer’s V (F) effect sizes were calculated for each significant association (Table 4). Three associations had a large effect size, including the associations between cluster membership and age; employment; and educational level. Medium effect sizes included associations between cluster membership and marital status and cluster membership and receiving WIC benefits (see Table 4).
3.4.2. Audience Cluster Demographic Profiles
The cluster analyses revealed demographic trends for the low, medium, and high likelihood of using Extension food resources. All clusters were predominately female. Cluster one (low likelihood) members were least likely to identify as female. Members of cluster one were likely to be older in age and were most likely to have completed less than high school and/or most likely to have completed a graduate degree. Additionally, members of cluster one were least likely to be employed full-time and the most likely to be retired. Additionally, cluster one members were the least likely to receive SNAP benefits. While all clusters predominately consisted of respondents who were married, respondents in cluster one were most likely to be single or widowed.
Cluster two (medium likelihood) members were more likely identify as female compared to cluster one but less likely than cluster three (Table 4). Members of cluster two were fairly evenly distributed across age categories. Cluster two members were more likely to receive SNAP benefits compared to cluster one but less likely compared to cluster three. Members of cluster two were most likely to be employed part-time. Members of cluster two were most likely to have completed a high school degree/GED.
Members of cluster three (high likelihood) were most likely to be female (Table 4). Cluster three members were most likely to be between 28 and 47 years old, more likely to be married compared to cluster one and less likely compared to cluster two, and most likely to be employed full-time. Members of cluster three trended younger than other clusters. A majority of the high likelihood cluster members were most likely to have received an associate’s or bachelor’s degree. Additionally, cluster three members were the most likely to receive SNAP benefits.
3.5. Cluster Membership and Barriers to Accessing Nutrient-Dense Food
A one-way ANOVA was used to determine if a relationship existed between cluster membership and barriers to accessing nutrient-dense food. The results indicated perceived barriers to accessing nutrient-dense food were not significantly different based on cluster membership (F(2, 777) = 2.938, p = 0.054).
4. Discussion
Demographic profiles for the low, medium, and high likelihood of using Extension food access resources groups were revealed through chi-squared analyses. Six demographic characteristics (sex, age, marital status, employment, receiving SNAP benefits, and educational level) demonstrated significant associations with cluster membership. Members of cluster three (high likelihood) were most likely to be younger, employed full-time, and to receive SNAP benefits, as compared to cluster one (low likelihood) who were least likely to receive SNAP benefits and most likely to be older and retired or unemployed but not looking for work. These results indicated that younger, fully employed individuals who were likely to receive SNAP benefits may be the most likely to use Extension food access resources.
The most experienced barriers to accessing nutrient-dense food included prices of produce, low wages/income, and not enough resources for purchasing produce. The most desired program resources included free or discounted weekly box of fresh produce, farmers’ market coupons, and mobile trucks or food markets. The most desired Extension food access resources are those that either relate to market-based solutions through discounted or free food products or resources that alleviate geographic or built environment limitations to food access (food markets and mobile trucks). Thus, the need for socioeconomic and market-based solutions within the built environment indicated Extension should increase partnerships with economic resource organizations to enhance community resilience related to food access. Looking at the difference between cluster one and cluster two members, those most likely to use the resources (cluster one) were also those most likely to receive SNAP benefits, supporting the need for free or reduced-price food options in rural communities to increase food access.
Messaging strategies for increasing participation in food access Extension programs are needed to enhance engagement by rural audiences. Based on the personas presented in the current study, specific messages should be developed and tested for their relevance and resonance with intended audiences. The Extension audience personas presented here can serve as a baseline for message testing among audiences to explore: (1) if audience profiles/personas match actual Extension participants in the program, and (2) the messaging strategies that resonate most with the audiences associated with program types to increase engagement of underreached audiences.
The one-way ANOVA found there was not a significant difference between the likelihood of using Extension resources and the frequency of experiencing barriers to accessing nutrient-dense food. However, future research could focus on developing new scale measurements that measure additional barriers to food access (such as those related to policy, the environment, or sociocultural norms) and examine if different types of barriers would have a relationship with the likelihood of using food access resources rather than just the frequency of experiencing barriers overall. The analyses may then reveal more tailored mechanisms to alleviate issues with food access in rural communities. Thus, researchers could articulate whether barriers included time, money, or something more abstract that could be accounted for when developing Extension programs focused on improving food access and availability.
Limitations existed for the current study. While non-probability sampling methods were justified for the current study, another limitation of the study was that response participation was limited to those who had internet access which can increase or impact sampling bias [46]. This is an important limitation to consider for the findings of the current study, as response participation included only rural residents who could access the internet. Selection bias and generalizability considerations should be accounted for in the interpretation of the results. Additionally, while all respondents were identified as rural by their zip code, rurality is diverse and thus further examinations of population density should be explored when developing client personas for different rural audiences.
As Extension aims to increase their impact on health promotion and food systems work more broadly, needs assessments using “client” personas with audience segmentation strategies can increase capacity to address needs using limited financial and human resources [4]. To achieve cost-efficient and sustainable programs, it is important to align program development with demonstrated needs to ensure programs address an actual gap identified among the audience [6]. Needs assessments are “tool[s] for making better decisions” [14]; combining needs assessment techniques with audience segmentation strategies ensures a greater likelihood of utilization by intended audiences [22,24].
5. Conclusions
Extension educators have the potential to serve as catalysts for improving both food systems and public health across the U.S. Behavior changes related to food behavior are often limited by food system environmental barriers, requiring an assessment of program types that help address needs at the intersection of food access and obesity prevention. Providing cost-efficient and resource-oriented needs assessment tools that can more effectively influence program development related to diet-related chronic disease prevention in rural areas may help increase the efficacy of programs and ensure the relevance of program development for rural audiences. Integration of needs assessment tools at the early phases of program development may lead to improved decision making for Extension resource allocation and utilization in addressing community health problems. Furthermore, program implementation should integrate known barriers to alleviate issues of access as well as create program resources likely to be used by the target audience. Additionally, merging the disciplines of communication (through audience segmentation and buyer personas) and Extension (through needs assessments), combines insights and strategies that enhance the outreach capacity of non-formal education institutions and other organizations aiming to achieve public-facing learning outcomes.
Author Contributions
Conceptualization, C.E.S., K.E.G., A.R.B. and A.J.L.; Methodology, C.E.S., T.M. and K.E.G.; Software, A.J.L.; Validation, A.J.L.; Formal analysis, C.E.S. and K.E.G.; Investigation, C.E.S.; Data curation, C.E.S., K.E.G. and A.J.L.; Writing—original draft, C.E.S., T.M. and A.R.B.; Writing—review and editing, T.M., K.E.G., A.R.B. and A.J.L.; Visualization, A.J.L.; Supervision, A.J.L.; Project administration, A.J.L. All authors have read and agreed to the published version of the manuscript.
Funding
This research was funded by the Centers for Disease Control and Prevention (CDC) High Obesity Program Cooperative Agreement # NU58DP006568.
Institutional Review Board Statement
The study was conducted in accordance with the Declaration of Helsinki and approved by the Institutional Review Board (or Ethics Committee) of the University of Georgia (Protocol #00005553, approved 08/10/2021).
Informed Consent Statement
Informed consent was obtained from all subjects involved in the study.
Data Availability Statement
The data presented in this study are available on request from the corresponding author. The data are not publicly available due to funding restrictions.
Conflicts of Interest
The authors declare no conflict of interest.
References
- Miller, M.; Middendorf, G.; Wood, S.D. Food Availability in the Heartland: Exploring the Effects of Neighborhood Racial and Income Composition. Rural Sociol. 2015, 80, 340–361. [Google Scholar] [CrossRef]
- Mulangu, F.; Clark, J. Identifying and Measuring Food Deserts in Rural Ohio. J. Ext. 2012, 50, 3FEA6. [Google Scholar]
- Morgan, K.T.; Fitzgerald, N. Thinking Collectively: Using a Food Systems Approach to Improve Public Health. J. Ext. 2014, 52, 3COM3. [Google Scholar]
- Benge, M.; Warner, L. Conducting the Needs Assessment# 2: Using Needs Assessments in Extension Programming: AEC684/WC347, 12/2019. EDIS 2019, 2019. [Google Scholar] [CrossRef]
- Beverly, C.J.; Mcatee, R.; Costello, J.; Chernoff, R.; Casteel, J. Needs assessment of rural communities: A focus on older adults. J. Community Health 2005, 30, 197–212. [Google Scholar] [CrossRef] [PubMed]
- Garst, B.A.; McCawley, P.F. Solving problems, ensuring relevance, and facilitating change: The evolution of needs assessment within Cooperative Extension. J. Hum. Sci. Ext. 2015, 3, 4. [Google Scholar] [CrossRef]
- Seevers, B.; Graham, D. Education through Cooperative Extension, 3rd ed.; University of Arkansas Bookstore: Fayetteville, AR, USA, 2012. [Google Scholar]
- Bloom, J.D.; Lelekacs, J.; Hofing, G.; Stout, R.; Marshall, M.; Davis, K. Integrating food systems and local food in family and consumer sciences: Perspectives from the pilot Extension Master Food Volunteer program. J. Agric. Food Syst. Community Dev. 2020, 9, 197–220. [Google Scholar] [CrossRef]
- Stearns, S.; Bonelli, J. Communication helped UConn Extension address the needs of agricultural producers. J. Agric. Food Syst. Community Dev. 2020, 10, 201–203. [Google Scholar] [CrossRef]
- Harder, A.; Narine, L.; Wells, O. Organizational Priorities for Advancing Cooperative Extension in Selected Urban Counties in Florida. J. Agric. Educ. 2019, 60, 96–108. [Google Scholar] [CrossRef]
- Sanders, C.; Cox, C.; Edgar, L.; Graham, D.; Perez, A.P. Exploring the needs of urban producers in a rural state: A qualitative needs assessment. J. Agric. Food Syst. Community Dev. 2021, 11, 99–113. [Google Scholar] [CrossRef]
- Andress, L.; Fitch, C. Rural health inequities and the role of cooperative extension. J. Ext. 2016, 54, 26. [Google Scholar]
- Penniman, L. Farming While Black: Soul Fire Farm’s Practical Guide to Liberation on the Land; Chelsea Green Publishing: Chelsea, VT, USA, 2018. [Google Scholar]
- Watkins, R.; West Meiers, M.; Visser, Y.L. A Guide to Assessing Needs: Essential Tools for Collecting Information, Making Decisions, and Achieving Development Results; World Bank: Washington, DC, USA, 2012. [Google Scholar]
- Sleezer, C.; Russ-Eft, D.; Gupta, K. A Practical Guide to Needs Assessment, 3rd ed.; Wiley: Hoboken, NJ, USA, 2014. [Google Scholar]
- United Nations Development Programme. Handbook on Planning Monitoring and Evaluating for Development Results; United Nations: San Francisco, CA, USA, 2009. [Google Scholar]
- Bayer, R.; Mitchell-Hawkins, V.; Travis, A. Needs Assessment Tool Kit. J. Ext. 2020, 58, v58-1tt1. [Google Scholar]
- Donaldson, J.L.; Graham, D.L.; Arnold, S.; Taylor, L.K.; Jayaratne, K.S.U. Extension Education Trends and Research Needs: Views from Professionals and Faculty. J. Agric. Educ. 2022, 63, 73–82. [Google Scholar] [CrossRef]
- Caravella, J. A needs assessment method for Extension educators. J. Ext. 2006, 44, 1–3. [Google Scholar]
- Randall, N.L.; Sanders, C.E.; Lamm, A.J.; Berg, A.C. Qualitative Exploration of Cultural Influence on a Rural Health-Promotion Initiative. J. Nutr. Educ. Behav. 2023. [Google Scholar] [CrossRef]
- Sanders, C.E.; Lamm, A.J.; Borron, A. Exploring identity-oriented evaluation for rural community development: A constructivist grounded theory approach. Community Dev. 2022. [Google Scholar] [CrossRef]
- Slater, M. Theory and Method in Health Audience Segmentation. J. Health Commun. 1996, 1, 267–284. [Google Scholar] [CrossRef]
- Kopfman, J.E.; Smith, S.W. Understanding the audiences of a health communication campaign: A discriminant analysis of potential organ donors based on intent to donate. J. Appl. Commun. Res. 1996, 24, 33–49. [Google Scholar] [CrossRef]
- Lamm, K.W.; Borron, A.; Holt, J.; Lamm, A.J. Communication Channel Preferences: A Descriptive Audience Segmentation Evaluation. J. Appl. Commun. 2019, 103. [Google Scholar] [CrossRef]
- Chaudhary, A.K.; Warner, L.A.; Stofer, K.A. Online certificate program moves participants to advanced stages of concern for social marketing. J. Agric. Educ. 2017, 58, 210–224. [Google Scholar] [CrossRef]
- Warner, L.; Schall, W. Using Social Marketing Principles to Understand an Extension Audience’s Landscape Water Conservation Practices. J. Hum. Sci. Ext. 2015, 3, 4. [Google Scholar] [CrossRef]
- Warner, L.; Stubbs, E.; Murphrey, T.; Huynh, P. Identification of the Competencies Needed to Apply Social Marketing to Extension Programming: Results of a Delphi Study. J. Agric. Educ. 2016, 57, 14–32. [Google Scholar] [CrossRef]
- Grunig, J.E. Publics, audiences and market segments: Segmentation principles for campaigns. In Information Campaigns: Balancing Social Values and Social Change; Sage: Thousand Oaks, CA, USA, 1989; pp. 199–228. [Google Scholar]
- Lee, N.R.; Kotler, P. Social Marketing: Influencing Behaviors for Good, 4th ed.; SAGE Publications: Thousand Oaks, CA, USA, 2011. [Google Scholar]
- Andreasen, A.R. Social Marketing in the 21st Century; Sage: Thousand Oaks, CA, USA, 2006. [Google Scholar]
- Kotler, P.; Lee, N. Social Marketing: Influencing Behaviors for Good; SAGE: Thousand Oaks, CA, USA, 2008. [Google Scholar]
- McKenzie-Mohr, D. Fostering Sustainable Behavior: An Introduction to Community-Based Social Marketing, 3rd ed.; New Society Publishers: Gabriola Island, BC, Canada, 2011; ISBN 978-1-55092-462-6. [Google Scholar]
- Huang, P.; Lamm, A.J.; Dukes, M.D. Enhancing Extension Program Effectiveness by Examining Regional Differences in High Water Users. J. Hum. Sci. Ext. 2017, 5, 4. [Google Scholar] [CrossRef]
- Carroll, A.; Lamm, K.; Borron, A. Finding the Right Channel: An Analysis of Communication Channel Preferences Amongst Potential Extension Clientele. J. Agric. Educ. 2022, 63, 131–149. [Google Scholar] [CrossRef]
- Kahlor, L.; Stout, P. Communicating Science: New Agendas in Communication, 1st ed.; Routledge: New York, NY, USA, 2009. [Google Scholar]
- Berry, L. Who Are You Targeting? The Role of Personas in Internal Communications. 2023. Available online: https://www.interactsoftware.com/blog/who-are-you-targeting-the-role-of-personas-in-internal-communications/ (accessed on 14 March 2023).
- Burke, K.; Boman, C.D.; D’Angelo, J. Using Audience Segmentation to Determine Millennial Perceptions toward GM Foods. J. Appl. Commun. 2020, 104, COV5. [Google Scholar] [CrossRef]
- Vaughn, P. How to Create Detailed Buyer Personas for Your Business [Free Persona Template]. 2020. Available online: https://blog.hubspot.com/marketing/buyer-persona-research (accessed on 14 March 2023).
- Revella, A. Buyer Personas: How to Gain Insight into Your Customer’s Expectations, Align Your Marketing Strategies, and Win More Business; John Wiley & Sons: Hoboken, NJ, USA, 2015. [Google Scholar]
- Fenton, A.; Heinze, A.; Osborne, M.; Ahmed, W. How to Use the Six-Step Digital Ethnography Framework to Develop Buyer Personas: The Case of Fan Fit. JMIR Form. Res. 2022, 6, e41489. [Google Scholar] [CrossRef]
- Klepek, M. Buyer Personas: Its use and limitations in online marketing. Mark. Identity 2019, 7, 886–896. [Google Scholar]
- Stearns, S.; Rabinowitz, A. Understanding Milk Consumption Habits Among College Students in Order to Redesign Outreach. J. Ext. 2021, 59, 9. [Google Scholar] [CrossRef]
- Vines, K. Exploration of Engaged Practice in Cooperative Extension and Implications for Higher Education. J. Ext. 2018, 56. [Google Scholar]
- Baker, R.; Brick, J.M.; Bates, N.A.; Battaglia, M.; Couper, M.P.; Dever, J.A.; Gile, K.J.; Tourangeau, R. Summary report of the AAPOR task force on non-probability sampling. J. Surv. Stat. Methodol. 2013, 1, 90–143. [Google Scholar] [CrossRef]
- Lamm, A.; Lamm, K. Using Non-Probability Sampling Methods in Agricultural and Extension Education Research. J. Int. Agric. Ext. Educ. 2019, 26, 52–59. [Google Scholar] [CrossRef]
- Gibson, K.E.; Fortner, A.R.; Lamm, A.J.; Warner, L.A. Managing demand-side water conservation in the United States: An audience segmentation approach. Water 2021, 13, 2992. [Google Scholar] [CrossRef]
- Missoula Food Bank. Annual Report. Available online: https://missoulafoodbank.org/about-us/data/annual-report (accessed on 14 March 2023).
- Carolina Farm Stewardship Association. Healthy, Fresh, Local Food: An Action Plan for Increasing Availability and Access in Beaufort County, NC; Carolina Farm Stewardship Association: Pittsboro, NC, USA, 2013. [Google Scholar]
- Cortina, J.M. What is coefficient alpha? An examination of theory and applications. J. Appl. Psychol. 1993, 78, 98–104. [Google Scholar] [CrossRef]
- Burns, R.; Burns, R. (Eds.) Cluster analysis. In Business Research Methods and Statistics Using SPSS; SAGE Publishing: Thousand Oaks, CA, USA, 2008; pp. 552–567. [Google Scholar]
- Yim, O.; Ramdeen, K.T. Hierarchical Cluster Analysis: Comparison of Three Linkage Measures and Application to Psychological Data. Quant. Methods Psychol. 2015, 11, 8–21. [Google Scholar] [CrossRef]
- Essary, C.; Fischer, L.; Irlbeck, E. A Statistical Approach to Classification: A guide to hierarchical cluster analysis in agricultural communications research. J. Appl. Commun. 2023, 87. [Google Scholar] [CrossRef]

Disclaimer/Publisher’s Note: The statements, opinions and data contained in all publications are solely those of the individual author(s) and contributor(s) and not of MDPI and/or the editor(s). MDPI and/or the editor(s) disclaim responsibility for any injury to people or property resulting from any ideas, methods, instructions or products referred to in the content. |
© 2023 by the authors. Licensee MDPI, Basel, Switzerland. This article is an open access article distributed under the terms and conditions of the Creative Commons Attribution (CC BY) license (https://creativecommons.org/licenses/by/4.0/).