Abstract
Land degradation and desertification (LDD) has gained worldwide policy attention due to decline in land quality and the resultant economic burden accrued upon a vast population reliant on land-based natural capital. In India, the impacts are becoming apparent as 24 out of 29 states have been experiencing LDD since the early 2000s. Here, we adopt a mixed-method approach combining hierarchical cluster analysis (HCA) and multilinear regression analysis (MLRA) with contextual assessments to draw on, using state-level information from 2011–2013, an age-old question: do farming operations aggravate LDD? The HCA identified 11 states that currently lead the trajectory with the highest state-wise percentages of LDD areas under ‘water erosion’, ‘salinity’, and ‘water logging’, which are the three most widely reported impacts of farming practices on land systems’ sustainability as apparent in the relevant LDD literature. MLRA of the 11-state cluster revealed that state-wise NPK fertilizer-application rates (p < 0.01); number of moldboard ploughs (p < 0.01); net irrigated area (p < 0.01); groundwater-sourced irrigation (p < 0.05); and multiple cropping practices (p < 0.01) exacerbate LDD, while bio-pesticides (p < 0.05) and zero-till drills (p < 0.01) do the opposite. In recent years, the government has introduced several improved measures, such as nutrient-based subsidies (NBS) and integrated nutrient management (INM), to help farmers optimize agrochemical applications, thus moving from traditional practices (input intensive) to a more land-conservation-centric approach. However, at the cognitive level, farmers are unsure/unaware of the benefits. Moreover, due to various institutional weaknesses, lack of sensitization, extension services, capacity building, incentives, and certain inherent flaws in these newer strategies, their uptake remains low, while traditional practices continue at the grassroots. We attempt to broaden the regulatory purview by reflecting on the DPSIR framework (Driver–Pressure–State–Impact–Response), highlighting the role of indirect drivers of LDD that largely influence farmers’ preferences for certain practices. In the final section, we emphasize the need for a data revolution to support process-level research to be able to devise more informed and targeted LDD control–abatement strategies, which is currently largely absent.
1. Introduction
Worldwide, land degradation and desertification (LDD) has emerged as a major threat to environmental and human sustainability [1], affecting 3.2 billion people and costing nearly 10% of annual global gross product [2]. On a global scale, nearly 33% of total land area is affected by land degradation (more than 4900 million ha) [3]. LDD is the outcome of multiple processes that essentially diminish the capacity of land resources to perform essential ecosystem functions and provide goods and services in the long run to all that are reliant on land-based natural capital. A rich body of literature links soil erosion to land degradation [4], often arising from unsustainable expansion of arable land [5,6], resulting in the decline in overall land quality and productivity [7]. Recent estimates reveal that vast swathes of sub-Saharan Africa, South America, and Southeast Asia experience intense soil erosional losses [8]. LDD can negatively impact the social, political, cultural, and economic spheres of development [9]. Long-term decline in biological output, coupled with ecosystem services loss and drop in land value, are among the prime outcomes of LDD that collectively threaten the livelihood opportunities of all living off the sustainability of land resources [10]. The global annual cost of LDD has been estimated at around EUR 420 billion [11]. Adding to the worry, recent investigations have observed close ties between land degradation and climate change [10].
In India, LDD has emerged as a major regulatory concern to preserve land-based natural capital and loss of associated ecosystem services and functions. Recently, a joint research committee (JRC), formed by the European Union (EU) considered India to be among the worst affected regions of the world to experience severe loss in land quality and productivity (ability to produce goods and services) [12]. As of 2011–2013, 96.4 million hectares (29.32% of the total geographic area) are affected by various LDD mechanisms [13], posing dire existential risks to a vast cross-section of population (e.g., farmers, livestock herders) [14]. In the future, LDD could become a main barrier to realizing the full benefits of various types of rural development, poverty alleviation, and farmers’ welfare programs currently underway in various parts of the country. Land quality losses could also instigate major human displacements (e.g., rural to urban migration), which would bring up additional policy challenges.
In view of the above, this narrative draws on a long-standing question in the global scientific community: is LDD due to farming practices [9,10,15,16,17]? About 55% of Indian landmass is currently under cultivation (compared to about 4% in Canada, 12% in China, 15% in Japan, and 16% in the USA), engaging over half of the national population [18]. However, detrimental impacts of farming practices on land quality have already been apparent [18,19,20,21]. Recent projections indicate that LDD may reduce national crop yields by 50% by 2050, which in turn will lead to livelihood and income loss [12], with a potential drop in overall national GDP by about 2.5% (~USD 49.6 billion) [22,23]. The latter, as recent estimations warn, may even amount to a 15.5% loss in gross value added (GVA) in agriculture and allied sectors [24,25]. It is commonly observed around the world that as land quality declines, farmers resort to more aggressive routines to maintain production, which, in a negative feedback loop, further accentuate land degradation. The cycle continues over the years, eventually leading to extreme desertification events.
We developed the narrative around a long-standing policy question: can the impacts of farming practices on LDD be quantitatively substantiated for India? This follows from our literature search that revealed that quantitative research that statistically validates the claims of an LDD–farming nexus in India is currently largely absent. Most studies have either focused on spatial mapping and/or changes in LDD over time [26,27], or they have assessed the economic impacts of LDD [12,22,23]. Most of these studies have used remotely sensed data of biophysical parameters (e.g., vegetation). Here, we use archival information of a wide variety of soil–water parameters within a multivariate environment to relate farming practices with LDD. To that end, we envision our work to become a foundation document for regulatory authorities (RAs) to initiate more targeted research with increased case studies in the future. Along that line, we integrate our findings with current agro-policy visions in India to investigate farmers’ preferences for certain practices, an understanding that may help RAs build robust decision-support systems for co-management of LDD and farming. To aid in regulatory decision making, we discuss the DPRSIR framework (Driver–Pressure–State–Impact–Response) that is adopted worldwide as a policy tool to identify key drivers/pressures and devise context-relevant response strategies.
Moreover, our literature search revealed that LDD-related studies in India are not just sparse but are also limited by small spatial dimensions (farm/district level) [27,28], outcomes of which are difficult to upscale to plan ameliorative interventions at the state/national level. In view of that, we present our analysis at two spatial scales: (i) national (including all 29 states) and (ii) regional (selected states), which could offer the authorities a sense of spatial optimization of interventions, for example, prioritizing LDD combat action in the problem areas. In the final part of the narrative, we shed light on data quality concerns, which are also scanty in the relevant literature. In addition to discussing how the performance of statistical models, such as the one developed in the present study, could be improved for better prediction of LDD, we present to the RAs a brief critique on legacy data that still form the basis of many soil/land system degradation studies in India, despite the myriad of flaws in data organization, reliability, accuracy, and precision [29]. During this process, we draw regulatory attention to explore opportunities with digital soil mapping (DSM), which has become the frame of reference for soil quality studies around the world, but is still in its infancy in India [30,31,32].
Overall, we adopt a mixed-method approach of quantitative analyses coupled with contextual appraisal of policies and practices to highlight the intertwined dimensions of LDD and farming, which is largely missing in the relevant Indian literature. The idea was to engage RAs in systemic thinking, to regroup, revisit, and reimagine the basic premises of farming practices in India in relation to LDD. An implicit notion is also to initiate cross-disciplinary dialogues between the decision maker, research communities, practitioners, farmers, and social organizations to deliberate on LDD prevention and control, while maintaining farm production (food nutritional security, rural poverty alleviation, and development).
2. Materials and Methods
2.1. Agricultural Patterns in the Study Area
Over 65% of the Indian population reside in rural areas (Figure 1a), dominated by agricultural households (Figure 1b). While the west and west-central parts of the country represent prime locales of agriculture (Figure 1c,d), preferences for irrigation are common throughout the nation (Figure 1d). For a long time, agriculture has been the key policy instrument for poverty alleviation [33]. Nearly 14.5% of national GDP is sourced from agriculture and allied sectors [34]. India is the largest producer of milk, pulses, jute, and spices, with the world’s largest cattle herd (buffaloes) [35] Presently, the agricultural sector engages about 49% of total national households [36,37]. Since independence, the agriculture sector has experienced several phases of reformative changes, most notable of which was the Green Revolution (1958–1969) that marked a paradigmatic shift. These included a transition from rainfed to irrigated practices, canal systems to well-based irrigation, the introduction of high-yielding varieties (HYV), lucrative subsidies for agrochemicals (fertilizers and pesticides), power and well installation, and a push for farm mechanization [38]. However, the detrimental impacts of that phase of agricultural intensification, which was unregulated and uninformed in most cases, on environmental systems have become apparent in recent years, including widespread water resource depletion and contamination [39], as well as decline in land quality [40,41]. The latter has grave consequences for communities reliant on the sustainability of land-based natural capital [39]. The latter has emerged as a serious policy concern in recent years, especially with the projection of climatic imbalances that will affect natural ecosystem services and functions. This may lead to unwarranted production failure, which in turn will undermine on-going food–water security, poverty alleviation, and farmers’ welfare programs. However, quantitative appraisal of the farming–LDD nexus at the national level is sparse. Most research has been undertaken at the individual level, carried out by independent research groups or universities, focusing on selected geographic locales.
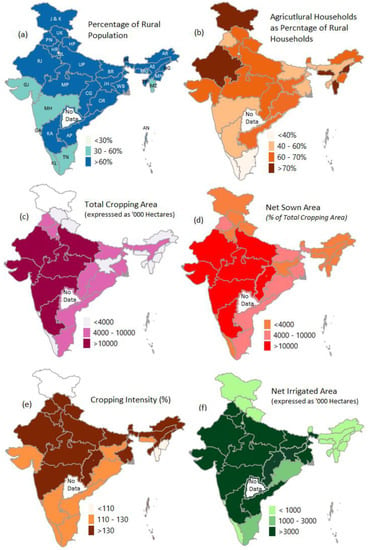
Figure 1.
Demographic and agricultural traits of India (author’s own illustration. NOTE: Telangana was not formed as a separate state of Andhra Pradesh (AP) during the timeframe of the data). (Data Source: Census 2011; Directorate of Economics and Statistics, Ministry of Agriculture and Farmers’ Welfare, 2012–2013).
Recent investigations by the Space Application Center (SAC) under the Indian Space Research Organization (ISRO) revealed that as of 2011–2013, 29.32% (96.4 million hectares, mha) of India is experiencing LDD, growing from 28.76% (94.53 mha) in 2003–2005, and is apparent in 24 out of 29 states [18]. Prime LDD mechanisms in India include the following: (1) vegetative degradation; (2) water erosion; (3) wind erosion; (4) salinity; (5) water logging; (6) human dynamics (includes settlement and man-made); (7) frost shattering; and (8) others (mass movement and barren/rocky) (Figure 2a,b) [13]. Erosion is the prime driver of LDD in India, accounting for over 16% of total LDD national area (water erosion accounts for about 11%, while wind accounts for about 5.55%), negatively affecting land productivity, crop yield, farm income, and livelihood.
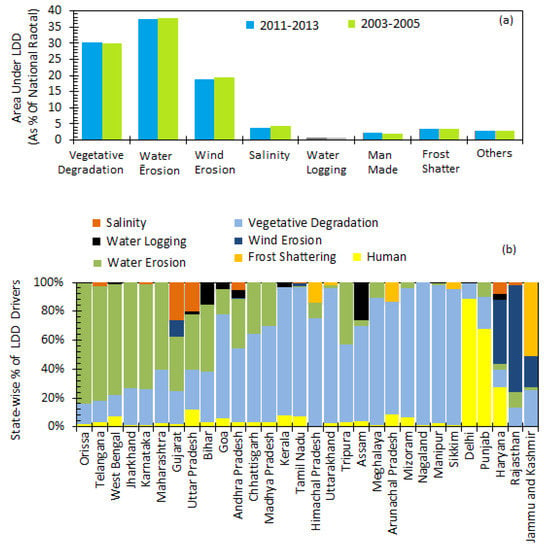
Figure 2.
Relative proportions of area under different LDD mechanisms in 2011–2013 (a) expressed as percentage of nationwide total of respective LDD mechanism; and (b) state-wise (Source: 18).
2.2. Data Acquisition, Compilation, Quality Concerns
Information about the LDD area was obtained from the Space Applications Centre (SAC) as the state-wise area affected by different LDD mechanisms (expressed as percentage of state geographic area) [18]. Information about a range of agronomic variables was derived from multiple governmental archives, including agricultural year nooks of various years, the Ministry of Agriculture, the Ministry of Farmers’ Welfare, the Fertilizer’s Association of India, and the Central Ground Water Board (Table 1).

Table 1.
Broad categories of soil–water parameters used in the study.
During this phase, however, we realized that data quality is a prime impediment to conducting full-scale statistical modeling that could potentially substantiate the farming–LDD nexus. There is a dearth of information on most of the farming-related parameters that we considered critical for process-level appraisal of LDD and would thus support decision making for LDD control–abatement. Information for variables was either unavailable at the desired spatial–temporal resolution (state level, 2011–2013 period) or completely unavailable (e.g., tillage practices, grazing dynamics, cover-cropping, crop rotation) (for more details, please see Section 5.2: Towards A Data Revolution?). Moreover, we observed a lack of information regarding data quality, namely accuracy and precision. In India, soil–water information is collected by a wide variety of public agencies using different techniques (due to a lack of standardized operating procedures) and operating with varied priorities. There has been little effort to harmonize data collection processes and organize the data over the years. Moreover, with little or no data quality control checks, such divergent approaches have led to wide spatial–temporal variability. Realizing this limitation, for statistical modeling, we used the data regarding soil–water parameters from 2011–2013 (if available) or the data that were closest to that time period.
2.3. Analytical Procedures
Statistical analyses were performed in three stages (Figure 3). In the first stage of the analyses, state-wise areas under three LDD categories, namely ‘water erosion’, ‘salinity’, and ‘waterlogging’ were computed as percentages of the respective states’ total LDD areas. The areas obtained were combined and used in the next stage of the analysis, namely hierarchical cluster analysis (HCA). For our purpose, LDD categories such as ‘frost shattering’ and ‘wind erosion’ were omitted from the present analysis as they had very localized geographic distribution, occurring only in certain states without nationwide concerns. For example, frost shattering is critical mainly in hilly states, such as parts of Jammu and Kashmir (J and K), Himachal Pradesh (HP), Arunachal Pradesh, and Uttarakhand (UK).
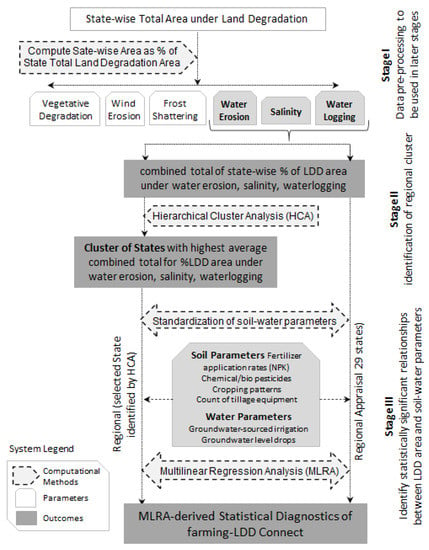
Figure 3.
Flow diagram for multilinear regression analysis (MLRA) as adopted in TIER I investigation. MLRA was performed at three stages, both at national (incorporating information of all 29 Indian states) and subnational level (selected states as identified by hierarchical cluster analysis; Figure 3).
However, prior to any statistical analyses, the LDD and soil–water parameters were tested for normality using the Kolmogorov–Smirnoff (K–S) test at a p < 0.05 probability level. Results indicated non-normal distribution for all parameters and thus were subjected the results to a ‘data transformation’ step using the following equation:
where Xnormalized denotes the normalized value of the predictor variable, while Xmin and Xmax denote the minimum and maximum values of the same, respectively.
HCA was performed by the Ward’s minimum variance algorithm using the squared Euclidean distance [42]. Ward’s method tends to minimize the total intra-cluster variances based on the error sum of squares (ESS) as follows:
where Xi denotes the score of ith entity. The squared Euclidean distance is computed using the following equation:
where d represents the squared Euclidean distance, the rth and sth rows of data matrix X are denoted by (Xr1, Xr2. Xr3…Xrp) and (Xs1, Xs2, Xs3…Xsp), respectively. These two rows correspond to the observations of two objects for all p variables. The quantity is referred to as the squared Euclidean distance.
In the third stage of the analyses, multilinear regression analysis (MLRA) was performed at two spatial levels: (i) national (incorporating all 29 Indian states) and (ii) regional (11 states; Cluster 1; as given in Figure 3). We used a first-order multilinear regression model to assess a potential cause–effect relationship between land quality and various farming practices. MLRA took the following form:
where Y = LDD area (response/dependent variable); xi…n = various independent variables used in the study (farming-related parameters as listed in Table 1); a0 = MLRA regression intercept; ai…n = slopes of the regression line with independent variables up to the nth variable; and u = uncertainty factor. The Y variable denotes the state-wise percentages of LDD areas under a combined total of water erosion, salinity, and waterlogging, while x denotes various soil–water parameters. The MLRA model was assessed using several diagnostic tests, including the variance inflation factor (multicollinearity and inter-dependencies among predictor variables) to assess the robustness of the model [43].
Y = ao + a1x1 + a2x2 + … + anxn + u
3. Results
3.1. Hierarchical Cluster Analysis (HCA)
HCA grouped the Indian states into three clusters that differed significantly (p < 0.005) in terms of LDD areas (Figure 4). Among the three, ‘Cluster 1’ led the national trajectory in state-wise LDD-affected areas, with highest total state area under ‘salinity’, ‘water erosion’, and ‘water logging’, as expressed as percentages of the respective states’ total LDD-affected area. The cluster included 11 states, namely AP, BR, CG, GJ, JH, MP, MH, UP, WB, OR, KA, and TR.
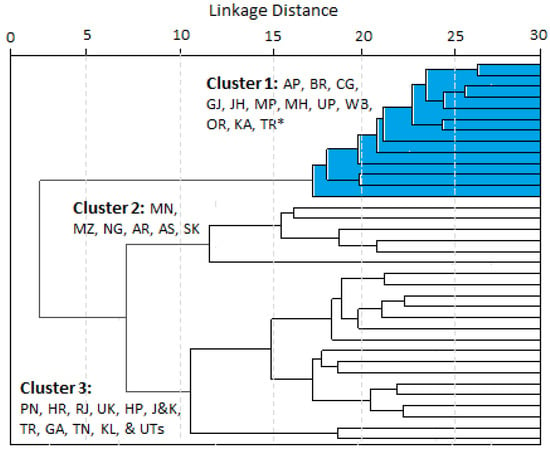
Figure 4.
Dendrogram resulting from HCA, identifying cluster of states (p < 0.05) based on LDD mechanisms (see the Methods section for details). Cluster 1 (blue shaded area) is considered for subsequent analysis (multilinear regression analysis, MLRA). Cluster 1 includes 11 states as follows: AP (abbreviated form for the state of Andhra Pradesh); BR (Bihar); CG (Chhattisgarh); GJ (Gujarat); JH (Jharkhand); MP (Madhya Pradesh); MH (Maharashtra); UP (Uttar Pradesh); WB (West Bengal); OR (Orissa); KA (Karnataka); and TR (Tripura).
3.2. Correlation Analysis (MLRA) between LDD and Farming Parameters
The overall MLRA model parameters revealed significant statistical associations between state-wise LDD area and farming-related parameters on the regional level (the 11-state cluster as depicted by HCA) (adjusted R2 = 0.492; p < 0.05) (Table 2). They indicated that, at least regionally, farming practices aggravate LDD and deteriorate land system sustainability (i.e., the ability to produce goods and services in the long run), corroborating similar findings from other parts of the world [1]. Statistically, this inference is supported by the lack of multicollinearity in the MLRA model, at any of the levels, as the corresponding VIF was substantially lesser than 10 [43].

Table 2.
Nationwide (all 29 states) and regional (11 states, identified by HCA) summary of multilinear regression analysis (MLRA).
3.2.1. Mineral Fertilizers
Regionally (the 11-state cluster identified by HCA), mineral fertilizer application (N-P-K-based) aggravated LDD hazards (indicated by the negative correlation between NPK application rates and LDD area) (Table 3). In the majority of these 11 states, fertilizer-application rate increased over time (Figure 5a).

Table 3.
Nationwide and regional summary of multilinear regression analysis (MLRA) conducted between state-wise percentages of LDD areas (water erosion + soil salinity + water logging) and corresponding state-wise soil and water parameters as given in Table 1. The t-values present the level of significance of individual regression coefficients. ‘Error’ denotes standardized error; “Residual” denotes studentized residual.
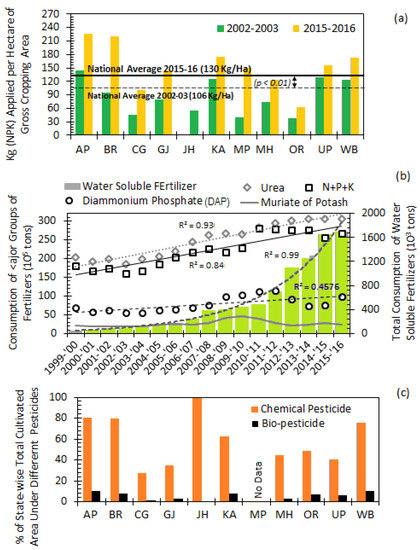
Figure 5.
(a) State-wise NPK fertilizer-application rate (Kg/hectare of gross cropping area) in the 11-state regional cluster; (b) nationwide consumption of major fertilizer types (105 tons); and (c) area under pesticides as % of state-wise total cultivable area in the 11-state regional cluster (plotted for only 2011–2012 period). (Author’s own illustration; Source: Fertilizer Association of India; Ministry of Agriculture, Govt. of India).
Seven of these eleven states stood above the national average (130 kg/hectare) during the 2015–2016 period, compared to four in 2002–2003 (106 kg/hectare). In all 11 states, NPK fertilizer-application rates increased between 2002–2003 and 2015–2016, doubling in AP, BR, CG, GJ, and MP. At the national level, inorganic fertilizer use grew over time (Figure 5b). Between 1999–2000 and 2015–2016, urea consumption increased by about 1.5 times, while water-soluble fertilizers increased exponentially.
3.2.2. Pesticides
Regionally, state-wise LDD area was negatively corelated with (1) areas under bio-pesticides (p < 0.05) and (2) the ratio of the areas under bio-pesticides to chemical pesticides (p < 0.05) (Table 3), which indicated that increasing the proportion of bio-pesticides in the total pesticide mix may help RAs countering LDD. In the 11-state regional cluster, only about 3.5% of the area operated under bio-pesticides (Figure 5c). On the other hand, areas under chemical pesticides were nearly 40–53 times higher on average than those under bio-pesticides, indicating (i) farmers’ preference for input-intensive farming and (ii) little awareness of, or capacity to shift to, land-conservation-centric practices.
3.2.3. Tillage
Regionally, significant positive correlations were observed between state-wise LDD area and number of moldboard ploughs (p < 0.01), tractors (p < 0.01), and power tillers (p < 0.05) (Table 3), indicating detrimental impacts of tillage operations. Moreover, state-wise LDD area varied inversely with the number of zero-till drills regionally (p < 0.01) and as its proportion increased in the total mix of tillage equipment (p < 0.01). This implies that tillage reduction might help RAs minimize soil disturbances while offering an opportunity to preserve land system sustainability (i.e., the ability to provide goods and services in the long run). In each state within the regional cluster, amounts of tillage equipment have increased significantly over time, indicating growing levels of soil disturbances (Figure 6a). These 11 states cumulatively accounted for nearly 79% in 1992, 73% in 2003, and 65% in 2012 of the nation’s total moldboard ploughs, power tillers, and tractors, respectively (Figure 6b), while less than a third of that of the nation’s zero-till drills. Nationally, the sales of tractors and power tillers have grown by about 13 and 24 times, respectively, since the 1990s, indicating increased demand for aggressive tillage to increase production (Figure 6c). This is a trend that we expect to only rise further in the future given the deteriorating state of land quality, which will prompt more aggressive farming routines.
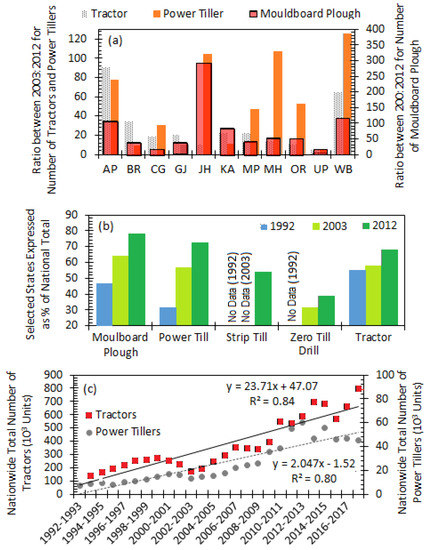
Figure 6.
(a) State-wise temporal trend in tractors, power tillers, and moldboard ploughs in the 11-state regional cluster, expressed as a ratio of 2012 and 2003; (b) total number of different mechanized farm equipment in the 11-state regional cluster, expressed as % of corresponding national totals in 1992, 2003, and 2012; and (c) total annual sale of tractors and power tillers (given by 103 units) at the national level since 1992 (author’s own illustration; Source: author’s compilation, Reserve Bank of India, Ministry of Agriculture and Rural Development, Rajya Sabha notes).
3.2.4. Irrigation
MLRA indicated strong negative impacts of net irrigated area (NIA) on LDD at the regional level (p < 0.05) (Table 3). Interestingly, for the authorities, the impact becomes more apparent when irrigation parameters are considered in combination with cropping patterns, e.g., NIA ‘cropped twice’ (p < 0.01) and ‘more than twice’ (p < 0.01) (Table 3). This 11-state regional cluster represents the focus of irrigated agriculture in India, accounting for nearly 76% of total national NIA and about 65% and 86%, respectively, of national NIA that are ‘cropped twice’ and ‘cropped more than twice’ (Figure 7a). Cumulatively, AP, BR, MP, OR, UP, and WB, account for over 69% of total NIA ‘cropped twice’ (Figure 7b). These states mark the seat of excellent rice–wheat cultivation in India, accounting for a large fraction of agricultural revenue in the respective states, in addition to providing livelihood support to millions of farming households.
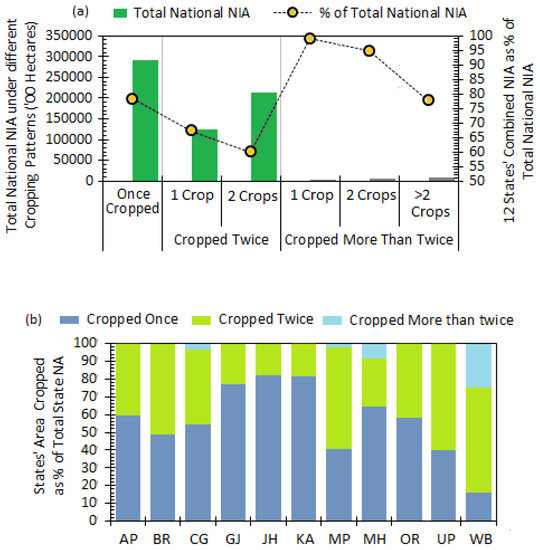
Figure 7.
Net irrigated area (NIA) under different cropping patterns (a) at national level (2011–2012); and (b) in the 11-state regional cluster (2011–2012) (author’s own illustration; data source: Directorate of Economics and Statistics, Ministry of Agriculture and Farmers’ Welfare).
However, land under multiple cropping systems when coupled with irrigation accelerates LDD in several ways, including accelerated soil erosional losses and evaporative enrichment of mineral salts in the topsoil (Table 4).

Table 4.
Land quality concerns related to irrigation as observed in Indian farming sector.
In several states of the 11-state cluster, total area under irrigation (food + non-food crops) have increased in recent years, with 18–40% rises observed in CG, GJ, MP, RJ, and UP (Figure 8a). Nationally, irrigated areas under food crops increased by about 21%, while the national total irrigated area (food + non-food crops) increased by about 23%, indicating the growing preference for irrigated production (higher yield and income). Much of this rise is probably linked to rises in areas under irrigated rice and wheat, which increased by about 9% and 29%, respectively, between 2001–2002 and 2014–2015 (Figure 8b). Both crops are highly water-intensive varieties, thus exerting immense pressure on water resources.
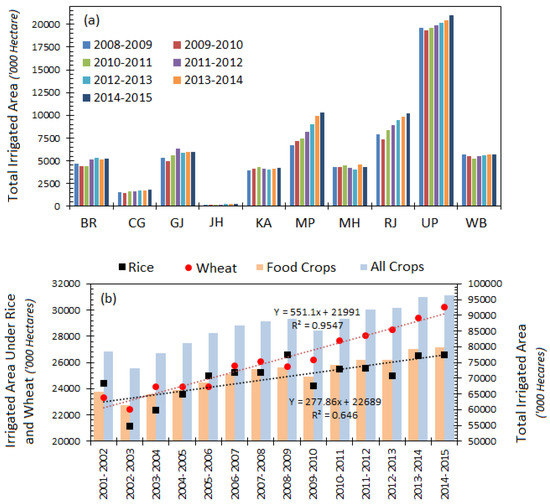
Figure 8.
Assessment of irrigation patterns (a) in the 11-state cluster and (b) at the national level (author’s own illustration; data source: Directorate of Economics and Statistics, Ministry of Agriculture and Farmers’ Welfare).
MLRA revealed the detrimental effects of dropping water levels on LDD, an effect that was apparent both nationally (p < 0.01) and regionally (p < 0.01), indicating a holistic impact on LDD, presumably via irrigation scarcity and increased likelihood of soil salinization. Recently, preference for groundwater-sourced irrigation has grown nationally, replacing surface-water-based systems (canals) (Figure 6c). In AP, BR, GJ, KA, MP, MH, and UP, the areas under groundwater-sourced irrigation account for about 55–78% of the respective states’ total NIA.
4. Discussion
4.1. Assessment of MLRA
A prime impetus to conduct the analysis at two spatial levels was to highlight to authorities that LDD–farming nexus might not be apparent at the national scale but it is at the regional scale. Therefore, authorities should contemplate spatially optimizing farm interventions, befitting regional concerns. Differences in MLRA outputs between national and regional estimates could result from several interlocking factors, such as (i) spatial variability associated with farming operations (e.g., a farmer can use different fertilizer-application rate and/or variety of fertilizer mixes in different plots) and thus uncertainty around the data; (ii) use of ‘surrogate’ parameters; and (iii) unavailability of data for several critical factors (e.g., grazing and livestock details). To that end, we emphasize the need to grow a deeper understanding of the error terms in MLRA (Table 3), which embodies the uncertainty associated with such predictive models. In the present case, higher degrees of uncertainty were associated with tillage parameters. This might have arisen due to the use of the number of tillage instruments rather than actual information regarding the tillage intensity. Information about the latter, however, was not available in the governmental archives and thus we could not use it as input to our MLRA model. Overall, the MLRA revealed statistically significance negative impacts of input-intensive practices in several states, which should caution the RAs about future risks of productivity loss to LDD, and in turn production failure. The latter may have ramified impacts on the rural economy, including food-nutritional nutritional insecurity, and loss of farm livelihoods and income. Collectively, they will thwart farmers’ welfare and rural development programs currently operational under multiple government ministries. There could even be risks of export losses and the revenue therein.
4.2. Mineral Fertilizers
Presently, all farmers in India are entitled to fertilizer subsidies [44,45]. However, fertilizer use is far from a recommended practice and embeds two hidden facets that damage land quality and accentuates LDD hazards as follows:
- (A)
- FERTILIZER IMBALANCE: Deviation in relative proportions of N, P, and K in fertilizer mixes from what is ideally prescribed, i.e., 4:2:1 [46]. This also deviates from the global average NPK ratio of 3.4:1.3:1 [47]. NPK ratios in fertilizers vary widely from 5.4:2.7:1.8 to about 8.2:3.2:1 from region to region [48]. With little regulatory oversight and farmer awareness of detrimental impacts, preference for increased N content in fertilizers has persisted for a long time, which now threatens land system sustainability, risking production failure due to the deterioration in overall land quality.
- (B)
- FERTILIZER OVERDOSE: In the race to attain better yield and income, farmers often end up ‘dumping’ more than what is necessary (crop requirement and assimilative capacity of soils) [49,50].
The growth in fertilizer use in India is partly owed to food price instability in the domestic and international market, which impacts farmers at the cognitive level and inclines them to use more input-intensive means to maintain production (livelihood and income generation) [47]. The production of fertilizer-N in India skyrocketed between the 1960s and 2015–2016, rising from 0.1. to 13.5. million tons (Mt), while consumption of fertilizer-N increased from about 0.6. to 17.4 Mt, establishing India as the second largest producer/consumer of nitrogen in the global market [47,51]. However, steady growth of mineral fertilizers entailed ramified negative impacts on environmental systems’ function and quality, including elevated risks of soil–water salinization [52], soil acidification [53], soil compaction [54], and groundwater contamination [55]. Toxic high N-laden leachate to groundwater [55,56,57]. In India, this might have critical implications for environmental health as nearly 80% of added N-fertilizer is lost and eventually contaminates groundwater systems [58]. Preferences for N application also leads to enhanced GHG emissions in the form N2O released from farmlands, which has increased by several folds in recent years [59,60]. Overall, unregulated and uninformed fertilizer use over the years has resulted in a host of undesired outcomes that collectively compound and confound environmental policy making in the country. However, as fertilizer is a politically entrenched issue, any measure to moderate it results in huge protest from farmers and political parties.
In view of the above, the government has recommended improved fertilizer mixes based on (i) specific crop-nutrient demand; (ii) rate of crop uptake; and (iii) the assimilative capacity of soil systems [46]. It is as Honfoga observed, “adjusting current fertilizer recommendations to site-specific soil conditions is urgently required to enhance production” [61]. In this regard, the nutrient-based subsidy (NBS) scheme, launched by the government of India in 2010, was specifically meant to facilitate shift from a product-based subsidy system by developing more customized fertilizer mixes [45]. However, a main criticism against the NBS scheme has been that in its present form, it applies only to P-K fertilizers [62], which completely leaves out urea, effectively making it a cheaper option for farmers. On the other hand, the fixed subsidy structure of P-K fertilizers under the NBS scheme has practically led to a rise in their market prices [63]. This acts as a demotivating factor for farmers to comply with NBS, while inclining more to utilize low-priced urea. Urea has been farmers’ choice for ages, despite its impact on land quality, which is now magnified due to the current NBS approach.
Recently, the government has also emphasized the increased adoption of integrated nutrient management (INM) practices to help farmers (i) harness and optimize all possible ‘natural’ sources of nutrients (bio-fertilizers) and (ii) match soil nutrient supply and assimilative capacity with crop demand [64]. At their core, the INM-type approaches allow farmers to consider economically optimal nourishment for crops while minimizing risks of nutrient losses (surface runoff and/or leaching) [65]. In the Indian context, studies have recently emerged, advocating a mix of chemical and biofertilizers (e.g., farmyard manure, FYM) that can enhance nutrient use efficiency [66] and improve production [64] while inflicting minimal damage to land systems [67]. Studies have even found that striking an optimal balance between chemical and biofertilizers substantially improves wheat yields [68] that in turn increases the NPK uptake via crops (improved nutrient use efficiency), compared to NPK application routines alone [69,70]. From the LDD perspective, the collective outcome of this is a reduced amount of unused fertilizer on soil, lower chances of farm runoff and/or leaching, and thus lesser risks to land quality.
However, the level of NBS-INM adoption at grassroots is still low. This is due to the confluence of structural and institutional shortcomings, including lack of capacity building (hands-on training) and the unawareness of farmers of specific benefits (crop yield, income, input costs) of these newer varieties compared to traditional fertilizer. In the absence of organized sensitization drives at the grassroots level, the practice of indiscriminate use of traditional fertilizers continues unabated.
4.3. Pesticides
Presently, bio-pesticides account for less than 5% of the national pesticide market in India [71]. Low adoption rates are primarily due to farmers’ lack of awareness of, and thus confidence in, the advantages of bio-pesticides compared to chemical varieties. At the cognitive level, this owes to apprehensions about (1) the delayed ‘knockdown’ effect; (2) the low persistence and residual effect; (3) target-specific action; and (4) the negligible waiting period [62,72,73]. In its present state, a web of interlocking barriers retards bio-pesticide uptake rates, including (a) limited availability at local village shops/markets [74]; (b) slower action and target specificity that make bio-pesticides a niche and labor-intensive deal [75]; (c) a large fixed cost (low affordability) [76]; and (d) unavailability in ready-to-use forms [77]. Under the circumstances, certain strategies could be considered such as:
- ○
- Providing farmers with concrete evidence of the efficacy of bio-pesticides (e.g., assurance about income enhancement and improved crop yields)
- ○
- Making high-quality bio-pesticides available at affordable prices in local village shops/markets
- ○
- Lowering bio-pesticides registration cost
- ○
- Ensuring fast-track registration of newly developed varieties
- ○
- Building a digital database of bio-pesticides on open-sourced platforms
- ○
- Strategically increasing the liaison between bio-pesticide marketers, regulators, and retailers
- ○
- Organizing sensitization and capacity building at grassroots (e.g. focused group discussions, one-on-one meeting, door to door campaigns)
- ○
- Subsidizing bio-pesticides
- ○
- Incentivizing farmers for bio-pesticide uptake
- ○
- Developing insurance schemes for risk aversion
4.4. Tillage
Tillage is deemed a key driver of LDD, causing mechanical disturbance to the soil system that ramifies negative outcomes (Figure 9). Recent research shows that soil loss from conventionally tilled land exceeds the rate of soil formation by >2 orders of magnitude [9]. Soil loss entails nutrient loss which, in a cyclic feedback loop, prompts farmers to use more agrochemicals to maintain production. The latter further deteriorates land quality and aggravates LDD.
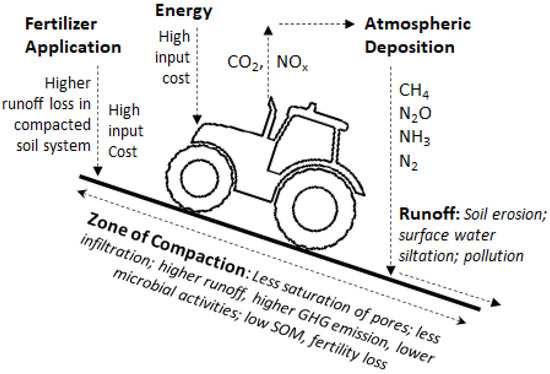
Figure 9.
Simplified view of potential outcomes of sustained use of heavy machinery (e.g., tractors) on soil systems sustainability/productivity (author’s own illustration).
In India, tractor sales have steadily increased since the 1990s. Tractors are known to cause soil compaction [78], resulting in reduced porosity, increased bulk density, and penetration resistance [54], retarded root development, and plant growth/yield [79,80]. They also escalate greenhouse gas emission risks [81]. Moreover, repeated tillage can destroy soil structure and disturb aggregate formation processes [82,83], which may accelerate soil organic matter (SOM) mineralization [84,85,86]. Despite several opportunities of reduced tillage (zero till and/or no till) from other parts of the world, there is little evidence of its adoption in India. A primary reason for this is low awareness of the science of tillage, how it affects land productivity, and lack of sensitization. Farmers are always apprehensive of newer ideas that destabilize traditional and tested practices. It will take strategic capacity building at the grassroots level (focused group discussions, one-to-one interviews, village meetings) using dedicated extension service agents. Narrating success stories from other regions may help dispel myths/taboos and grow confidence among farmers. However, such efforts are absent or scanty at best.
4.5. Irrigation
Groundwater levels are on a declining trajectory across all of India [87]. For the most part, this owes to rise in groundwater-sourced irrigation practices, beginning with the major push for irrigation development during the Green Revolution of the 1960s (governmental efforts to ensure food security, growing self-reliance, and poverty alleviation). Between the 1960s and 2010s, total irrigated area under well-based irrigation at the national level has expanded from about 28% to 69%, while that under surface-water-sourced irrigation plummeted from about 41% to 26% (Figure 10).
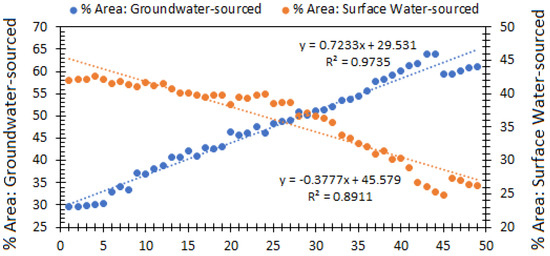
Figure 10.
Percentages of national area under various types of irrigation between 1960s and 2010s (author’s own illustration; Source: Central Ground Water Board, CGWB).
On the other hand, however, in most parts of the country, groundwater levels have plummeted significantly (Figure 11a). This is due to increased irrigational extraction (Figure 11b) and groundwater development (rate of natural recharge vs. extraction) (Figure 11c). The net effect of this has been decreased groundwater availability for future use in most parts of India (Figure 11d).
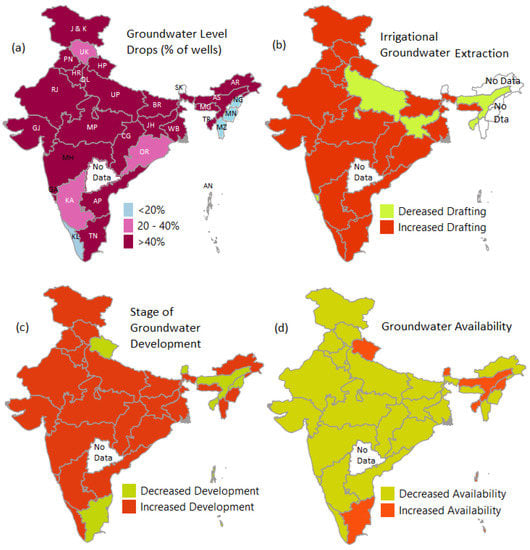
Figure 11.
(a) State-wise % of wells registering groundwater level drops in August 2013–2014 compared to 2010, as well as changes between 2008 and 2013–2014 in (b) irrigational groundwater extraction; (c) stage of groundwater development; and (d) groundwater availability for future use. NOTE: ‘Decreased’ indicates lower value of the parameter in 2013–2014; no data; Telangana was not formed in 2013–2014. (Author’s own illustration; Source: Compilation form various Groundwater Yearbooks of the Central Ground Water Board).
Over-reliance on groundwater, however, has given rise to several environmental issues. For example, as groundwater resources occur in a highly mineralized state [87], sustained irrigation may elevate soil salinity levels [88,89,90,91]. It may even accentuate health disorders through the consumption of contaminated crops and biomagnification [92]. In addition to eco-environmental consequences, over-reliance on groundwater for irrigation results in dire irrigation shortages over time, translating into production failures and livelihood crises [93,94]. In the absence of any systematic water tariffing [95], the situation may worsen further in the future. Sinking water levels have a pronounced sociological dimension in India, giving birth to friction and unrest among many agrarian communities and creating conflict situations [96,97].
5. Future Directions and Developments
5.1. Towards a Systemic Vision: The DPSIR Framework
To attenuate rising LDD threats, we urge authorities to adopt an integrated approach, combining high-end research with policy instruments, as well as socio-cultural dimensions of farming. In this regard, some reflections on the DPSIR model, which is adopted worldwide as a policy tool to address eco-environmental degradation of any kind, could be beneficial. The model helps the authorities view LDD within an interlocking web of the Driver (D), State (S), Pressure (P), Impact (I), and Response (R) (Figure 12a) [81,98]. By the same token, DPSIR can offer authorities a conceptual framework consisting of a complex feedback system between farming and land resources vulnerability (Figure 12b), laying the foundation to a robust decision-support system for the co-management of LDD and farming.
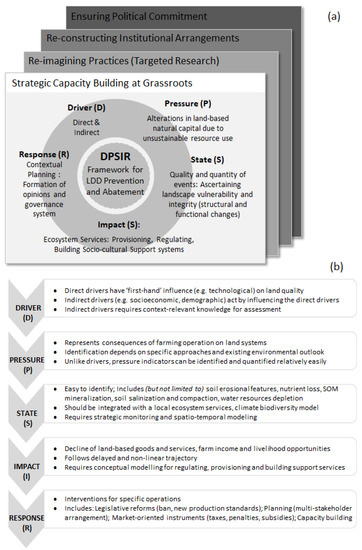
Figure 12.
(a) Theoretical depiction of the DPSIR model (the multilayered structure signifies aspects that impact farming–LDD nexus) and (b) the significance of each element (author’s own illustration).
Within the DPSIR framework, however, we specifically urge RAs to be mindful of indirect drivers, which are not readily apparent but largely dictate farmers’ choices at the cognitive level and impair land quality:
- -
- Dietary Shifts: Rapid economic growth, urbanization, globalization, and elevated living standards have prompted dietary shifts in India [99], just like the rest of the world, with rapidly growing preferences for a protein-rich diet (meat and dairy products) [100,101]. This requires intensive farming routines, which have large environmental footprints [101,102].
- -
- Alteration of Food Supply Chain: With changing demographic patterns, the food supply chain has been transformed from production to retailing. This is marked by the growing emphasis of producers and food retailers on a cheap, flexible, and shorter production chain. Such aspirational targets operating with the main idea of profit maximization prompts farmers to continue with the long-standing ‘tried-and-tested’ means of input-intensive farming.
- -
- Traditional Thinking of Success: Despite growing attention to declining environmental quality and ecosystem services, excellence in the farming sector is still only measured by economic returns, i.e., crop yield and per capita productivity. Consequently, farmers adopt any means to increase production, regardless of the impact on land quality.
- -
- Export-oriented Farming: The government still largely promotes production of certain crops that have high international market value. However, several of these crops demand input-intensive farming (e.g., rice, wheat).
- -
- Short-term Thinking: The agrarian policy sector is known for shortsightedness, which is the outcome of rapid privatization (rise of corporations and multinationals), wherein large agribusiness firms push for industrial modes of production, often with little regard for long-term environmental consequences.
- -
- Individualism: Policies are largely developed in silos. For examples, there is little coordination between various ministries (e.g., land, water, farmers’ welfare, agriculture, energy) to devise mutually complementary strategies (e.g., offering lucrative fertilizer and energy subsidies without consulting the ministries of land, water, and environment). Such individualism prompts farmers to discover loopholes and continue traditional practices of input-intensive farming.
- -
- Political Entrenchment: Most forward-thinking agro-policies are branded as anti-farmer, heavily criticized, and repealed. This largely occurs due to political cohorts seeking to gain populist mandates among the electorate, which, on most occasions, is largely comprised of farming communities.
5.2. LDD Monitoring and Assessment: The Need for a Data Revolution
LDD is a cross-disciplinary phenomenon, with its drivers, pressures, and impacts spanning over multiple sectors of rural development and food security, ranging from water to land management practices. Therefore, building a robust statistical model capable of predicting future LDD risks requires information from a wide range of disciplines, with high spatial–temporal resolution (e.g., at state/district level, yearly basis). It is also necessary to construct detail spatial maps to identify hot spots of future LDD hazards and influence resource-allocation protocols accordingly (e.g., budget, manpower, infrastructure). However, the availability of such high-quality, multisectoral data are a distant myth in India.
Moreover, authorities should realize any research in the line of the LDD–farming nexus is dependent on, and by the same token, largely constrained by, legacy data in the soil–water domain [29,30]. This means that most data are stored in outdated/obsolete systems, formats, or technologies, which are not only difficult to access but also difficult utilize to generate high-end spatial maps and/or use in sophisticated statistical models. A reason for this could be that in India, soil–water data are collected by a vast number of public agencies, using widely varying techniques across varying spatial–temporal scales, with little or no effort to standardize/harmonize data collection protocols. This makes data quality questionable (in terms of accuracy and precision). However, there is little or no information regarding the uncertainties associated with information, sampling, and data collection techniques. Under the present circumstances, research outcomes are likely to be shrouded by large errors. Moreover, legacy data lack information about several soil-related parameters, despite their criticality in land quality assessment studies [30]. For example, during our study, we realized that the predictive capacity of the current MLRA model could be significantly bolstered (and diversified) by incorporating information about livestock herding, irrigation scheduling, irrigation method, agrochemical applications, and sustainable land management practices (e.g., manure application, cover-cropping, tillage intensity) (Table 5). However, such refined data are unavailable at the state/district level, which becomes a barrier to conducting high-end research.

Table 5.
Potential soil–water parameters to support predictive models (NOTE: For each parameter, data should be collected as ‘% of area’ at state/district level).
However, characterizing soil properties in India is a daunting task due to the widely varying agro-climatic conditions, geology, topography, land management practices, and reduction in landholding sizes. Efforts have only just begun to extrapolate essential soil properties from soil legacy data [103]. However, the downside to this approach is that even the best extrapolation techniques offer only approximations of ground conditions and are never free from uncertainties, primarily due to the uncertainties associated with the original base dataset from which they are derived [29]. Moreover, there are insufficient studies in India that compare data interpolation results. A more recent branch of soil research is inclined to the study of digital soil maps (DSMs) [29,30,32]. Unlike conventional soil maps, DSMs provide us with estimates of accuracy and uncertainty associated with prepared soil maps [104]. Moreover, DSMs have become critical support tools for precision agriculture which, in turn, helps preserve land quality with measured agrochemical applications [105]. However, in India, DSM studies are scant, with over half of the states/UTs lacking any [31]. Moreover, DSM results are also questionable due to the differences in approaches/algorithms (lack of standardized operating procedures). Furthermore, poor sampling density, coarse resolution, limited use of environmental covariates, and inadequate independent validation impact DSM results. Producing reliable DSMs at the national level therefore requires multilateral cooperation and coordination among various public and private sectors to conduct targeted investigations and generate detailed information about key soil–water variables for process-level interpretation of LDD Drivers, Pressures, and Impacts (the DPSIR framework).
In addition to soil–water parameters, however, the multi-disciplinarity aspect of LDD also suggests that policymakers would benefit from incorporating information about certain socioeconomic and socio-demographic variables and resource exploitation parameters while constructing statistical models (Table 6). In our case, none such data were available.

Table 6.
Potential socio-demographic and resource exploitation parameters to construct predictive models and their significance towards LDD.
6. Conclusions
Present study uses a multivariate approach to assess the farming–LDD connection in India, using a mixed-method approach and combining archival information, multivariate statistics, and assessment of current farming policy outlooks. In a nutshell, we demonstrate the following to RAs:
- Long and sustained use of mineral fertilizers, chemical pesticides, mechanical tillage, and groundwater exploitation has negatively impacted land quality. In a cyclic fashion, this might make farmers adopt more aggressive means to maintain production which, in turn, only escalates LDD losses.
- There is a spatial dimension in which certain regions experience more LDD threats.
- There is little awareness of bio-pesticides, reduced tillage practices, and new fertilizer recommendations at the grassroot level due to various institutional shortcomings, ranging from a lack of sensitization to capacity building and extension services to support farmers. It keeps traditional (input-intensive) practices in running despite their long-term implications for land quality resources.
- There is a need for a more systemic vision to assess LDD within an interlocking web of drivers and pressures to contemplate context-relevant response strategies.
- There is a need to support high-end research by generating and disseminating high-resolution spatial–temporal data to develop robust decision-support systems.
Given the present circumstances, we urge authorities to deliberate on targeted actions, such as (1) establishing a participatory system comprising farmers, researchers, and policy makers to determine the best course of action to transition from traditional input-intensive farming to a more land-conservation-centric approach; (2) providing systematic support at the grassroots level for the widespread adoption of NBS, INM, bio-pesticides, and reduced tillage practices; (3) developing detailed but easily comprehensible operational guidelines to enable farmers adopt the new recommendations; (4) ensuring increased availability and affordability of new fertilizers and bio-pesticides at local village shops/markets; and (5) developing a team of extension agents willing to work in close contact with farmers, demonstrating the efficacy of newer recommendations to increase crop yield and income.
To that end, we also urge authorities to realize the growing urgency to engage in a systems’ thinking approach using the DPSIR framework that envisions LDD within a feedback loop of various Drivers and Pressures to understand the regulatory choices for devising context-relevant Response mechanisms. To that end, we reflect on the indirect drivers that often go unnoticed but deeply influence farmers’ choices. Overall, we use this narrative to attempt to draw regulatory attention to the need for high-level policy commitment to help farmers move from traditional practices to a more conservation-centric approach that maintains long-term land system sustainability.
Author Contributions
Conceptualization, S.C.; Methodology, S.C.; Investigation, S.C., M.R. and L.M.M.; Resources, M.R., L.M.M. and Y.E.; Data curation, M.R. and Y.E.; Writing—original draft, S.C. and M.R.; Writing—review & editing, L.M.M. and Y.E.; Supervision, S.C. All authors have read and agreed to the published version of the manuscript.
Funding
This research received no external funding.
Data Availability Statement
No primary data were generated in the course of this research. The study used secondary information, available on various open-sourced portals of the Government of India, and freely available to all.
Acknowledgments
The authors would like to thank the research staff at the Center of Environment, Sustainability and Human Development (CESH), O.P. Jindal Global University, Haryana, Inia, for extending their support.
Conflicts of Interest
The authors declare no conflict of interest.
References
- Abebaw, W.A. Review on impacts of land degradation on agricultural production in Ethiopia. J. Resour. Dev. Manag. 2019, 57. [Google Scholar] [CrossRef]
- IPBES. Summary for Policymakers of the Assessment Report on Land Degradation and Restoration of the Intergovernmental Science-Policy Platform on Biodiversity and Ecosystem Services; Scholes, R., Ed.; Intergovernmental Science-Policy Platform on Biodiversity and Ecosystem Services Secretariat: Bonn, Germany, 2018. [Google Scholar]
- Lal, R. Restoring soil quality to mitigate soil degradation. Sustainability 2015, 7, 5875–5895. [Google Scholar] [CrossRef]
- Stavi, I.; Lal, R. Achieving net-zero land degradation: Challenges and opportunities. J. Arid. Environ. 2015, 112, 44–51. [Google Scholar] [CrossRef]
- Khaledian, Y.; Kiani, F.; Ebrahimi, S.; Brevik, E.E.C.; Aitkenhead-Peterson, J. Aitkenhead-Peterson, Assessment and monitoring of soil degradation during land use change using multivariate analysis. Land Degrad. Dev. 2017, 28, 128–141. [Google Scholar] [CrossRef]
- Mekonnen, M.; Keesstra, S.D.; Stroosnijder, L.; Baartman, J.E.M.; Maroulis, J. Soil conservation through sediment trapping: A review. Land Degrad. Dev. 2015, 26, 544–556. [Google Scholar] [CrossRef]
- Thomaz, E.L.; Luiz, J.C. Soil loss, soil degradation and rehabilitation in a degraded land area in Guarapuava (Brazil). Land Degrad. Dev. 2012, 23, 72–81. [Google Scholar] [CrossRef]
- Wuepper, D.; Borrelli, P.; Finger, R. Countries and the global rate of soil erosion. Nat. Sustain. 2020, 3, 51–55. [Google Scholar] [CrossRef]
- Olsson, L.; Barbosa, H.; Bhadwal, S.; Cowie, A.; Delusca, K.; Flores-Renteria, D.; Stringer, L. Land Degradation. In Climate Change and Land; Shukla, P.R., Ed.; LIDSEN Publishing Inc.: Beachwood, OH, USA, 2019. [Google Scholar]
- Roy, P.; Pal, S.C.; Chakrabortty, R.; Saha, A.; Chowdhuri, I. A systematic review on climate change and geo-environmental factors induced land degradation: Processes, policy-practice gap and its management strategies. Geol. J. 2022. [Google Scholar] [CrossRef]
- UNCCD. The economics of desertification, land degradation and drought: Methodologies and analysis for decision-making. In Proceedings of the UNCCD 2nd Scientific Conference, Bonn, Germany, 9–12 April 2013. [Google Scholar]
- Cherlet, M.; Hutchinson, C.; Reynolds, J.; Hill, J.; Sommer, S.; von Maltitz, G. (Eds.) World Atlas of Desertification; Publication Office of the European Union: Luxembourg, 2018. [Google Scholar]
- SAC. Desertification and Land Degradation Atlas of India (Based on AWiFS Data of 2011–2013 and 2003–2005); Space Application Center: Ahmedabad, India, 2016. [Google Scholar]
- Adithyalakshmanan, K.; Kaur, H.; Chaudhuri, S. Unpacking Land Degradation Neutrality (LDN), An Emerging Paradigm to Conserve Land Systems’ Sustainability in 21st Century? Meta-analysis of challenges and opportunities. Nat. Environ. Pollut. Technol. 2022, 21, 91–100. [Google Scholar]
- UNCCD. Global Land Outlook, 1st ed.; United Nations Convention to Combat Desertification: Bonn, Germany, 2017; Available online: http://www2.unccd.int/sites/default/files/documents/2017-09/GLO_Full_Report_low_res.pdf (accessed on 5 March 2023).
- Ajayi, A. (Land degradation and the sustainability of agricultural production in Nigeria: A review. J. Soil Sci. Environ. Manag. 2015, 6, 234–240. [Google Scholar]
- Reddy, V.R.; Galab, S. Looking beyond debt trap. Econ. Political Wkly. 2006, 41, 1838–1841. [Google Scholar]
- Goyal, S.K.; Prbha, R.J.P.; Singh, S.R. Indian agricultures and farmers—Problems and reforms. In Indian Agriculture and Farmers; Poddar: Nagar, India, 2016. [Google Scholar]
- Chinnasamy, P.; Hsu, M.J.; Agoramoorthy, G. Groundwater storage trends and their links to farmers’ suicides in Maharashtra state, India. Front. Public Health 2019, 7, 247. [Google Scholar] [CrossRef] [PubMed]
- Priya, R.; Pani, P. Land degradation and agricultural productivity: A district level analysis, India. J. Rural. Dev. 2017, 36, 557–568. [Google Scholar] [CrossRef]
- Chandrika, S.; Ravindra, N.P. Agrarian crisis in India. Asian J. Res. Soc. Sci. Hum. 2017, 7, 1199–1206. [Google Scholar]
- Mythili, G.; Goedecke, J. Economics of land degradation in India. In Economics of Land Degradation and Improvement—A Global Assessment for Sustainable Development; Nkonya, E., Mirzabaev, A., von Braun, J., Eds.; Springer: Cham, Germany, 2016; pp. 431–469. [Google Scholar]
- Vyawahare, M. Land Degradation Cost India 2.5% of Its GDP in 2014-15. Hindustan Times. 19 February 2018. Available online: https://www.hindustantimes.com/environment/land-degradation-cost-india-2-5-of-its-gdp-in-2014-15/story-r5I0Kpv3qBJdeJw3PWsuHO.html (accessed on 5 April 2023).
- TERI. Reversing Land Degradation in India. Energy Resour. Inst. 2019. Available online: https://www.teriin.org/sites/default/files/2019-07/reversing-land-degradation-bg-paper.pdf (accessed on 5 March 2023).
- TERI. Economics of Desertification, Land Degradation and Drought in India. The Energy and Resource; Ministry of the Environment, Forestry and Climate Change (MoEFCC): New Delhi, India, 2018. [Google Scholar]
- Reddy, G.P.O.; Rao, S.S.; Dharumarajan, S.; Surya, J.N.; Lalitha, M.; Mahapatra, S.K.; Meena, R.K.; Sreenivasan, R.; Jena, R.K.; Kumar, N. Mapping and Assessment of Land Degradation in Major Ecosystems of India using Geospatial Technologies. NBSS LUP Rep. 2022, 1158, 300. [Google Scholar]
- Dharumarajan, S.; Bishop, T.F.A.; Hegde, R.; Singh, S.K. Desertification Vulnerability Index-an effective approach to assess desertification processes: A case study in Anantapur District, Andhra Pradesh, India. Land Degrad. Desertif. 2018, 29, 150–161. [Google Scholar] [CrossRef]
- Dharumarajan, S.; Lalitha, M.; Hegde, R.; Janani, N.; Rajawat, A.S.; Sastry, K.L.N.; Singh, S.K. Status of desertification in South India: Assessment, mapping and change detection analysis. Curr. Sci. 2018, 15, 331–338. [Google Scholar] [CrossRef]
- Reddy, N.N.; Chakraborty, P.; Roy, S.; Singh, K.; Minasny, B.; McBratney, A.B.; Biswas, A.; Das, B.S. Legacy data-based national-scale digital mapping of key soil properties in India. Geoderma 2021, 381, 114684. [Google Scholar] [CrossRef]
- Reddy, N.N.; Das, B.S. Digital soil mapping of key secondary soil properties using pedotransfer functions and Indian legacy soil data. Geoderma 2023, 429, 116265. [Google Scholar] [CrossRef]
- Dash, P.K.; Panigrahi, N.; Mishra, A. Identifying opportunities to improve digital soil mapping in India: A systematic review. Geoderma Reg. 2022, 28, e00478. [Google Scholar] [CrossRef]
- Dharumarajan, S.; Hegde, R.; Janani, N.; Singh, S.K. The need for digital soil mapping in India. Geoderma Reg. 2019, 16, e00204. [Google Scholar] [CrossRef]
- RBI. Agricultural Growth and Rural Poverty Reduction in India; Springer Nature: Berlin/Heidelberg, Germany, 2020; Available online: https://rbidocs.rbi.org.in/rdocs/Content/PDFs/2AGRICULTURALGROWTHF76E5CFA07A442258EF7F16D319B3EF2.PDF (accessed on 5 April 2023).
- Reddy, T.; Dutta, M. Impact of Agricultural Inputs on Agricultural GDP in Indian Economy. Theor. Econ. Lett. 2018, 8, 1840–1853. [Google Scholar] [CrossRef]
- RBI. Indian Agriculture: Achievements and Challenges. Reserve Bank of India Bulletin. 2022. Available online: https://rbidocs.rbi.org.in/rdocs/Bulletin/PDFs/02AR_170120226CD582783DB44FECB7A07AC238270E5F.PDF (accessed on 5 April 2023).
- PLFS. Annual Report. In Periodic Labour Force Survey. Government of India; 2020. Available online: https://dge.gov.in/dge/sites/default/files/2022-07/Annual_Report_PLFS_2020-21_0_0.pdf (accessed on 5 March 2023).
- GoI. Agricultural Statistics at a Glance. Department of Agriculture Cooperation and Farmers Welfare, Directorate of Economics and Statistics, Ministry of Agriculture and Farmers Welfare. 2019. Available online: https://eands.dacnet.nic.in/PDF/At%20a%20Glance%202019%20Eng.pdf (accessed on 5 March 2023).
- Brainerd, E.; Menon, N. Seasonal effects of water quality: The hidden costs of the Green Revolution to infant and child health in India. J. Dev. Econ. 2014, 107, 49–64. [Google Scholar] [CrossRef]
- John, D.A.; Babu, G.R. Lessons from the Aftermaths of Green Revolution on Food System and Health. Front. Sustain. Food Syst. 2021, 5, 644559. [Google Scholar] [CrossRef]
- Chhabra, V. Studies on use of biofertilizers in agricultural production. Eur. J. Mol. Clin. Med. 2020, 7, 2335–2339. [Google Scholar]
- Singh, S.; Benbi, D.K. Punjab-soil health and green revolution: A quantitative analysis of major soil parameters. J. Crop. Improv. 2016, 30, 323–340. [Google Scholar] [CrossRef]
- Chaudhuri, S.; Roy, M. Rural-urban spatial inequality in water and sanitation facilities in India: A cross-sectional study from household to national level. Appl. Geogr. 2017, 85, 27–38. [Google Scholar] [CrossRef]
- Cho, K.H.; Kang, J.H.; Ki, S.J.; Park, Y.; Cha, S.M.; Kim, J.H. Determination of the optimal parameters in regression models for the prediction of chlorophyll-a: A case study of the Yeongsan Reservoir, Korea. Sci. Total Environ. 2009, 407, 2536–2545. [Google Scholar] [CrossRef]
- Praveen, K.V. Indian fertilizer policies: Revisiting the Odyssey and lessons from abroad. Curr. Sci. 2017, 113, 1246–1254. [Google Scholar] [CrossRef]
- Prasad, R. Fertilizers and manures. Curr. Sci. 2012, 102, 894–898. [Google Scholar]
- Usama, M.; Khalid, M.A. Fertilizer consumption in India and need for its balanced use: A review. Indian J. Environ. Prot. 2018, 38, 564–577. [Google Scholar]
- FAI. Fertilizer Use and Environmental Quality. Fertilizer Association of India. 2017. Available online: https://www.faidelhi.org/general/Fert-use-Evironmental-quality.pdf (accessed on 5 March 2023).
- Patra, S.; Mishra, P.; Mahapatra, S.C.; Mithun, S.K. Modelling impacts of chemical fertilizer on agricultural production: A case study on Hooghly district, West Bengal, India. Model. Earth Syst. Environ. 2016, 2, 1–11. [Google Scholar] [CrossRef]
- Rahman, K.M.A.; Zhang, D. Effects of fertilizer broadcasting on the excessive use of inorganic fertilizers and environmental sustainability. Sustainability 2018, 10, 759. [Google Scholar] [CrossRef]
- Islam, M.K.; Hossain, M.E. Do farmers use overdose chemical fertilizer in agriculture? Empirical evidence from Northern Bangladesh. Rajshahi Univ. J. Soc. Sci. Bus. Stud. 2017, 25, 63–75. [Google Scholar]
- Tewatia, R.K.; Chanda, T.K. Trends in Fertilizer Nitrogen Production and Consumption in India. Indian Nitrogen Assess. 2017, 45–56. [Google Scholar] [CrossRef]
- Chaudhuri, S.; Ale, S. Long term (1960–2010) trends in groundwater contamination and salinization in the Ogallala aquifer in Texas. J. Hydrol. 2014, 513, 376–390. [Google Scholar] [CrossRef]
- Neog, R. Assessing the impact of chemical fertilizers on soil acidification: A study on Jorhat district of Assam, India. Agric. Sci. Dig. A Res. J. 2018, 38, 270–274. [Google Scholar] [CrossRef]
- Massah, J.; Azadegan, B. Effect of chemical fertilizers on soil compaction and degradation. AMA Agric. Mech. Asia Afr. Lat. Am. 2016, 47, 44–50. [Google Scholar]
- Chaudhuri, S.; Ale, S.; DeLaune, P.; Rajan, N. Spatio-temporal variability of groundwater nitrate concentration in Texas: 1960 to 2010. J. Environ. Qual. 2012, 41, 1806–1817. [Google Scholar] [CrossRef]
- Chaudhuri, S.; Ale, S. Characterization of groundwater resources in the Trinity and Woodbine aquifers in Texas. Sci. Total Environ. 2013, 452–453, 333–348. [Google Scholar] [CrossRef]
- Chaudhuri, S.; Ale, S. An appraisal of groundwater quality in Seymour and Bliane aquifers in a major agro-ecological region in Texas, USA. Environ. Earth Sci. 2014, 71, 2765–2777. [Google Scholar] [CrossRef]
- Nichols, C.E. Inflammatory agriculture: Political ecologies of health and fertilizers in India. Environ. Plan. E Nat. Space 2022, 25148486221113557. [Google Scholar] [CrossRef]
- Sharma, C.; Tiwari, M.K.; Pathak, H. Estimates of emission and deposition of reactive nitrogenous species for India. Curr. Sci. 2008, 94, 1439–1446. [Google Scholar]
- Pathak, H. Is nitrogen fertilizer a polluter or producer? Indian J. Fertil. 2016, 12, 106–117. [Google Scholar]
- Honfoga, B.G. Diagnosing soil degradation and fertilizer use relationship for sustainable cotton production in Benin. Cogent Environ. Sci. 2018, 4, 1422366. [Google Scholar] [CrossRef]
- GoI. Official Memorandum. Department of Fertilizer, No 23011/12/2022-P&K. 2022. Available online: https://www.fert.nic.in/sites/default/files/What-is-new/NBS%20Notification%20Dated%20%202-11-2022.pdf (accessed on 5 March 2023).
- Tewatia, R.K. Policy developments in nitrogenous fertilizers in India. Indian J. Fertil. 2016, 12, 128–136. [Google Scholar]
- Sharma, S.; Kandel, N.; Chaudhary, P.; Rai, P. A Review on Integrated Nutrient Management on Wheat. J. Food Agric. 2020, 1, 32–37. [Google Scholar] [CrossRef]
- Fixen, P.; Brentrup, F.; Bruulsema, T.; Garcia, F.; Norton, R.; Zingore, S. Nutrient/fertilizer use efficiency: Measurement, current situation and trends. In Nutrient/Fertilizer Use Efficiency: Measurement, Current Situation and Trends; IFA: Paris, France, 2014. [Google Scholar]
- Malika, M.; Islam, M.R.; Karim, R.; Huda, A.; Jahiruddin, M. Organic and inorganic fertilizers influence the nutrient use efficiency and yield of a rice variety BINA dhan7. Acad. Res. J. Agric. Sci. Res. 2015, 3, 192–200. [Google Scholar]
- Kakraliya, S.K.; Jat, R.D.; Kumar, S.; Choudhary, K.K.; Pakash, J.; Singh, L.K. Integrated Nutrient Management for Improving, Fertilizer Use Efficiency, Soil Biodiversity and Productivity of Wheat in Irrigated Rice Wheat Cropping System in Indo-Gangetic Plains of India. Int. J. Curr. Microbiol. Appl. Sci. 2017, 6, 152–163. [Google Scholar] [CrossRef]
- Devi, K.N.; Singh, M.S.; Singh, N.G.; Athokpam, H.S. Effect of integrated nutrient management on growth and yield of wheat (Triticumaestivum L.). J. Crop. Weed 2011, 7, 23–27. [Google Scholar]
- Singh, G.D.; Vyas, A.K.; Dhar, S. Productivity and profitability of wheat (Triticumaestivum)-based cropping systems under different nutrient management practices. Indian J. Agron. 2015, 60, 52–56. [Google Scholar]
- Pandey, I.B.; Dwivedi, D.K.; Pandey, R.K. 2009. Integrated nutrient management for sustaining wheat (Triticumaestivum) production under late sown condition. Indian J. Agron. 2009, 54, 306–309. [Google Scholar]
- Subhash, S.P.; Chand, P.; Pavithra, S.; Balaji, S.J.; Pai, S. Pesticide Issues in Indian Agriculture: Trends, Market Structure and Policy Issues; Policy Brief 2017; ICAR—National Institute of Agricultural Economics and Policy Research: New Delhi, India, 2017. [Google Scholar]
- Damalas, C.A.; Koutroubas, S.D. Current status and recent development in bio-pesticide use. Agriculture 2018, 8, 13. [Google Scholar] [CrossRef]
- Gupta, S.; Dikshi, A.K. Biopesticides: An ecofriendly approach for pest control. J. Biopestic. 2010, 3, 186–188. [Google Scholar]
- Pavela, R. Limitation of plant biopesticides. In Advances in Plant Biopesticides; Singh, D., Ed.; Springer: Berlin/Heidelberg, Germany, 2014. [Google Scholar]
- Chandler, D.; Bailey, A.S.; Tatchell, G.M.; Davidson, G.; Greaves, J.; Grant, W.P. The development, regulation and use of biopesticides for integrated pest management. Philos. Trans. R. Soc. London Ser. B Biol. Sci. 2011, 366, 1987–1998. [Google Scholar] [CrossRef] [PubMed]
- Lokesh, G.B.; Patil, S.S.; Amaresh, Y.S. Socio-economic assessment of bio-pesticides application in agriculture. Ecol. Environ. Conserv. 2016, 22, 35–39. [Google Scholar]
- Kandpal, V. Biopesticides. Int. J. Environ. Res. Dev. 2014, 4, 191–196. [Google Scholar]
- Elaoud, A.; Chehaibi, S. Soil compaction due to tractor traffic. J. Fail. Anal. Prev. 2011, 11, 539–545. [Google Scholar] [CrossRef]
- Batey, T. Soil compaction and soil management—A review. Soil Use Manag. 2009, 25, 335–345. [Google Scholar] [CrossRef]
- Beylich, A.; Oberholzer, H.R.; Schrader, S.; Höper, H.; Wilke, B.M. Evaluation of soil compaction effects on soil biota and soil biological processes in soils. Soil Tillage Res. 2010, 109, 133–143. [Google Scholar] [CrossRef]
- Schjønning, P.; van den Akker, J.J.H.; Keller, T.; Greve, M.H.; Lamandé, M.; Simojoki, A.; Breuning-Madsen, H. Driver-Pressure-State-Impact-Response (DPSIR) analysis and risk assessment for soil compaction-A European perspective. Adv. Agron. 2015, 133, 183–237. [Google Scholar]
- Zheng, H.; Liu, W.; Zheng, J.; Luo, Y.; Li, R.; Wang, H.; Qi, H. Effect of long-term tillage on soil aggregates and aggregate-associated carbon in black soil of Northeast China. PLoS ONE 2018, 13, e0199523. [Google Scholar] [CrossRef]
- Chaudhuri, S.; McDonald, L.M.; Pena-Yewtukhiw, E.M.; Skousen, J.; Roy, M. Chemically stabilized soil organic carbon fractions in a reclaimed minesoil chronosequence: Implications for soil carbon sequestration. Environ. Earth Sci. 2013, 70, 1689–1698. [Google Scholar] [CrossRef]
- Liu, M.; Han, G.; Zhang, Q. Effects of soil aggregate stability on soil organic carbon and nitrogen under land use change in an erodible region in Southwest China. Int. J. Environ. Res. Public Health 2019, 16, 3809. [Google Scholar] [CrossRef] [PubMed]
- Chaudhuri, S.; McDonald, L.M.; Pena-Yewtukhiw, E.M. Soil organic carbon molecular properties: Effects of time since reclamation in a reclaimed minesoil chronosequence. Land Degrad. Dev. 2015, 26, 237–248. [Google Scholar] [CrossRef]
- Chaudhuri, S.; Pena-Yewtukhiw, E.M.; McDonald, L.M.; Skousen, J.; Sperow, M. Early C sequestration rate changes for reclaimed minesoils. Soil Sci. 2012, 177, 443–450. [Google Scholar] [CrossRef]
- CWGB. Ground Water Yearbook—India 2016–2017; Central Ground Water Board: Faridabad, India, 2017. [Google Scholar]
- Chaudhuri, S.; Roy, M. Drinking water sources in India: How safe is Safe? Curr. Sci. 2017, 113, 393–402. [Google Scholar] [CrossRef]
- Chaudhuri, S.; Roy, M. Overview of rural water supply sector in West Bengal, India: Challenges and concerns. Int. J. Innov. Res. Sci. Eng. Technol. 2016, 5, 9768–9777. [Google Scholar]
- Chaudhuri, S.; Roy, M. Reflections on groundwater quality and urban-rural disparity in drinking water sources in Haryana, India. Int. J. Sci. Res. Dev. 2016, 4, 837–843. [Google Scholar]
- Chaudhuri, S.; Ale, S. Temporal evolution of depth-stratified groundwater salinity in municipal wells in the major aquifers in Texas, USA. Sci. Total Environ. 2014, 472, 370–380. [Google Scholar] [CrossRef]
- Chaudhuri, S.; Ale, S. Evaluation of Long-term (1960–2010) Groundwater Fluoride Contamination in Texas. J. Environ. Qual. 2014, 43, 1404–1416. [Google Scholar] [CrossRef] [PubMed]
- Ankita, P.V.; Chaudhuri, S. What do farmers don’t know? A Generic Index to Summarize Cognitive Awareness of Groundwater sourced Irrigation and Conservation at grass roots. Ecol. Environ. Conserv. 2022, 28, 179–192. [Google Scholar]
- Parakh, D.; Chaudhuri, S. Groundwater regulation bills in Haryana—A call for groundwater conservation and management for sustainable irrigation supply services—Opportunities and challenges. Ecol. Environ. Conserv. 2022, 28, 147–164. [Google Scholar]
- Chaudhuri, S.; Roy, M. Irrigation water pricing in India as a means to conserve water resources: Challenges and Potential future directions. Environ. Conserv. 2019, 46, 99–102. [Google Scholar] [CrossRef]
- Chaudhuri, S.; Roy, M.; McDonald, L.M.; Emendack, Y. Reflections on farmers’ social networks: A means for sustainable agricultural development? Environ. Dev. Sustain. 2021, 23, 2973–3008. [Google Scholar] [CrossRef]
- Chaudhuri, S.; Parakh, D.; Roy, M.; Kaur, H. Groundwater-sourced irrigation and agro-power subsidies: Boon or bane for small/marginal farmers in India? Groundw. Sustain. Dev. 2021, 15, 100690. [Google Scholar] [CrossRef]
- Patrício, J.; Elliott, M.; Mazik, K.; Papadopoulou, K.; Smith, C.J. DPSIR—Two decades of trying to develop a unifying framework for marine environmental management? Front. Mar. Sci. 2016, 3, 177. [Google Scholar] [CrossRef]
- Gaiha, R.; Kaicker, N.; Imai, K.; Kulkarni, V.S.; Thapa, G. Dietary Shift and Diet Quality in India: An Analysis Based on 50th, 61st and 66th Rounds of NSS. ASARC. 2012. Available online: https://taxpolicy.crawford.anu.edu.au/acde/asarc/pdf/papers/2012/WP2012_17.pdf (accessed on 5 March 2023).
- Westhoek, H.; Lesschen, J.P.; Rood, T.; Wagner, S.; De Marco, A.; Murphy-Bokern, D.; Oenema, O. Food choices, health and environment: Effects of cutting Europe’s meat and dairy intake. Glob. Environ. Chang. 2014, 26, 196–205. [Google Scholar] [CrossRef]
- Bouwman, L.; Goldewijk, K.K.; Van Der Hoek, K.W.; Beusen, A.H.W.; Van Vuuren, D.P.; Willems, J.; Stehfest, E. Exploring global changes in nitrogen and phosphorus cycles in agriculture induced by livestock production over the 1900–2050 period. PNAS 2013, 110, 20882–20887. [Google Scholar] [CrossRef]
- Aleksandrowicz, L.; Green, R.; Joy, E.J.M.; Smith, P.; Haines, A. The impacts of dietary change on greenhouse gas emissions, land use, water use, and health: A systematic review. PLoS ONE 2016, 11, e0165797. [Google Scholar] [CrossRef]
- Chakraborty, P.; Das, B.S.; Vasava, H.B.; Panigrahi, N.; Santra, P. Spatial structure, parameter nonlinearity, and intelligent algorithms in constructing pedotransfer functions from large-scale soil legacy data. Sci. Rep. 2020, 10, 1–13. [Google Scholar] [CrossRef] [PubMed]
- Minasny, B.; McBratney, A.B.; Malone, B.P.; Wheeler, I. Digital Mapping of Soil Carbon. Adv. Agron. 2013, 118, 1–47. [Google Scholar]
- Minasny, B.; Hartemink, A.E. Predicting soil properties in the tropics. Earth Sci. Rev. 2011, 106, 52–62. [Google Scholar] [CrossRef]
Disclaimer/Publisher’s Note: The statements, opinions and data contained in all publications are solely those of the individual author(s) and contributor(s) and not of MDPI and/or the editor(s). MDPI and/or the editor(s) disclaim responsibility for any injury to people or property resulting from any ideas, methods, instructions or products referred to in the content. |
© 2023 by the authors. Licensee MDPI, Basel, Switzerland. This article is an open access article distributed under the terms and conditions of the Creative Commons Attribution (CC BY) license (https://creativecommons.org/licenses/by/4.0/).