Abstract
The coordinated promotion of pollution control and carbon reduction is intended to build a more beautiful China. Intelligent industrial technology plays an important role in the fight against climate change and in improving the ecological environment. Based on panel data from 30 provinces in China from 2006 to 2020, we used a two-way fixed effects model to evaluate the synergistic effects of industrial intelligent transformation on pollution control and carbon reduction and its mechanisms. The results showed that the introduction and installation of industrial robots by enterprises significantly reduced carbon emissions and the concentration of fine particles in the air, as well as having the synergistic effect of reducing pollution and carbon. This conclusion was still robust after using instrumental variable methods to perform endogenous tests. The study also showed that industrial intelligence reduced pollution and carbon through mechanisms that promoted green technological innovation and improved energy efficiency. The conclusions of this study could provide evidence for the use of digital technologies to promote environmental protection and achieve the goal of carbon neutrality, as well as play a significant role in the promotion of economic and societal green transformation.
1. Introduction
In response to the increasingly severe effects of global warming, many countries have agreed to promote the green transformation of their economies and societies. Reducing carbon emissions is one of the important goals of green transformation in all countries. Since the Paris Agreement, many countries have made varying degrees of effort to reduce their energy and carbon intensity per unit of GDP. However, the global warming situation and the task of reducing emissions are still significant. According to the report Climate Change 2022: Climate Change Mitigation by the IPCC Working Group III, the average annual greenhouse gas emissions in the period of 2010–2019 were higher than those in any previous decade, and all sectors need to reduce emissions immediately in order to slow down global warming. As the industrial sector produces about one-quarter of global emissions, promoting reductions in industrial emissions is crucial to fighting against global warming. China has been an active practitioner in promoting the mitigation of global warming. For example, during the 13th Five-Year Plan period, China’s industrial sector achieved significant reductions in its emissions, with a cumulative reduction of 18% in CO2 emissions per unit of industrial added value for enterprises above the scale. However, it is undeniable that despite these improvements there is still a serious imbalance between the industrial structure and the energy structure [1]. On the one hand, the development of a heavy industrial structure and a coal-based energy structure directly affects the speed and effectiveness of achieving the carbon peak and carbon neutrality goals; on the other hand, the potential path dependence restricts the pace of industrial technological innovation that promotes green transformation, which is not conducive to sustainable industrial development [2].
At the same time, due to the late start of industrialisation, air pollution is one of the most severe environmental problems facing China at present, and factory emissions are a major source of air pollution. According to estimates by Sheng and Bu [3], the industrial sector produced 80.82% of China’s SO2 emissions in 2019. Similar to CO2, air pollutant emissions mainly come from the burning of fossil fuels. Although air pollution control and carbon reduction have long been regarded as two independent issues, some studies have shown that local air pollutants are closely related to carbon emissions, and that promoting the cooperative governance of pollution control and carbon reduction (PCCR) can improve the consistency of environmental policies, reduce the unit costs of policy implementation, and make use of their synergistic effects [4,5,6]. The synergistic effect of carbon reduction has also been partially explained in the literature as an additional or secondary benefit [7]. On the one hand, it refers to policies that aim to reduce carbon emissions, which can reduce the emission of other air pollutants at the same time; on the other hand, it refers to the benefits of reducing carbon emissions when the emission of other air pollutants is reduced [5,8]. Given that industrial air pollution and carbon emissions are highly homogeneous, it is theoretically and practically inevitable that industrial PCCR could be promoted in a synergistic manner. China has already made a series of efforts to promote the coordinative governance of PCCR. In 2021, the report Guidance on Coordinating and Strengthening Efforts Related to Climate Change Response and Ecological Environmental Protection, issued by the Ministry of Ecology and the Environment, highlighted the synergistic governance of greenhouse gas and air pollutant emissions. On 30 June 2022, the Ministry of Ecology and the Environment and seven other departments jointly issued the report Implementation Plan of Coordinative Carbon Reduction and Pollution Control, which aimed to promote the coordinated governance of PCCR and listed the industrial sector as a key area for such coordinative governance.
With the in-depth development of the new scientific and technological revolution and the industrial transformation represented by artificial intelligence (AI), the evolution of industrial intelligence (IIG) has accelerated worldwide, leading to the transformation of manufacturing methods, such as intelligent manufacturing [9], which could have a revolutionary influence on traditional industrial development. Looking at data from industrial robot installations around the world, it is obvious that the wave of IIG is unstoppable. However, due to the potential differences in economic mechanisms between IIG and the environment, its impact on PCCR is considered at two different levels. The existing literature shows that there has been little research on the synergistic effects of IIG on PCCR and even less on the mechanisms of its causal nexus. To address the gap in knowledge, we set the following main research objectives:
- To analyse the temporal and spatial evolution of carbon emissions and environmental pollution in various provinces of China.
- To evaluate whether IIG has synergistic effects on PCCR, i.e., to discuss the economic relationship between IIG and PCCR.
- To identify the two mechanisms of green technological innovation and energy efficiency, and to expand the study of Objective 2.
To achieve these objectives, we selected industrial robots as proxies for IIG to evaluate the synergistic effects of IIG on PCCR and reveal the potential mechanisms of its causal nexus based on panel data from 30 provinces in China from 2006 to 2020. The marginal contributions of this paper are as follows: First, in contrast to the existing literature, in which studies have explored the effects of IIG from the perspective of pollution reduction or carbon reduction, we addressed PCCR within a unified framework to focus on the synergistic effects of IIG on PCCR and examine the heterogeneity of these effects from multiple perspectives, which could further enrich the literature on the economic and environmental effects of IIG. Second, the mechanisms of the synergistic effects of IIG on PCCR are multidimensional, and we identified the transmission channels of green technological innovation and energy efficiency, which could enrich the literature on the synergistic effects of IIG on PCCR. This paper provides new evidence for the synergistic effects of IIG on PCCR.
2. Literature Review
The impacts that new technologies have on the environment have long been of great interest to scholars [10]. Along with the rapid development of AI, many studies have explored its impact on the environment from different perspectives. This paper is closely related to two main strands of the literature: the effect of IIG on carbon emissions and the effect of IIG on pollution control.
2.1. Studies on the Carbon Reduction Effect of IIG
Regarding the impact of IIG on carbon emissions, a study by Chui et al. found that electricity suppliers for smart grids could reduce the mismatch between electricity supply and demand by analysing the electricity consumption profile and consumption characteristics of each meter, allowing them to respond to demand more accurately. This also allowed consumers to view their electricity consumption in a timely manner using smart grid terminals and reasonably manage their use of high-power-consumption appliances [11]. This could reduce energy waste and improve energy efficiency. Zhang and Xuan also found that connections and interactions between intelligence and applied technology departments could promote the rational allocation of energy, improve energy efficiency, reduce energy waste, and promote energy conservation and emissions reduction [12]. Jadoon et al. took cement plants as their research object and found that carbon-emission-monitoring algorithms that were based on AI could improve the efficiency of carbon capture at cement plants [13]. They also established that intelligent cement plants could optimize their energy use and contribute to reductions in carbon emissions. Sankaran also pointed out that AI, as a new tool, could promote the transformation of industrial carbon emissions into green fuels and promote the development of circular economies while reducing carbon emissions [14]. In terms of empirical studies, Liu et al. used data from China’s industrial sector in 2005–2016 and found that IIG significantly reduced carbon emissions. They also discovered that this effect was heterogeneous within the industry. For example, IIG has played a large role in reducing emissions from technology- and labour-intensive industries [15]. Using data from China’s industrial sector, Lv et al. also found that IIG reduced the consumption of energy from fossil fuels in production processes, improved energy efficiency, and reduced carbon emissions [16]. Li et al. used cross-country panel data from 35 countries from 1993 to 2017 to point out that the use of industrial robots could help to reduce carbon emissions [17].
However, some studies have presented different opinions. Paryanto et al., for instance, suggested that the rapid increase in the use of industrial robots could increase energy consumption and carbon emissions, as industrial robots are the basis for automation and intelligence, but the manufacturing of industrial robots also consumes energy [18]. Dhar also pointed out that IIG could have a two-sided impact on climate change: on the one hand, IIG could promote the building of infrastructure for reducing emissions, the use of climate change modelling and forecasting, and the control of carbon trading market prices, which could encourage industrial enterprises to reduce their carbon emissions; however, on the other hand, industrial intelligent equipment could also consume large amounts of energy, which would be converted into carbon emissions and huge electricity costs [19]. The different impacts of IIG on reducing carbon emissions could also stem from the diffusion process and the degree of technological diffusion. For example, Xue et al. found that the carbon reduction effect of AI technologies was related to the degree of the application of the technology itself: in the short term, the intensive development of AI could lead to an increase in electricity demand and carbon emissions; however, as AI technology matures in the long run, its increased marginal carbon emissions could be reduced and spread to all sectors of the economy, producing a strong low-carbon technology effect [20]. On the contrary, a study by Zhang et al. found that the technical effects of intelligent technologies could help to reduce the emissions of enterprises in the short term, but the scale effect of intelligent technologies could help to expand the demand and output of the industrial sector and increase energy consumption in the long term [2]. Li et al. took China as a sample and found that the impact of IIG on carbon emissions was not linear and that its contribution to reducing carbon emissions decreased with the increase in the scale of intelligence-driven economies [21].
Some other scholars have discussed the mechanisms of the effect of IIG on carbon emissions. They have suggested that IIG could reduce carbon emissions by reducing energy consumption and improving energy efficiency [16], improving green total factor productivity and energy intensity [21], optimising industrial structures, and promoting green technological innovation [22], among other mechanisms.
2.2. Studies on the Pollution Control Effect of IIG
Regarding the impact of IIG on air pollution control, AI has already been used in the field of environmental monitoring for a long time, and its role in urban air pollution and environmental monitoring has been confirmed by numerous studies [23,24]. AI technology has not only been used as a tool to monitor ecological changes in the environment but has also been widely applied in the industrial sector [9]. For example, intelligent devices have been used to monitor and evaluate pollution control in real time during production processes so as to improve the operational efficiency of pollution control devices and technologies [25]. As many intelligent manufacturing systems are highly integrated throughout supply chains, AI also has an impact on the green production behaviour of supply chain partners and industrial enterprises by promoting green technological innovation and industrial structure upgrades. Studies have typically discussed the impact of IIG on pollution emissions based on the use of industrial robots. For example, Yu et al. found that IIG could promote energy efficiency and green technological innovation, thereby reducing local air pollution, as represented by PM2.5, PM10, and SO2 emissions [26]. Chen Hao et al. found that the use of industrial robots could reduce industrial emissions, according to stock and increment data from industrial robots in China’s manufacturing sector in 2006 and 2015 [27]. Sheng and Bu provided further evidence for this result at the enterprise level. Based on the analysis of industrial enterprise data and enterprise pollution data from China from the period 2006–2013, they found that the use of industrial robots could promote the use of clean energy, optimise pollution control equipment, and improve the pollution treatment capacity of enterprises, thereby significantly reducing their pollution emissions. For every 1% increase in the penetration rate of industrial robots, the SO2 emission intensity of enterprises could decrease by 0.071% [3]. Nie et al. also found, based on research at the enterprise level, that the use of industrial robots significantly reduced the scale and intensity of enterprise SO2 emissions [28].
However, some studies have offered different opinions. Using enterprise-level data, Song et al. found that IIG reduced the intensity of pollution emissions but did not necessarily help to lower overall pollution levels [29]. Additionally, because there are many types of pollution, IIG has been reported to have different effects on different types of pollution and not to reduce all types of pollution. Luan et al. found that the use of industrial robots improved the productivity and energy efficiency of enterprises, which they attributed to the expansion of enterprise production and consumption; however, they found that IIG increased rather than suppressed air pollution emissions [30].
It can be seen from the above literature review that scholars have focused on the economic and environmental effects of IIG at two levels: pollution reduction and carbon reduction. Although different results have been reported, they all provide useful references for this study. However, regardless of opinion, the existing literature has not considered PCCR within a unified framework. As mentioned above, considering the relationship between carbon emissions and air pollutants and the call for policies to promote the cooperative governance of PCCR, it would be meaningful to study the synergistic effects of IIG on PCCR. How does IIG exert synergistic effects on PCCR? What are the potential economic mechanisms? What are the possible factors that affect the synergistic effects? In this study, PCCR was examined within a unified framework, and the synergistic effects of IIG on PCCR were evaluated, which could help to further deepen IIG research and provide a reference to help to solve the contradiction between economic development and environmental protection.
3. Theoretical Analysis and Research Hypotheses
3.1. The Synergistic Effects of IIG on PCCR
IIG can be regarded as the integration of AI, the industrial Internet of things (IoT), and other intelligent production technologies. Typical examples are intelligent manufacturing and intelligent factories. Therefore, the key to IIG lies in the development of intelligent technology itself, as well as the application of intelligent technology in the industrial sector and the integration of both. AI has obvious “green” characteristics in that it promotes technological innovation, equipment upgrades, and improvements in production efficiency among enterprises, which could improve the green productivity of the industrial sector [2,31]. The ways in which IIG promotes PCCR are as follows:
First, IIG can help to improve the prediction ability and measurement accuracy of industrial waste gas concentrations, SO2 concentrations, temperature, humidity, and particulate matter content, as well as improve the pertinence of energy savings, consumption reduction, and pollution control. By relying on AI and big data analysis technology (BDA), smart factories can predict the energy and carbon intensity of any production process, adjust and optimize production lines, and reduce ineffective and redundant operational links, and, thus, reduce energy consumption. For example, by using sensors, identification analysis, and other technologies, data on electricity, heat, raw materials, and waste can quickly be collected. Through the analysis of these data, the main sources of CO2 and air pollutants can be quickly located to form targeted solutions for carbon emissions reduction and pollution control.
Second, with support from big data, intelligent devices can have the function of self-learning. The historical energy consumption data for each machine can be recorded in real time, automatically analysed, and then transmitted to engineers for deep learning and continuous optimization [32]. Through the heuristic growth of human and machine intelligence, the functions of intelligent devices will continue to develop, thereby increasing productivity, reducing energy intensity per unit output, and improving green production efficiency.
Third, enterprises can learn from one another through the knowledge spillover effect [33]. Improvements in the intelligence of the whole industry could also lead to improvements in product quality, which would provide higher-quality raw materials and intermediate products for downstream enterprises, thereby incentivising downstream enterprises to optimize their energy allocation structures and helping to improve the energy structure [12]. These improvements in the energy structure could help to reduce carbon emissions [21]. In addition, reducing the use of fossil fuels and increasing the use of cleaner energy sources could also reduce the emissions of other air pollutants, such as SO2 [34]. Moreover, IIG could integrate intelligent technologies and cleaner production technologies within enterprises and industries through the industrial chain, accelerate the intelligent greening process of enterprises and, therefore, promote synchronous reductions in carbon and air pollutant emissions.
IIG is the direction of industrial development in all countries in the era of Industry 4.0, and it could also have an impact on national environmental policies at the macro level. By using intelligent tools, such as blockchain, governments can supervise regional energy distribution and optimize the institutional mechanisms of energy trading [35]. The in-depth application of AI in environmental monitoring, pollution control, and digital government could help governments to improve the emissions behaviour of enterprises; make up for the inadequacies of existing environmental supervision policies caused by information asymmetry; reduce energy waste, environmental pollution, and overcapacity; and promote reductions in carbon and air pollutant emissions.
Based on the above analysis, we put forward the following research hypothesis:
Hypothesis 1 (H1).
IIG has synergistic effects on PCCR.
3.2. Analysis of the Mechanisms of IIG on PCCR
IIG not only has direct synergistic effects on PCCR but also exerts those synergistic effects through the channel of green technological innovation.
First, IIG can greatly reduce the costs of green technological innovation for enterprises. Due to the path dependence of technological innovation, enterprises tend to choose technologies that can reduce costs, so technological innovation becomes limited by the existing low-efficiency technologies [36]. These technologies struggle to meet the needs of today’s green production. For industrial enterprises, green technological innovation means additional costs on the basis of their existing production costs [37]. The development of intelligent technologies, such as digital twins, could allow innovation processes to no longer be limited to physical space. The R&D, testing, and other processes of green product performance are completed in virtual space, which can greatly improve the fault tolerance rate of green technological innovation in industrial enterprises, while also reducing resource consumption in innovation processes. IIG could also reduce the labour costs for R&D. In the digital age, industrial enterprises no longer need long-term employment contracts with employees. With the help of crowdsourcing models (for example, open-source communities), it is possible to break through the barrier of geographic space and obtain immediate, professional, and diverse green solutions from home and abroad, which could significantly reduce green R&D costs. Enterprises can also obtain ideas and demand for green products from consumers, make innovation more targeted, and reduce the costs caused by new products that are not meeting market demand. When the costs of intelligence-driven innovation are reduced and new products are favoured by consumers, the motivation of enterprises to participate in green technological innovation increases.
IIG also has a substitution effect on low-skilled workers and can induce enterprises to improve their human resources [38], thereby providing direct human capital and knowledge sources for green technological innovation. In addition to acquiring external knowledge via open-source communication, among other methods, data can also be connected to all aspects of enterprise production with the support of intelligent devices [39]. For instance, every machine can share, transmit, and store data in real time. A large amount of data can provide different information for enterprises. When this information is analysed and interpreted, it becomes a source of knowledge for green technological innovation [40].
As specialisation becomes more and more common in the era of Industry 4.0, smart factories could also innovate collaboratively with supply chain partners through business models such as platforms [41]. Smart factories could cooperate with supply chain partners to develop green technological innovation so as to further share its costs and risks, make up for the deficiencies of independent innovation, and improve its efficiency. Studies have shown that green technological innovation can not only directly reduce net emissions [42] but also reduce the costs of pollution control by making use of the innovation compensation effect [43]. Green technological innovation also has a contact effect on supply chains, whereby green technological innovation in one sector is transmitted to other enterprises and sectors through supply chains [44], promoting the green transformation of whole supply chains. Green technological innovation could also promote the transformation and upgrading of industrial structures [45], promote the development of clean industries, and eliminate backwards production capacity, thereby forcing enterprises to optimise their energy consumption structures and reduce their carbon and air pollutant emissions.
Finally, green technological innovation in the energy sector could accelerate the development of photovoltaics, wind power, and renewable energy, effectively promote the development of a new energy sector, and be conducive to the transformation of energy consumption structures to green, low-carbon, and clean energy, which could directly reduce carbon and other air pollutant emissions.
Therefore, we put forward the following research hypothesis:
Hypothesis 2 (H2).
IIG has a synergistic effect on PCCR through the mechanism of promoting green technological innovation.
AI is a typical technological innovation in the era of Industry 4.0 [46], which can directly encourage enterprises to optimise and upgrade their existing technologies, equipment, and processes and improve their production efficiency, thereby improving green total factor productivity. By relying on modern information technologies, such as IoT and ERP systems, production, management, services, and other production links are not separate. Enterprises only need a small number of skilled workers to control whole production processes in real time, promoting the rational allocation of energy and other factors. Improvements in resource allocation efficiency are an important antecedent for improvements in green technological efficiency, which is beneficial to industrial green productivity [31]. Green productivity can directly improve energy efficiency which, in turn, contributes to reductions in carbon and air pollutant emissions [47].
In addition to some simple automation equipment, traditional production lines are mainly operated manually by workers. There are many problems with this model, such as safety, inaccurate control, and material waste. The substitution effects of intelligent equipment, such as industrial robots, improve the accuracy of production processes, reducing the inevitable resource waste and losses caused by manual operation, and improving energy efficiency [3]. Some intelligent devices can also realise completely unmanned operation, thereby improving production and energy efficiency.
In addition to intracompany effects, the impact of IIG on energy efficiency can also be seen at the industry level. With the support of BDA, energy demand and use data can be spread quickly among enterprises, thereby promoting the rational allocation of energy within industries. As IIG expands, it could promote the formation of intelligent industrial clusters, thereby releasing the agglomeration effects of specialisation and diversification [48]. In these intelligent industrial clusters, information regarding energy prices, transaction volume, and inventory could flow freely, and energy efficiency could be improved. Specialised agglomeration could also promote the integration of knowledge in different enterprises, thereby helping to improve regional energy efficiency. Furthermore, improving energy efficiency could directly reduce the emission intensity and levels of carbon and air pollutants [49], bringing about the synergistic effect of reducing pollution and carbon emissions.
Based on the above analysis, we put forward the following research hypothesis:
Hypothesis 3 (H3).
IIG has a synergistic effect on PCCR through the mechanism of improving energy efficiency.
According to the above analysis, the theoretical logic of IIG affecting PCCR is shown in Figure 1.
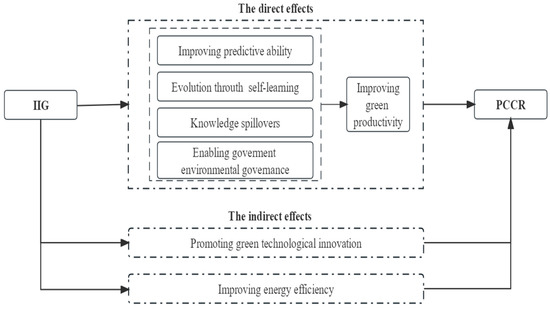
Figure 1.
The theoretical logic of IIG affecting PCCR.
4. Research Design
4.1. Variables
4.1.1. Explained Variables
Carbon emissions (CE): Considering that China’s carbon peaking and carbon neutrality goals are mainly to reduce total carbon emissions, we used the carbon emissions of each province to measure carbon emissions. The carbon emissions data were obtained from the China Carbon Emissions Database (CEADs). The data included the fossil-fuel-related emissions of 47 economic sectors and 17 fossil fuels, as well as the fossil-fuel-related emissions from cement production processes. The calculation was comprehensive and scientific [50].
Environmental pollution (EP): As a major air pollutant, haze is a carrier of various harmful substances. It has a small volume but strong activity and can directly enter the alveoli and respiratory tract, which can seriously affect the normal life and health of residents [51,52]. PM2.5 is the primary constituent of haze [53] and has gradually become the most concerning air pollution problem for the public in recent years [54]. Therefore, we used PM2.5 as a proxy variable for environmental pollution. Due to the timeliness of the data from the US Columbia University Social and Economic Data and Application Centre, we used the annual PM2.5 satellite monitoring data reported by the Atmospheric Composition Analysis Group of Dalhousie University in Canada to measure the domestic haze pollution levels accurately. The data were estimated using aerosol optical depth measurements that were collected by NASA MODIS, MISR, and Sea-WIFS instruments, combined with a geochemical transport model (GEOS-Chem) and a geographically weighted regression model (GWR). Finally, the data were meshed with the highest resolution () of the combined information sources. Compared to conventional air pollution monitoring data, the air pollution data retrieved by remote sensing have better spatial continuity and can more accurately monitor the spatial distribution of (and changes in) PM2.5. At the same time, nonpoint source data provided by satellites are more suitable for reflecting the overall situation of haze pollution than point source monitoring data, which are sufficient for reflecting the true levels and basic change trends of haze pollution in China [55]. We used Arc GIS to analyse the raw raster data and convert them into average annual PM2.5 concentration values (μg/m3) at the provincial level.
4.1.2. Explanatory Variables
Industrial intelligence (IIG): With the successive introduction and development of Industry 4.0 and Made in China 2025, the global industrial system has been moving towards automation, integration, intelligence, and green innovation. Intelligent industries that use industrial robots are booming and gradually becoming important symbols of modern scientific and technological innovation. In the field of intelligent manufacturing, industrial robots refer to automated equipment that integrates various advanced technologies, embodies the characteristics of modern industrial technologies—such as high efficiency and the combination of software and hardware—and forms important parts of modern manufacturing systems, such as flexible manufacturing systems, automated factories, and smart factories. Robots are the apples of manufacturing’s eye. Therefore, we used industrial robot installation density to represent IIG.
The International Federation of Robotics (IFR) conducts an annual survey of robot manufacturers around the world and has formed a database detailing the use of robots by industry across more than 70 countries. Most of the data in the database refer to manufacturing industry segments. Because the industrial classification of IFR is inconsistent with the national industrial classification standard of China, we compared the industries in the robot database to two industries in the national industrial classification by industry name, based on the study of Yan et al. [56]. Industries that were not included in the IFR database were excluded, and data on manufacturing workers and robots, which could not be clearly classified, were also removed. Then, according to the research of Acemoglu and Restrepo [38], the installation density of industrial robots at the provincial level was calculated using the Bartik instrument method. The formula was expressed as follows:
In Equation (1), where Rob denotes the industrial robot installation density, is the number of employees in industry m in province i in year t, denotes the total number of employees in province i in year t, denotes the number of industrial robots installed in industry m in year t, is the total number of employees in industry m in year t, and is the instrumental variable selected for this study (where represents the number of industrial robots installed in the same industry in the US in year t, and represents the number of employees in the manufacturing industry in the US in 2005). The impact of the level of industrial robot adoption at the industrial level in the US on the Chinese labour market mainly reflects the technological characteristics of the same industry, independent from other local factors that can affect robot adoption in China, and its use as an instrumental variable for robot penetration at the province level in China helps to mitigate the endogeneity problem of the model [57].
4.1.3. Mediating Variables
Green technological innovation (GTI): Traditional studies have often used the nonparametric DEA method to measure technological progress and separate it from productivity. Otherwise, the Solow method of remainder has been used to represent technological progress with regression residuals. While it is difficult to separate the inputs and outputs of green factors from those of general production, these two methods can be used to directly measure green technological progress, which could result in large measurement errors. Compared to research and innovation processes, the actual outputs of green patents can have more practical impacts on economic and social development. Therefore, based on the study of Cheng and Yu [58], we used the number of green patent applications from listed companies to measure green technological innovation. The classification of green patents was mainly based on the International Patent Classification (IPC) code listed in the Green Patent List provided by the World Intellectual Property Organisation (WIPO). By setting the patent type, the IPC classification code, and the address of the invention unit (individual), we could obtain the patent application data at the provincial level from the China Patent Publication and Announcement Network of China’s National Intellectual Property Administration.
Energy efficiency (EE): Depending on the input factors, energy efficiency can be divided into single-factor energy efficiency and total-factor energy efficiency. We mainly used energy productivity to measure energy efficiency at the city level, and we used the value of economic output generated by economic energy input ().
4.1.4. Control Variables
In order to mitigate the endogenous problem caused by missing variables as much as possible and obtain more accurate estimation results, we followed the research on carbon emissions and environmental pollution in the existing literature [59,60], as well as Porter’s hypothesis, Pigou tax, ecosystem theory, and other related theories, and we selected eight variables as the control variables: the level of economic development, measured using GDP per capita; industrial structure, measured using the ratio of secondary industry to GDP; green investment, measured using the amount of investment in industrial pollution control; environmental tax, measured using the sum of income from urban maintenance and construction tax, travel tax, consumption tax, resource tax, and urban land-use tax; energy structure, measured using the proportion of coal consumption in the total energy consumption; household consumption, measured using the total retail sales of social consumer goods; population density, measured using the ratio of the population at the end of the year to the area of the city; and climate, measured using the average annual rainfall in each province.
4.2. Econometric Model
To test whether IIG had a synergistic effect on PCCR, we used a panel data model [61]. Specifically, the carbon reduction and pollution control effects of IIG were modelled separately in the same dataset. According to the Kaya identity equation, the sources and emissions of carbon dioxide can be decomposed as follows:
where CO2 denotes carbon emissions, Energy denotes energy consumption, GDP denotes gross domestic product, and POP denotes the population at the end of the year. As the CO2 emissions per unit of energy are strongly and positively correlated with the share of coal in the total energy consumption, this variable is often replaced by the structure of energy consumption. Therefore, CO2 emissions can be further decomposed into four factors: CO2 produced per unit of energy consumed, the structure of energy consumption, GDP per capita, and the size of the population. Although the Kaya identity is currently the main method for analysing the drivers of CO2 emissions, it can only explain changes in carbon emission flows, and not changes in stocks; thus, other factors need to be combined to study total CO2 emissions [62]. Therefore, in combination with the control variables discussed above, the econometric model constructed in this study for the impact of IIG on carbon emissions was as follows:
where the subscripts i and t denote region and time, respectively; j denotes the jth control variable; denotes the fitted parameters of the econometric model; denotes the time-fixed effects; denotes the individual fixed effects; denotes the random disturbance term that obeys a white noise process; denotes the constant terms; and Control denotes the information set, which contains all control variables. The fitted parameter reflects the impact of IIG on carbon emissions and was the focus of this study. When was significantly positive, it indicated that IIG exacerbated urban carbon emissions; however, when was significantly negative, it indicated that IIG had a carbon-reducing effect and helped to reduce urban CO2 emissions. In the actual regression calculations in this study, variables with larger orders of magnitude were logarithmically treated in order to mitigate the heteroskedasticity as much as possible.
Since environmental pollution and carbon emissions are highly homogeneous, the econometric model for the impact of IIG on environmental pollution was expressed as follows:
where denotes the fitted parameters of the regression, and the other symbols and variables are as in Equation (3). Finally, in order to test the mechanisms through which IIG affects carbon reduction and to test research hypotheses H2 and H3, we constructed the following mediating effects test equations:
Equations (5) and (6) represent the impact of IIG on green technological innovation and energy efficiency, respectively, where and denote the fitted parameters of the regression. When both passed the significance test, it indicated that IIG influenced reductions in pollution and carbon emissions through the mechanisms of green technological innovation and energy efficiency. The other symbols and variables are as in Equation (3).
4.3. Data Sources and Descriptive Statistics
Following the principles of data availability and systematicity, panel data from 30 provinces in China from 2006 to 2020 were selected as the statistical sample (the statistical object of this study excluded the Tibet Autonomous Region due to the large number of missing data, as well as Hong Kong, Macao, and Taiwan due to inconsistencies in the statistical calibre of the data). The data regarding industrial robot installations were obtained from the International Federation of Robotics, and the data regarding the control and mechanism variables were obtained from the China Statistical Yearbook, China Energy Statistical Yearbook, China Industrial Statistical Yearbook, China Labour Statistical Yearbook, China Environmental Statistical Yearbook, the National Bureau of Statistics, and China’s National Intellectual Property Administration. The data regarding US employment by industry were obtained from the National Bureau of Economic Research (NBER-CES). We used linear interpolation to make up the very few missing values. The descriptive statistics of the variables are shown in Table 1.

Table 1.
The descriptive statistics of the variables.
5. Empirical Analysis
5.1. Characteristic Facts
In order to better analyse the temporal and spatial evolution of carbon emissions and environmental pollution in various provinces of China, this study uses the natural breakpoint method to divide them into five grades and gives the results for 2006 and 2020, respectively. We used ArcGIS 10.6 software to draw the results, as shown in Figure 2. From the overall change dimension, the spatial distribution characteristics of the quality of the ecological protection environment among provinces in China are prominent. The main spatial differentiation pattern decreases from east to west. The provinces with high carbon dioxide concentrations and delicate particulate matter in the air are mainly located in the eastern coastal areas. Understandably, the eastern coastal areas of China have higher economic activity and higher population density. Frequent economic activities, such as transportation, commercial transactions, and raw material production, will inevitably produce carbon emissions and fine particulate matter, making environmental problems more serious. Another reason is that the western region of China has a higher forest coverage rate, and its natural ability to purify environmental pollutants is higher. During the study period, the spatiotemporal evolution of CO2 emissions in China’s cities was more complicated than that of PM2.5 concentrations. The overall characteristics of CO2 are high emission intensity in sporadic areas and high emission intensity in northern China. In contrast, the distribution characteristics of PM2.5 are relatively regular, showing a trend of concentration and continuity. Due to the influence of regional resource endowment, industrial layout, and economic structure, the quality of the ecological environment in the northern region is lower than in the southern region. The typical economic activity is that the central heating systems in the northern region increase the emissions of CO2 and PM2.5.
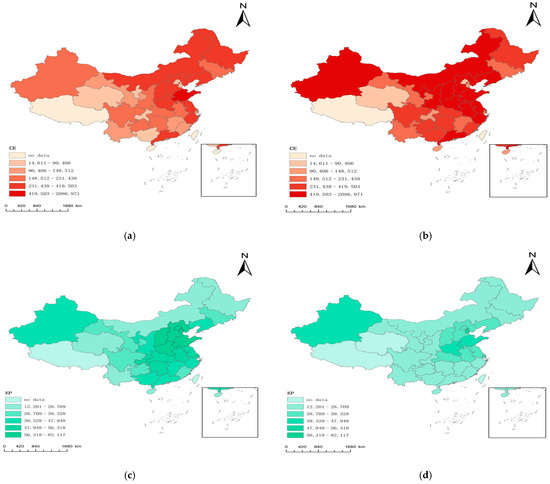
Figure 2.
Distribution of the CO2 and PM2.5 in 30 provinces from 2006 to 2020; the sample data do not include the Tibet Autonomous Region, Hong Kong, Macao, or Taiwan: (a) CO2 in 30 sample provinces in China in 2006; (b) CO2 in 30 sample provinces in China in 2020; (c) PM2.5 in 30 sample provinces in China in 2006; (d) PM2.5 in 30 sample provinces in China in 2020.
From the temporal point of view, the CO2 concentration in 2006 mainly lies in the third layer and the fourth layer, and the distribution difference of PM2.5 concentration at each breakpoint is not apparent. By 2020, the value of CO2 concentration is mainly in the first to third sections, while the value of PM2.5 concentration is mainly in the second to fifth sections. Generally speaking, from 2006 to 2020, the concentration of CO2 in the air in China increased, while the concentration of PM2.5 decreased. The reason for this result may be that the Chinese municipal governments are committed to improving the ecological environment and have successively issued the air pollution prevention and control action plan and the three-year action plan to win the Blue Sky Defence War. At the same time, China’s industrial structure and economic activities are still increasing carbon emissions, and the country is expected to reach peak carbon dioxide emissions in 2030.
5.2. Baseline Regression
Common panel data-fitting models include the mixed least squares method, random effects models, and fixed effects models. In order to find the most suitable model for this study, the Hausman test and an F-test were performed. The results showed that the p-values of the Hausman test for both equations rejected the null hypothesis at the 1% significance level, indicating that a fixed effects model would be better than a random effects model. Moreover, the p-values of the F-test for both equations also rejected the original hypothesis at the 1% significance level, indicating that a fixed effects model would be better than the mixed least squares method. Given that macroeconomic variables are more significantly affected by temporal trends, we used a two-way fixed effects (TWFE) model for the benchmark regression. Since panel data include repeated observations over time, there could be cross-sectional correlations, heteroskedasticity, and serial correlations when fully biased results are obtained [63]. Because the Driscoll–Kraay (DK) estimators can be used in robustness tests to compensate for the shortcomings of the White–Rogers method, they are good at correcting for shortcomings in panel data and allow for more accurate estimates to be obtained [48,64]. Therefore, in the baseline regression model, we mainly used the DK estimators to estimate the model.
Table 2 presents the estimated results of Equations (3) and (4) using a two-way fixed effects model. As can be seen from the results in columns (1) and (3), the results without control variables showed that the regression coefficients of IIG on carbon emissions and environmental pollution were −0.3230 and −0.1910, respectively, and that both passed the test of significance. The results indicated that IIG had a synergistic effect on PCCR, which not only reduced carbon emissions but also improved air quality. As shown by the results in columns (2) and (4), the regression coefficients of IIG on carbon emissions and environmental pollution were −0.2359 and −0.2527, respectively, after adding control variables, which passed the significance test at the 5% and 10% levels.
Table 2.
The baseline regression results.
In order to understand the results in Table 2 more intuitively, the regression results are visualised in columns (2) and (4). As can be seen from Figure 3, the 95% confidence interval of IIG’s regression coefficients for CE and EP is not included in 0, and their average values are less than 0.
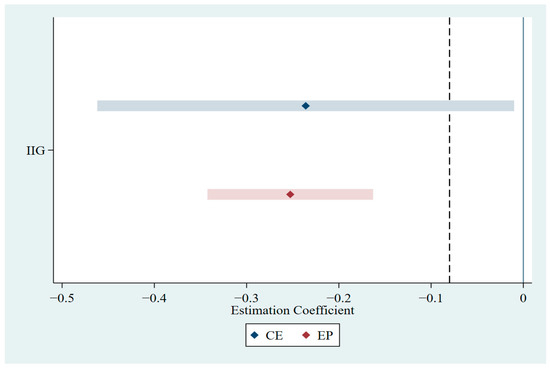
Figure 3.
Regression results of the two-way fixed effects model. Note: the 95% confidence interval is used.
These results were consistent with previously published articles [65,66]. A comparison of the regression coefficients from the two models revealed that the difference between the suppressive effect of IIG on carbon emissions and the improvement in air quality was small, indicating that industrial robots were almost equally effective in both aspects of PCCR. Therefore, hypothesis H1 was verified. According to Metcalfe’s law of digital networks, the increased integration and use of AI in key areas of environmental pollution, such as industry, power, and energy, could effectively contribute to reductions in energy consumption throughout the life cycles of key carbon-emitting industry sectors and, subsequently, unleash the ecological benefits of the use of industrial digital technologies in the environmental field.
5.3. Robustness Test
The baseline regression results showed that IIG had synergistic effects on PCCR. In order to test the robustness of this result, three methods were used in this study.
The first method was to change the econometric model. Generally speaking, information and resources are often exchanged between neighbouring regions, and emissions and environmental pollution are no exception. Carbon emissions from neighbouring provinces have specific spatial correlations and spatial spillover effects. For research objects with potential spatial correlations, regression analysis results from ordinary panel data are often inaccurate or suboptimal. Comparatively speaking, spatial econometric models can reveal the actual causal relationships between variables. Therefore, we replaced the two-way fixed effects model that was used for the baseline regression with the spatial Durbin model to control the spatial correlations between variables.
The second method was to replace the core explanatory variable. With the advent of digital economies, data have become crucial to economic development in the new era and a necessary driving force to improve the quality of China’s economic growth. IIG is based on the Internet, big data, cloud computing, IoT, and other information infrastructures. The quality of the information infrastructure in a region directly affects the synergistic effects of IIG on PCCR. As a diversified policy system and progressive reform policy, big data focuses on data system innovation, industry agglomeration, data element circulation, data sharing, and opening up. The goal of the policy is to develop the big data industry and to explore and use data elements to strengthen the integration of digital technologies and real economies. The 10 major big data pilot zone projects include the “Information infrastructure improvement project”, which is expected to impact IIG development significantly. Therefore, according to the ideas proposed by Xu et al. [67], we replaced the aforementioned IIG model with a quasi-natural experiment for the national big data comprehensive pilot zone and used a multiphase differential method to estimate the model.
The third approach was to add missing policy variables. The Chinese government has always been committed to the coordination and interaction of environmental protection and economic development strategies—especially in recent years, where the protection of the ecological environment has been unprecedentedly prioritised. Therefore, policies and institutions could also affect China’s carbon emissions and environmental pollution. In this part of the study, two environmental-protection-related policies and institutions were added to the baseline regression model to mitigate the impact of missing essential variables. These two policies and systems were the pilot carbon emissions trading policy, which was implemented in 2011, and the green finance reform and innovation pilot zone, which was implemented in 2017.
As can be seen from the results in Table 3, all three tests showed that the regression coefficients of IIG on carbon emissions and environmental pollution were significantly negative, and that the sign and significance of each result remained highly similar to those of the baseline regression results. The results of each model also showed that the technological dividends of IIG in terms of PCCR were less different and had almost the same effect on carbon emissions and air quality, which was similar to the results from the benchmark regression model. Therefore, the results of the three models indicated that the baseline regression results were robust and that the carbon reduction effect of IIG was significant, meaning that H1 was strongly supported.
Table 3.
The robustness test results.
5.4. Endogenous Test
Although we hoped to mitigate the endogeneity problems arising from the omission of important variables where possible in this study, carbon reduction can be confounded by various factors at the same time, such as policies and regulations, economic restructuring, consumer preferences, and world energy systems, leading to endogeneity problems between IIG and PCCR. Therefore, we used an instrumental variable approach to address these problems. The first method used a generalised spatial two-stage least squares (GS2SLS) estimation to control the endogeneity problems. This method used the interaction terms of endogenous variables and their higher-order spatial lagged terms as instrumental variables and estimated a spatial panel model based on the two-stage least squares (2SLS) method to control the spatial spillover effects of carbon emissions and environmental pollution, as well as the endogeneity problems. The key step in fitting the computational spatial econometric model was to construct a scientifically sound spatial weight matrix [68]. According to the first law of geography, everything has a certain degree of correlation, but things that are closer together tend to be more relevant than those that are further away. In this regard, we used geographic weight matrices as the spatial matrices, which were calculated as the inverse of the squared geographic distance between the latitude and longitude information of the capital cities of each province. The expression was , where i and k denote different cities. The second approach used the time-lagged term of IIG as an instrumental variable to estimate panel data using a 2SLS model.
As can be seen from Table 4, the results of the GS2SLS model showed that the regression coefficients of IIG on carbon emissions and environmental pollution were −0.2356 and −0.2265, respectively, and were significant at the 10% and 1% levels, respectively. The F-statistic for the weak instrumental variable identification in the 2SLS model was 62.599, and the LM statistic for the overidentification test was 56.697. These two results showed that the instrumental variables selected in this study were valid and satisfied the principles of exogeneity and relevance. The results from the 2SLS model showed that the regression coefficients of IIG were −0.4929 and −0.3398, respectively, and were significant at the 10% and 1% levels, respectively. The direction and significance of these results were similar to those of the GS2SLS model, except for the magnitude of the coefficients. Combining the results of the two methods, the fitted coefficients of IIG on carbon emissions and environmental pollution were still significantly negative after addressing the endogeneity, again confirming the synergistic effect of IIG on reducing carbon emissions while also improving air quality and having a synergistic effect on PCCR.
Table 4.
The endogeneity test results.
5.5. Mechanism Analysis
It can be seen from the above analysis that IIG could reduce pollution and carbon emissions by promoting green technological innovation and improving energy efficiency. In this part of the study, two mechanisms were identified and tested using a mediating effect model. Because the third step of the traditional three-step mediating effect method produces serious endogenous problems, we only used the second step to test the mechanisms of green technological innovation and energy efficiency, in order to avoid the endogenous problems as much as possible [69].
As can be seen from Figure 4, the 99% confidence interval of the fitting coefficients of IIG to EE and GTI is not included in 0, and their mean values are all greater than 0. It can be concluded from Figure 4 that the fitting coefficients of IIG to EE and GTI are significantly positive. The results showed that IIG could not only reduce energy consumption per unit of GDP but also promote green technological innovation in enterprises, i.e., IIG could achieve synergistic urban PCCR through the mechanisms of improving energy efficiency and promoting green technological innovation. Therefore, H2 and H3 were verified.
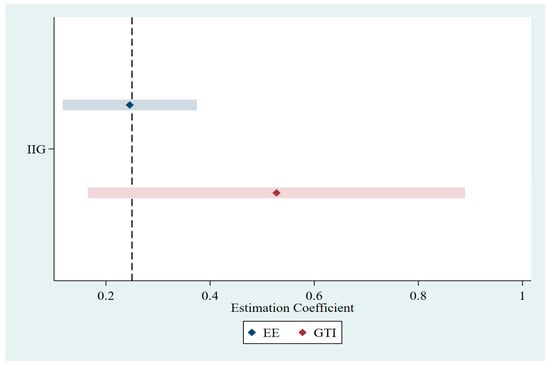
Figure 4.
The mechanism test results. Note: a 99% confidence interval is used.
Theoretically, improvements in energy efficiency at both the macro and micro levels are key drivers in carbon reduction and environmental protection. IIG drives the technological spillover effects between energy production, transmission, storage, and consumption processes through the correlation and interaction effects between Internet-based technologies and application sectors. Not only can IIG promote the integration and spread of energy-use technologies among economies through imitation and learning and achieve energy technology progress, but it can also reduce information asymmetry in the market with the help of BDA and cloud computing at the same time, as well as making faster and more accurate decisions using AI, reducing transportation and transaction costs, developing more reasonable energy-use strategies and regulatory systems, and improving total factor energy efficiency [70,71].
Green technological innovation can help to achieve sustainable development goals, improve traditional production models, and create more energy-use technologies and pollutant treatment technologies, which could effectively control total pollutant emissions and carbon emissions [72]. Efficient information flow is conducive to stimulating R&D activities and motivating researchers to create new products, processes, and services [73]. With the gradual establishment of the industrial IoT ecological platform and the evolution of the Internet governance model, each innovation body can search for and access external knowledge and innovation resources from different channels. Investment in industrial digital technologies has led to an increase in regional human capital and labour productivity, which not only attracts high-quality workforces but also increases green innovation activities in the form of “learning by doing”. In addition, using advanced technologies, such as neural algorithms and machine learning, researchers are able to access and utilise a wide range of tacit innovation knowledge, thereby making tacit knowledge that is widely available within their firm visible and expanding the knowledge base for green innovation [74]. The application of digital technologies by enterprises, such as the accurate collection and visual analysis of carbon emissions data, has become increasingly important for accelerating supply-side emissions reduction, reducing carbon emissions on the consumption side, and achieving energy savings and reducing emissions in urban living scenarios. In terms of improving green regulatory effectiveness, the application of industrial digital technologies, such as BDA, cloud computing, AI, and remote sensing, enables enterprises to monitor product quality, energy savings, and emissions reduction in real time and improve their production processes, thereby reducing green R&D costs and green innovation risks and empowering enterprises with more efficient ways to realise green innovation activities.
6. Conclusions and Policy Implications
6.1. Conclusions
IIG is vital for addressing climate change, promoting reductions in urban carbon emissions, and reducing pollutant emissions by replacing the demand for emission-intensive products with dematerialisation and optimising resource management and decision-making processes through system integration. This paper used provincial-level data in China from 2006 to 2020 to test the effect and mechanisms of IIG on PCCR through empirical analysis. The conclusions are as follows:
- (1)
- The spatial distribution characteristics of the quality of the ecological protection environment among provinces in China are prominent, showing a decreasing spatial distribution pattern from east to west;
- (2)
- IIG could significantly reduce concentrations of CO2 and PM2.5 in cities, which has significant synergistic effects on PCCR;
- (3)
- IIG could reduce pollution and carbon emissions through mechanisms of promoting green technological innovation and improving energy efficiency.
The existing literature has suggested that the expansion of production scales caused by IIG could have an adverse impact on the environment; however, our study found that when digital technologies and the corresponding industrial intelligent tools were used to promote coordinated reductions in pollution and carbon emissions, there was a continuous promotion effect on improvements to the environment. On the one hand, it would be beneficial to reduce the costs of green technological innovation; on the other hand, new achievements in IIG could stimulate green technological innovation and promote the development of green products. Furthermore, these changes could cause the industrial sector to upgrade its industrial structure, eliminate backwards production capacity, and promote the transition towards green economies and societies.
6.2. Policy Implications
Given the need for green and low carbon development, it is urgently needed to deeply integrate process industry with big data and machine learning in the future and to construct and describe the data resources related to carbon emission and carbon neutralization technologies of industrial industries. Based on these findings, we put forward the following policy recommendations:
First, the results of this study showed that industrial robots could be used to reduce pollution and carbon, so it is necessary to focus on developing the robotics industry and speeding up the creation of core technologies. We should speed up the development of essential standard IIG technologies, such as chip technology, sensing technology, and information technology, and carry out technical research on core components and major landmark products. Administrative departments should encourage market players to accelerate the development of market-oriented high-end robot products through financial subsidies, tax and fee reductions, and the promotion of domestic robots in order to achieve technological breakthroughs.
Second, an energy IoT should be built, and the intelligent transformation of power systems should be promoted. Accelerating the intelligent transformation and efficient operation of energy systems could help IIG to reduce carbon emissions and protect the environment. Relevant departments should use big data, blockchain, and 5G technologies to promote the development of intelligent and digital national power grid systems, focus on the efficient utilisation of traditional fossil-fuel-based energy, improve the development and consumption levels of renewable energy, and accelerate the construction of new power systems that mainly use clean energies. Based on the gradual establishment and improvement of software platforms and databases, industrial production’s pollution reduction and carbon reduction research will minimize the total cost. With the value-added cycle of water, material, and energy as the core, big data integration and artificial intelligence decision-making on pollutants, water, and energy at different levels can be realized. Full use of information technology should be made to break down the barriers between industries and fields, and help the traditional single industry to reduce pollution and carbon, and the upstream and downstream industrial chains to coordinate pollution and carbon reduction and digital pollution reduction and carbon reduction.
Third, the development of green and low-carbon core technologies should be strengthened, and enterprises should be encouraged to carry out green R&D innovation. Financial institutions should actively launch diverse digital and green financial products. At the same time, administrative departments should formulate credit policy incentives and increase financial capital and support for enterprises that are involved with green technology research and development—especially those involved with carbon sequestration, carbon capture, and clean energy. Governmental departments should support the popularisation and application of green technologies in industries with high energy consumption rates and high pollutant emissions in a multilevel, multidimensional, and all-encompassing way, thereby giving full play to new knowledge regarding how to reduce pollution and carbon emissions.
6.3. Limitations and Future Research Directions
- (1)
- From the perspective of applied economics, this study evaluated whether IIG can achieve coordinated governance of PCCR. The methods used were more focused on statistical inference of statistical models. However, economic research focuses more on the causal relationships between economic variables. In future research, it will be beneficial to use the list of intelligent manufacturing demonstration enterprises and the policy of industrial intelligent demonstration parks and use the double-difference method and breakpoint regression to make the research conclusions more consistent with causality.
- (2)
- In future research, it will be beneficial to combine econometrics with natural science methods such as game theory, operational research, and management science to evaluate the impacts of IIG on carbon emissions and environmental pollution from an interdisciplinary perspective.
- (3)
- In this study, provincial panel data were used as statistical samples, and the statistical calibre of the data was too large. Future research could use a large number of enterprises with a high degree of digital and intelligent transformation as statistical samples and use econometrics and machine learning methods to calculate more accurate data. In addition, environmental pollution includes not only fine particles but also more pollution sources that should be included in the evaluation system for measuring the number of pollutants.
Author Contributions
Project administration, writing—original draft, visualization, software, methodology and investigation, Y.S.; methodology, writing—review and editing, supervision, validation and visualization, Z.Y. All authors have read and agreed to the published version of the manuscript.
Funding
This work was financially supported by the Natural Science Foundation of Fujian Province (grant number: 2022J01320) and the Major Projects of Fujian Social Science Research Base (grant number: FJ2022MJDZ007).
Institutional Review Board Statement
Not applicable.
Data Availability Statement
All of the data are publicly available, and proper sources are cited in the text. The data used to support the findings of this study are available from the corresponding author upon request.
Acknowledgments
Thanks are also due to Zhihong Yang, School of Economics and Management, Northwestern University, who gave us much valuable advice in the early stages of this work. In addition, Yang Shen especially wishes to thank Yanhua Li, Xiamen University, who has helped me a lot in daily life.
Conflicts of Interest
The authors declare no conflict of interest.
References
- Zhou, X.; Zhang, J.; Li, J. Industrial structural transformation and carbon dioxide emissions in China. Energ. Policy 2013, 57, 43–51. [Google Scholar] [CrossRef]
- Zhang, Q.; Zhang, F.; Mai, Q. Robot adoption and green productivity: Curse or Boon. Sustain. Prod. Consum. 2022, 34, 1–11. [Google Scholar] [CrossRef]
- Sheng, D.; Bu, W. The usage of robots and enterprises’ pollution emissions in China. J. Quant. Technol. Econ. 2022, 39, 157–176. [Google Scholar]
- Shrestha, R.M.; Pradhan, S. Co-benefits of CO2 emission reduction in a developing country. Energ. Policy 2010, 38, 2586–2597. [Google Scholar] [CrossRef]
- West, J.J.; Smith, S.J.; Silva, R.A.; Naik, V.; Zhang, Y.; Adelman, Z.; Fry, M.M.; Anenberg, S.; Horowitz, L.W.; Lamarque, J. Co-benefits of mitigating global greenhouse gas emissions for future air quality and human health. Nat. Clim. Change 2013, 3, 885–889. [Google Scholar] [CrossRef]
- Mao, X.; Zeng, A.; Hu, T.; Zhou, J.; Xing, Y.; Liu, S. Co-control of Local Air Pollutants and CO2 in the Chinese Iron and Steel Industry. Environ. Sci. Technol. 2013, 47, 12002–12010. [Google Scholar] [CrossRef]
- Mao, X.; Xing, Y.; Gao, Y.; He, F.; Zeng, A.; Kuai, P.; Hu, T. Study on GHGs and air pollutants co-control: Assessment and planning. China Environ. Sci. 2021, 41, 3390–3398. [Google Scholar]
- van Vuuren, D.P.; Cofala, J.; Eerens, H.E.; Oostenrijk, R.; Heyes, C.; Klimont, Z.; den Elzen, M.G.J.; Amann, M. Exploring the ancillary benefits of the Kyoto Protocol for air pollution in Europe. Energ. Policy 2006, 34, 444–460. [Google Scholar] [CrossRef]
- Zhong, R.Y.; Xu, X.; Klotz, E.; Newman, S.T. Intelligent Manufacturing in the Context of Industry 4.0: A Review. Eng. Prc. 2017, 3, 616–630. [Google Scholar] [CrossRef]
- Acemoglu, D.; Aghion, P.; Bursztyn, L.; Hemous, D. The environment and directed technical change. Am. Econ. Rev. 2012, 102, 131–166. [Google Scholar] [CrossRef]
- Chui, K.T.; Lytras, M.D.; Visvizi, A. Energy sustainability in smart cities: Artificial intelligence, smart monitoring, and optimization of energy consumption. Energies 2018, 11, 2869. [Google Scholar] [CrossRef]
- Zhang, W.; Xuan, Y. How to improve the regional energy efficiency via intelligence? Empirical analysis based on provincial panel data in China. Bus. Manag. J. 2022, 44, 27–46. [Google Scholar]
- Jadoon, U.K.; Ahmad, I.; Noor, T.; Kano, M.; Caliskan, H.; Ahsan, M. An intelligent sensing system for estimation of efficiency of carbon-capturing unit in a cement plant. J. Clean. Prod. 2022, 377, 134359. [Google Scholar] [CrossRef]
- Sankaran, K. Carbon emission and plastic pollution: How circular economy, blockchain, and artificial intelligence support energy transition? J. Innov. Manag. 2019, 7, 7–13. [Google Scholar] [CrossRef]
- Liu, J.; Liu, L.; Qian, Y.; Song, S. The effect of artificial intelligence on carbon intensity: Evidence from China’s industrial sector. Socio-Econ. Plan. Sci. 2022, 83, 101002. [Google Scholar] [CrossRef]
- Lv, H.; Shi, B.; Li, N.; Kang, R. Intelligent Manufacturing and Carbon Emissions Reduction: Evidence from the Use of Industrial Robots in China. Int. J. Environ. Res. Public Health 2022, 19, 15538. [Google Scholar] [CrossRef]
- Li, Y.; Zhang, Y.; Pan, A.; Han, M.; Veglianti, E. Carbon emission reduction effects of industrial robot applications: Heterogeneity characteristics and influencing mechanisms. Technol. Soc. 2022, 70, 102034. [Google Scholar] [CrossRef]
- Paryanto; Brossog, M.; Bornschlegl, M.; Franke, J. Reducing the energy consumption of industrial robots in manufacturing systems. Int. J. Adv. Manuf. Technol. 2015, 78, 1315–1328. [Google Scholar] [CrossRef]
- Dhar, P. The carbon impact of artificial intelligence. Nat. Mach. Intell. 2020, 2, 423–425. [Google Scholar] [CrossRef]
- Xue, F.; Liu, J.; Fu, Y. The effect of artificial intelligence technology on carbon emissions. Sci. Technol. Prog. Policy 2022, 39, 1–9. [Google Scholar] [CrossRef]
- Li, Y.; Yang, X.; Ran, Q.; Wu, H.; Irfan, M.; Ahmad, M. Energy structure, digital economy, and carbon emissions: Evidence from China. Environ. Sci. Pollut. R. 2021, 28, 64606–64629. [Google Scholar] [CrossRef]
- Chen, P.; Gao, J.; Ji, Z.; Liang, H.; Peng, Y. Do Artificial Intelligence Applications Affect Carbon Emission Performance?—Evidence from Panel Data Analysis of Chinese Cities. Energies 2022, 15, 5730. [Google Scholar] [CrossRef]
- Aayush, K.; Vishal, D.; Hammad, N.; Ks, M. Application of Artificial Intelligence in Curbing Air Pollution: The Case of India. Asian J. Manag. 2020, 11, 285. [Google Scholar] [CrossRef]
- Asha, P.; Natrayan, L.; Geetha, B.T.; Beulah, J.R.; Sumathy, R.; Varalakshmi, G.; Neelakandan, S. IoT enabled environmental toxicology for air pollution monitoring using AI techniques. Environ. Res. 2022, 205, 112574. [Google Scholar] [CrossRef] [PubMed]
- Sulistyaningsih, T.; Sunarto; Saiman; Suhariyanti; Oktaviari, V. Artificial Intelligence and Decision Support System to Determine Policies for Controlling River Pollution from Industrial Sectors. IOP Conf. Ser. Earth Environ. Sci. 2021, 717, 12026. [Google Scholar] [CrossRef]
- Yu, L.; Zeng, C.; Wei, X. The impact of industrial robots application on air pollution in China: Mechanisms of energy use efficiency and green technological innovation. Sci. Prog. 2022, 105, 322114589. [Google Scholar] [CrossRef]
- Chen, H.; Yan, X.; Zhu, B. The impact of robot use on pollution discharge: A theoretical mechanism and empirical research. China Econ. Stud. 2021, 328, 126–138. [Google Scholar] [CrossRef]
- Nie, F.; Hu, H.; Li, L. How can industrial robots promote green production? Evidence from Chinese micro-firms. Ind. Econ. Res. 2022, 199, 1–14. [Google Scholar] [CrossRef]
- Song, J.; Chen, Y.; Luan, F. Air pollution, water pollution, and robots: Is technology the panacea. J. Environ. Manag. 2023, 330, 117170. [Google Scholar] [CrossRef]
- Luan, F.; Yang, X.; Chen, Y.; Regis, P.J. Industrial robots and air environment: A moderated mediation model of population density and energy consumption. Sustain. Prod. Consum. 2022, 30, 870–888. [Google Scholar] [CrossRef]
- Zhao, P.; Gao, Y.; Sun, X. How does artificial intelligence affect green economic growth?—Evidence from China. Sci. Total. Environ. 2022, 834, 155306. [Google Scholar] [CrossRef]
- Zhou, J.; Li, P.; Zhou, Y.; Wang, B.; Zang, J.; Meng, L. Toward New-Generation Intelligent Manufacturing. Engineering 2018, 4, 11–20. [Google Scholar] [CrossRef]
- Liu, J.; Chang, H.; Forrest, J.Y.; Yang, B. Influence of artificial intelligence on technological innovation: Evidence from the panel data of China’s manufacturing sectors. Technol. Forecast. Soc. 2020, 158, 120142. [Google Scholar] [CrossRef]
- Zhao, H.; Guo, S.; Zhao, H. Impacts of GDP, fossil fuel energy consumption, energy consumption intensity, and economic structure on SO2 emissions: A multi-variate panel data model analysis on selected Chinese provinces. Sustainability 2018, 10, 657. [Google Scholar] [CrossRef]
- Truby, J. Decarbonizing Bitcoin: Law and policy choices for reducing the energy consumption of Blockchain technologies and digital currencies. Energy Res. Soc. Sci. 2018, 44, 399–410. [Google Scholar] [CrossRef]
- Brian Arthur, W.; Ermoliev, Y.M.; Kaniovski, Y.M. Path-dependent processes and the emergence of macro-structure. Eur. J. Oper. Res. 1987, 30, 294–303. [Google Scholar] [CrossRef]
- Ben Arfi, W.; Hikkerova, L.; Sahut, J. External knowledge sources, green innovation and performance. Technol. Forecast. Soc. 2018, 129, 210–220. [Google Scholar] [CrossRef]
- Acemoglu, D.; Restrepo, P. Automation and new tasks: How technology displaces and reinstates labor. J. Econ. Perspect. 2019, 33, 3–30. [Google Scholar] [CrossRef]
- Li, B.; Hou, B.; Yu, W.; Lu, X.; Yang, C. Applications of artificial intelligence in intelligent manufacturing: A review. Front. Inform. Tech. El. 2017, 18, 86–96. [Google Scholar] [CrossRef]
- Waqas, M.; Honggang, X.; Ahmad, N.; Khan, S.A.R.; Iqbal, M. Big data analytics as a roadmap towards green innovation, competitive advantage and environmental performance. J. Clean. Prod. 2021, 323, 128998. [Google Scholar] [CrossRef]
- Liu, B.; De Giovanni, P. Green process innovation through Industry 4.0 technologies and supply chain coordination. Ann. Oper. Res. 2019, 1–36. [Google Scholar] [CrossRef]
- Cai, J.; Zheng, H.; Vardanyan, M.; Shen, Z. Achieving carbon neutrality through green technological progress: Evidence from China. Energ. Policy 2023, 173, 113397. [Google Scholar] [CrossRef]
- Wu, J.; Xia, Q.; Li, Z. Green innovation and enterprise green total factor productivity at a micro level: A perspective of technical distance. J. Clean. Prod. 2022, 344, 131070. [Google Scholar] [CrossRef]
- Lee, V.; Ooi, K.; Chong, A.Y.; Seow, C. Creating technological innovation via green supply chain management: An empirical analysis. Expert Syst. Appl. 2014, 41, 6983–6994. [Google Scholar] [CrossRef]
- Du, K.; Cheng, Y.; Yao, X. Environmental regulation, green technology innovation, and industrial structure upgrading: The road to the green transformation of Chinese cities. Energ. Econ. 2021, 98, 105247. [Google Scholar] [CrossRef]
- Lee, J.; Davari, H.; Singh, J.; Pandhare, V. Industrial Artificial Intelligence for industry 4.0-based manufacturing systems. Manuf. Lett. 2018, 18, 20–23. [Google Scholar] [CrossRef]
- Yu-Ying Lin, E.; Chen, P.; Chen, C. Measuring green productivity of country: A generlized metafrontier Malmquist productivity index approach. Energy 2013, 55, 340–353. [Google Scholar] [CrossRef]
- Yang, Z.; Shen, Y. The impact of intelligent manufacturing on industrial green total factor productivity and its multiple mechanisms. Front. Env. Sci. 2023, 10, 1058664. [Google Scholar] [CrossRef]
- Hasanbeigi, A.; Price, L.; Lin, E. Emerging energy-efficiency and CO2 emission-reduction technologies for cement and concrete production: A technical review. Renew. Sustain. Energy Rev. 2012, 16, 6220–6238. [Google Scholar] [CrossRef]
- Shan, Y.; Huang, Q.; Guan, D.; Hubacek, K. China CO2 emission accounts 2016–2017. Sci. Data 2020, 7, 54. [Google Scholar] [CrossRef]
- Song, J.; Lu, M.; Lu, J.; Chao, L.; An, Z.; Liu, Y.; Xu, D.; Wu, W. Acute effect of ambient air pollution on hospitalization in patients with hypertension: A time-series study in Shijiazhuang, China. Ecotox. Environ. Safe 2019, 170, 286–292. [Google Scholar] [CrossRef]
- Du, Y.; You, S. Interaction among Air Pollution, National Health, and Economic Development. Sustainability 2022, 15, 587. [Google Scholar] [CrossRef]
- Cheng, Z. The spatial correlation and interaction between manufacturing agglomeration and environmental pollution. Ecol. Indic. 2016, 61, 1024–1032. [Google Scholar] [CrossRef]
- Lu, Y.; Wang, Y.; Liao, Y.; Wang, J.; Shan, M.; Jiang, H. Public Concern about Haze and Ozone in the Era of Their Coordinated Control in China. Int. J. Env. Res. Pub. Health 2023, 20, 911. [Google Scholar] [CrossRef] [PubMed]
- Liu, X.; Liang, C.; Li, S. Is the development of polycentric integration of urban agglomeration conducive to reducing haze pollution? Econ. Surv. 2022, 39, 3–12. [Google Scholar]
- Yan, X.; Zhu, B.; Ma, C. Employment under robot impact: Evidence from China manufacturing. Stat. Res. 2020, 37, 74–87. [Google Scholar]
- Li, X.; Tian, Q. How Does Usage of Robot Affect Corporate Carbon Emissions?—Evidence from China’s Manufacturing Sector. Sustainability 2023, 15, 1198. [Google Scholar] [CrossRef]
- Cheng, Z.; Yu, X. Can central environmental protection inspection induce corporate green technology innovation? J. Clean. Prod. 2023, 387, 135902. [Google Scholar] [CrossRef]
- Chien, F.; Sadiq, M.; Nawaz, M.A.; Hussain, M.S.; Tran, T.D.; Le Thanh, T. A step toward reducing air pollution in top Asian economies: The role of green energy, eco-innovation, and environmental taxes. J. Environ. Manag. 2021, 297, 113420. [Google Scholar] [CrossRef]
- Wang, L.; Wang, H.; Cao, Z.; He, Y.; Dong, Z.; Wang, S. Can industrial intellectualization reduce carbon emissions?—Empirical evidence from the perspective of carbon total factor productivity in China. Technol. Forecast. Soc. 2022, 184, 121969. [Google Scholar] [CrossRef]
- Jaffe, A.B.; Newell, R.G.; Stavins, R.N. Environmental policy and technological change. Environ. Resour. Econ. 2002, 22, 41–70. [Google Scholar] [CrossRef]
- Yuan, L.; Pan, J. Disaggregation of Carbon Emission Drivers in Kaya Identity and Its Limitations with Regard to Policy Implications. Clim. Change Res. 2013, 9, 210–215. Available online: http://www.climatechange.cn/EN/Y2013/V9/I3/210 (accessed on 6 February 2023).
- Beylik, U.; Cirakli, U.; Cetin, M.; Ecevit, E.; Senol, O. The relationship between health expenditure indicators and economic growth in OECD countries: A Driscoll-Kraay approach. Front. Public Health 2022, 10, 4604. [Google Scholar] [CrossRef]
- O’Brien, R.M. A caution regarding rules of thumb for variance inflation factors. Qual. Quant. 2007, 41, 673–690. [Google Scholar] [CrossRef]
- Xie, H.; Tan, X.; Li, J.; Qu, S.; Yang, C. Does Information Infrastructure Promote Low-Carbon Development? Evidence from the “Broadband China” Pilot Policy. Int. J. Env. Res. Public Health 2023, 20, 962. [Google Scholar] [CrossRef]
- Zhang, K.; Li, S.; Qin, P.; Wang, B. Spatial and Temporal Effects of Digital Technology Development on Carbon Emissions: Evidence from China. Sustainability 2022, 15, 485. [Google Scholar] [CrossRef]
- Xu, P.; Chen, L.; Dai, H. Pathways to Sustainable Development: Corporate Digital Transformation and Environmental Performance in China. Sustainability 2022, 15, 256. [Google Scholar] [CrossRef]
- Chang, X.; Li, J. Effects of the Digital Economy on Carbon Emissions in China: A Spatial Durbin Econometric Analysis. Sustainability 2022, 14, 16624. [Google Scholar] [CrossRef]
- Jiang, T. Mediating Effects and Moderating Effects in Causal Inference. China Ind. Econ. 2022, 410, 100–120. [Google Scholar] [CrossRef]
- Yu, D. New trend of global manufacturing industry development and its impact on China in the new industrial revolution era. Tianjin Soc. Sci. 2019, 225, 88–100. [Google Scholar] [CrossRef]
- Graetz, G.; Michaels, G. Robots at Work. Rev. Econ. Stat. 2018, 100, 753–768. [Google Scholar] [CrossRef]
- Huang, J.; Li, Y. Green innovation and performance: The view of organizational capability and social reciprocity. J. Bus Ethics 2017, 145, 309–324. [Google Scholar] [CrossRef]
- Teece, D.J. Profiting from innovation in the digital economy: Enabling technologies, standards, and licensing models in the wireless world. Res. Policy 2018, 47, 1367–1387. [Google Scholar] [CrossRef]
- Olden, J.D.; Jackson, D.A. Illuminating the “black box”: A randomization approach for understanding variable contributions in artificial neural networks. Ecol. Model 2002, 154, 135–150. [Google Scholar] [CrossRef]


Disclaimer/Publisher’s Note: The statements, opinions and data contained in all publications are solely those of the individual author(s) and contributor(s) and not of MDPI and/or the editor(s). MDPI and/or the editor(s) disclaim responsibility for any injury to people or property resulting from any ideas, methods, instructions or products referred to in the content. |
© 2023 by the authors. Licensee MDPI, Basel, Switzerland. This article is an open access article distributed under the terms and conditions of the Creative Commons Attribution (CC BY) license (https://creativecommons.org/licenses/by/4.0/).