Article

Intergrading Water Quality Parameters, Benthic Fauna and Acute Toxicity Test for Risk Assessment on an Urban-Rural River

Key Laboratory of the Three Gorges Reservoir Region’s Eco-Environment, Ministry of Education, Chongqing University, Chongqing 400045, China
*
Author to whom correspondence should be addressed.
Sustainability 2023, 15(8), 6423; https://doi.org/10.3390/su15086423
Submission received: 6 March 2023 / Revised: 29 March 2023 / Accepted: 31 March 2023 / Published: 10 April 2023
(This article belongs to the Special Issue Sustainability of Aquatic and Wetland Ecosystems under Climate Change)

Abstract

:
Climate change, river pollution and loss of biodiversity are increasing and becoming global environmental concerns. The Yellow River is China’s mother river, providing water for about 114 million residents in towns and cities along its route. Yet in 2012, the Yellow River received 4.474 × 10⁹ tons of sewage containing a large number of exogenous pollutants, posing a huge ecological and public health threat. Water quality safety is not only a matter of ecosystem health but also of human survival and social development. Therefore, the effects of pollutants on water quality safety should be carefully studied, which is important to ensure the sustainability of the Yellow River and the surrounding cities and towns. In this study, water and sediment samples from the Jishan River of the Juancheng, a typical city in the lower reaches of the Yellow River, were collected and evaluated by integrating the traditional physicochemical water indicators, benthic Index of Biological Integrity (B-IBI) and zebrafish embryotoxicity test. The results showed that water dissolved oxygen, pH, total nitrogen and total phosphorus were strongly correlated with zebrafish embryonic teratogenicity, lethality, abundance index and Shannon Winner index. A total of 21 benthic species were collected, including mollusks, arthropods and annelids, with the upper reaches having the largest biomass and B-IBI values indicating the urban reaches have better biological integrity than rural reaches. The teratogenic rate of zebrafish embryos in raw water was greatest in rural rivers and was significantly different from the negative control (p < 0.05). When exposed to 100 mg/mL sediment samples, embryo hatching rates were inversely correlated with teratogenic rates, with lethal rates reaching over 96% in all rural reaches. The results showed that the water quality safety at the rural farms in the Yellow River transfer-type towns is poor, and they especially recommended that the river near the farms in rural areas should be monitored with emphasis.

1. Introduction

Global climate change, combined with the increase in global population and rapid urbanization, resulted in increasing water pollution and biodiversity loss at an unprecedented rate in rivers around the world [1,2]. Discharges of wastewater from industrial and personal use are contributing large amounts of exogenous pollutants to rivers [3]. It has been reported that 90% of rivers flowing through towns and cities are heavily polluted [4], posing significant ecological and public health threats, including loss of biodiversity and the induction of cancer [5,6]. A statistically significant correlation has been found between the incidence of biological tumors and the concentration of chemical contaminants in water [7,8]. In addition, for rivers in urban–rural areas, there are often significant differences in the pollution status of rivers in different sections, such as urban and rural areas, due to the type and intensity of human activities [9]; therefore, the main pollutants and toxic effects on ecosystems [10], with rivers around cities with high population density often having poorer water quality than areas far from cities [11].
Before the 1990s, river health assessment mainly relied on water quality indicator tests, i.e., quantitative testing of certain indicators, a method that allows visual assessment of whether and how much pollutant levels are exceeded [12]. However, water quality indicator analysis alone cannot achieve a comprehensive assessment of a water body because pollutants are always present as a mixture [13]. Whereas, it has been found that the use of appropriate bioanalysis can effectively compensate for this shortcoming. Bioanalysis can reflect the extent of water pollution and reveal the potential adverse effects of pollutants on organisms and humans [14,15]. Jeppesen et al. [16] applied indices related to the aquatic community structure to assess the health of aquatic ecosystems [17,18]. Brack et al. [19] monitored water quality and, thus, revealed its potential health risk to humans by analyzing the short-term toxicity of pollutants to organisms, which is beyond the analytical capacity of water quality indicators. Thus, biologically oriented approaches were integrated into water quality monitoring.
In order to illuminate the ecological risk and water scarcity, dilution becomes a necessary approach. Nowadays, inter-basin water transfer between larger rivers has become frequent in countries around the world [20]. It is also one important source of production and domestic water in the middle and lower reaches of the Yellow River Basin of China [21,22]. Of which, Juancheng County, located along the lower reaches of the Yellow River, is one of the cities that half of the water resources rely on the Yellow River. The amount of available water resources is 282 million m3 per year, of which the Yellow River transfer accounts for 57%. The water transfer could not only improve water quality during the transfer period in the transferred lakes but also affect aquatic organism community structure and diversity [23]. The ecological protection and high-quality development of the Yellow River Basin have been elevated to a major national strategy [24]. Therefore, to ensure the ecological health of the Yellow River watershed, it is necessary to evaluate the ecological health of water quality in towns and cities based on the Yellow River water intake.
In this study, water quality monitoring was conducted in the Yellow River basin, especially the downstream section, through water quality index analysis, biological community structure analysis and biological toxicity detection methods, and jointly explored the relationship between water quality–hydraulic ecology and water security in the lower Yellow River areas, with a view to providing important support for water ecological health protection and restoration.

2. Materials and Methods

2.1. Study Area

The sampling sites are located in the Juancheng County of Shandong Province, where it is on the lower reaches of the Yellow River. The water of the Yellow River flows through the water intake site into the Jishan River in the county. Based on the different sources of pollution along the Jishan River, the sampling sites included the primary locations of potential pollution. Of these, 4 sampling sites were selected on the main stream, i.e., site 1 (35°30′4.56″ N, 115°21′18.28″ E) was in the water intake point of the Yellow River. Site 2 (35°26′45.12″ N, 115°32′44.08″ E) was in Shaheqiao, which is the drinking water source reservoir for the county. There is a city sewage treatment plant next to the river at site 3 (35°34′36.96″ N, 115°31′26.06″ E), and the sampling point will be located at its outlet because the effluent from the plant is discharged into the river. Site 4 (35°39′18.53″ N, 115°40′35.48″ E) was located downstream of the rural area. In addition, considering that the wastewater discharge from goose farms will have an impact on the water quality, 6 sites were set up in a tributary where the goose farm lies nearby. Tributary site 1 (TS1, 35°67′96.38″ N, 115°57′07.23″ E) was 10 km away from the estuary, TS2 was inside the goose farm (35°68′00.49″ N, 115°58′07.93″ E), TS3 (35°67′08.37″ N, 115°59′01.68″ E) and TS4 (35°67′71.39″ N, 115°59′91.72″ E) were 8.7 and 7.4 km away from the estuary, respectively. TS6 was in the estuary (35°66′18.11″ N, 115°68′00.29″ E), and TS5 (35°65′15.46″ N, 115°61′01.47″ E) was in another tributary as a reference, where there was no goose farm within the basin of this tributary. The locations of sampling sites chosen for the study are shown in Figure 1.

2.2. Sampling and Sample Treatments

During the field investigation, 100 mL glass vials, which were pre-cleaned with pure water and dried at 120 °C in an oven (GW-024E, Juwei, China), were used to collect surface water samples at S1–4. A total of 12 surface water samples (4 sites × 3 replicates) were finally collected. Sediment samples were collected using a 1/40 Peterson grab sampler (surface area: 15 × 30 cm2) in triplicate from shallow to deep sections at the bottom of the river and then combined into one sample. Surface soil samples (0–25 cm) were collected at TS2 inside the goose farm using a shovel. Each sediment or soil sample consisted of three sub-samples; hence, a total of 27 sediment samples and 3 surface soil samples were collected during the study. Each sediment and soil sample was then divided into two parts of equal weight, one was prepared for toxicity testing and material identification and was stored in tinfoil bags at 4 °C, and the other was for benthic identification and was stored in formalin solution.
After being taken back to the laboratory, surface water samples were filtered by 0.45-μm syringe filter (Jinteng, Tianjin, China) and were stored at 4 °C in glass vials. Sediment samples for toxicity test were freeze dried, grounded to pass through a 60-mesh sieve and followed by weighting 20 g of pre-treated sediment sample for Soxhlet extraction with 120 mL of solvent mixture (n-hexane: acetone; v:v = 1:1) for 12 h. Afterwards, the extract was concentrated by a vacuum rotary evaporator (R201D, Yinggu, China) under the conditions of 40 °C and 60 rpm to 1–2 mL. The extracts were further dried by nitrogen blowing and transferred to a liquid phase vial, and 1 mL of Dimethyl sulfoxide (DMSO) was added to dissolve it for subsequent biological experiments [25]. Another part of the sediment samples was sealed and stored in 7% buffered formalin. Taxonomic identification of benthic organisms was carried out by microscopy. The same taxonomic unit was weighed on an electronic balance and the final result was converted to biomass per unit area. Benthic identification with reference to data was described by Zhang et al. [26].

2.3. Zebrafish Embryotoxicity Test (ZET)

Adult zebrafish were obtained from the Institute of Hydrobiology, Chinese Academy of Sciences (Wuhan, China) and maintained in the laboratory at a constant temperature of 26 °C and 14 h of light/10 h of darkness. Adult females and males were placed in a 1:2 ratio in spawning boxes one hour before the start of the dark cycle the night before the experiment, and eggs were collected on the day of the experiment. Zebrafish embryos were collected into Petri dishes containing recombinant water, which were prepared by mixing CaCl·2H2O (10 mL, 294.0 mg/L), MgSO4·7H2O (10 mL, 123.3 mg/L), NaHCO3 (10 mL, 63.0 mg/L) and KCl (10 mL, 5.5 mg/L) in 960 mL double distilled water to make a 1 L solution and screened out under a microscope at 8 cells stage. Solvent controls (recombinant water), positive controls (100 mg/L 3,4-dichloroaniline) and negative controls (DMSO) were included in each independent experiment. The exposure medium of the water samples was raw water, and the exposure concentration of the sediment samples was 100 mg/mL. Then, zebrafish embryos were exposed in 24-well plates, which can provide more oxygen supply for the growth of zebrafish [27]. Every 10 wells of the 24-well plates were used to expose a substance to be tested or a negative control, with the positive control set up with 20 wells. Add 1 zebrafish embryo (pipetted with 1 mL of pre-exposure solution) to each well with a pipette gun to 1 mL of pre-exposure solution, for a total volume of 2 mL per well. Hatching rate, teratogenic rate and lethal rate are recorded using a microscope every 24 h after exposure up to 96 hpf [28]. The ZET was initiated at 4–5 h post-fertilization (hpf) at the gastrulation period and ended at 96 hpf, as this covers the entire organogenesis in a zebrafish embryo [29]. During the experiment, we prepared sample exposures at different concentrations and plotted dose–response curves for LC50 concentrations (capable of killing 50% of the subjects) at 96 hpf.

2.4. Biodiversity Index

In this study, biodiversity of benthic fauna was evaluated using the following four indicators: Richness index, Shannon Wiener index, Simpson diversity index and Pielou evenness index, which are calculated as follows:
Richness index equals to the richness of the species contained in the community:
Simpson   diversity   index = 1 i = 1 S ( N i N ) 2 ,
Shannon   Wiener   index = i = 1 S ( p i l n p i ) ,
Pielou   evenness   index = H l n S .
In the above formula, S refers to the total number of all kinds of species, N is the total number of individuals of all species, N i   is the number of individuals of species “i” and p i   is the proportion of species “i” to the total number of species [30,31].

2.5. Benthic Index of Biological Integrity (B-IBI)

In order to analyze the benthic index of biological integrity (B-IBI), setting reference sites are necessary. The reference sites mean there was no obvious human interference, good water quality and high habitat quality. Based on the results of water quality and previous studies on zooplankton integrity index in Dongping Lake [9], the reference sites were selected (S1 and S2), and the rest were identified as impaired sites with high disturbance.
Based on relevant studies, a comprehensive selection of 15 candidate indicators sensitive to environmental changes was used to assess water samples (Table S1), and the indicators were classified into three categories: community diversity, community composition and community trophic structure [32]. A preliminary boxplot analysis (Figure S1) of the above indicators is then performed. Correlation analysis (Table S2) was performed on the screened indicators to reflect the mutual independence of indicators [12]. |r| greater than 0.750 means there is much overlapping information between two indices, and for highly correlated indices, one of them can be taken [23]. The ratio method is more accurate among the commonly used parameter standardization methods [33]. The 95% quantile value was selected as the best value for the parameter whose value became smaller due to enhanced interference. The parameter fraction for each sampling site is the parameter value divided by the best value. For those metrics positively correlated with disturbances, the optimal value is the 5% quantile of all sample parameters, and the index score is calculated as follows:
B IBI = ( maximum   value     parameter   value ) / ( maximum   value     optimal   value ) .
The final result of B-IBI is the sum of all the parameters. The 25% quantile of the reference point was selected as the health threshold, while those below the 25% quantile value could be scored in 4 equal segments, so the standards for evaluating the different health levels had 5 levels: excellent, good, moderate, poor and bad.

2.6. Physico-Chemical Properties Analysis

We analyzed 8 physicochemical parameters aggregately. Temperature (T), Pressure (P), potential of hydrogen (pH), dissolved oxygen (DO), specific conductance (SPC) and oxidation-reduction potential (ORP) are determined on-site using a water quality multi-parameter detector (YSI Professional Plus, Yellow Springs, OH, USA). The total nitrogen (TN) and total phosphorus (TP) were determined according to APHA (2012) [26].

2.7. Data Analysis

The Origin Pro 2021 was used for statistical processing and graphical files of test data. The results were statistically evaluated using analysis of variance (ANOVA). The normal distribution and variance homogeneity test in advance, when the assumptions of homogeneity of variance and normal distribution were not met, a Kruskal–Wallis H test with Dunn post hoc tests was performed to conduct multiple comparisons. The level of significant difference was set at 5% (p < 0.05). All statistical analyses were performed with the software package SPSS 25.0 (IBM SPSS Statistics 25 IBM Corp., New York, NY, USA). Dose–response curve was drawn by GraphPad Prism 8.0.

3. Results

3.1. Physicochemical Parameters

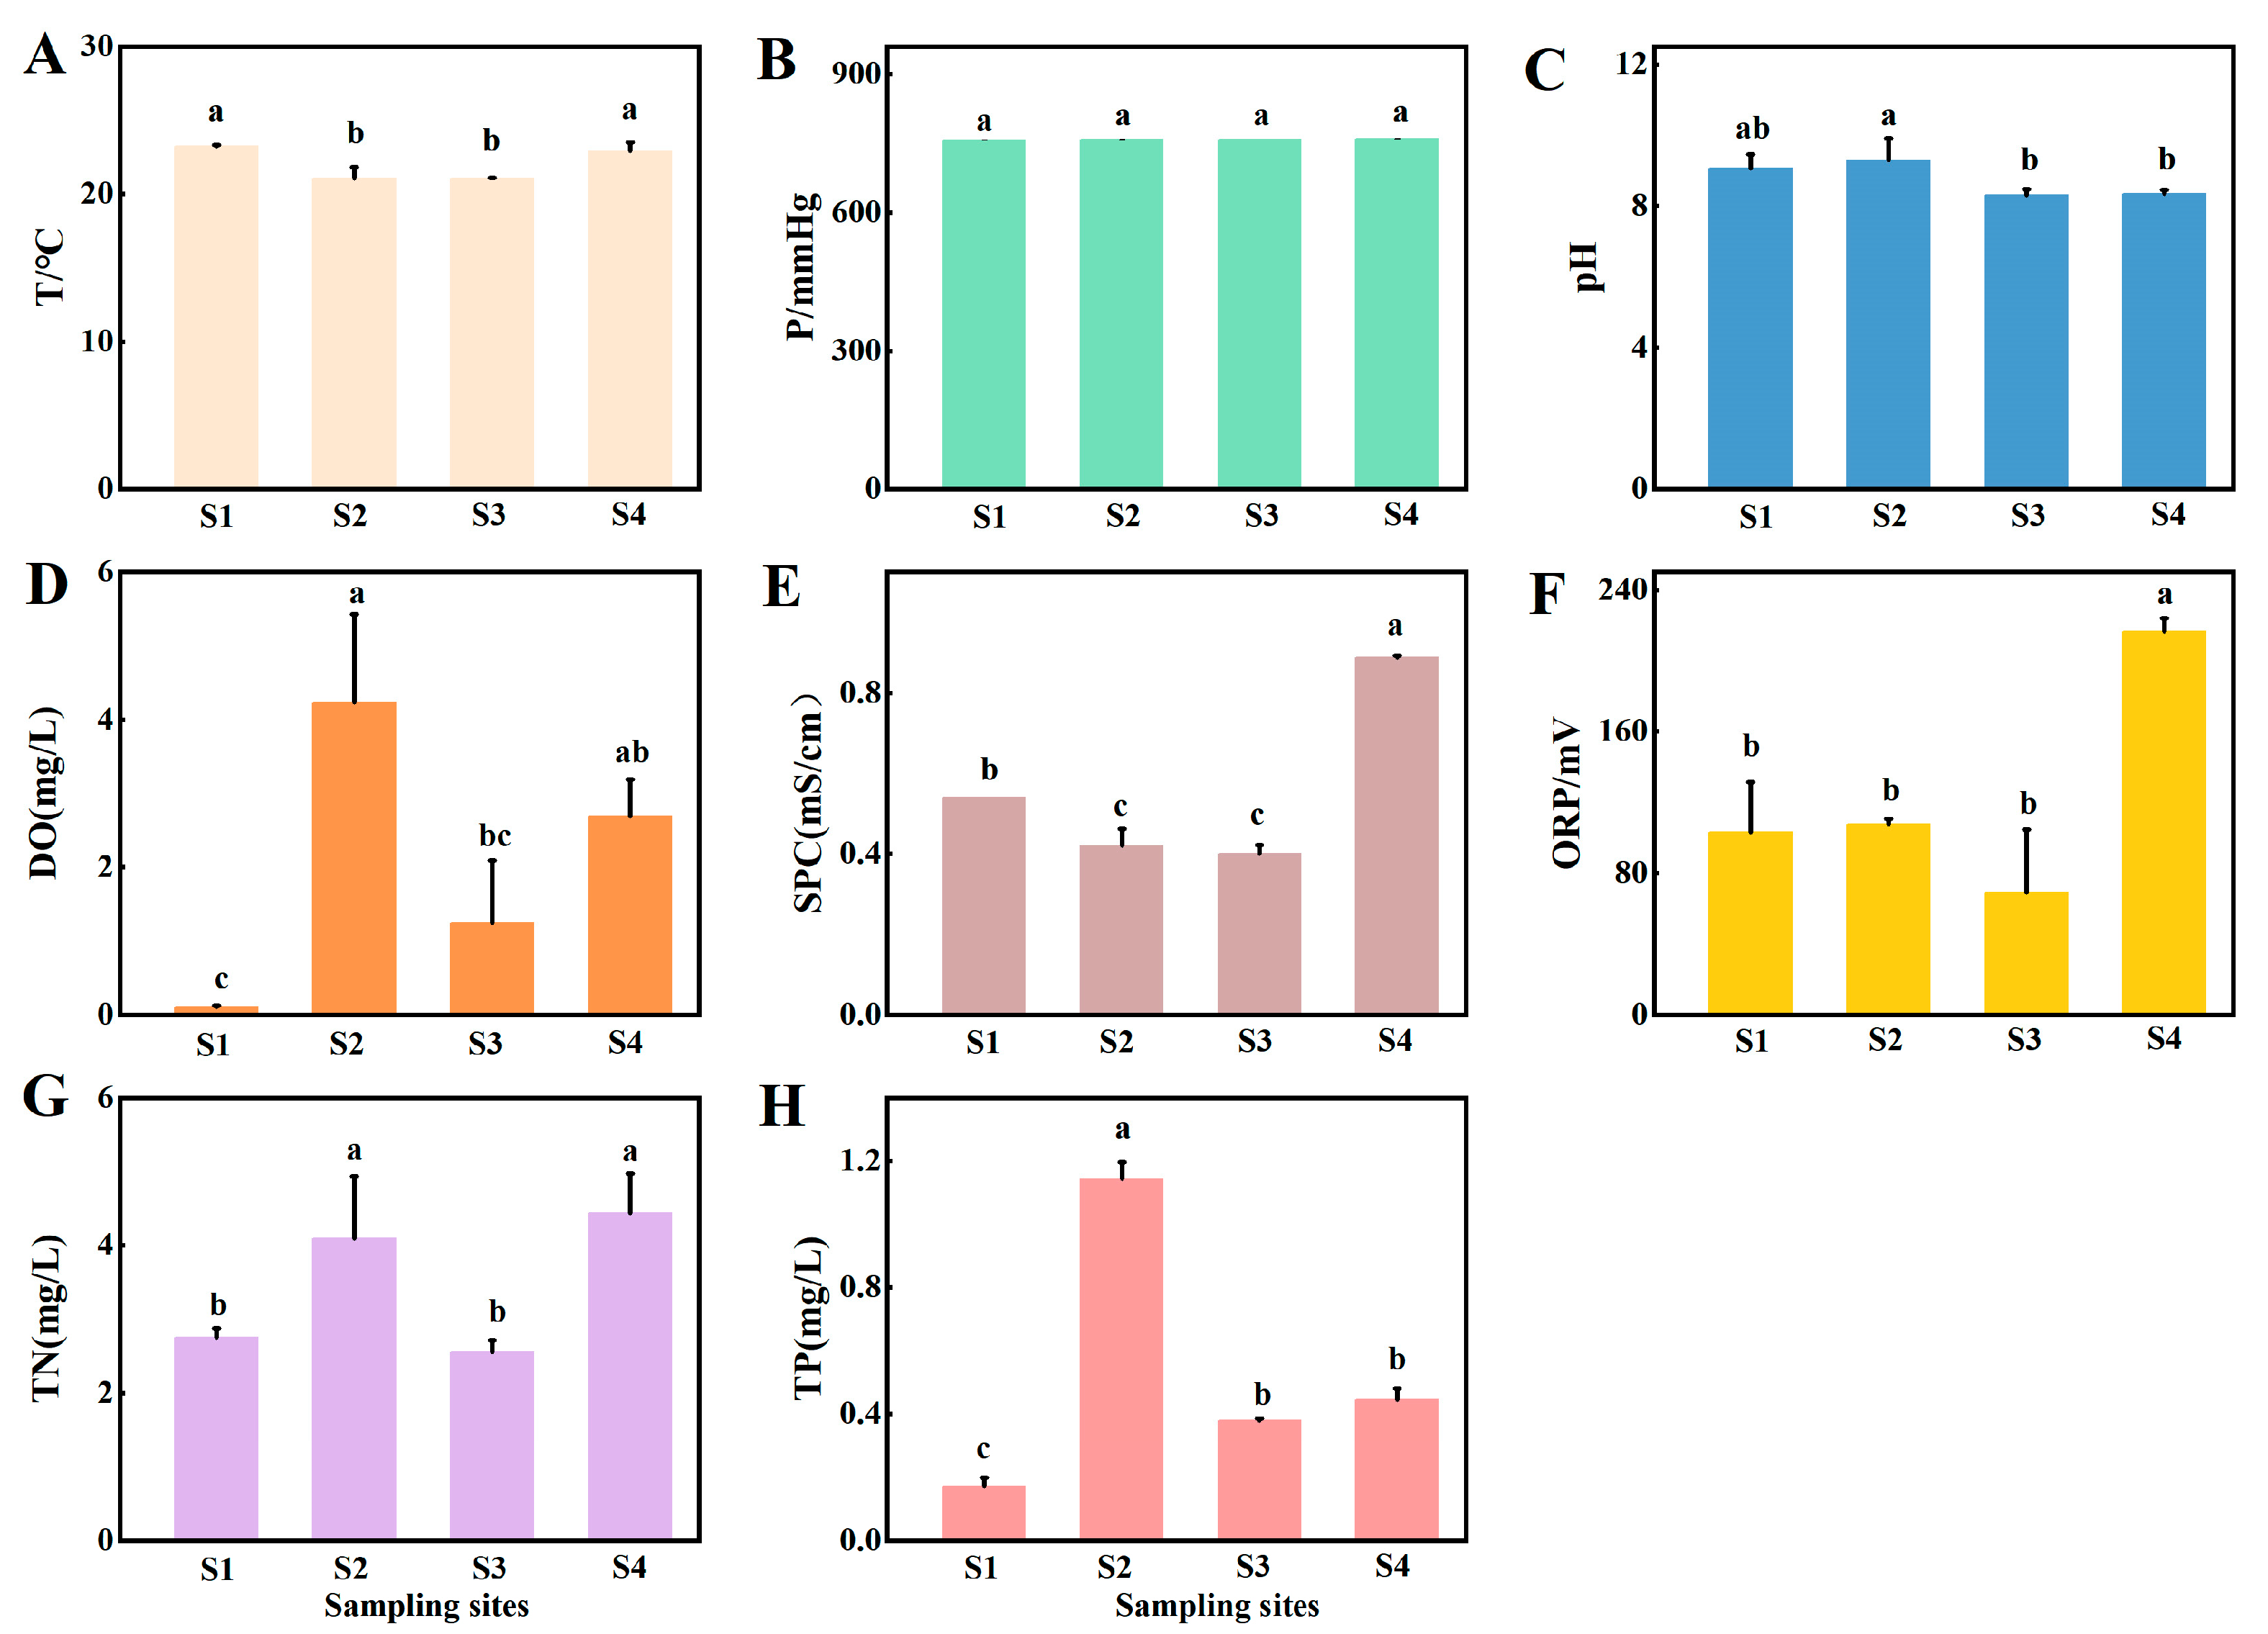
The water quality parameters of the sampling sites are shown in Figure 2. Temperature and water pressure exhibit spatial differences among these sites. The pH values varied from 8.30 to 9.06, of which S2 was the highest and significantly higher than S3 and S4 (p < 0.05). The lowest concentration of DO (0.11 mg/L) was found at S1, followed by S3 (1.243 mg/L), S4 (2.693 mg/L) and S2 (4.23 mg/L). Both SPC and ORP showed a trend of fluctuation, with S4 being the largest and S3 was the smallest. The concentration of TN at all sites was higher than 2 mg/L, which is the maximum limit of agricultural water. Furthermore, the concentration of TP in S2 was much higher than that in other sites (p < 0.05).

3.2. Benthic Diversity

3.2.1. Species Composition, Distribution and Diversity

A total of 21 benthic species were identified (Table 1), belonging to mollusks, arthropods and annelids. Among which, arthropods are the most common species, accounting for 67% of total species. The annelids (3 species) accounted for 14%, and mollusks (4 species) amounted for 19%. With each site, the largest number of species were found at S2 (57.8%). Regarding the abundance of species, Chironomus sp. was the most abundant species found at S2 and S3. The lowest number of benthic fauna was found at S1, with only six individuals (1.5%). The relationship between the biomass and sampling sites is consistent with the number of individuals. The highest biomass contribution was from Plectotropis.
The results of species diversity are shown in Figure 3. Comparing these indexes, S2 was significantly higher than S1, S3 and S4, while there was no significant difference within other sites with the Pielou evenness index was an exception.

3.2.2. Ecological Health Evaluation Using B-IBI

Through the Boxplot and Pearson correlation analysis, the final evaluation index of the B-IBI evaluation system was screened. Moreover, the B-IBI health evaluation criteria are shown in Table S3. As shown in Table S4, the B-IBI values of all sampling sites ranged from 0.741 to 2.963, with a mean value of 1.650. Hence, the overall health level of the tributaries of Juancheng County is moderate. In addition, the spatial variability of the health status was observed; the highest B-IBI value was found at S2, which was 2.963. Moreover, the B-IBI values for S1, S3 and S4 were 1.288, 1.740 and 0.583, respectively, referencing the poor, moderate and bad status of ecosystem health. The ecological health of S4 was the worst among the four sites.

3.3. Effects of ZET

3.3.1. Effects of Raw Water and Sediments

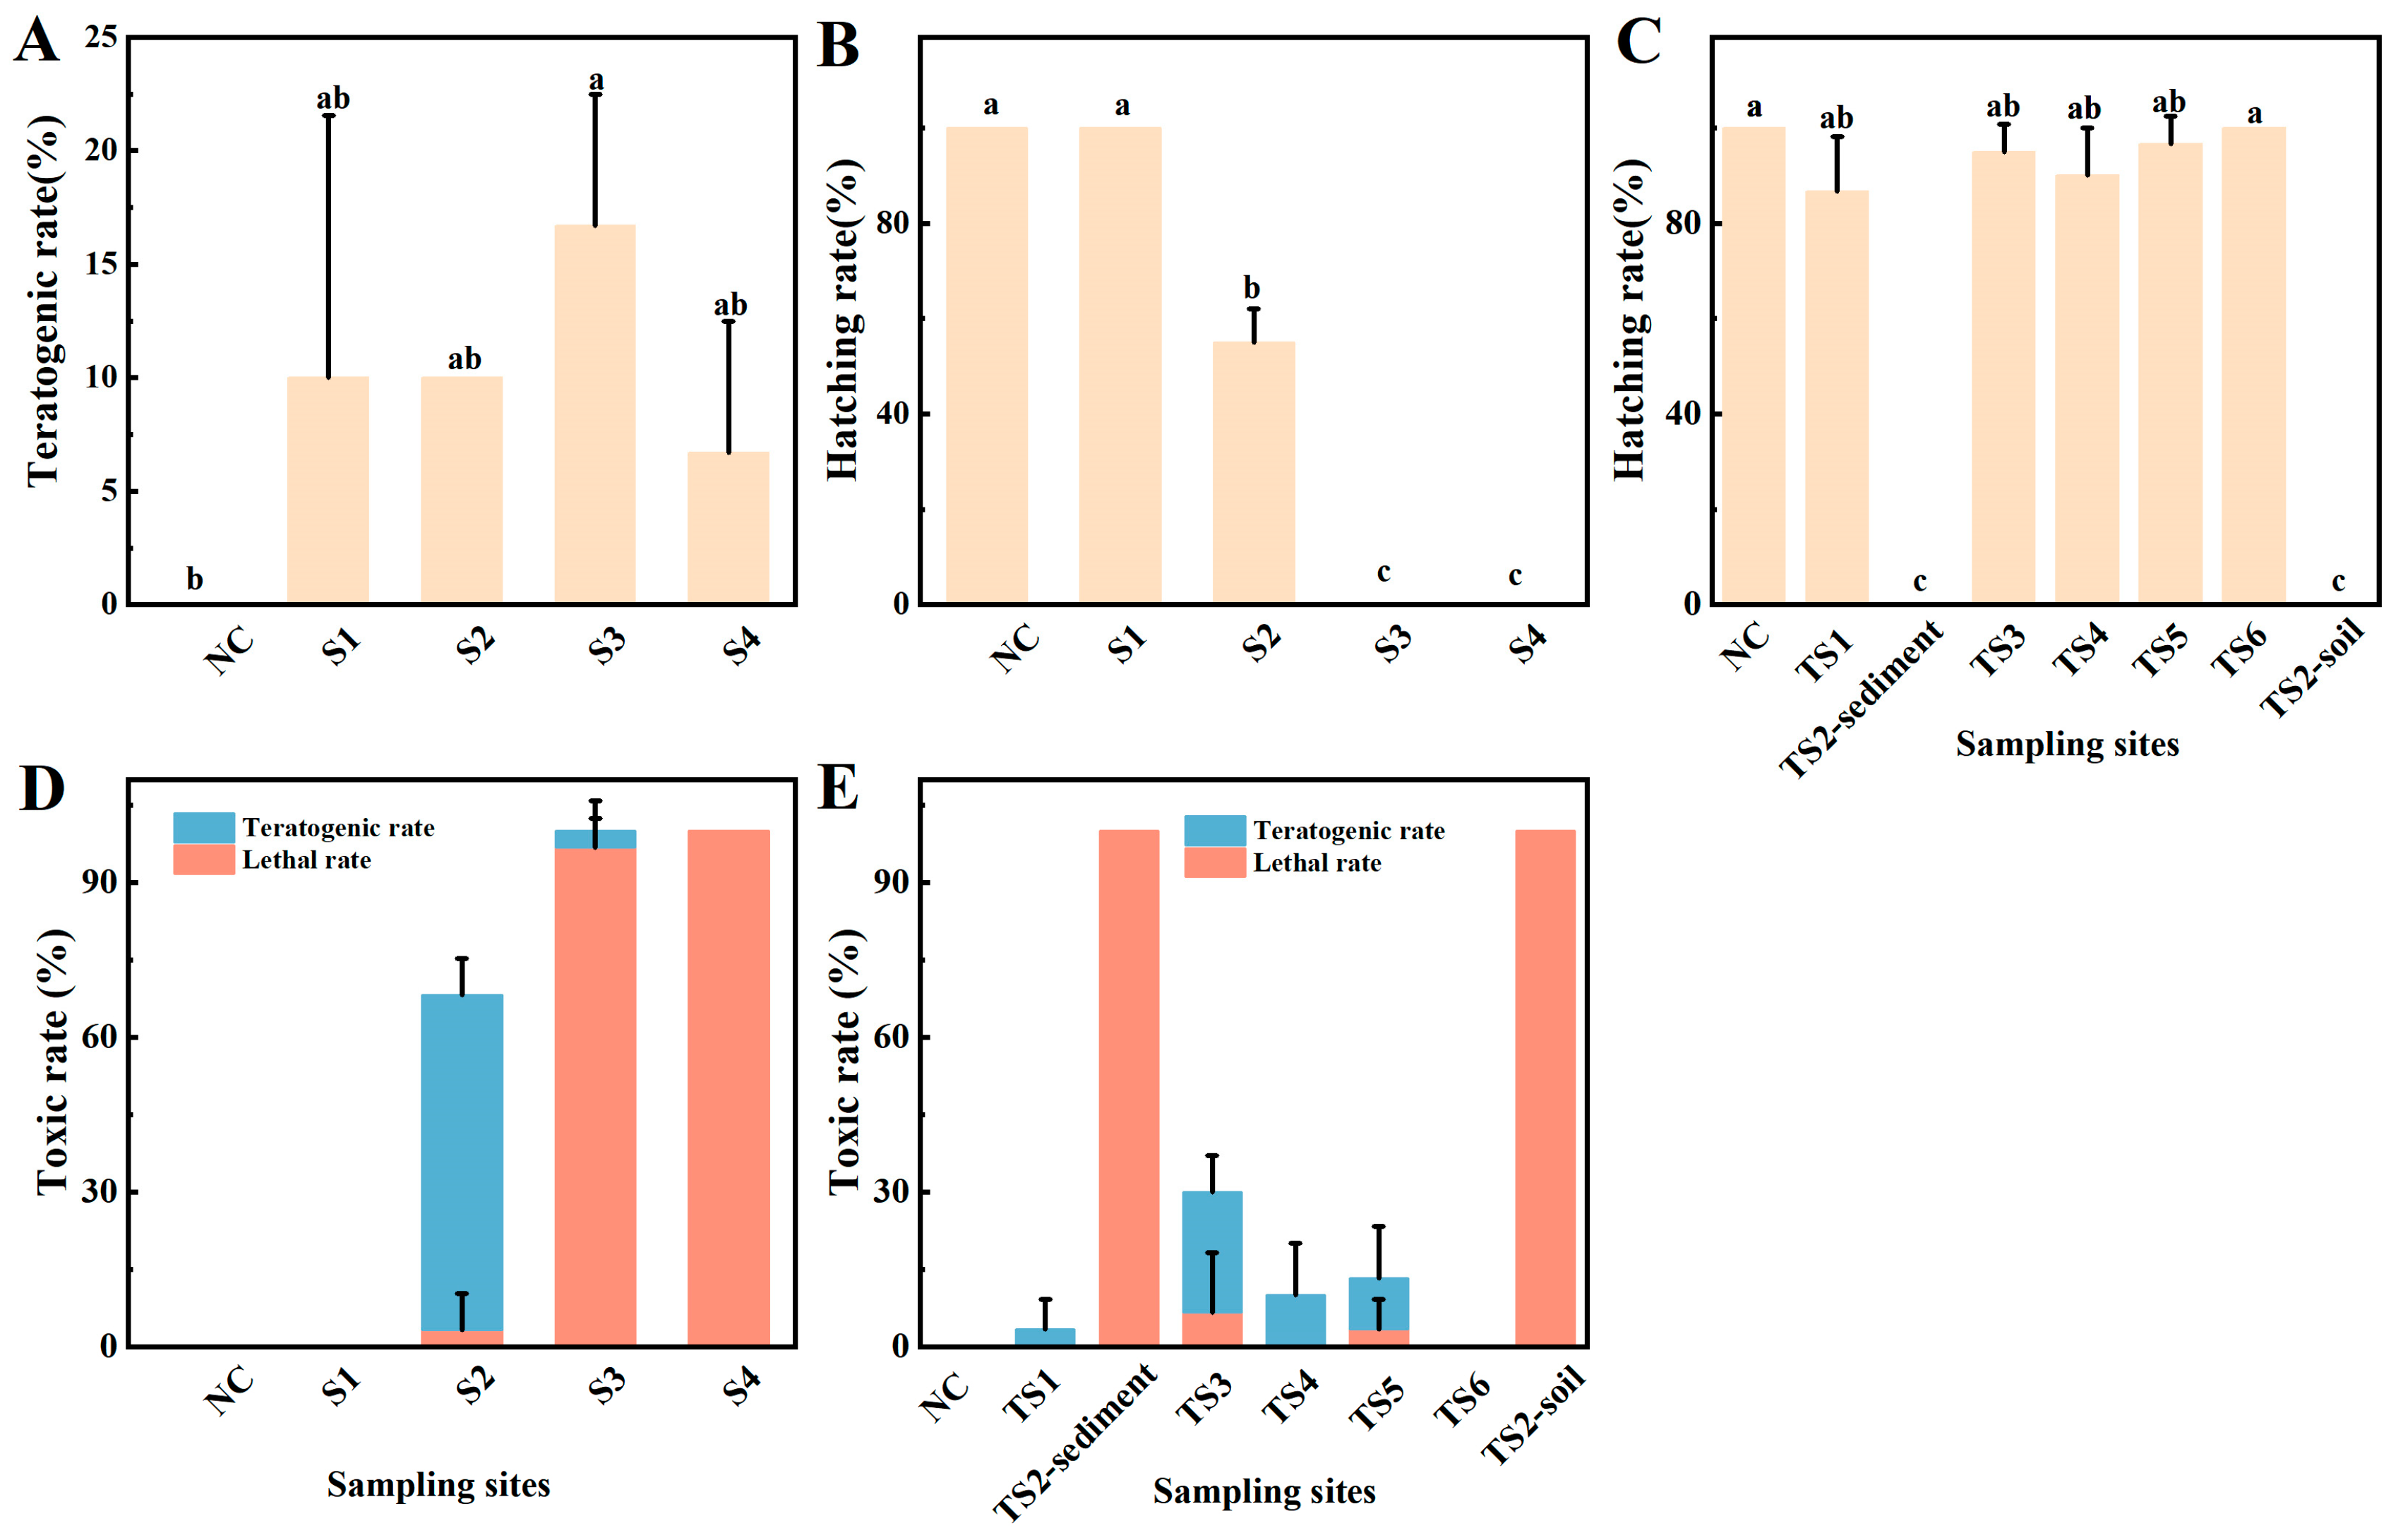
Figure 4A shows the embryotoxic effects of zebrafish in raw water samples. As shown in Figure 4A, the raw water samples of all four sites exhibited teratogenic effects. Furthermore, S3 presented the most significant teratogenic effect on zebrafish embryos, which showed a significant difference in comparison to the negative control (NC) (p < 0.05).
The results of the embryo-toxic effects of zebrafish in sediment samples (100 mg/mL, Figure 4B–E) showed that the 96 hpf hatching rate of zebrafish embryos in S1 is consistent with NC, implying that S1 has no significant effect on the development of zebrafish embryos. Zebrafishes were stunted in growth and development when exposed to S2, and only 55% hatched at 96 hpf. Simultaneously, a variety of malformation effects could be produced, specifically reflected as the formation of death, tail bending, yolk sac edema and pericardial edema (96 hpf). Zebrafish embryos were observed to die completely after 24 hpf of exposure to S3 and S4. Considering the impact of farm wastewater discharge around the S4 on water quality, the same analysis of zebrafish embryo toxicity was conducted on the collective farm sediments in this study. The results showed that both TS2-sediment and TS2-soil, located inside the goose farm, showed significant differences in the hatching rate and mortality compared to NC (p < 0.05).

3.3.2. Dose–Response Curve and LC50

The dose–response curve was plotted for samples with a 100% lethal rate to obtain the LC50 values. These results (Figure 5) showed that the survival rate of zebrafish embryos exposed to S3, S4, TS2-sediment and TS2-soil produced concentration-dependent effects in the ZET (96 hpf). In contrast, the LC50 values of the in-farm samples were smaller, implying greater toxicity and greater sensitivity of the embryos. More specifically, a 1.4-fold higher potency for S3 compared to S4 as reflected by the LC50 values of 45.36 and 32.05 mg/mL. In the farm samples, the LC50 value of the sediment was larger than that of the soil sample.

3.4. Correlation Analysis

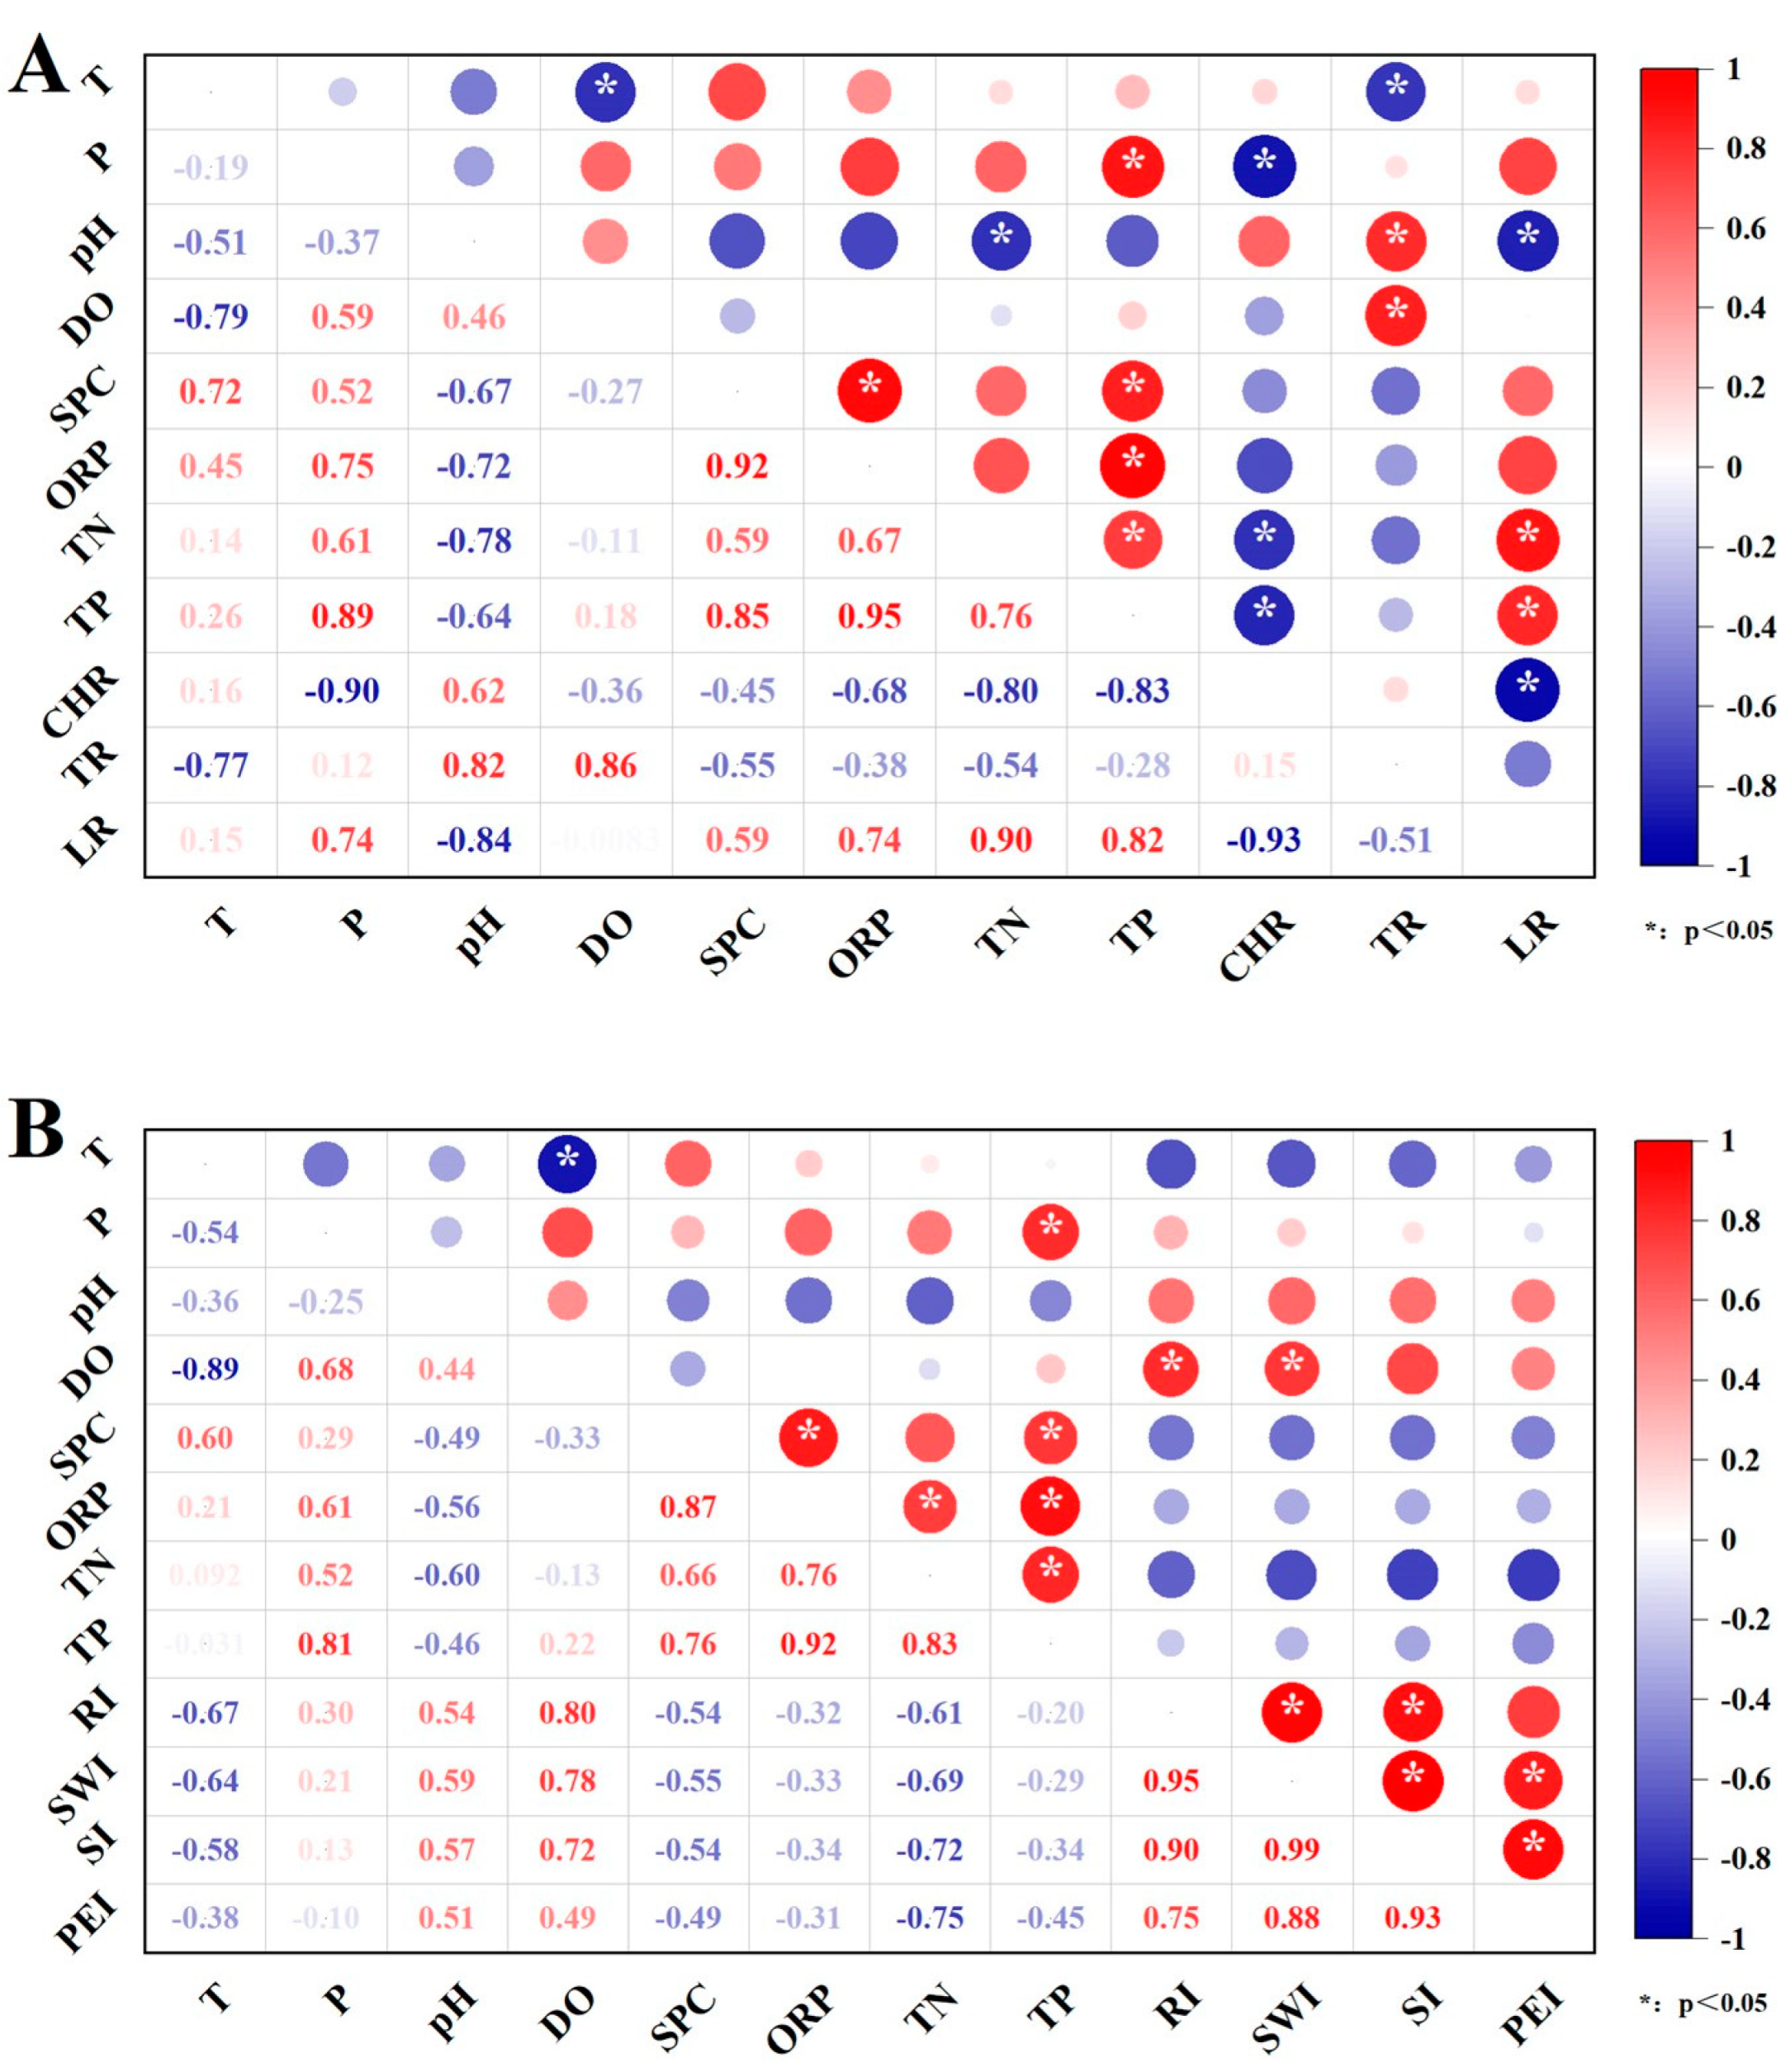
Pearson correlation analysis (Figure 6A) showed that the toxicity indexes of fish all showed a correlation with physicochemical factors (p < 0.05). HR and LR showed significant correlation with both TN and TP, with the former being negatively correlated and the latter being positively correlated, respectively. TR was not significantly related to TN and TP but had a significant positive relationship with pH and DO. Furthermore, a negative correlation was observed between CHR and P, TR and T and LR and pH. In Figure 6B, both RI and SWI were positively correlated with DO (p < 0.05). However, there was no significant correlation between SI, PEI and physicochemical factors.
The first two axes of the PCA explained 86.9% of the variation in each factor between the different sites (Figure 7), suggesting that the first two factors contain most of the data information, and can accurately reflect the water quality condition. Most physicochemical factors were clustered along the third quadrant. The species diversity index was clustered along the second quadrant and clustered with DO and pH since their arrows on the X-axis pointed in the same direction. The teratogenic rate of zebrafish embryos and the Species diversity index were positively correlated with DO and pH since their intersection angles in the PCA plot were not greater than 90 degrees. However, their correlation with P, TP, ORP, TN and SPC is reversed.

4. Discussions

4.1. Water Quality and Benthic Fauna

It has been known that benthic communities reflect the ecological quality and integrate the effects of different stressors providing a broad measure of their impact [34]. Therefore, benthic fauna is widely used as water quality indicators [12,35]. Its species diversity is a reflection of biome composition and structure [36]. Biological communities have their own natural evolutionary characteristics, while external disturbances, such as changes in natural conditions and human activities may cause changes in the species composition of the community, and in the long run, the diversity of ecosystem structure will be destroyed [37,38]. In our study, we found that the biodiversity of freshwater ecosystems varied greatly among sample sites. The most abundant species taxa were found at sample site S2 and decreasing downstream to S3 and S4. This is consistent with previous studies by Huh et al. [39] and Nestlerode, J.A. [40]. Species diversity is richer in flood-risk areas, and these results can be attributed to the natural vertical distribution of riverine fauna and the influence of artificial flood control systems. Many aquatic animals spend all or part of their life cycle in floodplains [41], and therefore species richness of freshwater fauna is usually higher in these areas. The sample sites located downstream had significant sediment deposition, reduced flow velocity, reduced habitat heterogeneity and a decreasing trend in benthic faunal diversity. Moreover, due to the poor stability of the sandy riverbed, which is easily disturbed by water flow, as well as the lack of apoplankton input and limited organic matter input from upstream, the benthic fauna was dominated by shaker mosquito larvae with a strong migratory ability and adapted to poor nutrition [42,43]. The lowest number of species was found at S1, which may be due to the sharp narrowing of the river channel at this point after the inflow of the Yellow River water into the territory of Yancheng, resulting in a high scouring force [44]. Additionally, pollution is highly correlated with human activities in the watershed, which manifests itself as differences in species diversity in biological distribution [9]. Among the different types of anthropogenic disturbance intensity selected in this study, the analysis revealed that benthic organisms were more abundant and more uniformly distributed at the sample sites of drinking water reservoirs with less human activities, and more indicator organisms of clean water bodies were present, while the crowded areas, such as urban sewage treatment plants and rural farms, had less benthic organisms due to intensive human activities, and the input of domestic sewage and farming wastewater disturbed the original system of the water ecosystem.

4.2. Toxic Effects to Zebrafish Embryos and Ecosystem Risk

Zebrafish is an important model organism for toxicological studies [45]. In this study, we assessed the ecological risk through zebrafish embryos and found that raw water presented teratogenic effects that were not significantly different from the control, and the effects were more pronounced when the embryos were exposed to sediment. This is due to the enrichment of the sediment with low-dose, hard-to-detect contaminants in the treatment. Multiple malformed embryos were found in the sediment samples at S2. A possible reason is the hydrological conditions of the sampling site. Frequent floods occur here, and the river has been in operation for a long time, resulting in severe siltation with a large average siltation depth [46]. The water level is raised, thus creating an anoxic environment where organic matter is reduced under these conditions, producing alcohols and aldehydes as harmful substances and accumulating here [47]. High lethality at S3 and S4 may come from treated reclaimed water from sewage plants and from farm wastewater. Further analysis of samples collected from goose farms revealed that samples from within the farms were more toxic to zebrafish embryos [48], which may be due to the high level of eutrophication of water bodies caused by excessive levels of organic substances, such as N and P, in farm wastewater [49]. Total coliforms are another contamination factor in the surface water near the farm [50], resulting in poor overall water quality at this sampling site. This can be explained by the fact that poultry farms are usually located near densely populated residential areas, where domestic wastewater and livestock wastewater are discharged together into a common sewer system, causing an integrated impact on water quality. This suggests that the source of pollutants is mainly from human activities, including urbanization and farming development. This is consistent with previous findings on endocrine disruptors in the area [51], which pose a challenge to the protection and preservation of drinking water resources.

5. Conclusions

In this study, the water quality safety of the downstream Yellow River transfer-type towns was analyzed by combining analysis of physicochemical index, biological integrity index and zebrafish toxicity tests. It was found that even raw surface water could exhibit toxic effects. The tests on zebrafish embryos indicated that sediments inside rural farms were more toxic than others; similar results were obtained from the aquatic organism communities. Therefore, it is of importance to protect the environment of farmed river sections in rural areas. This study can provide a scientific basis and regulatory reference for the sustainable management of urban–rural rivers.

Supplementary Materials

The following supporting information can be downloaded at: https://www.mdpi.com/article/10.3390/su15086423/s1, Preliminary analysis method of boxplot of candidate indicators; Table S1: Candidate indicators and codes for benthic integrity evaluation system; Table S2: Pearson correlation between biological indicators; Table S3: B-IBI health evaluation criteria; Table S4: Calculation results and levels of core indicators for each sampling site; Figure S1: Boxplots of the candidate biological indicators at the reference point and the damage point.

Author Contributions

W.S.: Investigation, Writing—original draft preparation. Z.C.: Supervision, Writing—review and editing. Y.S.: Supervision, Writing—review and editing. All authors have read and agreed to the published version of the manuscript.

Funding

This work was supported by the “EMR-rural project” of the National Key R&D Program of China (No: 2019YFD1100505).

Institutional Review Board Statement

Not applicable.

Informed Consent Statement

Not applicable.

Data Availability Statement

The data that support the findings of this study will be provided upon reasonable request to the corresponding author.

Acknowledgments

We thank Guanxiong Zhang from Qufu Normal University for helping with benthic fauna identification. We thank Chunqing Liu for helping with sampling at the goose farm and the tributary of the Jishan River.

Conflicts of Interest

The authors declare no conflict of interest.

References

  1. Wen, Y.; Schoups, G.; van de Giesen, N. Organic Pollution of Rivers: Combined Threats of Urbanization, Livestock Farming and Global Climate Change. Sci. Rep. 2017, 7, 43289. [Google Scholar] [CrossRef] [Green Version]
  2. Ding, X.; Liu, L. Long-Term Effects of Anthropogenic Factors on Nonpoint Source Pollution in the Upper Reaches of the Yangtze River. Sustainability 2019, 11, 2246. [Google Scholar] [CrossRef] [Green Version]
  3. Fernández-Luqueño, F.; López-Valdez, F.; Gamero-Melo, P.; Luna, S.; Aguilera-González, E.N.; Martínez, A.I.; Hernández-Martínez, G.; Herrera-Mendoza, R.; Álvarez, M.A.; Pérez-Velázquez, I.R. Heavy Metal Pollution in Drinking Water—A Global Risk for Human Health: A Review. Afr. J. Environ. Sci. Technol. 2013, 7, 567–584. [Google Scholar]
  4. Li, X.-D.; Masuda, H.; Kusakabe, M.; Yanagisawa, F.; Zeng, H.-A. Degradation of Groundwater Quality due to Anthropogenic Sulfur and Nitrogen Contamination in the Sichuan Basin, China. Geochem. J. 2006, 40, 309–332. [Google Scholar] [CrossRef] [Green Version]
  5. Burdon, F.J.; Munz, N.A.; Reyes, M.; Focks, A.; Joss, A.; Räsänen, K.; Altermatt, F.; Eggen, R.I.L.; Stamm, C. Agriculture versus Wastewater Pollution as Drivers of Macroinvertebrate Community Structure in Streams. Sci. Total Environ. 2019, 659, 1256–1265. [Google Scholar] [CrossRef] [PubMed]
  6. Kenworthy, J.M.; Rolland, G.; Samadi, S.; Lejeusne, C. Local Variation within Marinas: Effects of Pollutants and Implications for Invasive Species. Mar. Pollut. Bull. 2018, 133, 96–106. [Google Scholar] [CrossRef]
  7. Liu, Y.; Liu, G.; Yuan, Z.; Liu, H.; Lam, P.K.S. Presence of Arsenic, Mercury and Vanadium in Aquatic Organisms of Laizhou Bay and Their Potential Health Risk. Mar. Pollut. Bull. 2017, 125, 334–340. [Google Scholar] [CrossRef]
  8. Ogbeide, O.; Uhunamure, G.; Okundaye, F.; Ejeomo, C. First Report on Probabilistic Risk Assessment of Pesticide Residues in a Riverine Ecosystem in South-South Nigeria. Chemophere 2019, 231, 546–561. [Google Scholar] [CrossRef]
  9. Zhao, H.; Li, X. Risk Assessment of Metals in Road-Deposited Sediment along an Urban–Rural Gradient. Environ. Pollut. 2013, 174, 297–304. [Google Scholar] [CrossRef]
  10. Chetty, S.; Pillay, L. Assessing the Influence of Human Activities on River Health: A Case for two South African Rivers with Differing Pollutant Sources. Environ. Monit. Assess. 2019, 191, 168. [Google Scholar] [CrossRef]
  11. Liu, J.-S.; Guo, L.-C.; Luo, X.-L.; Chen, F.-R.; Zeng, E.Y. Impact of Anthropogenic Activities on Urban Stream Water Quality: A Case Study in Guangzhou, China. Environ. Sci. Pollut. Res. 2014, 21, 13412–13419. [Google Scholar] [CrossRef] [PubMed] [Green Version]
  12. Sinche, F.; Cabrera, M.; Vaca, L.; Segura, E.; Carrera, P. Determination of the Ecological Water Quality in the Orienco Stream Using Benthic Macroinvertebrates in the Northern Ecuadorian Amazon. Integr. Environ. Assess. Manag. 2022, 1–11. [Google Scholar] [CrossRef] [PubMed]
  13. Gerber, R.; Smit, N.J.; van Vuren, J.H.J.; Ikenaka, Y.; Wepener, V. Biomarkers in Tigerfish (Hydrocynus vittatus) as Indicators of Metal and Organic Pollution in Ecologically Sensitive Subtropical Rivers. Ecotoxicol. Environ. Saf. 2018, 157, 307–317. [Google Scholar] [CrossRef] [PubMed]
  14. Dalzochio, T.; Ressel Simões, L.A.; Santos de Souza, M.; Prado Rodrigues, G.Z.; Petry, I.E.; Andriguetti, N.B.; Herbert Silva, G.J.; Gehlen, G.; Basso da Silva, L. Water Quality Parameters, Biomarkers and Metal Bioaccumulation in Native Fish Captured in the Ilha River, Southern Brazil. Chemosphere 2017, 189, 609–618. [Google Scholar] [CrossRef] [PubMed]
  15. Bradley, P.M.; Journey, C.A.; Berninger, J.P.; Button, D.T.; Clark, J.M.; Corsi, S.R.; DeCicco, L.A.; Hopkins, K.G.; Huffman, B.J.; Nakagaki, N.; et al. Mixed-Chemical Exposure and Predicted Effects Potential in Wadeable Southeastern USA Streams. Sci. Total Environ. 2019, 655, 70–83. [Google Scholar] [CrossRef]
  16. Jeppesen, E.; Nõges, P.; Davidson, T.A.; Haberman, J.; Nõges, T.; Blank, K.; Lauridsen, T.L.; Søndergaard, M.; Sayer, C.; Laugaste, R.; et al. Zooplankton as Indicators in Lakes: A Scientific-Based Plea for Including Zooplankton in the Ecological Quality Assessment of Lakes According to the European Water Framework Directive (WFD). Hydrobiologia 2011, 676, 279–297. [Google Scholar] [CrossRef]
  17. Kaboré, I.; Ouéda, A.; Moog, O.; Meulenbroek, P.; Tampo, L.; Bancé, V.; Melcher, A.H. A Benthic Invertebrates-Based Biotic Index to Assess the Ecological Status of West African Sahel Rivers, Burkina Faso. J. Environ. Manag. 2022, 307, 114503. [Google Scholar] [CrossRef]
  18. Wu, J.; Mao, R.; Li, M.; Xia, J.; Song, J.; Cheng, D.; Sun, H. Assessment of Aquatic Ecological Health Based on Determination of Biological Community Variability of Fish and Macroinvertebrates in the Weihe River Basin, China. J. Environ. Manag. 2020, 267, 110651. [Google Scholar] [CrossRef]
  19. Brack, W.; Aissa, S.A.; Backhaus, T.; Dulio, V.; Escher, B.I.; Faust, M.; Hilscherova, K.; Hollender, J.; Hollert, H.; Müller, C.; et al. Effect-Based Methods Are Key. The European Collaborative Project Solutions Recommends Integrating Effect-Based Methods for Diagnosis and Monitoring of Water Quality. Environ. Sci. Eur. 2019, 31, 10. [Google Scholar] [CrossRef]
  20. Sheng, J.; Tang, W.; Webber, M. Can Interbasin Water Transfer Affect Water Consumption and Pollution? Lessons from China’s South–North Water Transfer Project. Environ. Policy Gov. 2020, 30, 345–358. [Google Scholar] [CrossRef]
  21. Kong, X.; Wang, S.; Liu, B.; Sun, H.; Sheng, Z. Impact of Water Transfer on Interaction between Surface Water and Groundwater in the Lowland Area of North China Plain. Hydrol. Process. 2018, 32, 2044–2057. [Google Scholar] [CrossRef]
  22. Wang, Z.; Wang, Z.; de VRIEND, H.J. Impact of Water Diversion on the Morphological Development of the Lower Yellow River. Int. J. Sediment Res. 2008, 23, 13–27. [Google Scholar] [CrossRef]
  23. Cui, W.-Y.; Guo, S.-Y.; Meng, X.-Z.; Kong, F.-Q. Application of Adapted Benthic Index of Biotic Integrity (B-IBI) for River Ecosystem Health Assessment in Zhanghe River Watershed, China. Pol. J. Ecol. 2019, 66, 407. [Google Scholar] [CrossRef]
  24. Xin, Y.; Liu, X. Coupling Driving Factors of Eco-Environmental Protection and High-Quality Development in the Yellow River Basin. Front. Environ. Sci. 2022, 10, 951218. [Google Scholar] [CrossRef]
  25. Zhou, M.; Wu, S.; Zhang, Z.; Aihemaiti, Y.; Yang, L.; Shao, Y.; Chen, Z.; Jiang, Y.; Jin, C.; Zheng, G. Dilution or Enrichment: The Effects of Flood on Pollutants in Urban Rivers. Environ. Sci. Eur. 2022, 34, 61. [Google Scholar] [CrossRef]
  26. Zhang, G.; Yuan, X.; Wang, K. Biodiversity and Temporal Patterns of Macrozoobenthos in a Coal Mining Subsidence Area in North China. PeerJ 2019, 7, e6456. [Google Scholar] [CrossRef]
  27. Lammer, E.; Kamp, H.G.; Hisgen, V.; Koch, M.; Reinhard, D.; Salinas, E.R.; Wendler, K.; Zok, S.; Braunbeck, T. Development of a flow-through system for the fish embryo toxicity test (FET) with the zebrafish (Danio rerio). Toxicol. Vitr. 2009, 23, 1436–1442. [Google Scholar] [CrossRef]
  28. Beekhuijzen, M.; de Koning, C.; Flores-Guillén, M.-E.; de Vries-Buitenweg, S.; Tobor-Kaplon, M.; van de Waart, B.; Emmen, H. From cutting edge to guideline: A first step in harmonization of the zebrafish embryotoxicity test (ZET) by describing the most optimal test conditions and morphology scoring system. Reprod. Toxicol. 2015, 56, 64–76. [Google Scholar] [CrossRef]
  29. Adam, A.H.B.; de Haan, L.H.J.; Louisse, J.; Rietjens, I.M.C.M.; Kamelia, L. Assessment of the in vitro developmental toxicity of diethylstilbestrol and estradiol in the zebrafish embryotoxicity test. Toxicol. Vitr. 2021, 72, 105088. [Google Scholar] [CrossRef]
  30. Guan, B.; Chen, M.; Elsey-Quirk, T.; Yang, S.; Shang, W.; Li, Y.; Tian, X.; Han, G. Soil seed bank and vegetation differences following channel diversion in the Yellow River Delta. Sci. Total Environ. 2019, 693, 133600. [Google Scholar] [CrossRef]
  31. Li, T.; Zhu, Z.; Shao, Y.; Chen, Z.; Roß-Nickoll, M. Soil seedbank: Importance for revegetation in the water level fluctuation zone of the reservoir area. Sci. Total Environ. 2022, 829, 154686. [Google Scholar] [CrossRef] [PubMed]
  32. Huang, X.; Xu, J.; Liu, B.; Guan, X.; Li, J. Assessment of Aquatic Ecosystem Health with Indices of Biotic Integrity (IBIs) in the Ganjiang River System, China. Water 2022, 14, 278. [Google Scholar] [CrossRef]
  33. Wu, J.; He, Y.; Zhao, Y.; Chen, K.; Cui, Y.; Wang, H. A Simple Index of Lake Ecosystem Health Based on Species-Area Models of Macrobenthos. Int. J. Environ. Res. Public Health 2022, 19, 9678. [Google Scholar] [CrossRef] [PubMed]
  34. Jiang, J.-G. Development of a New Biotic Index to Assess Freshwater Pollution. Environ. Pollut. 2006, 139, 306–317. [Google Scholar] [CrossRef]
  35. Liu, X.-Q.; Gippel, C.J.; Wang, H.-Z.; Leigh, C.; Jiang, X.-H. Assessment of the ecological health of heavily utilized, large lowland rivers: Example of the lower Yellow River, China. Limnology 2017, 18, 17–29. [Google Scholar] [CrossRef]
  36. Rodrigues, P.E.S.; Costa-Schmidt, L.E.; Ott, R.; Rodrigues, E.N.L. Influence of Forest Structure upon the Diversity and Composition of Edaphic Diplopods. J. Insect. Conserv. 2017, 21, 297–306. [Google Scholar] [CrossRef]
  37. Shanbhag, R.R.; Sundararaj, R. Assemblages and Species Diversity of Wood Destroying Termites in Different Land Use Systems in Western Ghat, India. J. For. Res. 2013, 24, 361–364. [Google Scholar] [CrossRef]
  38. Ohgushi, T. Eco-Evolutionary Dynamics of Plant–Herbivore Communities: Incorporating Plant Phenotypic Plasticity. Curr. Opin. Insect Sci. 2016, 14, 40–45. [Google Scholar] [CrossRef]
  39. Huh, M.K.; Joo, W.H.; Seo, J.-Y.; Jang, S.-H.; Choi, B.-K. Community Structure and Diversity across Spatial Scales of Macro-benthos in the Hwang River. J. Environ. Sci. 2013, 22, 1241–1251. [Google Scholar] [CrossRef]
  40. Nestlerode, J.A.; Murrell, M.C.; Hagy, J.D.; Harwell, L.; Lisa, J.A. Bioassessment of a Northwest Florida Estuary Using Benthic Macroinvertebrates. Integr. Environ. Assess. Manag. 2020, 16, 245–256. [Google Scholar] [CrossRef]
  41. Tockner, K.; Stanford, J.A. Riverine Flood Plains: Present State and Future Trends. Envir. Conserv. 2002, 29, 308–330. [Google Scholar] [CrossRef] [Green Version]
  42. Graf, W.; Leitner, P.; Hanetseder, I.; Ittner, L.D.; Dossi, F.; Hauer, C. Ecological Degradation of a Meandering River by Local Channelization Effects: A Case Study in an Austrian Lowland River. Hydrobiologia 2016, 772, 145–160. [Google Scholar] [CrossRef]
  43. Siviglia, A.; Repetto, R.; Zolezzi, G.; Tubino, M. River Bed Evolution Due to Channel Expansion: General Behaviour and Application to a Case Study (Kugart River, Kyrgyz Republic). River Res. Appl. 2008, 24, 1271–1287. [Google Scholar] [CrossRef]
  44. Wesner, J.S.; Swanson, D.L.; Dixon, M.D.; Soluk, D.A.; Quist, D.J.; Yager, L.A.; Warmbold, J.W.; Oddy, E.; Seidel, T.C. Loss of Potential Aquatic-Terrestrial Subsidies Along the Missouri River Floodplain. Ecosystems 2020, 23, 111–123. [Google Scholar] [CrossRef]
  45. Kalueff, A.V.; Echevarria, D.J.; Homechaudhuri, S.; Stewart, A.M.; Collier, A.D.; Kaluyeva, A.A.; Li, S.; Liu, Y.; Chen, P.; Wang, J.; et al. Zebrafish neurobehavioral phenomics for aquatic neuropharmacology and toxicology research. Aquat. Toxicol. 2016, 170, 297–309. [Google Scholar] [CrossRef]
  46. Sebastiaan van Maren, D.; Yang, M.; Wang, Z.B. Predicting the Morphodynamic Response of Silt-Laden Rivers to Water and Sediment Release from Reservoirs: Lower Yellow River, China. J. Hydraul. Eng. 2011, 137, 90–99. [Google Scholar] [CrossRef]
  47. Wang, H.; Wu, X.; Bi, N.; Li, S.; Yuan, P.; Wang, A.; Syvitski, J.P.M.; Saito, Y.; Yang, Z.; Liu, S.; et al. Impacts of the dam-orientated water-sediment regulation scheme on the lower reaches and delta of the Yellow River (Huanghe): A review. Glob. Planet Chang. 2017, 157, 93–113. [Google Scholar] [CrossRef]
  48. Ostra, M.; Beklova, M.; Stoupalova, M.; Ostry, M. Ecotoxicity Evaluation In Municipal And Food Industry Wastewaters. Fresen. Environ. Bull. 2009, 18, 1674–1680. [Google Scholar]
  49. Stamenković, M.; Steinwall, E.; Wulff, A. Cultivation and Photophysiological Characteristics of Desmids in Moderately Saline Aquaculture Wastewater. J. Phycol. 2021, 57, 926–941. [Google Scholar] [CrossRef]
  50. Cao, S.T.; Tran, H.P.; Le, H.T.T.; Bui, H.P.K.; Nguyen, G.T.H.; Nguyen, L.T.; Nguyen, B.T.; Luong, A.D. Impacts of Effluent from Different Livestock Farm Types (Pig, Cow, and Poultry) on Surrounding Water Quality: A Comprehensive Assessment Using Individual Parameter Evaluation Method and Water Quality Indices. Environ. Sci. Pollut. Res. 2021, 28, 50302–50315. [Google Scholar] [CrossRef]
  51. Tan, J.; Liu, L.; Li, F.; Chen, Z.; Chen, G.Y.; Fang, F.; Guo, J.; He, M.; Zhou, X. Screening of Endocrine Disrupting Potential of Surface Waters via an Affinity-Based Biosensor in a Rural Community in the Yellow River Basin, China. Environ. Sci. Technol. 2022, 56, 14350–14360. [Google Scholar] [CrossRef] [PubMed]
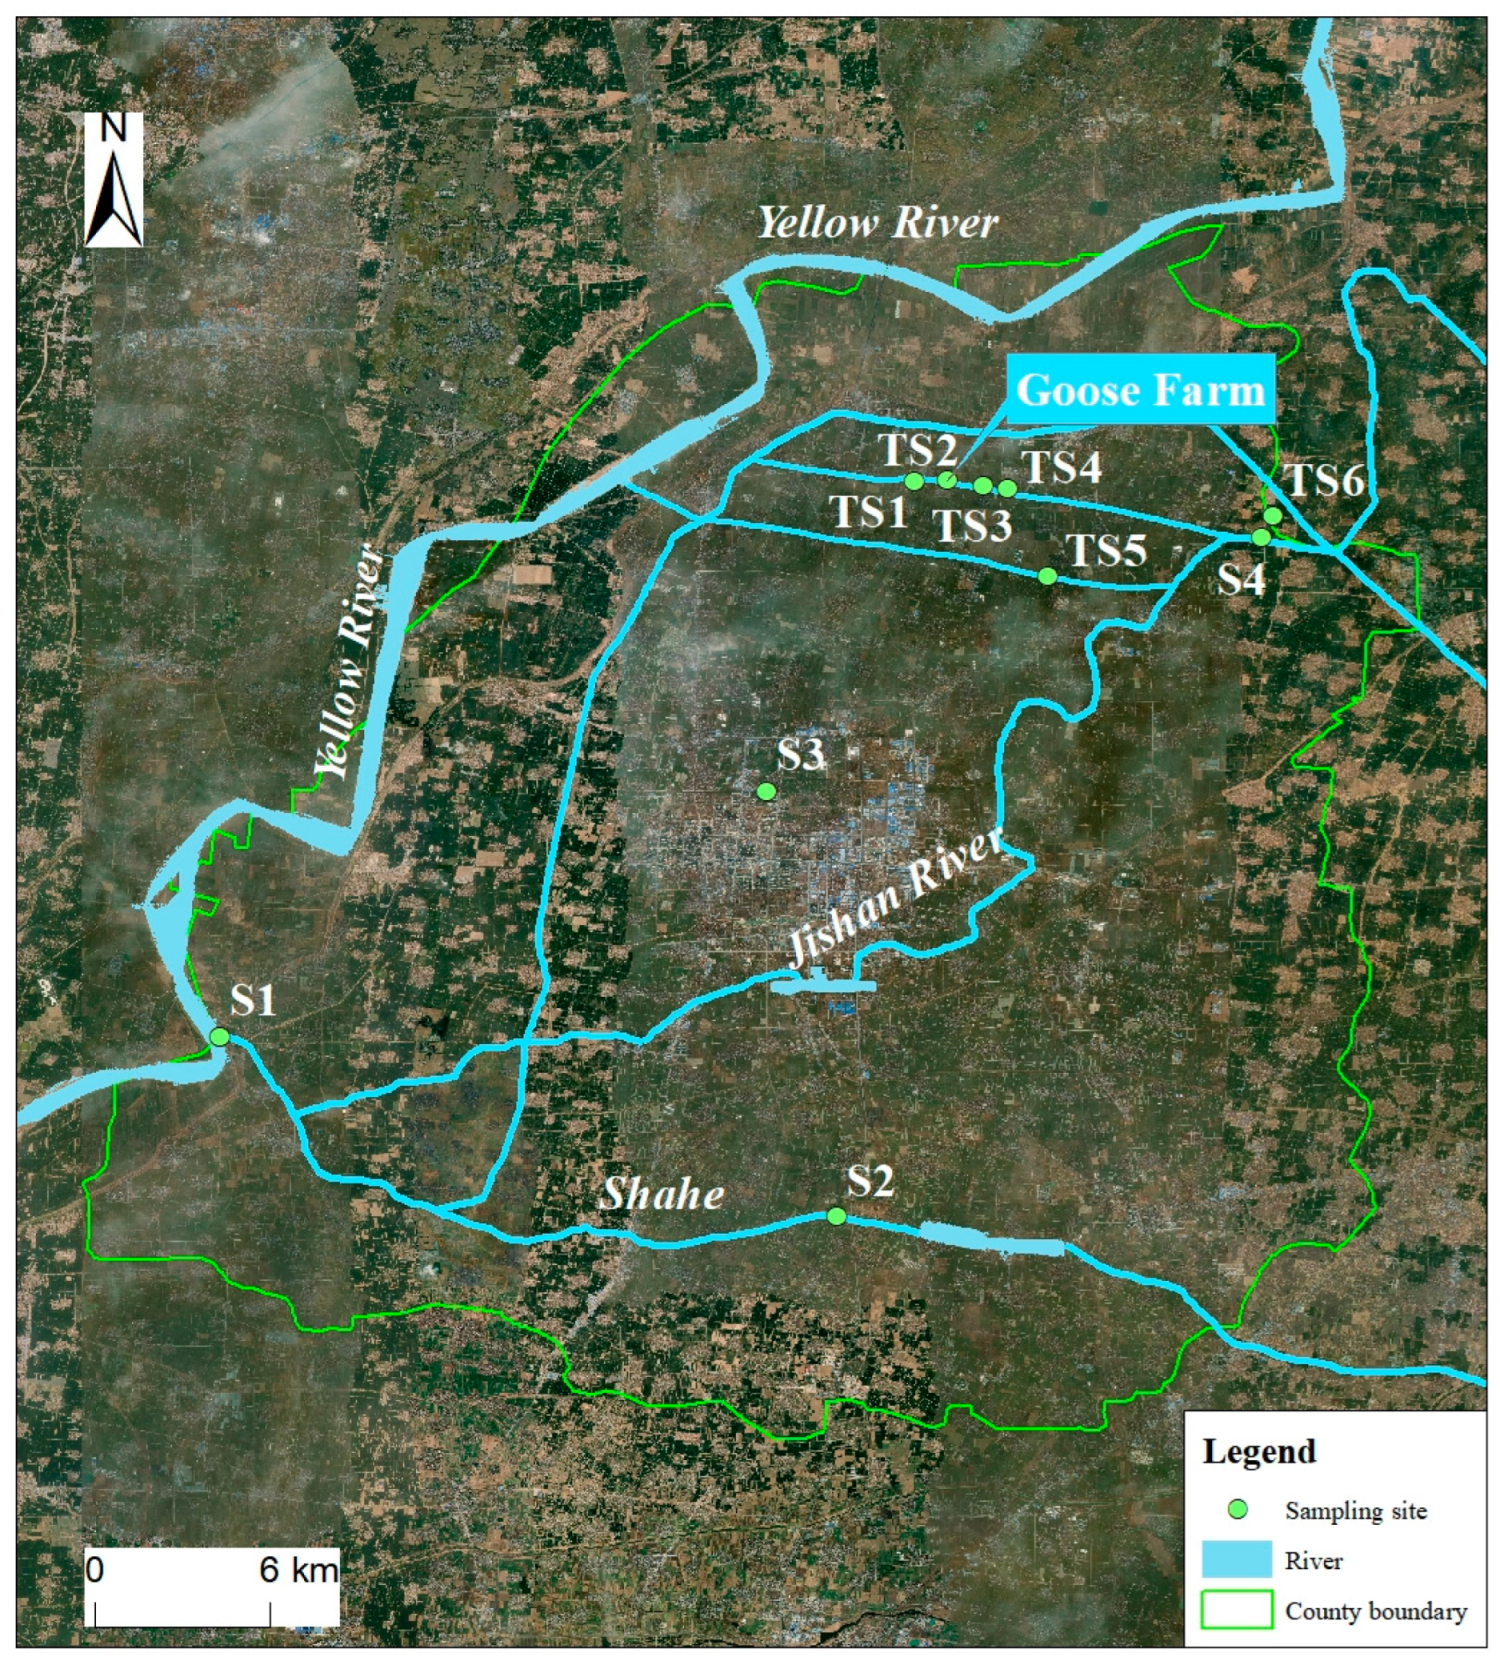
Figure 1. Location of the study area and distribution of sampling sites in Juancheng of Shandong, China. Among them, S1–4 (site 1–4) are located in the main stream, and TS1–6 are located near the goose farm in the tributary of the Jishan River.
Sustainability 15 06423 g001
Figure 2. Temperature (A), Pressure (B), pH (C), dissolved oxygen (D), specific conductance (E), oxidation-reduction potential (F), total nitrogen (G) and total phosphorus (H) of raw water in the main stream of the Jishan River of the Juancheng County, China. The letters above each column are from the one-way ANOVA, and different letters indicate significant differences between data at the p < 0.05 level.
Sustainability 15 06423 g002
Figure 3. Richness index (A), Shannon Winner index (B), Simpson index (C) and Pielou evenness index (D) in S1, S2, S3 and S4 in Juancheng, China. The letters above each column are from the one-way ANOVA, and different letters indicate significant differences between data at the p < 0.05 level.
Sustainability 15 06423 g003
Figure 4. Zebrafish embryos toxic effects of raw water in Juancheng, China (A). Hatchability of zebrafish embryos in sediment samples of main stream, (B) Tributary, (C) toxic effects of zebrafish embryos in main stream (D) and Tributary (E).
Sustainability 15 06423 g004
Figure 5. Dose–response curve and LC50 values of S3 (A), S4 (B), TS2-sediment (C), TS2-soil (D).
Sustainability 15 06423 g005
Figure 6. Correlation analysis between physicochemical factors and toxic effects on zebrafish embryos (A) and physicochemical factors and species diversity index (B). (HR: hatching rate, TR: Teratogenic rate, LR: Lethal rate, RI: Richness index, SWI: Shannon Winner index, SI: Simpson index and PEI: Pielou evenness index).
Sustainability 15 06423 g006
Figure 7. Principal component analysis (PCA) of physicochemical factors, toxic effects in fish and species diversity index in the Juancheng County, China. The red triangles indicate the physicochemical indicators of the water samples, the green solid circles represent the benthic biodiversity index, and the blue pentagrams represent the observed indicators of the zebrafish embryo experiment. The factor loadings of PCA-axes 1 and 2 are shown and explained 86.9% of the total variation. The angles between vectors indicate the degree of independence of individual variables.
Sustainability 15 06423 g007
Table 1. Number of benthic individuals (N) and biomass (B, unit: g/m2) in the main stream of the Jishan River of the Juancheng County, China.
ClassificationLatin NameS1S2S3S4
NBNBNBNB
AnnelidLimnodrilus hoffmeisteri10.0001200.020810.0001
Branchiura sowerbyi 10.0001
Tubifex sinicus 20.0812
MolluscPlectotropis 1027.936
Gyraulus compressus 70.0377
Physa acuta 10.0208
Parafossarulus striatulus 20.4716
ArthodpodMacrobrachium nipponense 10.0317
Exopalaemon modestus10.2185
Chironomus sp.10.0001950.75971490.7058
Polypedilum sp. 60.000310.0058
Dicrotendipes sp. 10.0001
Tanytarsus sp. 10.0001
Cryptotendipes sp. 250.0006
Cricotopus sp. 10.000110.0001
Propsilocerus sp.30.0006260.059510.0002
Orthocladius sp.
Cryptochironomus sp. 10.0001
Clinotanypus sp. 50.0034
Tanypus sp. 120.0249
Procladius sp. 20.0041
Total60.219322929.39421540.732880.0378
Disclaimer/Publisher’s Note: The statements, opinions and data contained in all publications are solely those of the individual author(s) and contributor(s) and not of MDPI and/or the editor(s). MDPI and/or the editor(s) disclaim responsibility for any injury to people or property resulting from any ideas, methods, instructions or products referred to in the content.