Abstract
Modern city brand trends aim to position cities according to the interests of their stakeholders; in the case of university students, it is necessary to identify the factors that determine their choice of a university city. Consequently, this study applied an exploratory model that allowed researchers to validate the factors and characteristics that influence this process in the major Colombian university cities. The partial least square statistical analysis methodology was used to collect 585 surveys from students from different cities in Colombia. The study found that the factors determining cities’ cognitive or affective image directly or indirectly influenced the university city brand. This paper’s contributions lie in exploring university city branding from students’ perceptions.
1. Introduction
The concept of a city brand was born in the 19th century to market urban places and evolved into a more complex modern concept involving disciplines such as marketing, architecture, urban planning, and tourism, among others [1,2,3,4]. A city brand aims to attract and retain visitors by developing a local identity that translates into offering distinctive benefits [5]. This process is achieved in the long term and is linked to the city’s public policies [6], with the city brand being a key factor for the attraction and retention of interest groups (companies–citizens), since it allows them to promote and position the city as ideal for these groups to establish themselves in [7].
From cities, branding has been developed and applied to the city brand with the aim of achieving an image positioning, more precisely of a corporate brand, seeking to make the city attractive to its target audiences (citizens, visitors, and companies) [8,9]. According to Oguztimur et al. [7], four lines of research have been developed in city branding: the first is the concept, processes, and measurement of the city brand; the second is the city brand strategy; the third is related to brand culture and tourism; and the fourth to urban planning and the city.
1.1. Cities and Knowledge
In the knowledge society, the university is the centre of creativity, strengthening its role as a leader in social, economic, and cultural development [10]. Universities could be part of the city brand since their functions and benefits are positive factors for the development and sustainability of cities. Indeed, they are one of the most decisive elements of the city’s university brand image. However, the relations between universities and cities vary from one case to another. In some cases, there are strong links between the citizen governments and the university centres, especially when there is a direct dependency given the public nature of many universities. Likewise, the university generates high social impact in education, employment, economic impact, and support to industry, among others [11,12].
The concept of the city of knowledge brand then arises, which focuses on offering education, research, and innovation services, with the university being the central actor in achieving this position [12].
Some authors categorise cities of knowledge depending on the type: some cities focus on technological-innovative areas (cities that generate centres of industrial innovation, such as Detroit, USA, with Fordism), whilst others are focused on the cultural-intellectual (cities focused on the so-called soft sciences, art and culture, classical Athens), the cultural-technological (cities that combine both cultural and technological developments, such as Silicon Valley in the USA), and technological-organisational cities (cities that generate innovations that solve problems derived from the large-scale urban life such as infrastructure, transport and housing, such as the city of Barcelona in Spain) [13].
The type of university (private or public) and its impact on the city becomes important. Likewise, the geolocation of these and their proximity to each other can be strategic factors to enhance the effect and importance of cities’ interests. For example, cities in which several universities are concentrated, and cities that integrate joint research and innovation programmes with other actors in the city take a step towards positioning their identity and image as a city of knowledge [14,15]. This type of impact can even be generated in small cities or cities with few universities [16].
The characterisation of a city of knowledge has always been constituted by the central participation of the universities, being a relationship of mutual dependence. In recent centuries, the cities have evolved with the universities in the urban, social, cultural development, scientific, and industrial areas. This is a challenge for cities of the future as this synergy is in danger of remaining only in symbolism or within a “status”. Universities are fundamental in developing knowledge cities [17], so the city of knowledge will be one in which knowledge, creativity, and innovation reach their full maturity, which requires concentrating enough diversity, stability and image projection [18].
1.2. University City Brand Research
There is little research on the university city brand, and the available studies are mostly case studies of cities that have positioned themselves as cities of knowledge focused especially on their universities and the measurement of their impact on economic, demographic, social, cultural and cultural and scientific indicators.
In a study of three cities by Popescu [12] that aligned their brand image with knowledge, the results revealed that investments in education and research provide an image of how a city values its people and the degree to which public and private actors invest in the development of human resources. Likewise, it demonstrated that universities are central actors in the knowledge regions and, in most cases, coordinate their efforts with the city’s brand strategy. The strategies of the leading universities studied proved to be consistent with the brand strategies of the cities in which they are located.
Moreover, the branding strategies of the cities emphasise to a great extent the role of higher education, with the prestige of the universities being the guarantor of this positioning of the city brand. This factor is aligned with the theoretical developments of branding in which awareness and brand loyalty results from a long-term relationship between universities and influence groups [19,20].
The city of knowledge brand was also analysed regarding the factors that attract and maintain interest groups [21], firstly highlighting that the cities and universities that offered the tools and infrastructure of services, habitat, and urban planning focused on the needs of scientists, students, businessmen, and others were successful in their endeavour to attract potential residents. For example, New Mexico has the highest number of physicists per capita in the United States, thanks to the laboratories it offers. On the other hand, Boston has a strong base of basic science that has attracted companies and institutes that have created wealth and attracted more top scientists. The case of San Francisco is similar, offering an attractive climate (culture of adventurers, investments and laws that favour creative workers). This has allowed San Francisco to develop into one of the cities of knowledge and information technologies. Although these cases of university or knowledge brand cities are evident, no studies were found that empirically defined the perception by the various interest groups of the university city brand. Instead, previous studies only developed the identification of the important factors for the choice of universities and destinations, including public services, specific government policies in science and technology, image, prestige, urban development, and characterisation of the city’s groups of influence [22,23].
There is a wide field of research around the cities of knowledge-universities. Thus, this study posed the following question: How can the perception of the city university brand be measured? For the development of this question, this paper initially starts with the construction of a measurement tool based on previous empirical studies related to student perceptions regarding what motivates them to choose a university or a university city, as well as the index of university cities for Colombia, which will be contrasted with the empirical results applied to the main cities that this index classifies as university cities. Next, the development of the field work, the analysis of the data, the discussion of the results and the final conclusions are presented.
1.3. Aspects That Influence the Choice of a University
It can be said that the target audiences of the highest interest in the city of knowledge brand are students, especially at secondary and higher education levels. They are the ones to whom the offers related to education, their first job, research, innovation, and entrepreneurship are directed.
For this reason, some studies have analysed and attempted to ascertain the main aspects that influence the choice of an educational centre for young applicants in order for the public-private educational sector to properly manage the offer and achievement in education [24,25,26,27,28,29]. This decision-making process is complex [24]. Indeed, it is remarkably similar to the classic purchase decision behaviour, in which there are three stages: the first is the “awareness stage”, where the student generates the desire to carry out their studies; the second where the “information search” begins by analysing the different alternatives; and thirdly, the final phase of the “decision” where the student finally chooses where to carry out their studies.
Therefore, several characteristics of the place where the studies are carried out are important for the student when deciding where to study; places that have cultural and geographical proximity, for example, will be more attractive [30].
There has been limited academic research regarding the influence of the specific positioning of the university or knowledge city brand. However, it has been proven that the positioning of the destination has influenced the choice of a country or city as a place for studying and pursuing the life project of young students. For instance, factors such as the reputation of the place, quality of life, and infrastructure, among others, play a significant role (see Table 1).

Table 1.
Reasons for choosing a place to carry out university studies.
1.4. Measurement Index of the Concept of Colombian University Cities-ICU
The network of higher education institutions called: “How We Are Going” has built the measurement index of university cities (ICU), which aims to measure and categorise the cities of Colombia as university cities. This index has 4 dimensions and a total of 19 variables built with data from the National Ministry of Education and other institutions specialised in education in this country. Information is taken from the QS international ranking, which collects information on prices and other factors in each city periodically (See Table 2).
Table 2.
Index of Colombian university cities—ICU.
The general results of the ICU positioned Manizales, Medellín, and Pereira as the leading Colombian cities in 2019, followed by a group of four cities that achieved around 60 points in the index: Barranquilla, Bucaramanga, Cali, and Bogotá. However, the results by dimension vary in all cases; therefore, we cannot conclude that any of the best-valued cities are the best across all the measured aspects. For example, in the cost of living dimension, the city of Quibdó has the highest score but is the last city across the total scores (See Table 3).
Table 3.
ICU results by the main cities in Colombia as of 2019.
Considering the results of the ICU index, similar perceptions should be had of students who are choosing where to carry out their university studies or who have just chosen a city to carry out their university studies with respect to the ICU index. If applicants were asked directly, Colombian university students would be expected to evaluate according to their perceptions in the same way as the ICU index.
Empirical studies on students’ perceptions of destinations for university studies have concluded that their perceptions based on the information and previous experiences with destinations generate an image and give each place a personality [29]. Therefore, it could also be assumed that the students, based on the information they seek and receive from the cities, will generate both a cognitive and an affective image and may or may not perceive a destination as a university city brand.
Completing the last and most important assumption, the cognitive and affective image and the personality of the city influence students’ choice of where to conduct studies [29].
Therefore, the following hypotheses are proposed (Figure 1):
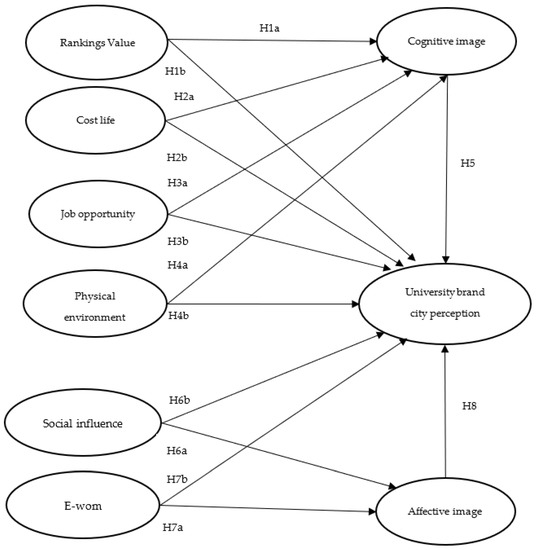
Figure 1.
Proposed model.
H1a.
The perception of rankings value influences the cognitive image of the university city brand.
H1b.
The perception of rankings value influences the perception of the university city brand.
H2a.
The perception of the cost of living influences the cognitive image of a city with a university brand.
H2b.
The perception of the cost of living influences the perception of a university city brand.
H3a.
The perception of job opportunities influences the cognitive image of the university city brand.
H3b.
The perception of job opportunity influences the perception of a university city brand.
H4a.
The perception of the physical environment influences the cognitive image of the university city brand.
H4b.
The perception of the physical environment and facilities influences the perception of a university city brand.
H5.
The cognitive image of a university city influences the perception of a university city brand.
H6a.
Social influence influences the affective image of the university city.
H6b.
Social influence influences the perception of the university city brand.
H7a.
E-wom influences the affective image of the university city brand.
H7b.
E-wom influences the perception of the university city brand.
H8.
The affective image of a university city brand influences the perception of the university city brand.
2. Materials and Methods
Given its objective, this study was structured according to an exploratory approach to conform and test a model that would allow researchers to empirically explain a phenomenon that has not yet been widely verified. To achieve this, the methodology used was modelling using the structural equations method (SEM), given its benefits regarding the verification of cause-effect relationships between constructs for the explanation of behavioural models, which is widely accepted in marketing studies. The method that best allows working with exploratory or rarely studied models is partial least square (PLS) [30]. Therefore, the data collected was analysed following the main analysis tests for the measurement tool and the proposed hypothesis model.
Measurement Tool
The measurement tool was built through the following process. First, a search for empirical studies was carried out through the in-depth content analysis of scientific publications (Scopus and Web of Science databases) investigating research on decision-making in young people regarding where to carry out their university studies, without taking into account bibliometric document filter processes given the scarce development of this type of research. From this first phase, we discovered that the authors found different constructs to explain the reasoning behind deciding on a place to conduct university studies. These were tested in different contexts, such as choice of university, choice of course abroad, and choice of city to study. The constructs were grouped into a total of 10 and presented with their respective measurement indicators in Figure 1.
Next, the measurement tool was constructed through a psychometric test process that required the translation and retranslation of the items from English to Spanish and then a pre-test with a group of five marketing researchers who verified the semantic and comprehension aspects of the questions in Spanish. They also removed or added words that would facilitate clarity and precision in the measurement (all items were measured using Likert scales with values between 1–7 to have a better level of contrast).
Finally, a pilot test was carried out with 50 university students in order to verify whether there were any comprehension problems with the items. Statistical tests were not carried out as the constructs, and their elements have already been tested in previous empirical studies with high rigour. Additionally, in the analysis phase of this study, tests corresponding to the validity of the measurement tool used were carried out. The final questionnaire was distributed digitally among various universities in the seven selected cities.
3. Results
3.1. Sample
The sample was defined by a quota method based on the first seven cities in the ranking of Colombian university cities. A minimum value of 50 samples per city was set to have a minimum sample of 350 responses, an acceptable value for applying the PLS methodology. The final result was a total of 585 valid answers (excluding missing values and incomplete answers). The characterisation of the sample revealed that 45% were men and 55% were women, 83% were young people between 16 and 25 years old, 15% were between 26 and 35 years old, and 2% were over 35 years old. Meanwhile, 87% were students studying professional university programmes, and 13% were in postgraduate courses. Subsamples by the city are detailed in Table 4.
Table 4.
Sample.
3.2. Reliability and Validity of the Measurement Tool
The results of the reliability tests (see Table 5) show that the individual reliability of each item is supported and all the tests are met: (loads > 0.7—significant difference: p-value < 0.05), simple reliability (Cronbach’s Alpha > 0.7) and composite reliability (IFC > 0.7). The values of the multicollinearity test (VIF < 3.3) confirm that the data comply with the measurement behaviour of a high level of reliability [32].
Table 5.
Resume test of reliability and validity of the measurement tool.
Regarding the validity tests, the convergent validity test (see Table 2; AVE > 0.7) and the discriminant validity test (see Table 6 and Table 7), the Fornell–Larcker criterium test [33,34], ascertained that the indicators measure the constructs associated with them and do not measure others, since the values below the diagonal of the matrix are lower than the values of the construct itself. The Heterotrait–Monotrait Ratio (HTMT) test [33] did not present values higher than 8.0, reaffirming that the convergent validity is adequate.
Table 6.
Fornell–Larcker criterium.
Table 7.
Heterotrait–Monotrait Ratio (HTMT).
3.3. Prediction and Validity of the Empirical Model
The value (Table 8) for the city brand university explained variable was greater than 0.6, so the predictive relevance of the model was validated [35].
Table 8.
Values R square.
Similarly, when performing the validation test of the model hypotheses, the bootstrapping process was carried out with an N > 10,000 subsamples to have greater verification rigour [34] (Table 6). The results supported the hypothesis: H1a (rankings value -> cognitive image, β = 0.214*); H1b (rankings value -> city brand university, β = 0.200*); H3a (job opportunity -> cognitive image, β = 0.278*); H4a (physical environment -> cognitive image, β = 0.166*); H5 (cognitive image -> city brand university, β = 0.269*); H6a (social influence -> affective image, β = 0.346*); H7a (E-wom -> affective image, β= 0.214*); H7b (E-wom -> city brand university, β = 0.137*); and H8: affective image -> city brand university, β = 0.424*). Hypotheses that were not supported were H2a (cost life -> cognitive image, β = 0.058); H2b (cost life -> city brand university, β = −0.015); H3b (job opportunity -> city brand university, β = 0.040); H4b (physical environment -> city brand university, β = −0.010); and H6b (social influence -> city brand university, β = −0.056) (Table 9) (Figure 2). The VIF values < 0.3 reject multicollinearity problems between the constructs (Table 10).
Table 9.
Test hypotheses.
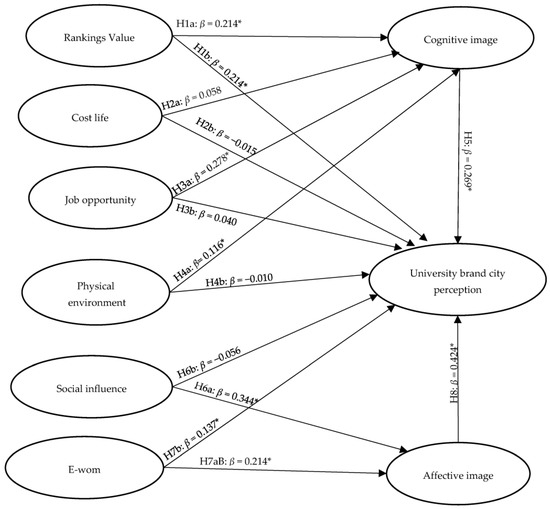
Figure 2.
Structural model.* Significant difference: p-value < 0.05.
Table 10.
VIF values of the structural model.
However, the results of the total effects show that the job opportunity construct exerts a positive effect on the perception of the university city brand of β = 0.114, which indicates there is a partial mediating effect (see Table 11 and Table 12) exerted by the cognitive image regarding the perception of the city brand. The cities that offer high job opportunities are also important for students in their perception of the university city brand. The same is true of social influence, which was not supported. After analysing its partial and total effect, it generates a positive influence β = 0.090, which, although it is less than 1, can be translated into the fact that the mediating effect of the affective image generates a positive effect of social influence on the perception of the university city brand.
Table 11.
Specific indirect effects.
Table 12.
Effect’s totals.
Therefore, the results find a high causal relationship between the perception of the cognitive image and the affective image that a student has of a city on the perception of the university city brand, as well as all the independent constructs: rankings value, job opportunity, and physical environment, excluding the cost of living. These are influential in a mediated or direct way on the perception of the university city brand.
3.4. Unobserved Heterogeneity Test—Measure Invariance of Composite Models
Given the nature of the sample in which data was taken from different cities in Colombia, which shows heterogeneity by the geographical area of origin of the samples, the sample should be considered to perform the unobserved heterogeneity test [34]. The test is to verify if there are differences between the samples of each city. Subsequently, there may be non-homogeneous behaviour from the data, which may lead to incorrect generalised results and, therefore, the grouped invalidity of the data [34].
The unobserved heterogeneity test means that it is possible to find the different behaviours between these groups, if any. In the case of this study, it makes it possible to analyse whether there is a different behaviour for each city (city number 1 in the ranking was chosen and contrasted with three other cities).
There are several methodologies to evaluate invariance for covariance-based SEM (CB-SEM), the most frequently used being multigroup confirmatory factor analysis. However, for PLS-SEM models, the measurement invariance of composite models (MICOM) procedure has been developed [34,36]. This test consists of the following steps: (1) the configuration invariance is determined, (2) the compound invariance is determined, and (3) the equality of means and variances of the compounds are identified. It is mandatory to confirm each invariance to determine the partial invariance (of configuration and composite) or the total (of configuration, composite, and equality of means and variances between groups). Finally, the verification of the total or partial invariance allows the performance of the multigroup analysis to determine the possible differences between the path coefficients. If the invariance is not verified, each model must be analysed separately, and the possible differences in the path coefficient results must be compared.
The measurement tool and the treatment of the data guaranteed that the same indicators and the same scales were used in all the groups. Similarly, the coding and screening of the final data were treated similarly. Finally, the validity tests of the indicators complied with the recommended quality standards and tests for the reliability of the tool (Table 5). Therefore, the configuration invariance is satisfied.
Next, the invariance of the compound was analysed, establishing if the scores of the compounds in all the groups were the same. This is achieved by examining the original correlations between the first group (city 1) and each of the other groups (the following six cities) using the following process: (1) PLS nomograms were estimated for each group to obtain the scores of the compounds of the groups (number of observations per group and total). (2) The correlations between the scores of the compounds of the groups were calculated. (3) A random permutation was carried out (with a minimum of 1000 permutations). (4) For each permutation, the calculations of the corrections between the scores of the compounds were made, comparing the first group with respect to each of the other groups. (5) A hypothesis test was carried out, classifying the results of the correlations of the permutations in descending order with a cut-off value of 95%. The hypothesis or invariance of the model is accepted when the value is significantly different from 1 with a level p < 0.05.
Finally, the total invariance was verified through the test of equality of means and variances of the compounds by determining the logarithm of the ratio of the variance of the scores of the compounds for the groups. If the logarithm of this variance is not statistically different from 0, it is concluded that the variances are equal in all groups; therefore, the total invariance can be verified [34] (Table A1, Table A2 and Table A3).
3.5. Differences between Groups–Analysis Based on Permutations–Parametric Test–t-Test Welch–Satterhwaite–PLS-MGA
We chose to only make comparisons between pairs of cities to explore the possible differences in the model results. As a result, the tests were applied to analyse two groups, i.e., applying them to the first city in the ranking of university cities, Manizales, and comparing it with Medellín. It was then compared with Pereira and finally with Bogota. The multigroup tests resulting from the permutations, including the parametric test and the t-test Welch–Satterhwaite, are shown. In addition, the non-parametric PLS-MGA approach was applied, which compares each estimate made in a bootstrapping procedure [34]. The Welch–Satterthwaite parametric test confirms no significant differences between the groups (Table A4, Table A5, Table A6, Table A7, Table A8, Table A9, Table A10, Table A11 and Table A12).
These results show that the model fits very similarly in all cities and, therefore, it can be inferred that students behave in the same way with respect to the same important constructs when choosing a city in which to carry out their studies, as well as their perception of the university town.
4. Discussion
The objective of this paper was to explore an empirical model that would determine what factors generate university students’ perception of the university city brand. A model was formed that included the main constructs developed to date of student behaviour around their choice of place for their university studies and the positioning of their perception of the city.
A model was built that started from six independent constructs that had been tested in previous empirical studies as incidents in the choice of a centre, place, or country to carry out university studies. However, these had not yet been explored as determining elements of students’ image perception. Consequently, the cognitive image, the affective image, and the image of the university city brand were considered dependent constructs.
The results show that the cognitive image that a student generates of a city is influenced by their perception of the quality rankings on the offers of university education that the city offers, followed by the international rankings of university quality (e.g., ARWU, CWUR, QS and others). This is in addition to students’ evaluation of universities and the academic programmes and degree prestige that the universities have. The rankings’ quality significantly affects a student’s perception of a city in their election process, which could mean that those cities that appear in the first positions in educational rankings will have more positioning as a university city.
Regarding the cost of living, the results were insignificant in their effect on the cognitive image or the perception of the university city brand. This element is complex and cannot be excluded from future analyses, given that the cost generated by undertaking university study includes maintenance, housing, transportation, school supplies, complementary courses, and enrollment. In the Colombian case, students may perceive cities to be very similar, meaning they are not seen as a determining factor.
Job opportunities were validated as a factor that influences the cognitive image of a city, although it was not directly for the perception of a branded university city. This result shows that students positively perceive cities with high employment opportunities as places to live. As a result, this would, to a certain extent, motivate their choice of a city as a place in which to carry out their university studies. Furthermore, the non-validity of the direct influence could be because students, when they potentially choose a city in which to study, think in the short term since many will only dedicate themselves to studying full time for several years and do not even think about the future working market.
For its part, the physical environment factor was significant in its impact on the cognitive image of the city, although not directly on the perception of the university city brand and not mediated by its effect on the cognitive image. The result may be because it is a broad factor that the student perceives in a complex way since it refers to the city’s infrastructure and means of transportation, among many other elements that students may not directly associate with university campuses. However, as a great result, this study shows that the perception of a positive cognitive image regarding a city positively affects the perception of the university city brand, even being decisive.
Social influence is another significant factor in its incidence for forming the positive affective image of a city. However, although it was not directly significant with respect to the university city brand, the mediation analyses establish that it has a positive influence through the cognitive image on the perception of the university city. This result is interesting because students form feelings and emotions towards cities from their families and close nuclei. This factor may therefore be decisive for students, potentially even the vast majority, to perceive their own hometowns as university cities.
More influentially, this study found that the e-wom is decisive in the perception of both the affective image of a city and the perception of the city university brand. This demonstrates the power of digital information related to comments, experiences, evaluations, suggestions and other sources of e-wom that the internet openly provides students [35]. That could be the greatest consultation they use when deciding on a university.
Finally, this study also showed that affective image positively influences the perception of a university city. This result shows that students who have an emotional image towards a city will consider it an optimal city to carry out their university studies.
5. Conclusions
The theoretical contributions of this study are valuable, given that this study is one of the few that has analysed students’ perceptions of a city and whether they consider it a university city. Indeed, most studies in this line of research have presented case analyses or qualitative studies that did not test constructs only analysed as a university choice. Consequently, this study provides a new vision around the decision-making of the university centre as something more aligned with city marketing, demonstrating that students perhaps value branded cities more as the initial factor for choosing a university study centre and not the other way around. However, this is not directly analysed in this study.
Considering the aforementioned findings, this study explored the possible constructs of greatest importance in choosing a university city. For example, the ranking of the university cities determines whether a city is categorised as a university city brand. Therefore, another great contribution of this article has been to verify that this position is due to the cognitive image and the affective image that a student has of a city.
Moreover, the results of this study, applying the unobserved heterogeneity and measurement invariance tests, revealed that the data behaved similarly in all the cities. Therefore, in an exploratory way, this behaviour could be extrapolated to decision making in general for the election of a city university by students.
The practical and managerial contributions of this study offer valuable information so that city governments take the key elements for the construction of policies and actions focused on strengthening the factors that interest students. This will generate the positioning of both cognitive and affective images, the two central elements for the good positioning of a university city brand, which could differentiate cities to retain and attract university students in the city educational ecosystem.
On the other hand, the measurement tool that was built and adequately tested for its validity and measurement can be used by mayors of cities interested in measuring the positioning of the city brand so that they can analyse these perceptions within their interest group (students).
This study raises the need to generate strategies between government entities of cities and universities to jointly plan and manage the positioning of the university city brand, since a correlation is evidenced between the choice of the university based on the image of the city that prospective students have.
This study’s limitations lie in exploring a new empirical model, which requires it to be tested in other cities to evaluate its behaviour. However, as demonstrated in the unobserved heterogeneity and measurement invariance tests, it possibly behaves similarly. Therefore, confirmatory analyses of the model in other cities are needed. On the other hand, other variables such as environment and educational facilities that may indicate the perception of a city with a university brand may have been left out of the model. Consequently, we suggest that future studies include them if their importance is evident.
Finally, this study contributes to developing the research line in city branding, which is becoming increasingly important for modern and sustainable cities.
Author Contributions
Conceptualisation, E.J.D.O. and J.A.S.-T.; methodology, E.J.D.O. and J.A.S.-T.; software, E.J.D.O. and J.A.S.-T.; validation, E.J.D.O. and J.A.S.-T.; formal analysis E.J.D.O. and J.A.S.-T.; investigation E.J.D.O. and J.A.S.-T.; resources, E.J.D.O. and J.A.S.-T.; data curation, E.J.D.O. and J.A.S.-T.; writing—original draft preparation, E.J.D.O. and J.A.S.-T.; writing—review and editing, E.J.D.O. and J.A.S.-T.; visualisation, E.J.D.O. and J.A.S.-T.; supervision E.J.D.O. and J.A.S.-T.; project administration, E.J.D.O. and J.A.S.-T.; funding acquisition, E.J.D.O. and J.A.S.-T. All authors have read and agreed to the published version of the manuscript.
Funding
This research did not receive any specific grant from funding agencies in the public, commercial, or not-for-profit sectors.
Institutional Review Board Statement
The study was conducted in accordance with the Declaration of Helsinki and approved by the Institutional Review Board.
Informed Consent Statement
Informed consent was obtained from all subjects involved in the study.
Data Availability Statement
Data are unavailable due to privacy or ethical restrictions.
Conflicts of Interest
The authors declare no conflict of interest.
Appendix A
Table A1.
MICON (Manizales City—Medellin city).
Table A1.
MICON (Manizales City—Medellin city).
| Composite | Correlation | 5% Quartile of the Empirical Distribution of c | p-Value | Is Invariance Proven? |
|---|---|---|---|---|
| Affective image | 1.000 | 1.000 | 0.445 | Yes |
| City brand university | 1.000 | 1.000 | 0.619 | Yes |
| Cognitive image | 1.000 | 0.998 | 0.937 | Yes |
| Cost life | 0.999 | 0.997 | 0.189 | Yes |
| E-wom | 0.997 | 0.988 | 0.394 | Yes |
| Job opportunity | 1.000 | 0.996 | 0.714 | Yes |
| Physical environment | 1.000 | 0.996 | 0.670 | Yes |
| Rankings value | 0.996 | 0.989 | 0.324 | Yes |
| Social influence | 0.991 | 0.973 | 0.343 | Yes |
| Composite | Composite Mean Difference (=0) | 95% confidence interval | p-value | Equality of means? |
| Affective image | −0.033 | (−0.347; 0.282) | 0.667 | Yes |
| City brand university | −0.262 | (−0.327; 0.307) | 0.614 | Yes |
| Cognitive image | −0.458 | (−0.329; 0.289) | 0.889 | Not |
| Cost life | −0.125 | (−0.314; 0.303) | 0.464 | Yes |
| E-wom | −0.311 | (−0.330; 0.310) | 0.805 | Yes |
| Job opportunity | −0.289 | (−0.341; 0.294) | 0.348 | Yes |
| Physical environment | −0.147 | (−0.337; 0.307) | 0.635 | Yes |
| Rankings value | −0.266 | (−0.323; 0.304) | 0.188 | Yes |
| Social influence | −0.304 | (−0.307; 0.295) | 0.508 | Yes |
| Composite | Difference of the logarithm of the variances of the composite (=0) | 95% confidence interval | p-value | Equality of variances? |
| Affective image | 0.161 | (−0.696; 0.756) | 0.667 | Yes |
| City brand university | 0.129 | (−0.508; 0.519) | 0.614 | Yes |
| Cognitive image | 0.036 | (−0.521; 0.544) | 0.889 | Yes |
| Cost life | 0.216 | (−0.584; 0.600) | 0.464 | Yes |
| E-wom | −0.046 | (−0.356; 0.350) | 0.805 | Yes |
| Job opportunity | 0.404 | (−0.434; 0.504) | 0.548 | Yes |
| Physical environment | −0.104 | (−0.448;0.470) | 0.635 | Yes |
| Rankings value | 0.367 | (−0.533; 0.553) | 0.188 | Yes |
| Social influence | 0.153 | (−0.450; 0.437) | 0.508 | Yes |
Table A2.
MICON (Manizales City—Pereira city).
Table A2.
MICON (Manizales City—Pereira city).
| Composite | Correlation | 5% Quartile of the Empirical Distribution of c | p-Value | Is Invariance Proven? |
|---|---|---|---|---|
| Affective image | 1.000 | 1.000 | 0.536 | Yes |
| City brand university | 1.000 | 0.999 | 1.000 | Yes |
| Cognitive image | 0.999 | 0.998 | 0.293 | Yes |
| Cost life | 0.999 | 0.976 | 0.900 | Yes |
| E-wom | 0.991 | 0.990 | 0.066 | Yes |
| Job opportunity | 0.999 | 0.986 | 0.668 | Yes |
| Physical environment | 1.000 | 0.997 | 0.913 | Yes |
| Rankings value | 0.995 | 0.988 | 0.371 | Yes |
| Social influence | 1.000 | 0.947 | 0.975 | Yes |
| Composite | Composite Mean Difference (=0) | 95% confidence interval | p-value | Equality of means? |
| Affective image | 0.208 | (−0.315; 0.291) | 0.193 | Yes |
| City brand university | 0.237 | (−0.305; 0.327) | 0.140 | Yes |
| Cognitive image | 0.143 | (−0.291; 0.294) | 0.366 | Yes |
| Cost life | 0.072 | (−0.316; 0.313) | 0.605 | Yes |
| E-wom | 0.138 | (−0.299; 0.298) | 0.382 | Yes |
| Job opportunity | −0.087 | (−0.291; 0.331) | 0.573 | Yes |
| Physical environment | 0.083 | (−0.300; 0.287) | 0.575 | Yes |
| Rankings value | −0.076 | (−0.283; 0.288) | 0.634 | Yes |
| Social influence | −0.017 | (−0.300; 0.280) | 0.907 | Yes |
| Composite | Difference of the logarithm of the variances of the composite (=0) | 95% confidence interval | p-value | Equality of variances? |
| Affective image | 0.172 | (−0.696; 0.756) | 0.562 | Yes |
| City brand university | −0.013 | (−0.508; 0.519) | 0.938 | Yes |
| Cognitive image | −0.148 | (−0.521; 0.544) | 0.502 | Yes |
| Cost life | 0.119 | (−0.584; 0.600) | 0.646 | Yes |
| E-wom | −0.100 | (−0.356; 0.350) | 0.526 | Yes |
| Job opportunity | 0.419 | (−0.434; 0.504) | 0.446 | Yes |
| Physical environment | 0.093 | (−0.448; 0.470) | 0.671 | Yes |
| Rankings value | 0.061 | (−0.533; 0.553) | 0.799 | Yes |
| Social influence | 0.201 | (−0.450; 0.437) | 0.336 | Yes |
Table A3.
MICON (Manizales City—Bogota city).
Table A3.
MICON (Manizales City—Bogota city).
| Composite | Correlation | 5% Quartile of the Empirical Distribution of c | p-Value | Is Invariance Proven? |
|---|---|---|---|---|
| Affective image | 1.000 | 0.999 | 0.582 | Yes |
| City brand university | 1.000 | 0.999 | 0.870 | Yes |
| Cognitive image | 1.000 | 0.997 | 0.993 | Yes |
| Cost life | 0.996 | 0.995 | 0.085 | Yes |
| E-wom | 0.996 | 0.990 | 0.058 | Yes |
| Job opportunity | 1.000 | 0.996 | 0.907 | Yes |
| Physical environment | 0.999 | 0.995 | 0.689 | Yes |
| Rankings value | 0.998 | 0.995 | 0.378 | Yes |
| Social influence | 0.998 | 0.954 | 0.860 | Yes |
| Composite | Composite Mean Difference (=0) | 95% confidence interval | p-value | Equality of means? |
| Affective image | 0.101 | (−0.275; 0.276) | 0.193 | Yes |
| City brand university | 0.146 | (−0.284; 0.263) | 0.140 | Yes |
| Cognitive image | 0.090 | (−0.273; 0.280) | 0.366 | Yes |
| Cost life | 0.148 | (−0.285; 0.295) | 0.605 | Yes |
| E-wom | 0.141 | (−0.299; 0.292) | 0.382 | Yes |
| Job opportunity | −0.152 | (−0.277; 0.265) | 0.573 | Yes |
| Physical environment | 0.135 | (−0.288; 0.284) | 0.575 | Yes |
| Rankings value | −0.278 | (−0.280; 0.288) | 0.634 | Yes |
| Social influence | 0.141 | (−0.261; 0.281) | 0.907 | Yes |
| Composite | Difference of the logarithm of the variances of the composite (=0) | 95% confidence interval | p-value | Equality of variances? |
| Affective image | −0.151 | (−0.401; 0.356) | 0.444 | Yes |
| City brand university | 0.079 | (−0.411; 0.395) | 0.707 | Yes |
| Cognitive image | −0.084 | (−0.444; 0.393) | 0.695 | Yes |
| Cost life | −0.092 | (−0446; 0.420) | 0.700 | Yes |
| E-wom | 0.051 | (−0.319; 0.289) | 0.762 | Yes |
| Job opportunity | 0.153 | (−0.410; 0.324) | 0.387 | Yes |
| Physical environment | −0.059 | (−0.341; 0.334) | 0.751 | Yes |
| Rankings value | 0.233 | (−0.498; 0.428) | 0.304 | Yes |
| Social influence | −0.029 | (−0.387; 0.308) | 0.869 | Yes |
Table A4.
Differences between Manizales City—Medellin city—based on permutation.
Table A4.
Differences between Manizales City—Medellin city—based on permutation.
| Relation | Path Coefficients Original Manizales City | Path Coefficients Original Medellin city | Path Coefficients Original Difference | Path Coefficients Permutation mean Differences | 2.5% | 97.5% | Permutation p-Values |
|---|---|---|---|---|---|---|---|
| Affective image -> City brand university | 0.542 | 0.524 | 0.018 | 0.010 | −0.347 | 0.383 | 0.917 |
| Cognitive image -> City brand university | 0.215 | 0.250 | −0.034 | −0.014 | −0.385 | 0.335 | 0.833 |
| Cost life -> City brand university | 0.013 | 0.043 | −0.030 | −0.001 | −0.294 | 0.310 | 0.847 |
| Cost life -> Cognitive image | −0.067 | 0.238 | −0.305 | 0.009 | −0.447 | 0.480 | 0.196 |
| E-wom -> Affective image | 0.012 * | 0.474 * | −0.462 * | 0.002 | −0.327 | 0.305 | 0.001 |
| E-wom -> City brand university | 0.234 | 0.154 | 0.079 | 0.006 | −0.383 | 0.369 | 0.694 |
| Job opportunity -> City brand university | −0.075 | 0.112 | −0.187 | −0.002 | −0.312 | 0.291 | 0.227 |
| Job opportunity -> Cognitive image | 0.195 | 0.284 | −0.089 | 0.018 | −0.387 | 0.449 | 0.709 |
| Physical environment -> City brand university | −0.141 | 0.023 | −0.164 | −0.010 | −0.382 | 0.341 | 0.394 |
| Physical environment -> Cognitive image | 0.325 | 0.105 | 0.220 | −0.018 | −0.529 | 0.476 | 0.459 |
| Rankings Value -> City brand university | 0.340* | −0.161 * | 0.501 * | 0.010 | −0.414 | 0.406 | 0.014 |
| Rankings Value -> Cognitive image | 0.159 | 0.324 | −0.165 | −0.003 | −0.365 | 0.371 | 0.400 |
| Social influence -> Affective image | 0.362 | 0.358 | 0.003 | −0.004 | −0.360 | 0.359 | 0.991 |
| Social influence -> City brand university | −0.171 | 0.088 | −0.259 | −0.001 | −0.275 | 0.298 | 0.079 |
(Note: * Significant difference: p-value < 0.05).
Table A5.
Differences between Manizales City—Pereira city—based on permutation.
Table A5.
Differences between Manizales City—Pereira city—based on permutation.
| Relation | Path Coefficients Original Manizales City | Path Coefficients Original Medellin city | Path Coefficients Original Difference | Path Coefficients Permutation mean Differences | 2.5% | 97.5% | Permutation p-Values |
|---|---|---|---|---|---|---|---|
| Affective image -> City brand university | 0.542 | 0.263 | 0.280 | 0.003 | −0.302 | 0.312 | 0.074 |
| Cognitive image -> City brand university | 0.215 | 0.429 | −0.214 | −0.004 | −0.327 | 0.344 | 0.223 |
| Cost life -> City brand university | 0.013 | −0.156 | 0.169 | 0.006 | −0.292 | 0.294 | 0.284 |
| Cost life -> Cognitive image | −0.067 | −0.012 | −0.055 | −0.001 | −0.435 | 0.447 | 0.836 |
| E-wom -> Affective image | 0.012 | 0.135 | −0.122 | −0.006 | −0.291 | 0.268 | 0.412 |
| E-wom -> City brand university | 0.234 | 0.185 | 0.049 | 0.006 | −0.296 | 0.285 | 0.747 |
| Job opportunity -> City brand university | −0.075 | 0.023 | −0.097 | −0.007 | −0.304 | 0.288 | 0.510 |
| Job opportunity -> Cognitive image | 0.195 | 0.369 | −0.174 | 0.005 | −0.401 | 0.424 | 0.400 |
| Physical environment -> City brand university | −0.141 | 0.063 | −0.204 | −0.007 | −0.362 | 0.345 | 0.263 |
| Physical environment -> Cognitive image | 0.325 | 0.129 | 0.196 | −0.002 | −0.487 | 0.461 | 0.462 |
| Rankings Value -> City brand university | 0.340 | 0.120 | 0.219 | 0.004 | −0.324 | 0.320 | 0.188 |
| Rankings Value -> Cognitive image | 0.159 | 0.239 | −0.081 | −0.009 | −0.357 | 0.354 | 0.664 |
| Social influence -> Affective image | 0.362 | 0.533 | −0.171 | −0.001 | −0.314 | 0.300 | 0.295 |
| Social influence -> City brand university | −0.171 | 0.000 | −0.172 | 0.002 | −0.282 | 0.285 | 0.243 |
Table A6.
PLS-MGA Manizales City—Pereira city.
Table A6.
PLS-MGA Manizales City—Pereira city.
| Relation | Path-Difference Coefficients | Original p-Value (1-Tailed) |
|---|---|---|
| Affective image -> City brand university | 0.280 | 1.000 |
| Cognitive image -> City brand university | −0.214 | 1.000 |
| Cost life -> City brand university | 0.169 | 1.000 |
| Cost life -> Cognitive image | −0.055 | 1.000 |
| E-wom -> Affective image | −0.122 | 1.000 |
| E-wom -> City brand university | 0.049 | 1.000 |
| Job opportunity -> City brand university | −0.097 | 1.000 |
| Job opportunity -> Cognitive image | 0.100 | 1.000 |
| Physical environment -> City brand university | −0.204 | 1.000 |
| Physical environment -> Cognitive image | 0.196 | 1.000 |
| Rankings Value -> City brand university | 0.219 | 1.000 |
| Rankings Value -> Cognitive image | −0.081 | 1.000 |
| Social influence -> Affective image | −0.171 | 1.000 |
| Social influence -> City brand university | −0.172 | 1.000 |
Table A7.
Parametric test—Manizales City—Pereira city.
Table A7.
Parametric test—Manizales City—Pereira city.
| Path-Difference Coefficients | t-Value | p-Value | |
|---|---|---|---|
| Affective image -> City brand university | 0.280 | n/a | 0.500 |
| Age -> City brand university | −0.066 | n/a | 0.500 |
| Cognitive image -> City brand university | −0.214 | n/a | 0.500 |
| Cost life -> City brand university | 0.169 | n/a | 0.500 |
| Cost life -> Cognitive image | −0.055 | n/a | 0.500 |
| E-wom -> Affective image | −0.122 | n/a | 0.500 |
| E-wom -> City brand university | 0.049 | n/a | 0.500 |
| Job opportunity -> City brand university | −0.097 | n/a | 0.500 |
| Job opportunity -> Cognitive image | −0.174 | n/a | 0.500 |
| Level -> City brand university | 0.100 | n/a | 0.500 |
| Physical environment -> City brand university | −0.204 | n/a | 0.500 |
| Physical environment -> Cognitive image | 0.196 | n/a | 0.500 |
| Rankings Value -> City brand university | 0.219 | n/a | 0.500 |
| Rankings Value -> Cognitive image | −0.081 | n/a | 0.500 |
| Social influence -> Affective image | −0.171 | n/a | 0.500 |
| Social influence -> City brand university | −0.172 | n/a | 0.500 |
Table A8.
t-Test Welch-Satterhwaite—Manizales City—Pereira city.
Table A8.
t-Test Welch-Satterhwaite—Manizales City—Pereira city.
| Path-Difference Coefficients | t-Value | p-Value | |
|---|---|---|---|
| Affective image -> City brand university | 0.280 | n/a | 0.500 |
| Age -> City brand university | −0.214 | n/a | 0.500 |
| Cognitive image -> City brand university | 0.169 | n/a | 0.500 |
| Cost life -> City brand university | −0.055 | n/a | 0.500 |
| Cost life -> Cognitive image | −0.122 | n/a | 0.500 |
| E-wom -> Affective image | 0.049 | n/a | 0.500 |
| E-wom -> City brand university | −0.097 | n/a | 0.500 |
| Job opportunity -> City brand university | −0.174 | n/a | 0.500 |
| Job opportunity -> Cognitive image | −0.204 | n/a | 0.500 |
| Level -> City brand university | 0.196 | n/a | 0.500 |
| Physical environment -> City brand university | 0.219 | n/a | 0.500 |
| Physical environment -> Cognitive image | −0.081 | n/a | 0.500 |
| Rankings Value -> City brand university | −0.171 | n/a | 0.500 |
| Rankings Value -> Cognitive image | −0.172 | n/a | 0.500 |
| Social influence -> Affective image | 0.280 | n/a | 0.500 |
| Social influence -> City brand university | −0.214 | n/a | 0.500 |
Table A9.
Differences between Manizales City—Bogota city—Based on permutation.
Table A9.
Differences between Manizales City—Bogota city—Based on permutation.
| Relation | Path Coefficients Original Manizales City | Path Coefficients Original Medellin City | Path Coefficients Original Difference | Path Coefficients Permutation Mean Differences | 2.5% | 97.5% | Permutation p-Values |
|---|---|---|---|---|---|---|---|
| Affective image -> City brand university | 0.542 | 0.291 | 0.251 | −0.014 | −0.346 | 0.319 | 0.137 |
| Cognitive image -> City brand university | 0.215 | 0.193 | 0.022 | 0.012 | −0.338 | 0.346 | 0.891 |
| Cost life -> City brand university | 0.013 | −0.038 | 0.051 | 0.013 | −0.230 | 0.266 | 0.717 |
| Cost life -> Cognitive image | −0.067 | 0.078 | −0.145 | −0.002 | −0.420 | 0.366 | 0.479 |
| E-wom -> Affective image | 0.012 | 0.297 | −0.285 | −0.003 | −0.297 | 0.282 | 0.055 |
| E-wom -> City brand university | 0.234 | 0.139 | 0.095 | 0.002 | −0.264 | 0.280 | 0.535 |
| Job opportunity -> City brand university | −0.075 | 0.119 | −0.194 | 0.002 | −0.266 | 0.286 | 0.164 |
| Job opportunity -> Cognitive image | 0.195 | 0.229 | −0.034 | 0.002 | −0.369 | 0.368 | 0.843 |
| Physical environment -> City brand university | −0.141 | −0.064 | −0.077 | −0.010 | −0.318 | 0.287 | 0.625 |
| Physical environment -> Cognitive image | 0.325 | 0.043 | 0.282 | −0.002 | −0.362 | 0.351 | 0.142 |
| Rankings Value -> City brand university | 0.340 | 0.378 | −0.038 | −0.002 | −0.300 | 0.316 | 0.801 |
| Rankings Value -> Cognitive image | 0.159 | 0.262 | −0.103 | 0.007 | −0.334 | 0.312 | 0.546 |
| Social influence -> Affective image | 0.362 | 0.311 | 0.050 | 0.006 | −0.242 | 0.260 | 0.684 |
| Social influence -> City brand university | −0.171 | 0.003 | −0.174 | 0.004 | −0.241 | 0.271 | 0.169 |
Table A10.
PLS-MGA Manizales City—Bogota city.
Table A10.
PLS-MGA Manizales City—Bogota city.
| Relation | Path-Difference Coefficients | Original p-Value (1-Tailed) |
|---|---|---|
| Affective image -> City brand university | 0.251 | 0.061 |
| Cognitive image -> City brand university | 0.022 | 0.443 |
| Cost life -> City brand university | 0.051 | 0.372 |
| Cost life -> Cognitive image | −0.145 | 0.741 |
| E-wom -> Affective image | −0.285 | 0.973 |
| E-wom -> City brand university | 0.095 | 0.253 |
| Job opportunity -> City brand university | −0.194 | 0.921 |
| Job opportunity -> Cognitive image | −0.034 | 0.567 |
| Physical environment -> City brand university | −0.077 | 0.662 |
| Physical environment -> Cognitive image | 0.282 | 0.126 |
| Rankings Value -> City brand university | −0.038 | 0.600 |
| Rankings Value -> Cognitive image | −0.103 | 0.729 |
| Social influence -> Affective image | 0.050 | 0.359 |
| Social influence -> City brand university | −0.174 | 0.894 |
Table A11.
Parametric test—Manizales City—Bogota city.
Table A11.
Parametric test—Manizales City—Bogota city.
| Path-Difference Coefficients | t-Value | p-Value | |
|---|---|---|---|
| Affective image -> City brand university | 0.251 | 1.421 | 0.157 |
| Age -> City brand university | 0.022 | 0.127 | 0.899 |
| Cognitive image -> City brand university | 0.051 | 0.361 | 0.719 |
| Cost life -> City brand university | −0.145 | 0.709 | 0.479 |
| Cost life -> Cognitive image | −0.285 * | 1.986 | 0.048* |
| E-wom -> Affective image | 0.095 | 0.656 | 0.513 |
| E-wom -> City brand university | −0.194 | 1.407 | 0.161 |
| Job opportunity -> City brand university | −0.034 | 0.179 | 0.858 |
| Job opportunity -> Cognitive image | −0.077 | 0.459 | 0.646 |
| Level -> City brand university | 0.282 | 1.282 | 0.201 |
| Physical environment -> City brand university | −0.038 | 0.247 | 0.805 |
| Physical environment -> Cognitive image | −0.103 | 0.618 | 0.537 |
| Rankings Value -> City brand university | 0.050 | 0.345 | 0.730 |
| Rankings Value -> Cognitive image | −0.174 | 1.291 | 0.198 |
| Social influence -> Affective image | 0.251 | 1.421 | 0.157 |
| Social influence -> City brand university | 0.022 | 0.127 | 0.899 |
(Note: * Significant difference: p-value < 0.05).
Table A12.
t-Test Welch–Satterhwaite—Manizales City—Bogota city.
Table A12.
t-Test Welch–Satterhwaite—Manizales City—Bogota city.
| Path-Difference Coefficients | t-Value | p-Value | |
|---|---|---|---|
| Affective image -> City brand university | 0.251 | 1.532 | 0.128 |
| Age -> City brand university | 0.022 | 0.135 | 0.893 |
| Cognitive image -> City brand university | 0.051 | 0.346 | 0.730 |
| Cost life -> City brand university | −0.145 | 0.654 | 0.515 |
| Cost life -> Cognitive image | −0.285 | 1.892 | 0.062 |
| E-wom -> Affective image | 0.095 | 0.665 | 0.507 |
| E-wom -> City brand university | −0.194 | 1.418 | 0.159 |
| Job opportunity -> City brand university | −0.034 | 0.176 | 0.860 |
| Job opportunity -> Cognitive image | −0.077 | 0.440 | 0.661 |
| Level -> City brand university | 0.282 | 1.173 | 0.244 |
| Physical environment -> City brand university | −0.038 | 0.245 | 0.807 |
| Physical environment -> Cognitive image | −0.103 | 0.615 | 0.540 |
| Rankings Value -> City brand university | 0.050 | 0.330 | 0.742 |
| Rankings Value -> Cognitive image | −0.174 | 1.231 | 0.221 |
| Social influence -> Affective image | 0.251 | 1.532 | 0.128 |
| Social influence -> City brand university | 0.022 | 0.135 | 0.893 |
References
- Brandt, C.; De Mortanges, C.P. City Branding: A Brand Concept Map Analysis of a University Town. Place Brand. Public Dipl. 2011. [Google Scholar] [CrossRef]
- Zenker, S.; Braun, E.; Petersen, S. Branding the Destination versus the Place: The Effects of Brand Complexity and Identification for Residents and Visitors. Tour Manag. 2017, 58, 15–27. [Google Scholar] [CrossRef]
- Maitland, R. How Can We Manage the Tourist-Historic City? Tourism Strategy in Cambridge, UK, 1978–2003. Tour Manag. 2006, 27, 1262–1273. [Google Scholar] [CrossRef]
- Braun, E.; Kavaratzis, M.; Zenker, S. My City—My Brand: The Role of Residents in Place Branding. In Proceedings of the 50th European Regional Science Association (ERSA) Congress, Jönköping, Sweden, 19–23 August 2010. [Google Scholar]
- Hospers, G.J. A Short Reflection on City Branding and Its Controversies. Tijdschrift voor Economische en Sociale Geografie 2020, 111, 18–23. [Google Scholar] [CrossRef]
- Goovaerts, P.; Van Biesbroeck, H.; Van Tilt, T. Measuring the Effect and Efficiency of City Marketing. Procedia Econ. Financ. 2014, 12, 191–198. [Google Scholar] [CrossRef]
- Oguztimur, S.; Akturan, U. Synthesis of City Branding Literature (1988–2014) as a Research Domain. Int. J. Tour. Res. 2016, 18, 357–372. [Google Scholar] [CrossRef]
- European University Association. Universities without Walls—A Vision for 2030; European University Association: Brussels, Belgium, 2021. [Google Scholar]
- Glasson, J. The Widening Local and Regional Development Impacts of the Modern Universities—A Tale of Two Cities (and North-South Perspectives). Local Econ. 2003, 18, 21–37. [Google Scholar] [CrossRef]
- Popescu, A. Branding Cities as Educational Centres. The Role of Higher Education Institutions. Manag. Şi Mark. (Bucureşti) 2012, 7, 493. [Google Scholar]
- Hospers, G.-J. Creative cities: Breeding places in the knowledge economy. Knowl. Technal. Policy 2003, 16, 143–162. [Google Scholar] [CrossRef]
- Mogaji, E. Types and Location of Nigerian Universities. Res. Agenda Work. Pap. 2019, 1, 92–103. [Google Scholar] [CrossRef]
- Lazzeroni, M.; Piccaluga, A. Beyond ‘Town and Gown’: The Role of the University in Small and Medium-Sized Cities. Ind. High. Educ. 2015, 29, 11–23. [Google Scholar] [CrossRef]
- Lundholt, M.W.; Jørgensen, O.H.; Blichfeldt, B.S. Intra-Organizational Brand Resistance and Counter-Narratives in City Branding—A Comparative Study of Three Danish Cities. Qual. Mark. Res. 2020, 23, 1001–1018. [Google Scholar] [CrossRef]
- Charles, D. The Role of Universities in Building Knowledge Cities in Australia. Built Environ. 2011, 37, 281–298. [Google Scholar] [CrossRef]
- Hospers, G.-J. Governance in innovative cities and the importance of branding. Innov. Manag. Policy Pract. 2008, 10, 224–234. [Google Scholar] [CrossRef]
- Abbas, S.A. Brand Loyalty of Higher Education Institutions. Mark. Manag. Innov. 2019, 1, 46–56. [Google Scholar] [CrossRef]
- Hemsley-Brown, J.; Melewar, T.; Nguyen, B.; Wilson, E.J. Exploring brand identity, meaning, image, and reputation (BIMIR) in higher education: A special section. J. Bus. Res. 2016, 69, 3019–3022. [Google Scholar] [CrossRef]
- Van Noorden, R. Cities: Building the best cities for science. Nature 2010, 467, 906–908. [Google Scholar] [CrossRef]
- Oliva, E.J.D.; Sánchez-Torres, J.A.; Niño, J.S.S. City brand evolution research and future agenda: Bibliometric and science mapping analysis. Heliyon 2022, 8, e10031. [Google Scholar] [CrossRef] [PubMed]
- James-MacEachern, M.; Yun, D. Exploring factors influencing international students’ decision to choose a higher education institution: A comparison between Chinese and other students. Int. J. Educ. Manag. 2017, 31, 343–363. [Google Scholar] [CrossRef]
- Shamsudin, M.F.; Ali, A.M.; Ali, A.M.; Shabi, K.S. Exploratory study of students’ decision for enrolment at universiti kuala lumpur business school campus. Humanit. Soc. Sci. Rev. 2019, 7, 526–530. [Google Scholar] [CrossRef]
- Ananda, T.N.; Rini, E.S.; Karina, B.; Sembiring, F. Determinants of Students ’ Decision to Choose the Faculty of Economics and Business Harapan University, Medan. Int. J. Res. Rev. 2019, 6, 33–45. [Google Scholar]
- Gai, L.; Xu, C.; Pelton, L.E. A netnographic analysis of prospective international students’ decision-making process: Implications for institutional branding of American universities in the emerging markets. J. Mark. High. Educ. 2016, 26, 181–198. [Google Scholar] [CrossRef]
- Kingeski, L.; Nadal, J.O. Brazilian university students in Spain: Motivations and decision factors. Intang. Cap. 2020, 16, 91–106. [Google Scholar] [CrossRef]
- Popov, K. Factors, Affecting Students’ Decision to Enroll in a University. Pedagog. J. Pendidik. 2019, 8, 201–210. [Google Scholar] [CrossRef]
- Williams-Brown, Z.; Rhoades, G.; Smith, M.; Thompson, D. Aspiring to Higher Education? Choice, Complexity and Confidence in Secondary Students’ Decision-Making. Educ. Futures 2019, 10, 31–58. [Google Scholar]
- Hendriana, E.; Awang, K.W.; Yusof, R.N.R. The roles of the country’s cognitive, affective, and personality aspects in international students’ decision-making. J. Mark. High. Educ. 2021, 30, 1–18. [Google Scholar] [CrossRef]
- Sarstedt, M.; Hair, J.F., Jr.; Ringle, C.M. “PLS-SEM: Indeed a silver bullet”—Retrospective observations and recent advances. J. Mark. Theory Pract. 2022, 30, 1–15. [Google Scholar] [CrossRef]
- Hair, J.F.; Risher, J.J.; Sarstedt, M.; Ringle, C.M. When to use and how to report the results of PLS-SEM. Eur. Bus. Rev. 2019, 31, 2–24. [Google Scholar] [CrossRef]
- Henseler, J.; Ringle, C.M.; Sarstedt, M. A new criterion for assessing discriminant validity in variance-based structural equation modeling. J. Acad. Mark. Sci. 2014, 43, 115–135. [Google Scholar] [CrossRef]
- Chin, W.; Cheah, J.-H.; Liu, Y.; Ting, H.; Lim, X.-J.; Cham, T.H. Demystifying the role of causal-predictive modeling using partial least squares structural equation modeling in information systems research. Ind. Manag. Data Syst. 2020, 120, 2161–2209. [Google Scholar] [CrossRef]
- Sarstedt, M.; Ringle, C.M.; Cheah, J.-H.; Ting, H.; Moisescu, O.I.; Radomir, L. Structural model robustness checks in PLS-SEM. Tour. Econ. 2020, 26, 531–554. [Google Scholar] [CrossRef]
- Henseler, J.; Ringle, C.M.; Sarstedt, M. Testing measurement invariance of composites using partial least squares. Int. Mark. Rev. 2016, 33, 405–431. [Google Scholar] [CrossRef]
- Shamsudin, M.F.; Ali, A.M.; Ab Wahid, R.; Saidun, Z. Factors influence undergraduate students’ decision making to enroll and social media application as an external factor. Humanit. Soc. Sci. Rev. 2019, 7, 126–136. [Google Scholar] [CrossRef]
- Fornell, C.; Larcker, D.F. Structural Equation Models with Unobservable Variables and Measurement Error: Algebra and Statistics. J. Mark. Res. 1981, 18, 382–388. [Google Scholar] [CrossRef]


Disclaimer/Publisher’s Note: The statements, opinions and data contained in all publications are solely those of the individual author(s) and contributor(s) and not of MDPI and/or the editor(s). MDPI and/or the editor(s) disclaim responsibility for any injury to people or property resulting from any ideas, methods, instructions or products referred to in the content. |
© 2023 by the authors. Licensee MDPI, Basel, Switzerland. This article is an open access article distributed under the terms and conditions of the Creative Commons Attribution (CC BY) license (https://creativecommons.org/licenses/by/4.0/).