Article

Impact of Underground Coal Seam Mining on Stability and Slippage of the Loess Slope

1
Energy College, Xi’an University of Science and Technology, Xi’an 710054, China
2
State Key Laboratory of Coal Resources in Western China, Xi’an University of Science and Technology, Xi’an 710054, China
*
Author to whom correspondence should be addressed.
Sustainability 2023, 15(8), 6485; https://doi.org/10.3390/su15086485
Submission received: 10 March 2023 / Revised: 6 April 2023 / Accepted: 10 April 2023 / Published: 11 April 2023
(This article belongs to the Section Hazards and Sustainability)

Abstract

:
How to quantitatively characterise the impact of underground coal mining on the stability and slippage of loess slopes is a key problem in the evaluation of mining damage under loess slopes, but it is more difficult to study this problem under the impact of the particular mechanical properties and topographical features of loess slopes. In order to clarify the impact of underground coal seam mining on the stability and slippage of the loess slope, theoretical analysis, numerical simulation and physical similarity simulation experiments are used to address the problem based on the theory of slope stability and strata movement. The results show that the stability coefficient of a mining slope (Kms) is introduced to quantitatively characterise the stability of a mining loess slope, and to measure the degree of landslide risk. Due to the superposition of slope movement caused by mining subsidence and slope sliding tendency, the slope is more unstable when mining along the slope than when mining against the slope. The slope angle and slope height are the most important factors influencing the Kms. The ratio of rock stratum thickness to mining height and the ratio of rock stratum thickness to soil stratum thickness are positively correlated with Kms, and the correlation is relatively strong. The range of variation of the volume weight, internal friction angle and cohesion of the loess is small, and the influence on Kms is relatively weak. Probability integral theory is used to construct the relationship between stability and slippage of mining loess slopes. Taking the mining of a working face under the loess slope of Ningtiaota Coal Mine (China) as an example, the predicted results of the slope movement and deformation theory are in good agreement with the similar simulation test results, reaching 93.57~97.97%.

1. Introduction

Limited by the buried depth of coal seam, open-pit mining is suitable for near-surface coal seams, but underground mining could meet the mining requirements of most coal mines [1,2]. The Jurassic coalfield in northern Shaanxi is one of the largest coalfields in China [3]. The coalfield is located in the border zone between the Mu Us Desert and the Loess Plateau; the distribution area of the loess slope accounts for more than 60% of the coalfield area [4]. When coal seams are mined under loess slopes, the special mechanical properties and topographical characteristics of loess slopes can cause the surface of the loess slope to slip under the effect of mining subsidence [5,6], which could lead to landslide disasters in severe cases [7]. Therefore, it is of great significance for landslide disaster assessment and environmental remediation to clarify the influence mechanism of underground coal mining on loess slope stability and slip [8].
Guo et al. studied the damage behaviour of mining subsidence on the slope surface and considered that the collapse damage mainly occurred in high steep slopes with a slope height of more than 50 m and a slope angle of more than 50° [9]. However, the slope height is generally 10–50 m and the slope angle is 20–50° in the loess slopes of the northern Shaanxi coalfield, and the failure mode of the loess slope surface is mainly sliding failure [10]. Slope instability caused by coal seam mining is determined by two factors: the stability of the slope before mining and the influence of mining on the slope stability [11].
The main methods currently used for pre-mining slope stability analysis are the Limit Equilibrium Method (LEM) and the Finite Element Method (FEM) [12,13]. The essence of both methods is to evaluate the stability of the slope by solving the safety factor of the slope [14]. In the analysis of practical problems, the two methods are often combined to facilitate mutual verification [15]. For example, Vanneschi et al. combined FEM and LEM to analyse the landslide risk of an open-pit coal mine slope and found that the combination of the two methods can reduce the uncertainty factors in the analysis and increase the accuracy of the landslide assessment [16]. Cheng et al. improved the LEM analysis method and applied it to calculate the safety factor of three-dimensional slope [17]. Tolovkhan et al. develop a geomechanical model for ensuring the safety of mining operations by determining the optimal slope angles and probabilistic assessment of the stability of the open-pit walls [18]. Nie et al. combined FEM and LEM to analyse the relationship between slope stability and landslide [19]. Xie et al. used grey relational theory to analyse the sensitivity of factors (height, angle, volume weight, internal friction angle and cohesion of slope) affecting slope stability [20]. All the above literature focuses on slope problems caused by open-pit coal mining, which shows that pre-mining slope stability can be analysed by combining LEM and FEM methods.
The shape and physical properties of the loess slope have changed as a result of the subsidence of the underground coal seam, so the LEM method is not suitable for analysing the post-mining slope stability [21]. Salmi, Fernández et al. used numerical software to simulate the process of landslides caused by underground mining under the influence of geological and geotechnical factors [22,23]. Through field monitoring, some researchers found that the actual settlement value of the horizontal surface is basically consistent with the theoretical predicted value, while the actual settlement value of the slope is larger than the theoretical predicted value due to the slip effect [24,25,26]. Tang, Sun et al. consider that there is a quantitative relationship between the slip of mining subsidence and the topographic factor of slope, and that the slip increases with the increase in surface movement [27,28]. The above research shows that underground mining leads to a decrease in slope stability and an increase in slope surface movement and deformation in the process of mining subsidence. It is worth noting that the literature has shown that there are obvious impacts of different mining factors (mining height, mining depth and mining direction) on slope stability [29,30,31]. However, the specific impact of these mining factors on slope stability is not given in the study, which limits the relationship between mining slope stability and mining slip.
In summary, this study seeks to explore the influence of different mining factors on the stability of loess slope, and to establish the relationship between slope stability and mining slip. This will be conducive to the prediction and evaluation of loess slope disasters. Theoretical analysis, numerical simulation and physical similarity simulation experiments are used to study the problem. The paper’s remaining sections are structured as follows: Firstly, the loess slope stability before coal mining is analysed using LEM theory in Section 2. On this basis, combined with the numerical simulation results in Section 3, the impact of coal seam mining on loess slope stability is analysed. Subsequently, the correlation between loess slope stability and influencing factors after coal seam mining is analysed based on grey correlation theory in Section 4. Finally, in Section 5, the relationship between stability and slippage of loess slope after coal mining is revealed and verified by probability integral theory, strata movement theory and physical similar simulation test.

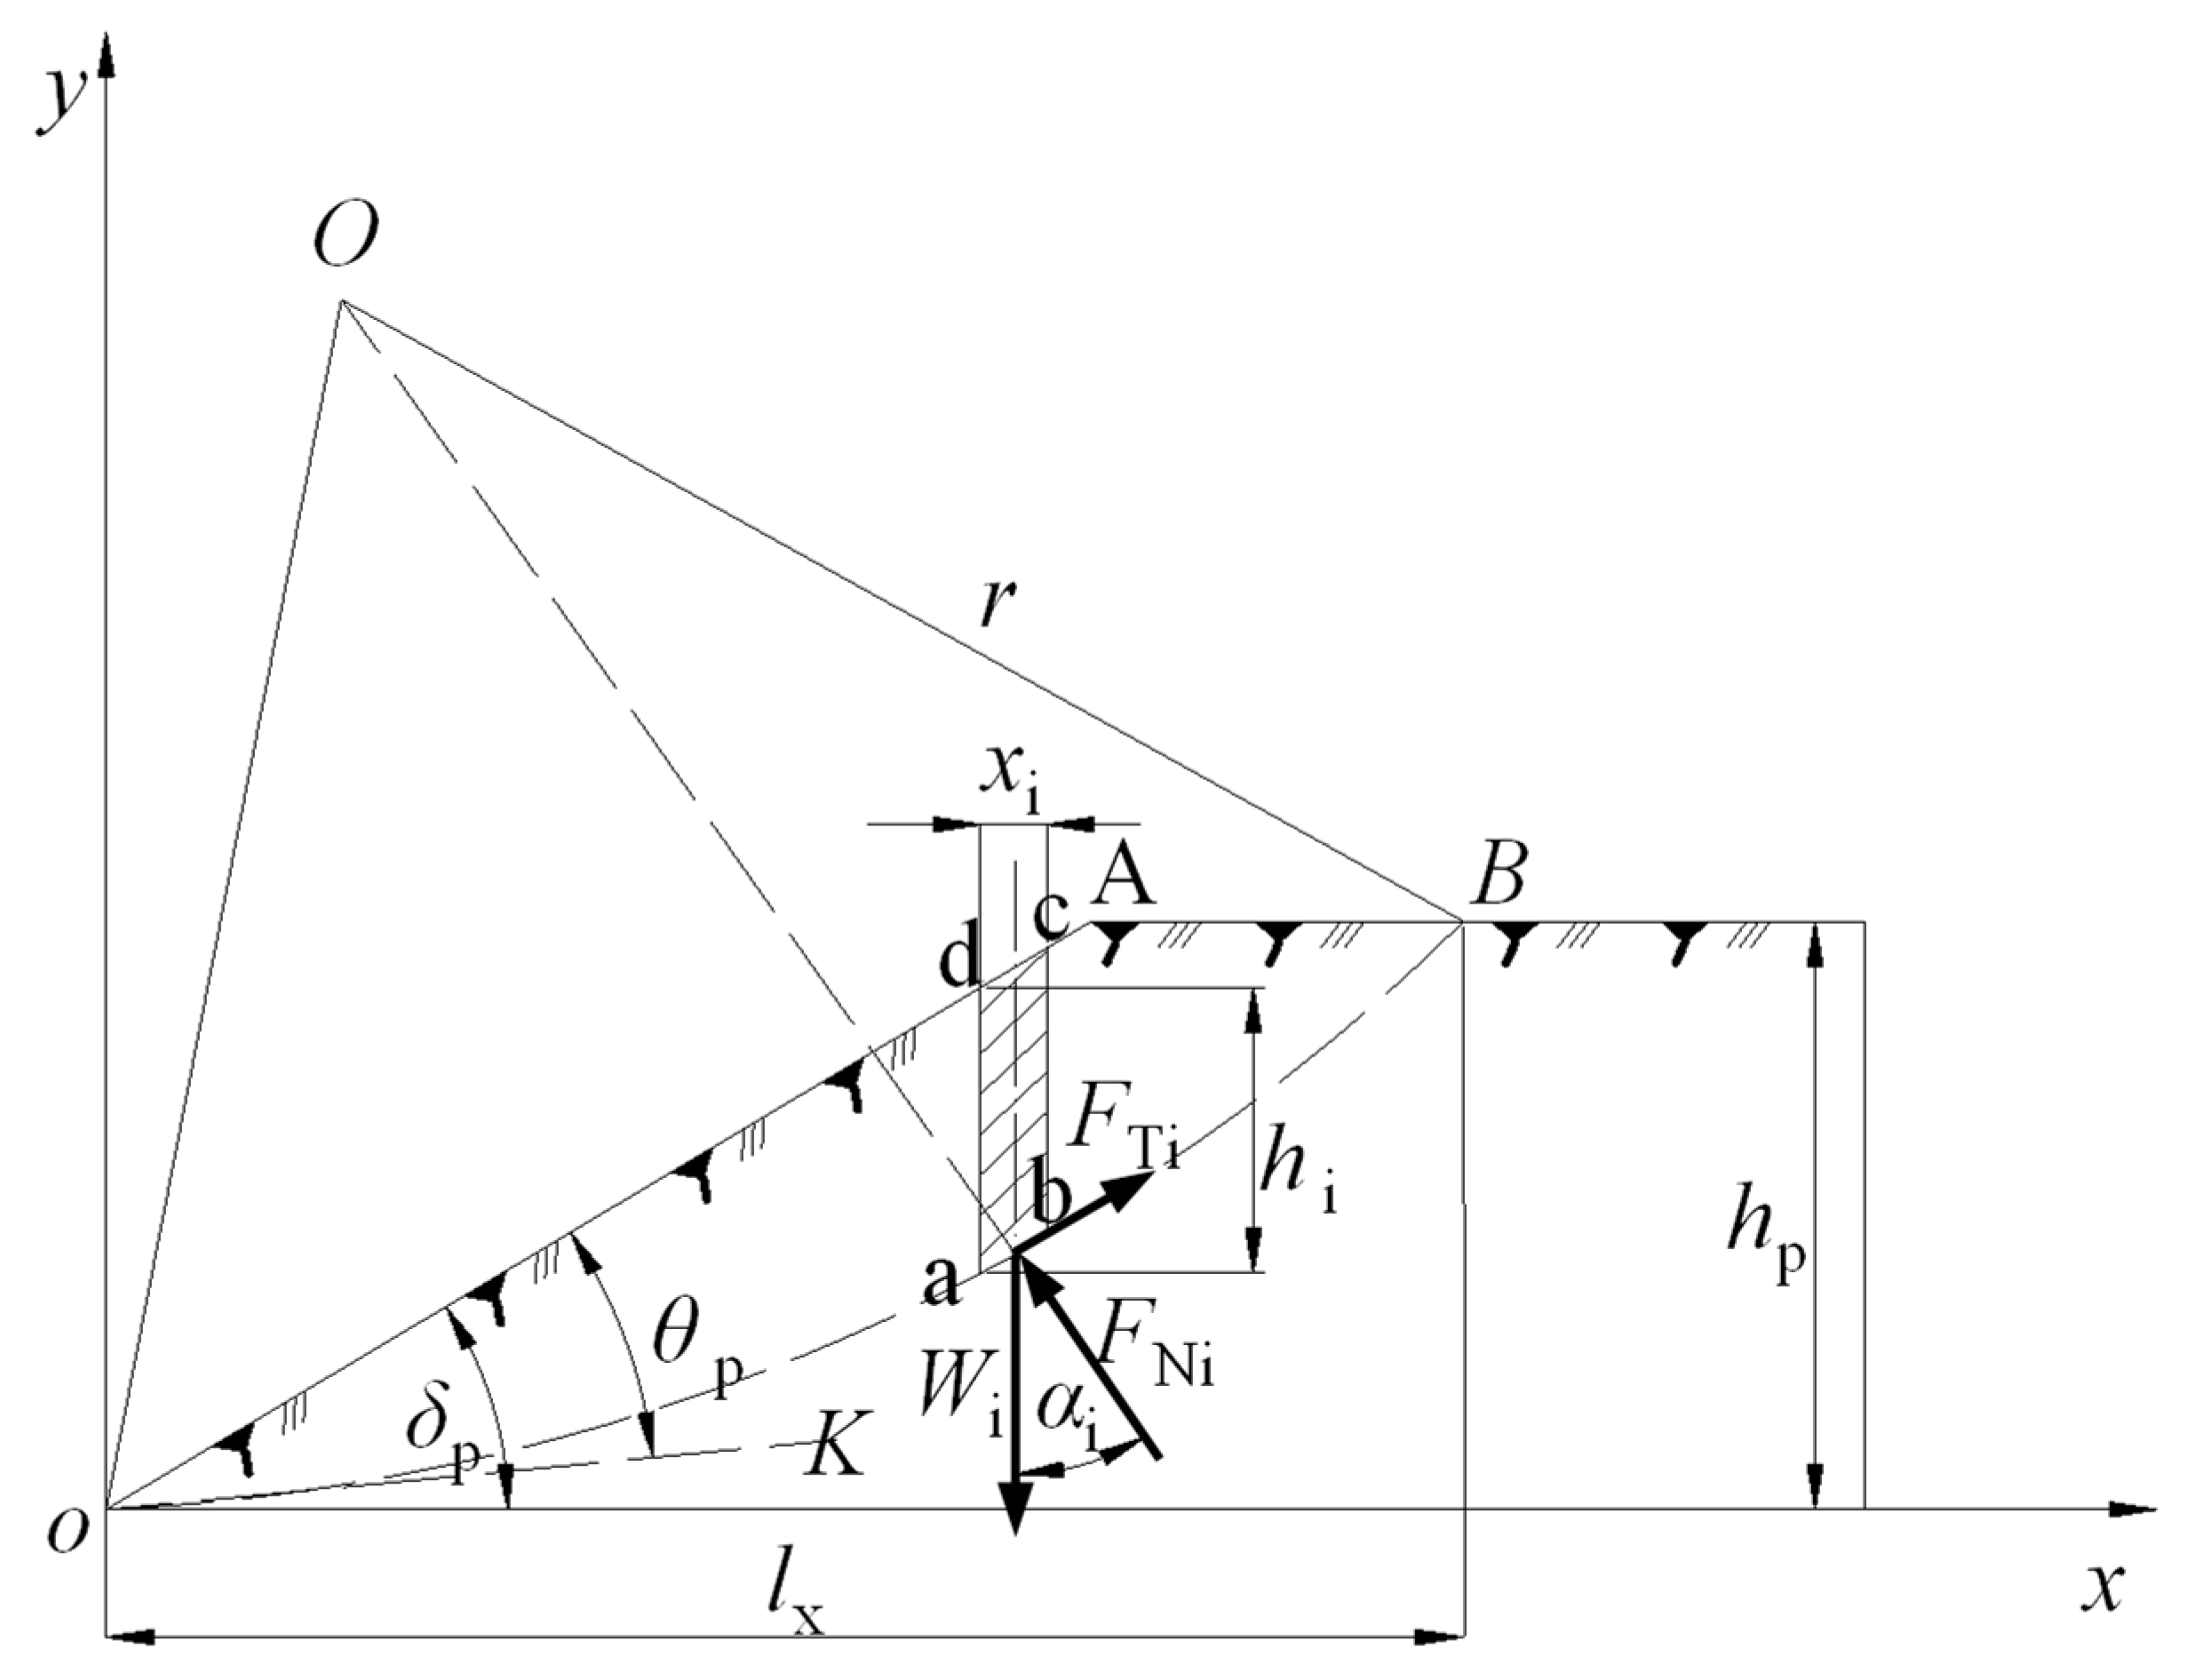
2. Theoretical Analysis of Slope Stability before Mining

Slope stability is the prerequisite for the study of mining slope slippage. The mining stability of loess slope depends on two aspects, one is the stability of the slope itself before coal mining, and the other is the influence of mining factors on the slope stability [11]. Therefore, in order to study the mining stability of the slope, the slope stability before coal mining should be analysed first. The slice method of LEM is one of the slope stability analysis methods widely used in the engineering field. Therefore, based on the limit equilibrium theory, the stability of the loess slope is analysed by the slice method. Due to the complexity of the loess slope, the research conditions are suitably simplified according to the slope stability theory. Firstly, the loess slope is assumed to be a continuous homogeneous soil slope and obeys Mohr–Coulomb yield criterion. Secondly, the interaction force between slope soil strips is ignored. Finally, the sliding surface of the loess slope is assumed to be an arcuate surface. Analysis of the stress state of the slope before coal seam mining is shown in Figure 1 [30].
Figure 1 shows that the slope oAB is divided into several parallelogram-like vertical soil slices. KS is defined as the safety factor of the loess slope and is used to quantify the degree of slope stability. The higher value the KS, the higher the stability of the slope and the lower the risk of loess slope landslides. Strip micro-element of continuous homogeneous soil slope xili. The individual soil strip parameters γsi, hpi, αi, φsi and csi are converted into loess volume weight γs, slope height hp, slope angle δp, loess internal friction angle φs and loess cohesion cs. Further simplification gives KS Equation (1).
K S = i = 1 n γ si x i h i tan ϕ s i cos α i + c s i l i γ si x i h pi sin α i = 2 γ s h p cos 2 δ p tan ϕ s + c s γ s h p sin 2 δ p
Equation (1) shows that the main factors affecting slope stability before mining are hp, δp, γs, cs and δp. According to the Landslide Prevention Engineering Survey Specification (China), the slope stability standards are shown in Table 1 [12]. It is easy to see that as the KS value decreases, the risk of landslides caused by slope instability increases.

3. Numerical Simulation of Mining Slope Stability

Underground coal mining leads to a decrease in slope stability, and there are significant differences in slope stability under different mining conditions [20]. In the literature [21], the rate of change of slope stability before and after mining (nm) represents the degree of influence of mining on slope stability, and Kms represents the coefficient of slope stability after mining. The relationship between Ks, Kms and nm is shown in Equation (2).
n m = K s K ms K s × 100 %
Due to the diversity of mine geological conditions and mining conditions, it is difficult to describe the impact process of underground mining slope stability by traditional theory. FLAC 3D is one of the commonly used finite element analysis software in slope stability. Its built-in strength reduction model can efficiently calculate the slope stability coefficient. Therefore, numerical simulation software could be used to study the influence of mining loess slope stability [22,23].

3.1. Mining Factors Affecting Slope Stability

The parameters and stress state of the slope change after underground mining. The degree of change in slope stability is not only related to the parameters and characteristics of the slope itself, but also closely related to mining factors such as mining height, rock stratum thickness and soil stratum thickness [21]. As the Jurassic coalfield in northern Shaanxi has the characteristics of thick coal seam, almost flat coal seam, thick soil stratum and thin rock stratum, the influence of coal seam inclination angle could be ignored [3]. The ratio of rock stratum thickness to mining height (Jc) and the ratio of rock thickness to soil stratum thickness (Jz) are two key parameters to show the characteristics of mining pressure [1,4]. In addition, the literature [7] has shown that there are significant differences in the effects of different mining directions on slope stability. Therefore, using Jc, Jz and mining direction as the main parameters, the influence of different mining conditions on slope stability is investigated.

3.2. Numerical Simulation Design

The mining pressure in the northern Shaanxi coalfield is mainly characterised by shallow or near-shallow mining pressure. The Jc value ranges from 15 to 60, and the Jz value ranges from 1 to 4 [4]. In this study, three factors were set for slope stability, namely Jc, Jz and mining direction. Jc was set to four levels: 15, 30, 45 and 60. Jz was set at four levels: 1, 2, 3 and 4. The underground mining directions are the mining along slope and the mining reverse slope. A total of 32 sets of numerical models needed to be created to realise all the research schemes, which is time-consuming and labour-intensive. In the process of using FLAC3D to calculate the safety factor, all stratum groups of each model are solved, so the result error is relatively large. In order to improve the efficiency and accuracy of the simulation, the numerical simulation scheme needs to be optimised.

3.2.1. Numerical Simulation Scheme

According to the research schemes, the model is divided into three parts: coal seam model, rock stratum model and slope model. The mining size of the working face in x and y direction of the coal seam model was 169~270 m (1.5 times the mining depth [2]) to ensure full mining. A 60 m coal protection pillar was placed around to reduce the influence of boundary effect on the model. The height of the coal seam model was set to 6 m, and the properties were imported along the coal seam roof to control the mining height and adjust Jc. The ‘step excavation’ command could be used to change the mining direction [5]. Therefore, only four Jz numerical models needed to be established to meet the research needs, as shown in Figure 2.

3.2.2. Model Parameters and Boundary Conditions

In order to improve the simulation efficiency, the number of numerical grids in loess slope area and coal seam areas was increased, and the number of numerical grids in non-research areas was reduced. The γs, cs and φs were chosen according to the median value of the loess value range, i.e., γs = 17,400 N/m3, cs = 6.95 MPa and φs = 30.8°. The other model parameters were chosen according to the literature [4]. The bottom of the model was fixed and the velocity was fixed in the x and y directions of the model. A gravitational acceleration of −10 m/s2 was applied in the z direction of the model. To ensure the accuracy and efficiency of the calculation results, the stability coefficient solution process of the whole model was transformed into the stability coefficient solution process of the slope area by Fish language (FLAC3D).

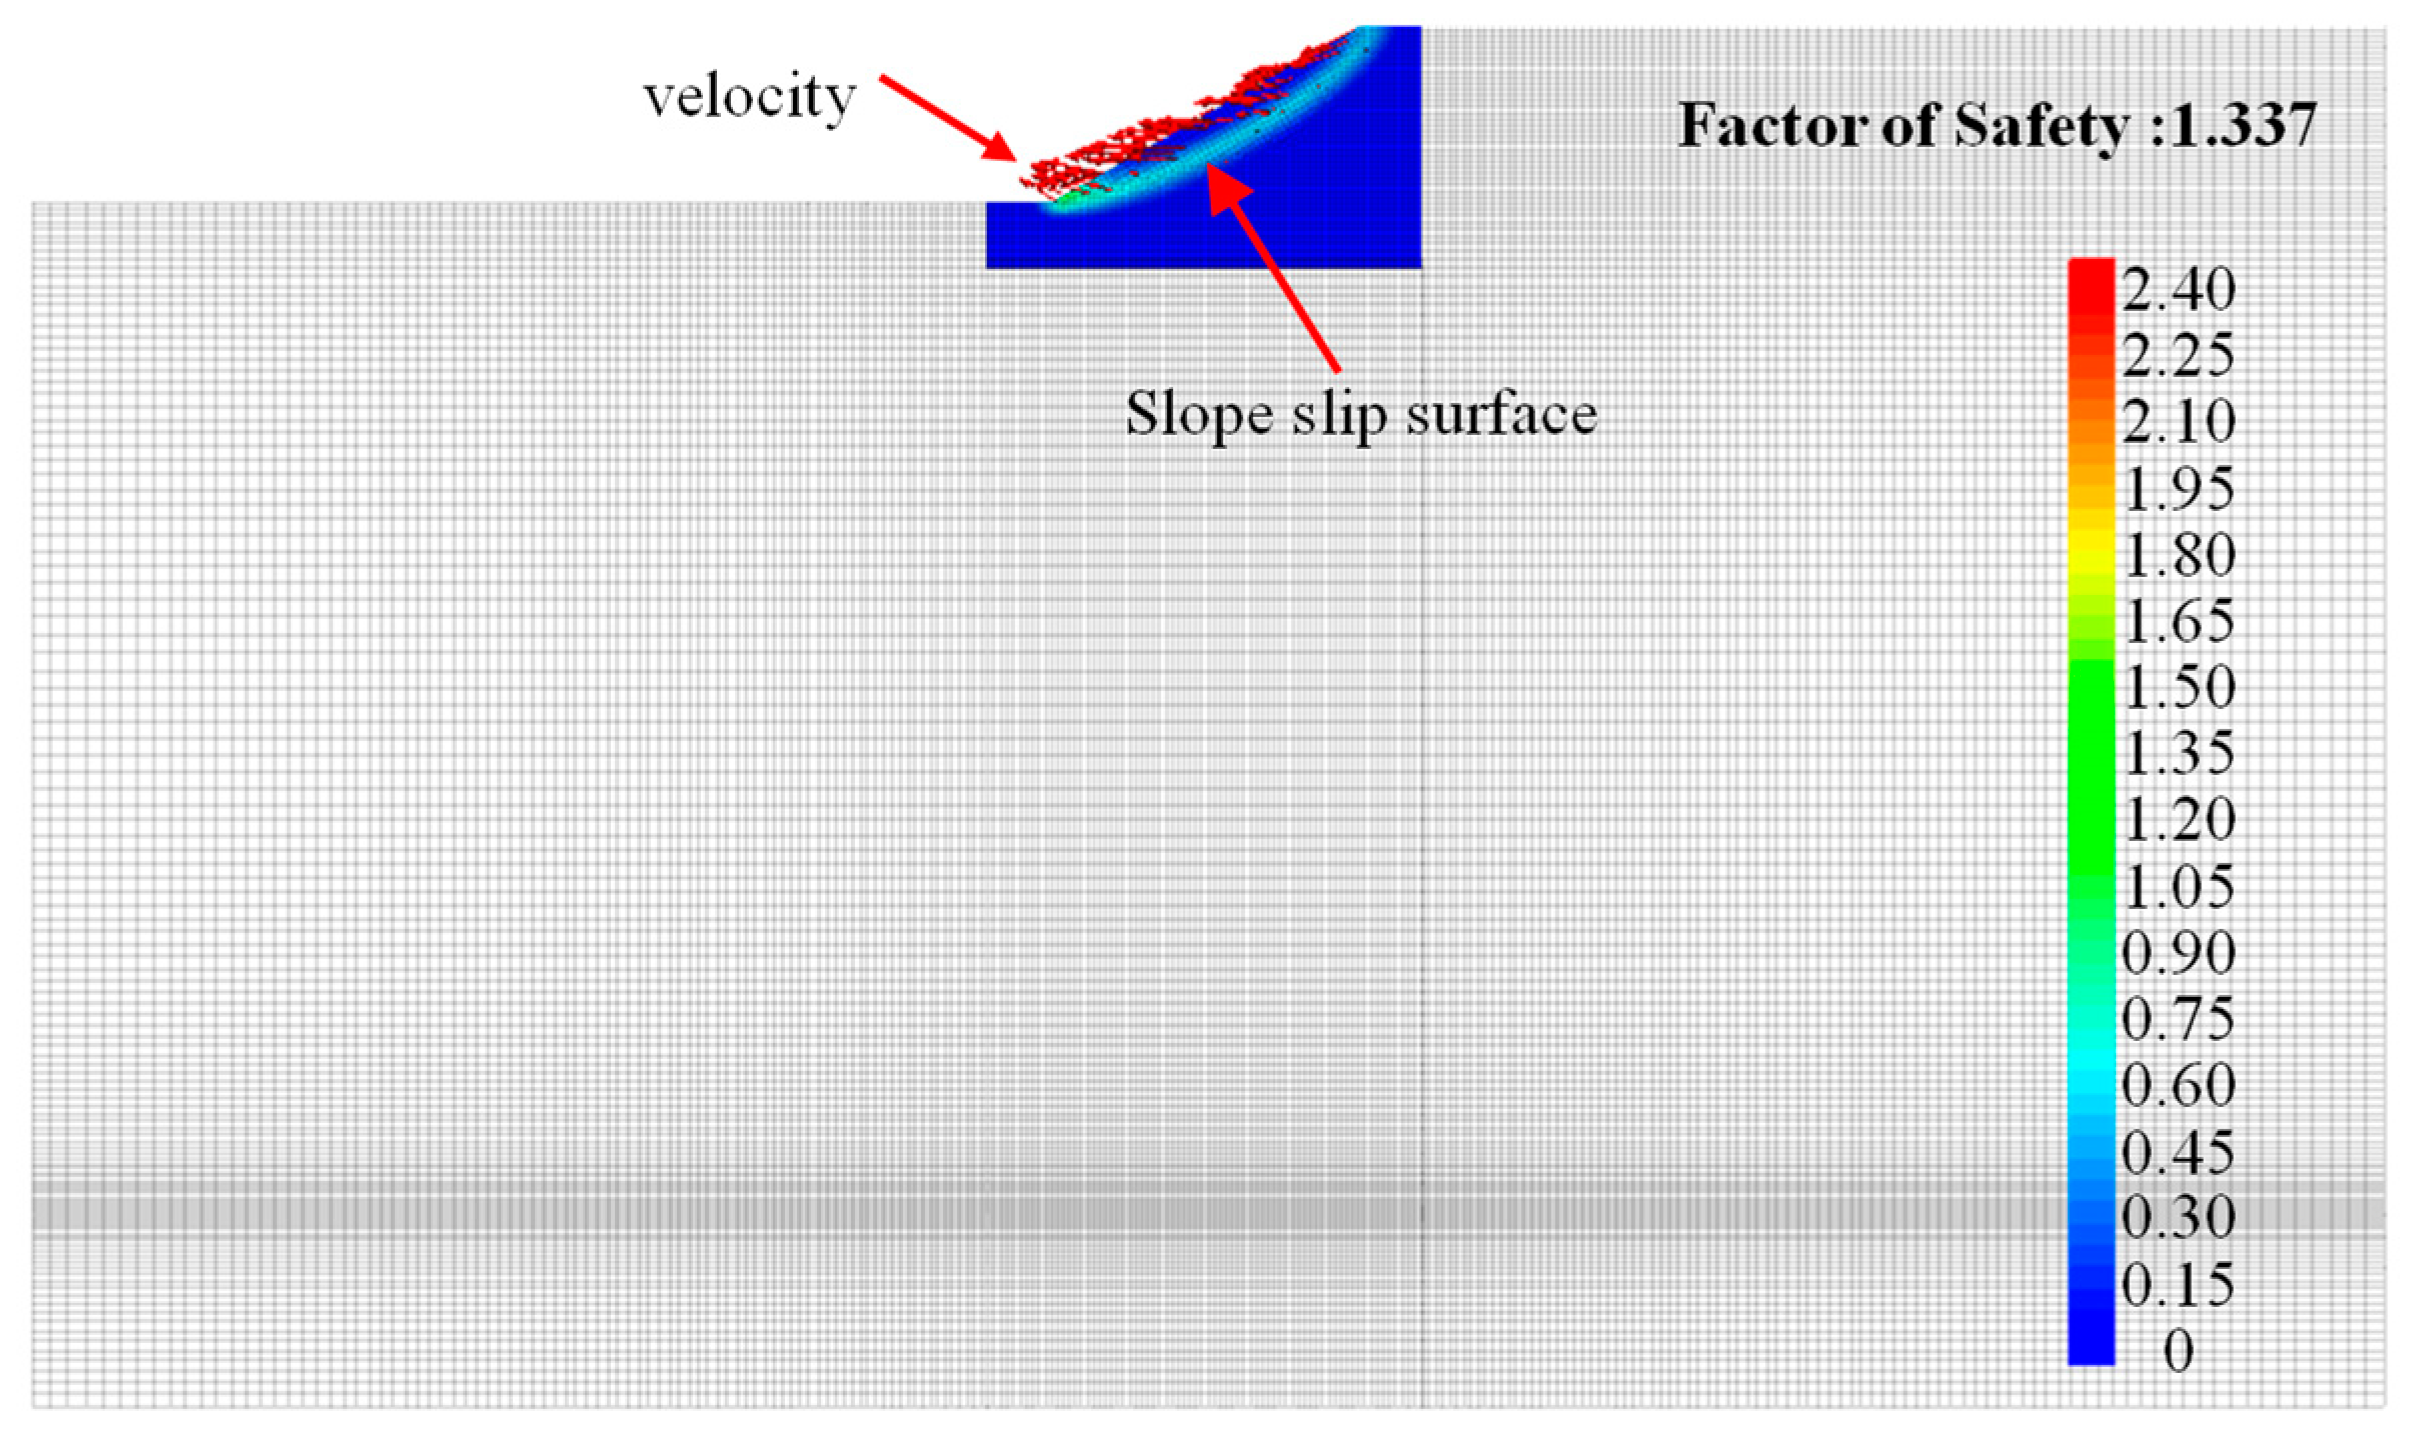
3.2.3. Numerical Inversion Results

In order to maintain the rationality of the numerical model and the results of the slope stability analysis, the initial inversion of the numerical simulation was performed on the model. First, the elastic model was used to apply the initial stress to the model. After the model was balanced, the Mohr–Coulomb model was used to calculate the stability coefficient of the slope area. Before the coal seam is mined, the parameters of the four slope models are consistent. Therefore, only Jz = 1.0 was taken as an example to analyse the pre-mining slope stability. Figure 3 shows the maximum shear strain increase of the y-direction section in the centre of the model.
Figure 3 shows that the maximum shear strain increment at the toe of the slope is 2.40, which is significantly higher than the maximum shear strain increment of 0.15 at the top of the slope. Judging from the direction of velocity, the overall movement trend of the slope shows a downward trend along the slip surface of the slope. The calculation results show that the slope stability coefficient Ks = 1.337 > 1. According to Table 2, the slope stability is high and the slope tends to slide, but there is no landslide hazard. At the same time, according to the physical and mechanical parameters of the slope model, the slope stability coefficient is calculated to be 1.340 by Equation (1), and the numerical simulation is close to the theoretical calculation result. On the one hand, the numerical simulation results verify the rationality of the model, and on the other hand, it shows that the Ks can effectively characterise the stable state of the slope.

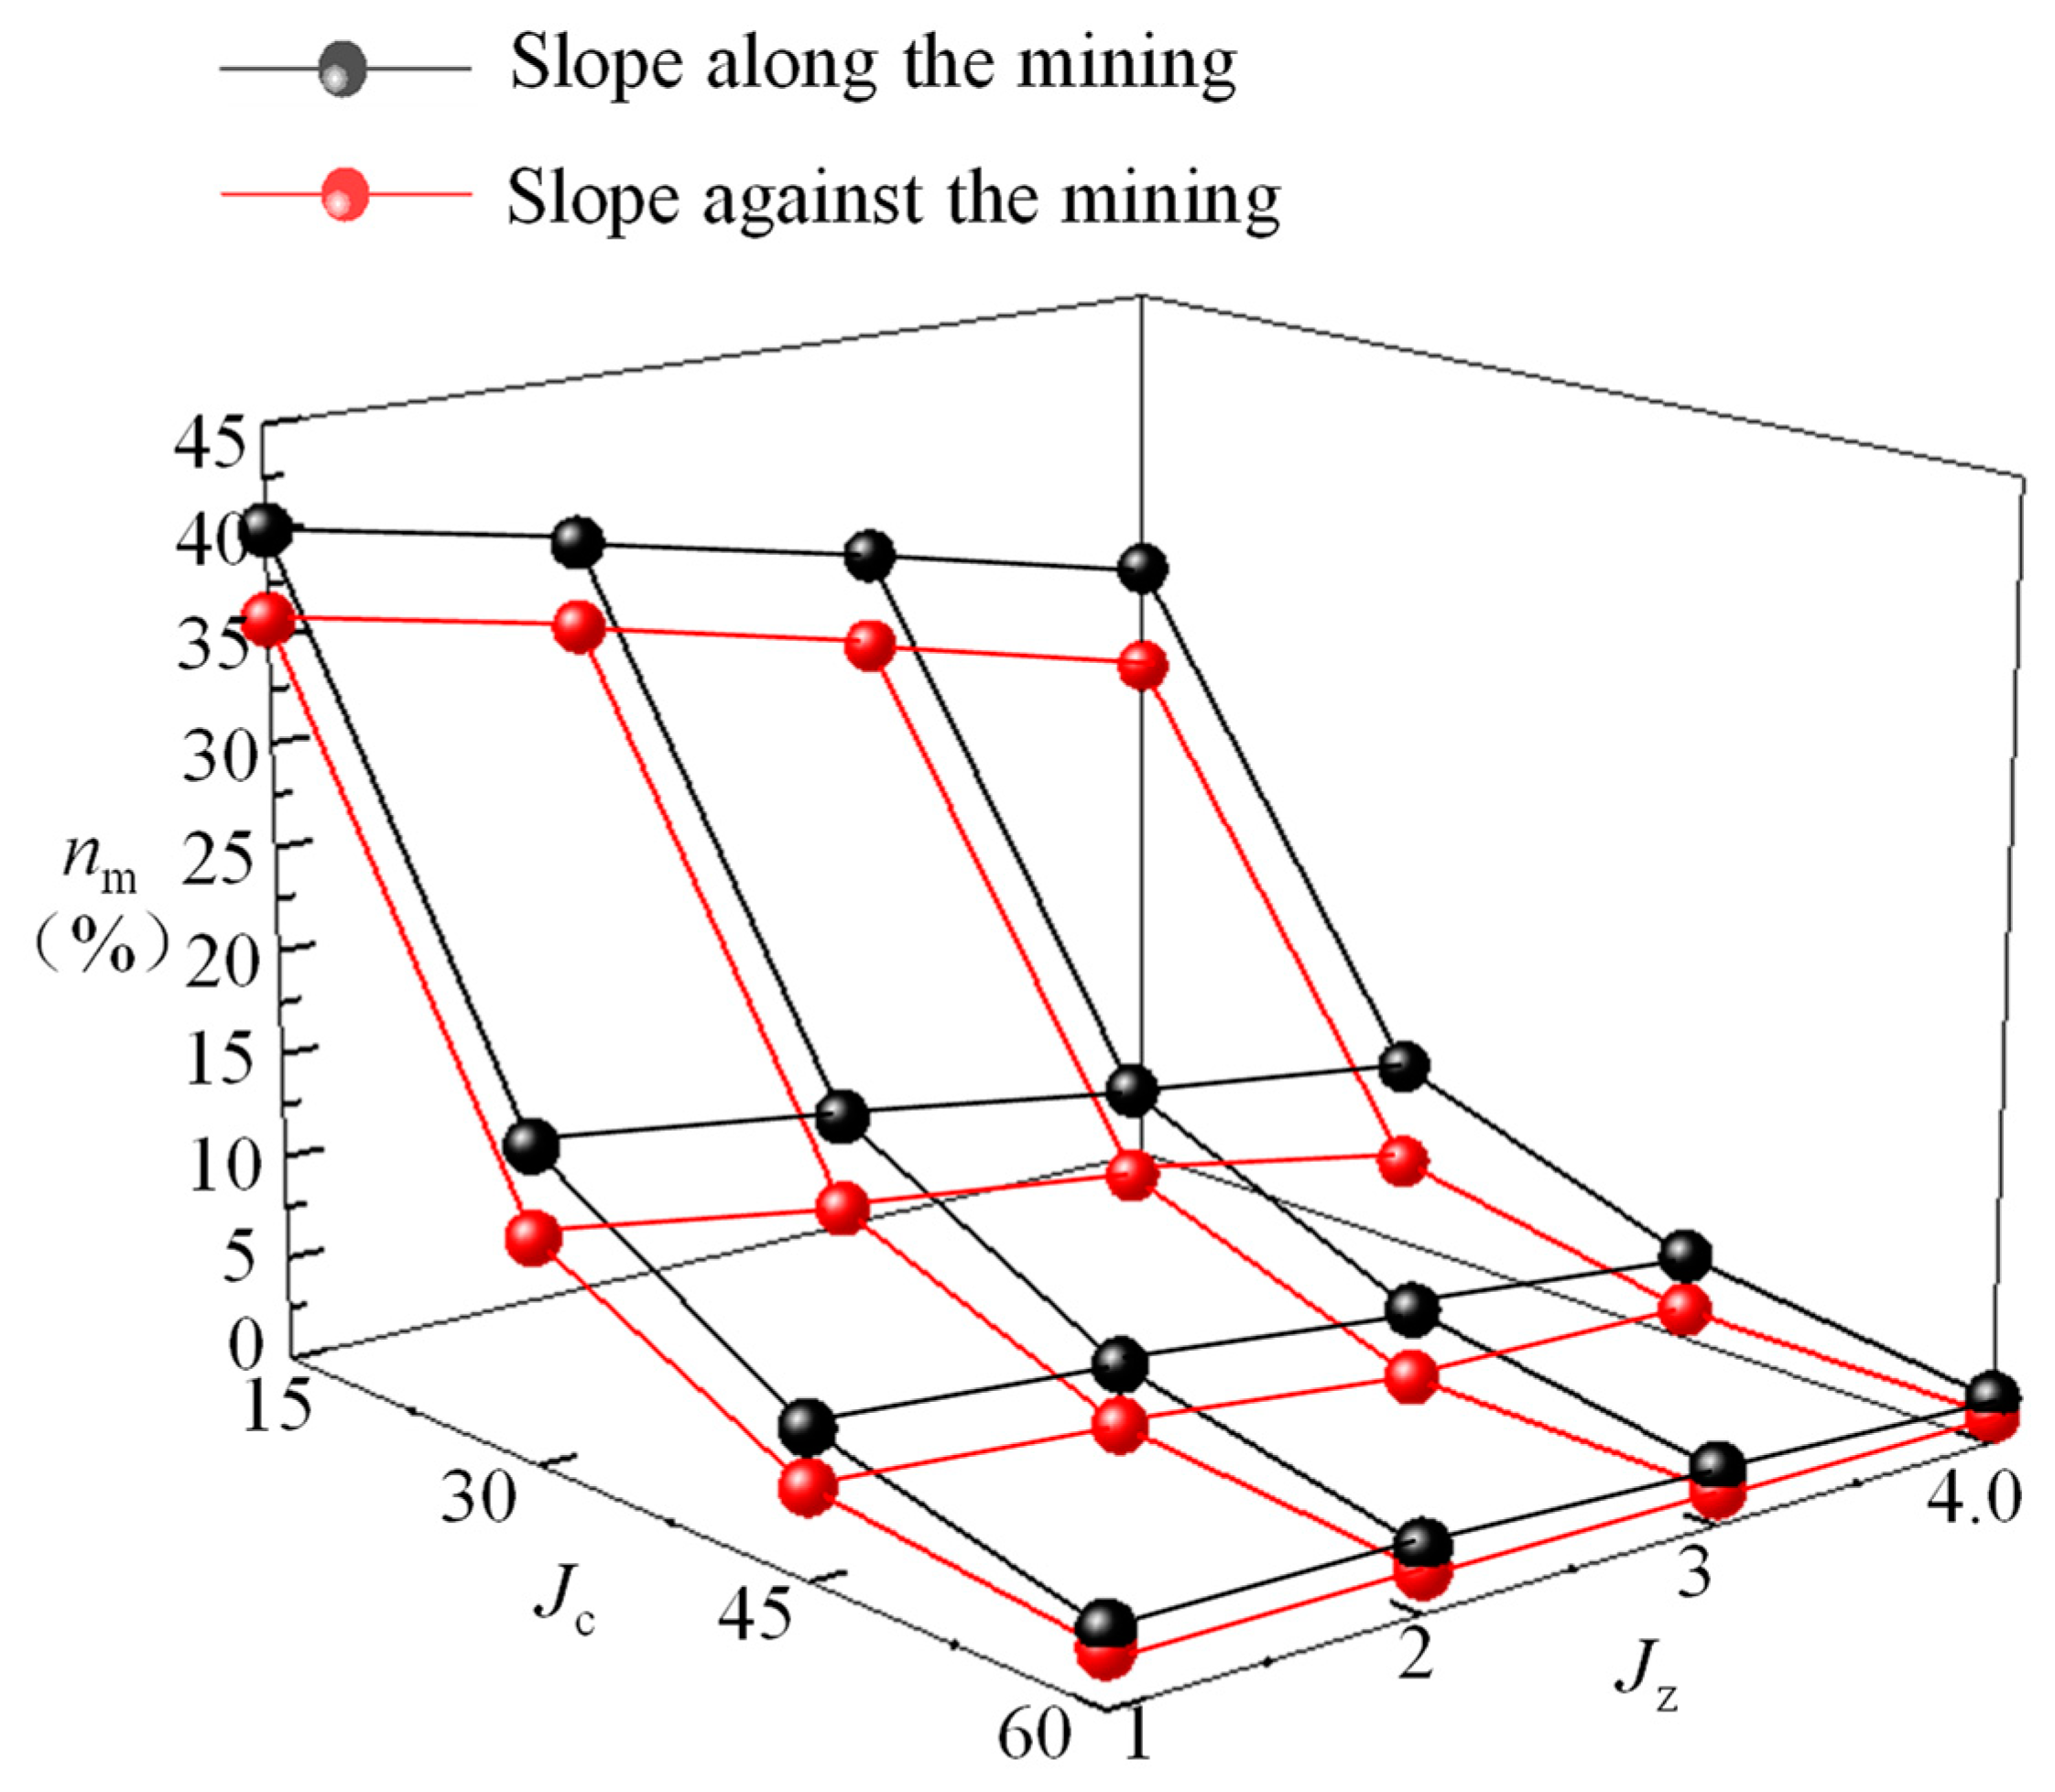
3.3. The Influence Degree of Underground Mining on Slope Stability

Taking the numerical inversion results as the initial model, the stability coefficient of the mining slope under the influence of different Jc, Jz and mining direction was calculated in turn. First, the Double-Yield model was used to simulate the mining process of the working face and the compaction process of the overburden stratum of the goaf [29]. Then, when the model was balanced, the Mohr–Coulomb model was used to solve the mining stability coefficient of the slope area. Finally, the numerical inversion result of 1.337 was substituted, and nm was calculated with Equation (2). The relationship between the factors of Jc, Jz and mining direction and nm is shown in Figure 4.
Figure 4 shows that for a constant Jz, the relative thickness of the overburden rock stratum increases with an increase in Jc. Under the effect of rock bulking, the fractured rock stratum absorbs the energy of the goaf, and the influence of underground mining on the slope stability is progressively reduced. As the rock stratum can form a certain support structure after fracturing, when Jc increases to a certain extent, the influence of mining on the slope stability decreases sharply. Therefore, there is a non-linear negative correlation between nm and Jc, and the rate of decay of nm decreases as the Jc increase. If Jc remains constant, the relative thickness of the overlying soil stratum will decrease with the increase of Jz. The subsidence value caused by the goaf decreases relatively, and the influence on slope stability gradually decreases. Thus, nm is negatively correlated with Jz.
In addition, the overall trend of the Jcnm curve is basically the same for mining along slope and mining the reverse slope, and the influence of mining along the slope on slope stability is stronger than that of mining the against slope. When mining against the slope, the toe of the slope is first damaged before mining to the top of the slope. Subsequently, the mining distance exceeds the top of the slope, the movement direction of the top of the slope is opposite to the tendency of the slope, and the anti-slip ability of the slope is enhanced. When mining along the slope, before mining to the top of the slope, the toe of the slope is first damaged. Then, the mining distance exceeds the toe of the slope, and in the overall movement direction of the slope forms a pushing effect [7], and the sliding force increases, which leads to the aggravation of the slope instability. Therefore, the influence of mining along the slope on the slope stability is higher than that of the mining against the slope. At the same time, with the increase of Jc, the influence of underground mining on the surface is gradually weakened, and the difference of the influence degree of different mining directions on the slope stability is gradually reduced.
According to the data in Figure 4, the relationships between nm, Jc and Jz are fitted for mining along slope and mining against slope respectively. The fitting results are shown in Equations (3) and (4) respectively.
Mining   along   the   slope :   n m = 34.71 J c 1.64 J z 0.19
Mining   inverse   the   slope :   n m = 60.83 J c 1.89 J z 0.27
The degree of fit of Equations (3) and (4) with the simulation data is 0.9946 and 0.9809 respectively. Combined with Equation (2), the Kms of mining along the slope and mining against the slope can be calculated by Equations (5) and (6).
Mining   along   the   slope :   K ms = 1 34.71 J c 1.64 J z 0.19 γ s h p cos 2 δ p tan ϕ s + c s γ s h p sin 2 δ p
Mining   inverse   the   slope :   K ms = 1 60.83 J c 1.89 J z 0.27 γ s h p cos 2 δ p tan ϕ s + c s γ s h p sin 2 δ p
According to Equations (5) and (6), Kms can be calculated by substituting the physical and mechanical parameters (hp, δp, γs, cs and φs) of the loess slope and the corresponding mining parameters (mining direction, Jc and Jz). The post-mining slope stability can also be determined from Table 1. When Kms < 0.95, the stability of the slope decreases, and the mining is easy to induce the landslide. However, when 1 > Kms ≥ 0.95, the slope stability is poor and there is a potential risk of mining landslide. When Kms ≥ 1, the stability of the slope is high and mining will only result in sliding of the slope without landslide.

4. Theoretical Analysis of the Correlation between Influencing Factors and Kms

The factors influencing Kms are derived from the above research, but the degree of influence and the mechanism of the different influencing factors on Kms are still unknown. In order to further investigate the impact of mining slope stability, the correlation of individual and interrelated factors affecting the Kms is investigated.

4.1. The Correlation between Individual Factors and Mining Slope Stability

Equations (5) and (6) show that the main factors affecting the Kms are the slope factors (hp, δp, γs, cs and φs) and mining factors (mining direction, Jc and Jz). The range of physical and mechanical parameters of loess in northern Shaanxi coalfield can be obtained by consulting the literature [4] (Table 2).
Combined with Table 2 and the above research results, the hp variable range is 10~50 m, the δp variable range is 20~50°, the γs variable range is 16,200~18,600 N/m3, the cs variable range is 38,000~101,000 Pa, and the φs variable range is 27.8~33.8°. The Jc variable range is 10~50, and the Jz variable range is 1~4. The influencing trend of along slope mining and against slope mining on slope stability is basically the same; therefore, the influencing factors of the Kms are studied only by Equation (5). Due to the correlation between the influencing factors, the dimensions of quantity of the factors have certain differences. Orthogonal test and grey correlation analysis are used to analyse the influence of each factor on Kms.
First, according to the principle of orthogonal test, an orthogonal table L18(37) with seven factors and three levels was established. According to Equation (5), the Kms of different influencing factors was calculated. The range of different influencing factors and the calculation results of orthogonal test are summarised in Table 3.
Based on the theory of grey correlation degree, hp, δp, γs, cs, φs, Jc and Jz in Table 3 are used as the subsequence matrices, and Kms is used as the parent sequence matrix. The interval averaging is used to eliminate the dimensional difference of the influencing factors. The resolution coefficient is 0.5, and the grey correlation coefficient of different factors in the orthogonal test is calculated; the calculation results are shown in Figure 5.
Figure 5 shows that the grey correlation coefficient fluctuates from 0 to 1. The closer the correlation coefficient of an individual influencing factor is to 1, the stronger the correlation between the factor and the Kms [29]. The average correlation coefficients of hp, δp, γs, cs, φs, Jc and Jz were 0.675, 0.828, 0.615, 0.568, 0.624, 0.662 and 0.648, respectively. The order of correlation between individual influencing factors and the Kms is δp > hp > Jc > Jz > γs > φs > cs, which is basically consistent with the conclusion of the literature [20].

4.2. The Sensibility between Associated Factors and Mining Slope Stability

Among the factors influencing the Kms, there are three groups of correlation factors: slope parameters (hp and δp), soil parameters (cs and φs) and mining parameters (Jc and Jz). In order to study the synergistic effect of the associated factors on the Kms, the initial parameters were set as the median of the value range, hp = 30 m, δp = 35°, γs = 17,400 N/m3, cs = 69,500 Pa, φs = 30.8°, Jc = 37.5 and Jz = 2.5. By changing any set of correlation factor parameters and leaving the initial values of the remaining correlation factor parameters unchanged, the coupling relationship between three sets of correlation factors and Kms is obtained, as shown in Figure 6.
Figure 6a shows that the Kms is non-linearly negatively correlated with hp and δp within the variable range of correlation factors. As hp and δp increase, the rate of increase of the slope sliding force exceeds the rate of increase of the slope anti-sliding force, and the mining stability of the slope decreases. Figure 6b shows that the Kms is linearly positively correlated with φs and cs within the variable range of correlation factors. As φs and cs increase, the friction and interaction between soil particles increases. The slip resistance of the slope is improved and the degree of mining instability is reduced. Figure 6c shows that the Kms is non-linearly positively correlated with Jc and Jz within the variable range of correlation factors. As Jc and Jz increase, the relative thickness of the rock stratum increases and the relative thickness of the soil stratum decreases. The bearing capacity of the overburden stratum increases, the load value decreases and the influence of mining on slope stability decreases.
The relative growth rate of each group of related factors Kms (the ratio of the growth multiple of the dependent variable to the growth multiple of the independent variable) was calculated. The relative growth rates of the Kms contours of the related factors hp and δp were −0.88 and −0.31, respectively. The relative growth rates of the Kms contours of the related factors cs and φs were 0.48 and 1.01, respectively. The relative growth rates of the Kms contours of the related factors Jc and Jz were 0.41 and 0.29, respectively. The above calculation results show that the influence of δp on Kms is stronger than that of hp, φs is stronger than cs, and Jc is stronger than Jz, which mutually confirm the above individual factor analysis results.
In summary, the slope parameters (δp and hp) are the main factors influencing Kms. The mining parameters (Jc and Jz) determine the degree of mining and have a strong influence on Kms. Because the range of variation of the mechanical parameters (γs, φs and cs,) of the loess slope is small, the influence on Kms is weak.

5. Theoretical Analysis and Similar Simulation of Mining Slope Slippage

The goaf formed by underground mining operation will lead to different degrees of movement and deformation of the overlying stratum and the surface in a certain area above the goaf [2]. Compared with the horizontal surface, the movement and deformation of the slope surface are significantly increased, which makes it difficult to predict the surface movement and deformation, and to evaluate the disaster. Therefore, based on the numerical simulation results of the slope stability after mining, theoretical analysis and similar simulation are used to investigate the slip of mining slope surface.

5.1. Additional Deformation of Mining Slope Slip

As the coal seam is mined, the surface of the slope will sink and slide under the influence of mining subsidence. Therefore, the process of mining influence on slope can be divided into two aspects. On the one hand, the influence of slope terrain is ignored, and only the influence of mining on horizontal surface subsidence is considered. The traditional surface movement prediction method can be used to predict the horizontal surface subsidence. On the other hand, according to the topographic parameters of the slope, the degree of influence of mining on slope slip is determined. Assuming that the additional value of the slope slip caused by mining is R(x), the additional subsidence value (Δw(x)) and the additional horizontal movement (Δu(x)) of the slope slip caused by mining can be calculated by Equation (7) [30].
Δ w ( x ) = R ( x ) sin δ p Δ u ( x ) = R ( x ) cos δ p
The measured data show that R(x) is related to the initial subsidence w(x), mining height m, subsidence coefficient η, mining influence range r, slope angle δp, slope height hp, mining depth H and mining slip tendency [2]. Based on the regression analysis of the mining observation data of the near-horizontal ore bed with a slope angle of 10~50°, Equation (8) of the main section R(x) of the subsidence basin is obtained.
R ( x ) = K R p x h p H 1 2 m η + q x w x tan δ p
In Equation (8), KR is the slope surface mining slip tendency, which can be characterised by the inverse of the slope mining stability coefficient. p(x) is the influence function of slope height on mining slip; q(x) is the influence function of slope angle on mining slip. It is found that when the probability integral method is used to predict the movement and deformation of the slope, the expressions of p(x) and q(x) are given by Equation (9) [2].
p ( x ) = π 100 1 + tanh x r + π 3 q ( x ) = 1 + π e π x r
Equations (7)–(9) are solved simultaneously, and Equation (10) is obtained to calculate Δw(x) and Δu(x).
Δ w ( x ) = 1 K ms π 100 1 + tanh x r + π 3 h p H 1 2 m η + 1 + π e π x r w x tan δ p sin δ p Δ u ( x ) = 1 K ms π 100 1 + tanh x r + π 3 h p H 1 2 m η + 1 + π e π x r w x tan δ p cos δ p
In summary, based on the physical and mechanical parameters of slope and mining parameters, combined with the calculation results of Kms, the additional deformation value of mining slope slip can be calculated by Equation (10). In order to verify the reliability of the research results, the theoretical prediction and similar simulation test results are compared and analysed.

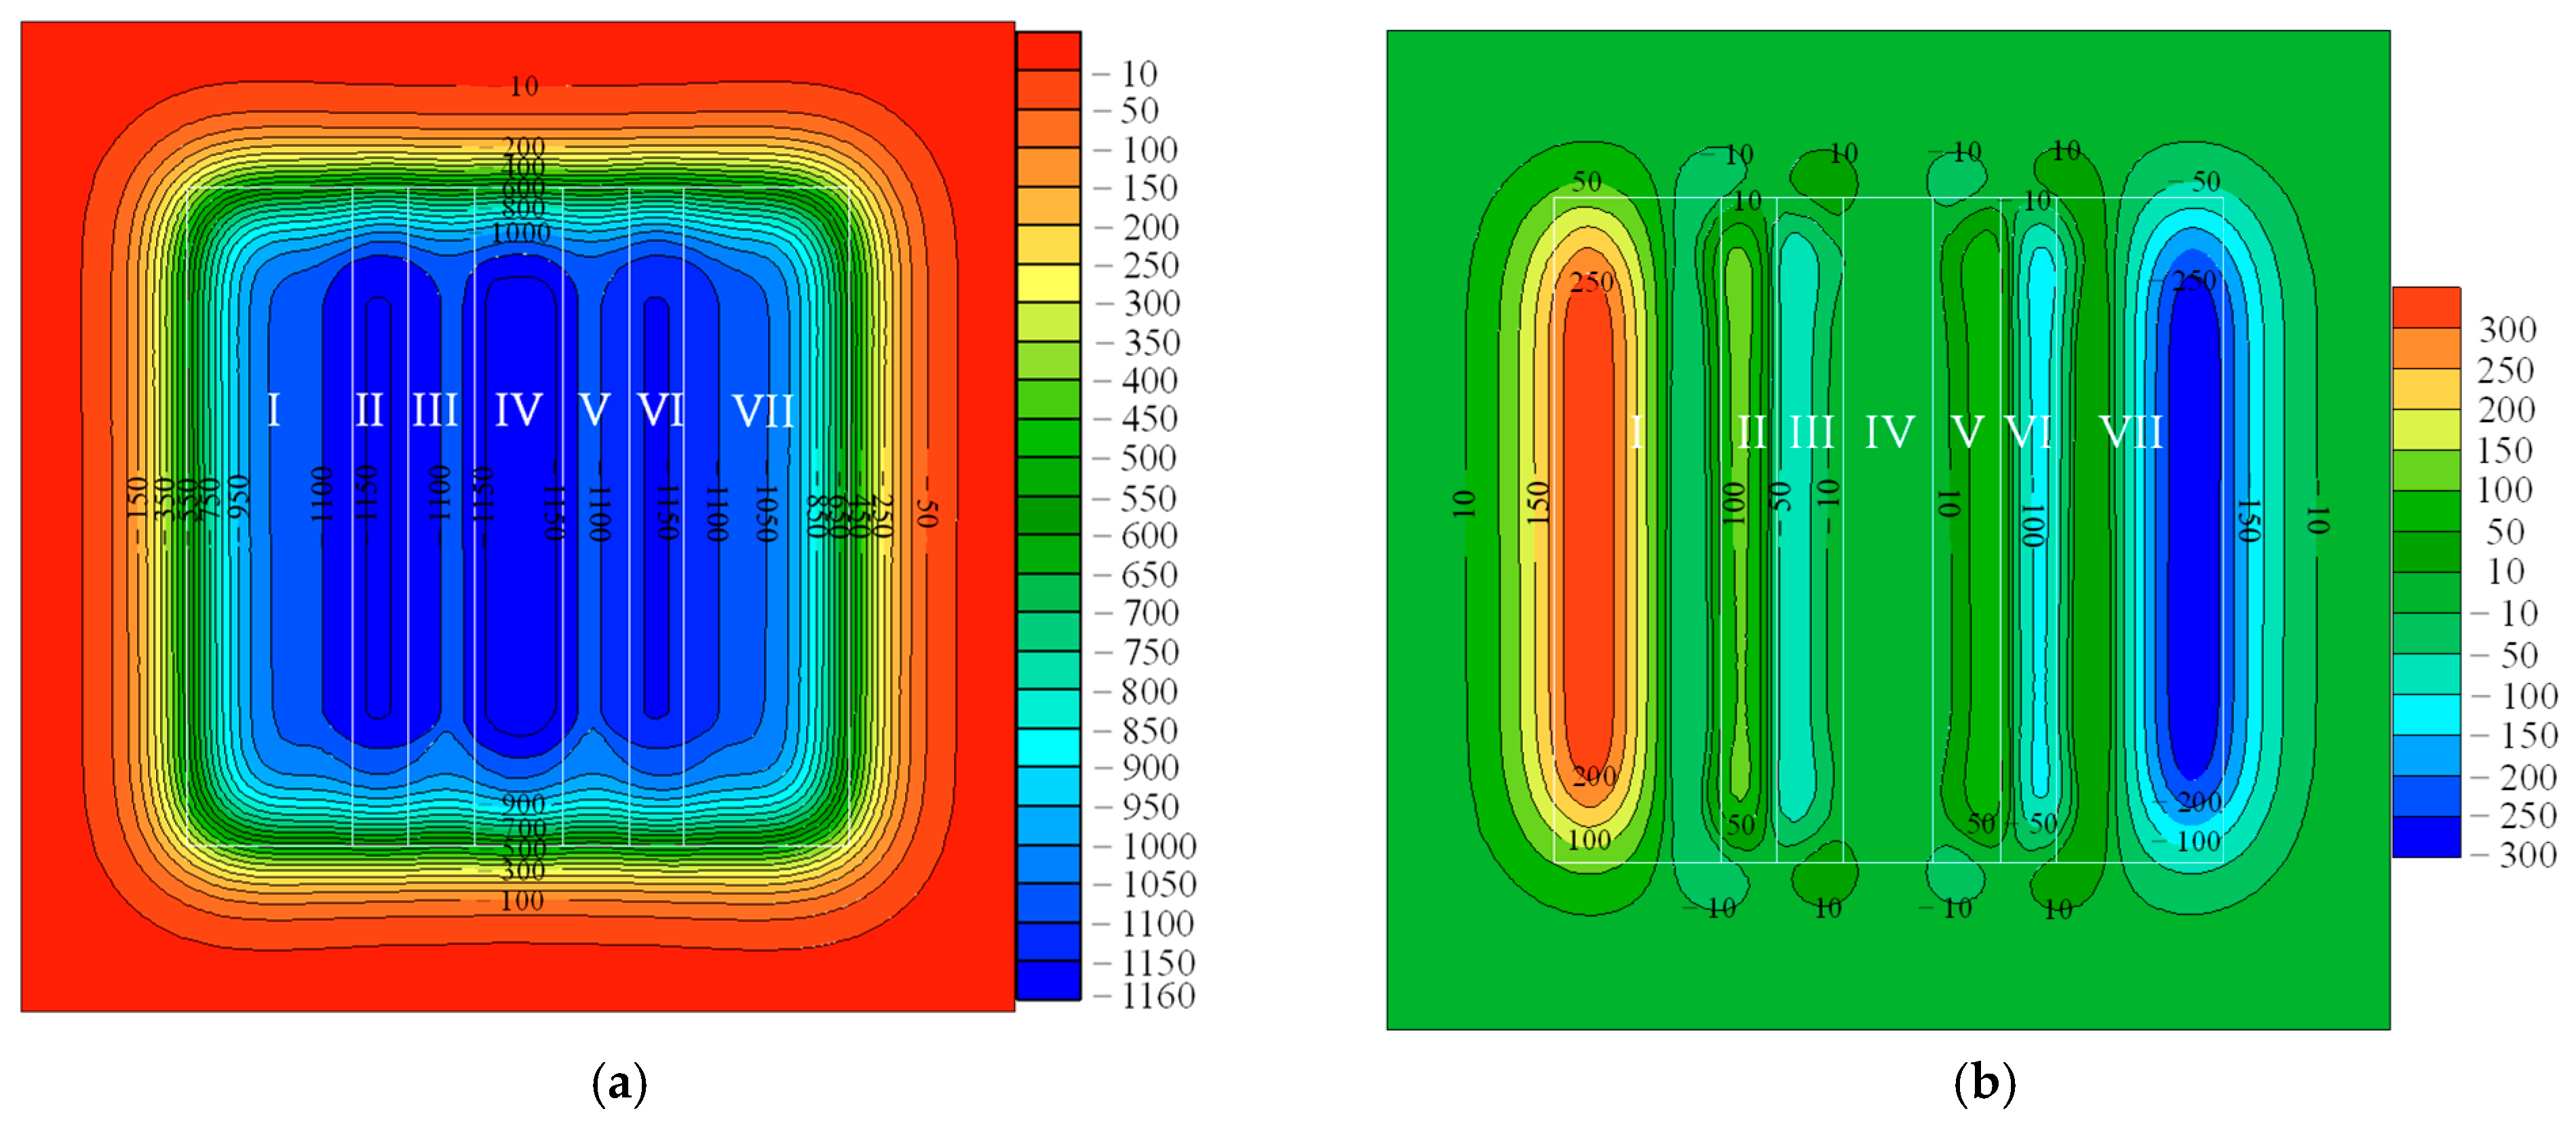
5.2. Theoretical Prediction

5.2.1. Theoretical Prediction Model

Take the mining of a working face in the Ningtiaota coal mine in northern Shaanxi, China, as a calculation case. At present, the working face is mining an almost horizontal coal seam 1−2, with an average thickness of 2 m. The buried depth of the coal seam is 74~119 m (rock stratum thickness 64 m, soil stratum thickness 10~56 m). In order to study the influence of full mining of coal seam on slope stability and slip, the mining size of working face is set to 300 m [30]. Due to the boundary effect of coal seam mining, 75 m of protective coal pillars are set on both sides of the working face. According to the slope shape of the loess slope area of the working face and the research needs of different mining directions of the working face. Two groups of slopes (ABCD and EFGH) are set up, and the slope angles are 24.7° and 45°. The example model is shown in Figure 7a.
The probability integral method, which is widely used in the field of mine subsidence prediction, is used to predict the surface movement and deformation. Due to the limitation of the slope, the probability integral method is directly used to predict the surface deformation of the slope, and the accuracy of the method is low. Therefore, the traditional prediction method is firstly optimised by using the superposition calculation principle of the probability integral [30]. As shown in Figure 7b, according to the distribution characteristics and geometric principles of rock and soil stratum, the overburden stratum and slopes are divided into seven stratum mining areas: I, II, III, IV, V, VI and VII. Then, the probability integral parameters and mining parameters of different stratum mining areas are entered, and the initial deformation of the surface is calculated. Finally, according to the initial deformation of the surface and the physical and mechanical parameters of the slope, the additional deformation value of the mining slope slip is calculated.

5.2.2. Theoretical Prediction Process and Results

According to the distribution characteristics of overlying stratum in seven stratigraphic regions in Figure 7b, the probability integral parameters of the different stratigraphic regions are determined, as shown in Table 4. cs is 69.5 kPa, φs is 30.8°, and γs is 17,400 N/m3. According to Equation (7), the mining stability coefficients of different slope areas are calculated, as shown in Table 5.
The point coordinates and corresponding predicted parameters of the different stratum are entered using the proprietary two-dimensional point matrix probability integral calculation software [31]. To ensure full mining of the working face, the inclined width of the working face is equal to the strike length, which is set to 300 m [30]. The initial subsidence nephogram and the horizontal movement nephogram of the working face are obtained by superimposing the mining area calculation, as shown in Figure 8a,b.
It can be seen from Figure 8a that the predicted maximum surface subsidence is 1159.79 mm, which is distributed in II, IV and VI in the central area of the goaf. As the corresponding division areas III and V are deeply buried, and the subsidence is relatively small, the subsidence range is 1111.28~1135.89 mm. It can be seen from Figure 8b that the horizontal movement of the central area of the goaf is close to 0, and the overall distribution is symmetrical. The maximum horizontal movement is expected to be ±299.2 mm, which is just above the inflection point of the goaf. Therefore, the predicted basin from the superposition calculation is basically consistent with the surface movement and deformation [2]. The subsidence and horizontal movement curves of the surface section are obtained respectively along the central direction of the working face. According to the calculation results of the Kms in Table 5 and Equation (10), the additional value of the mining slope slip is calculated, and the movement deformation curve is corrected and summarised in Figure 9.
Figure 9 shows that AB, CD, EF and GH slopes have different degrees of slippage. The additional deformation of the mining slope slip is positively correlated with the initial subsidence value of the slope surface, and negatively correlated with the mining stability. The Kms of CD and EF slopes are 0.80 and 0.78, respectively, and there is a risk of landslide. Therefore, the maximum increment of slippage is located in the CD and EF slopes. The average increment of subsidence of the CD and EG slopes is 99.08~100.29 mm and 101.63~104.40 mm, respectively, and the average increment of horizontal movement is 98.36~101.78 mm and 100.88~104.40 mm, respectively. As the EF slope is mined along the slope, the Kms is relatively low (0.78) and the slope position is close to the central area of the goaf. Under the combined effect of mining subsidence and slope slip, the maximum subsidence of the slope surface (1264.32 mm) is located at the top of the EF slope. In addition, the Kms of the AB and GH slopes are 1.37 and 1.41, respectively. The slope is only slightly slipped by mining, and there are no landslides. The average additional subsidence of the mining slope slip of the AB and GH slopes is 22.29 mm and 21.69 mm, respectively, and the average additional horizontal movement of the mining slope slip is 48.45 mm and 47.15 mm, respectively.

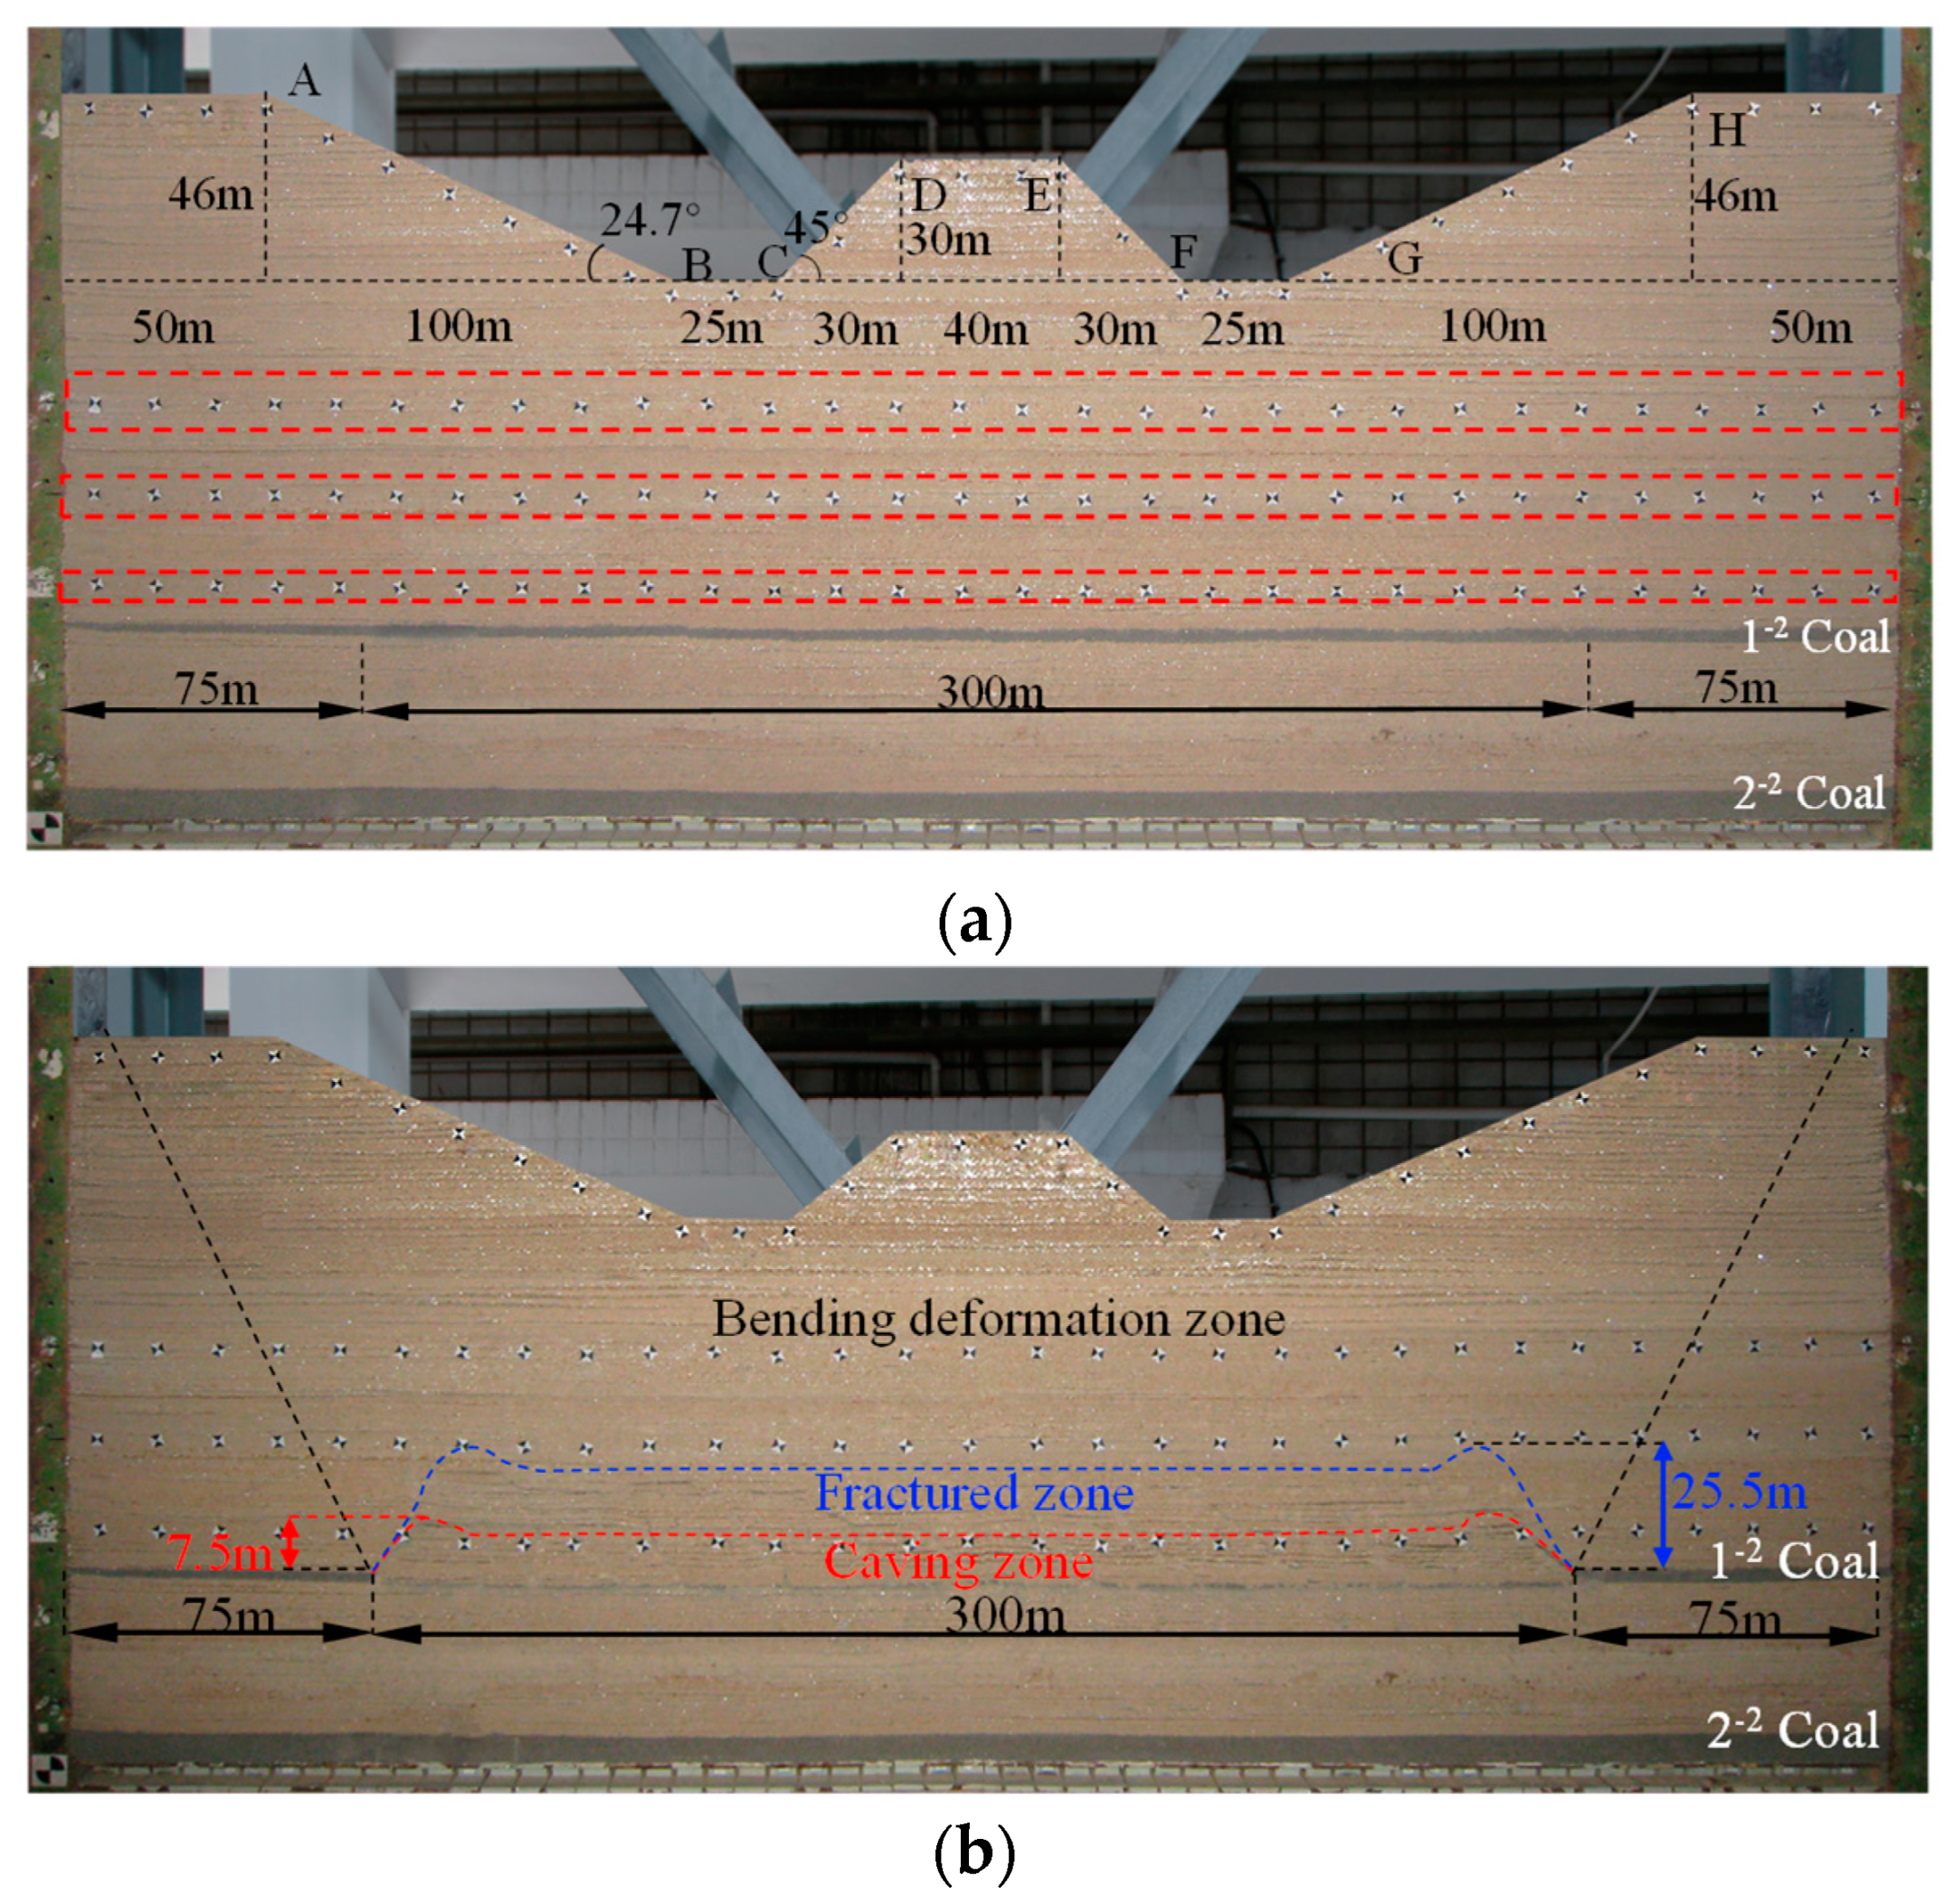
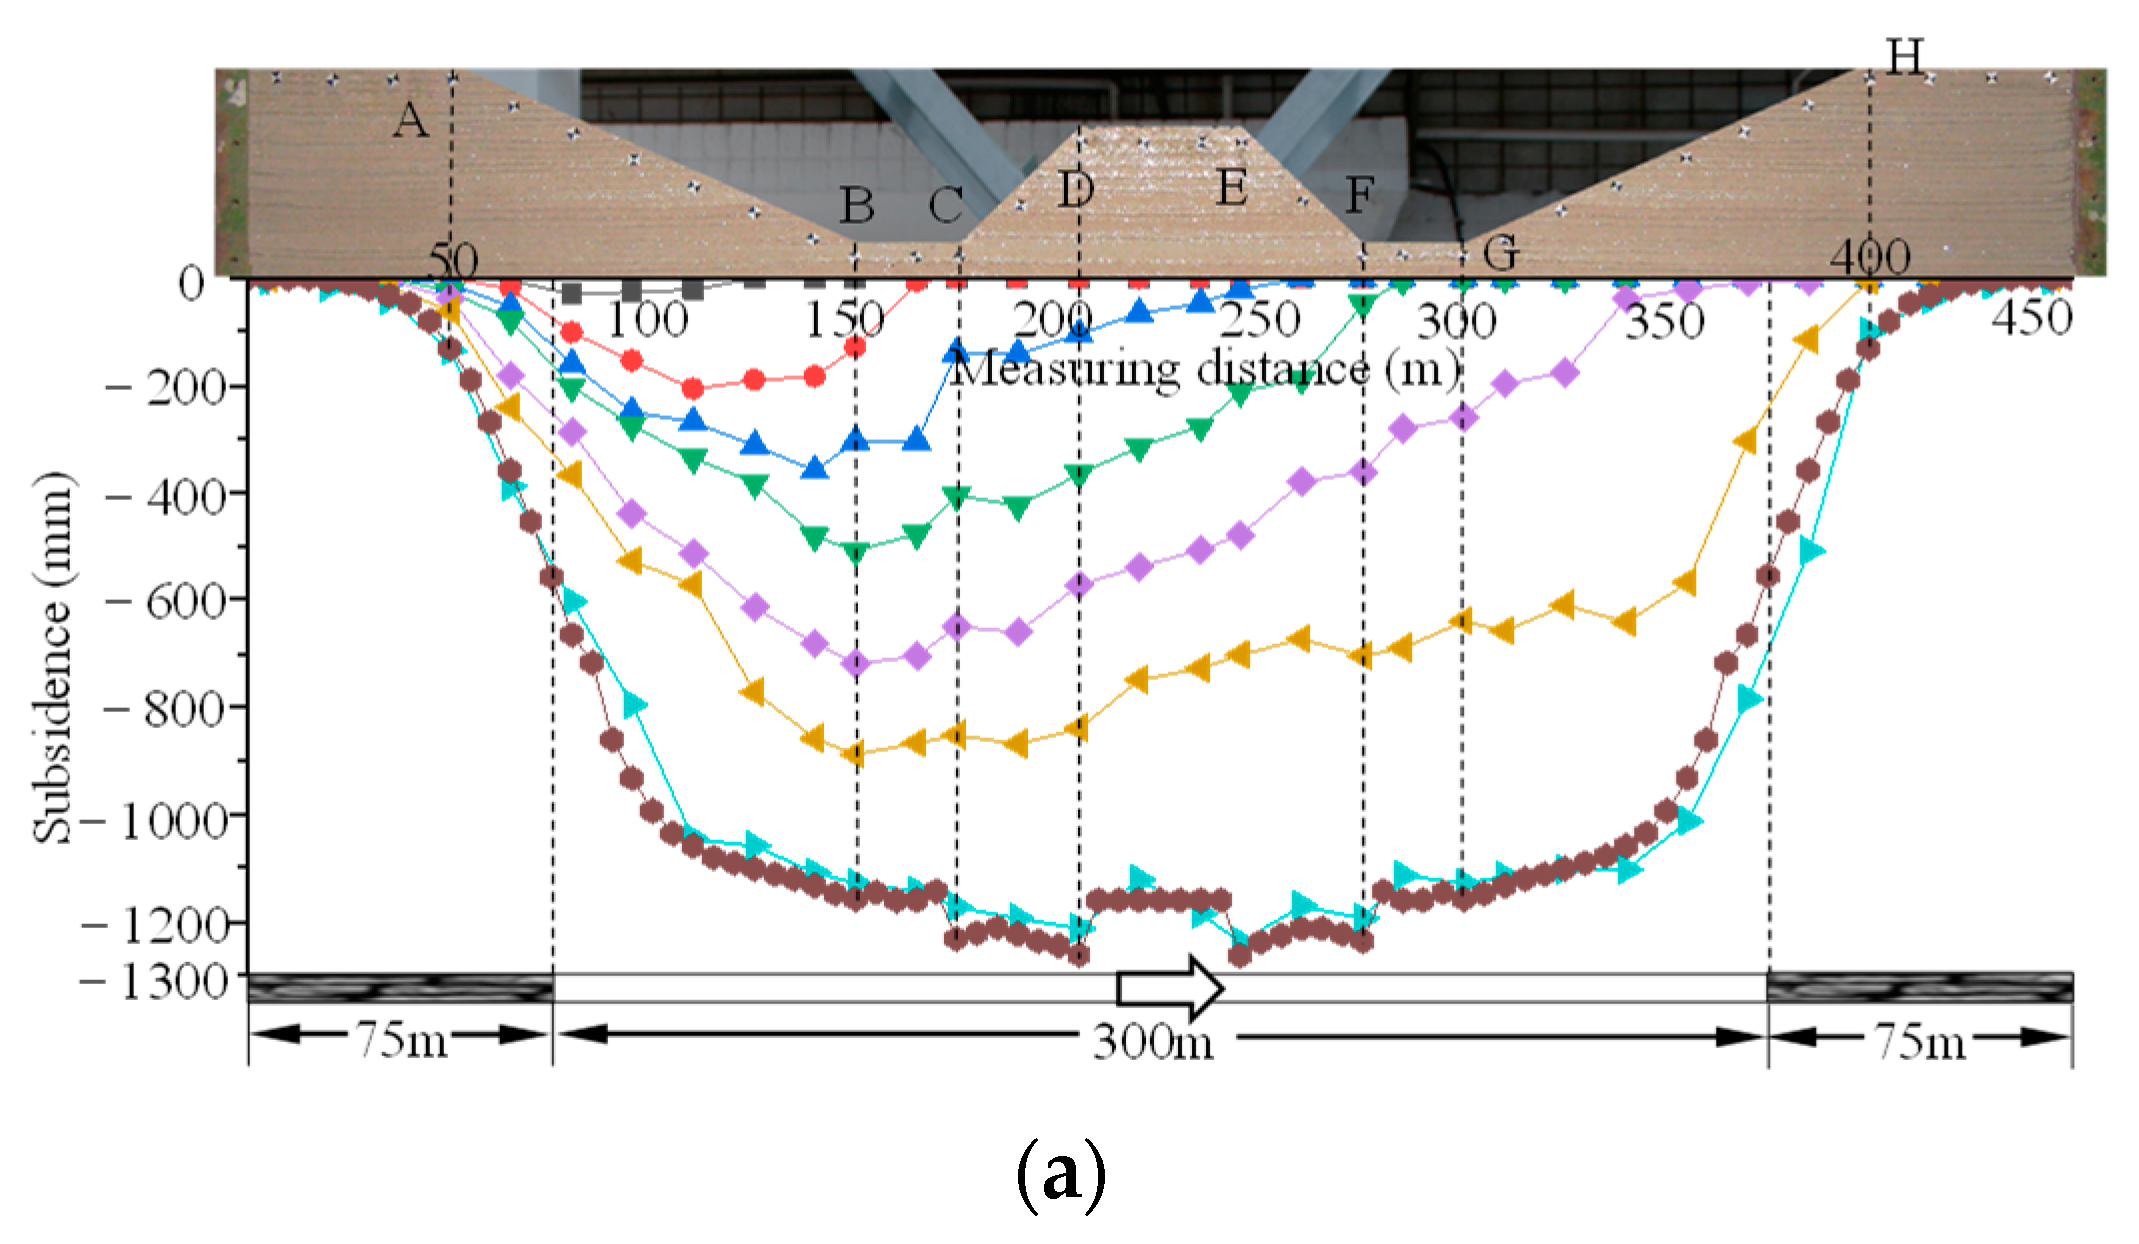
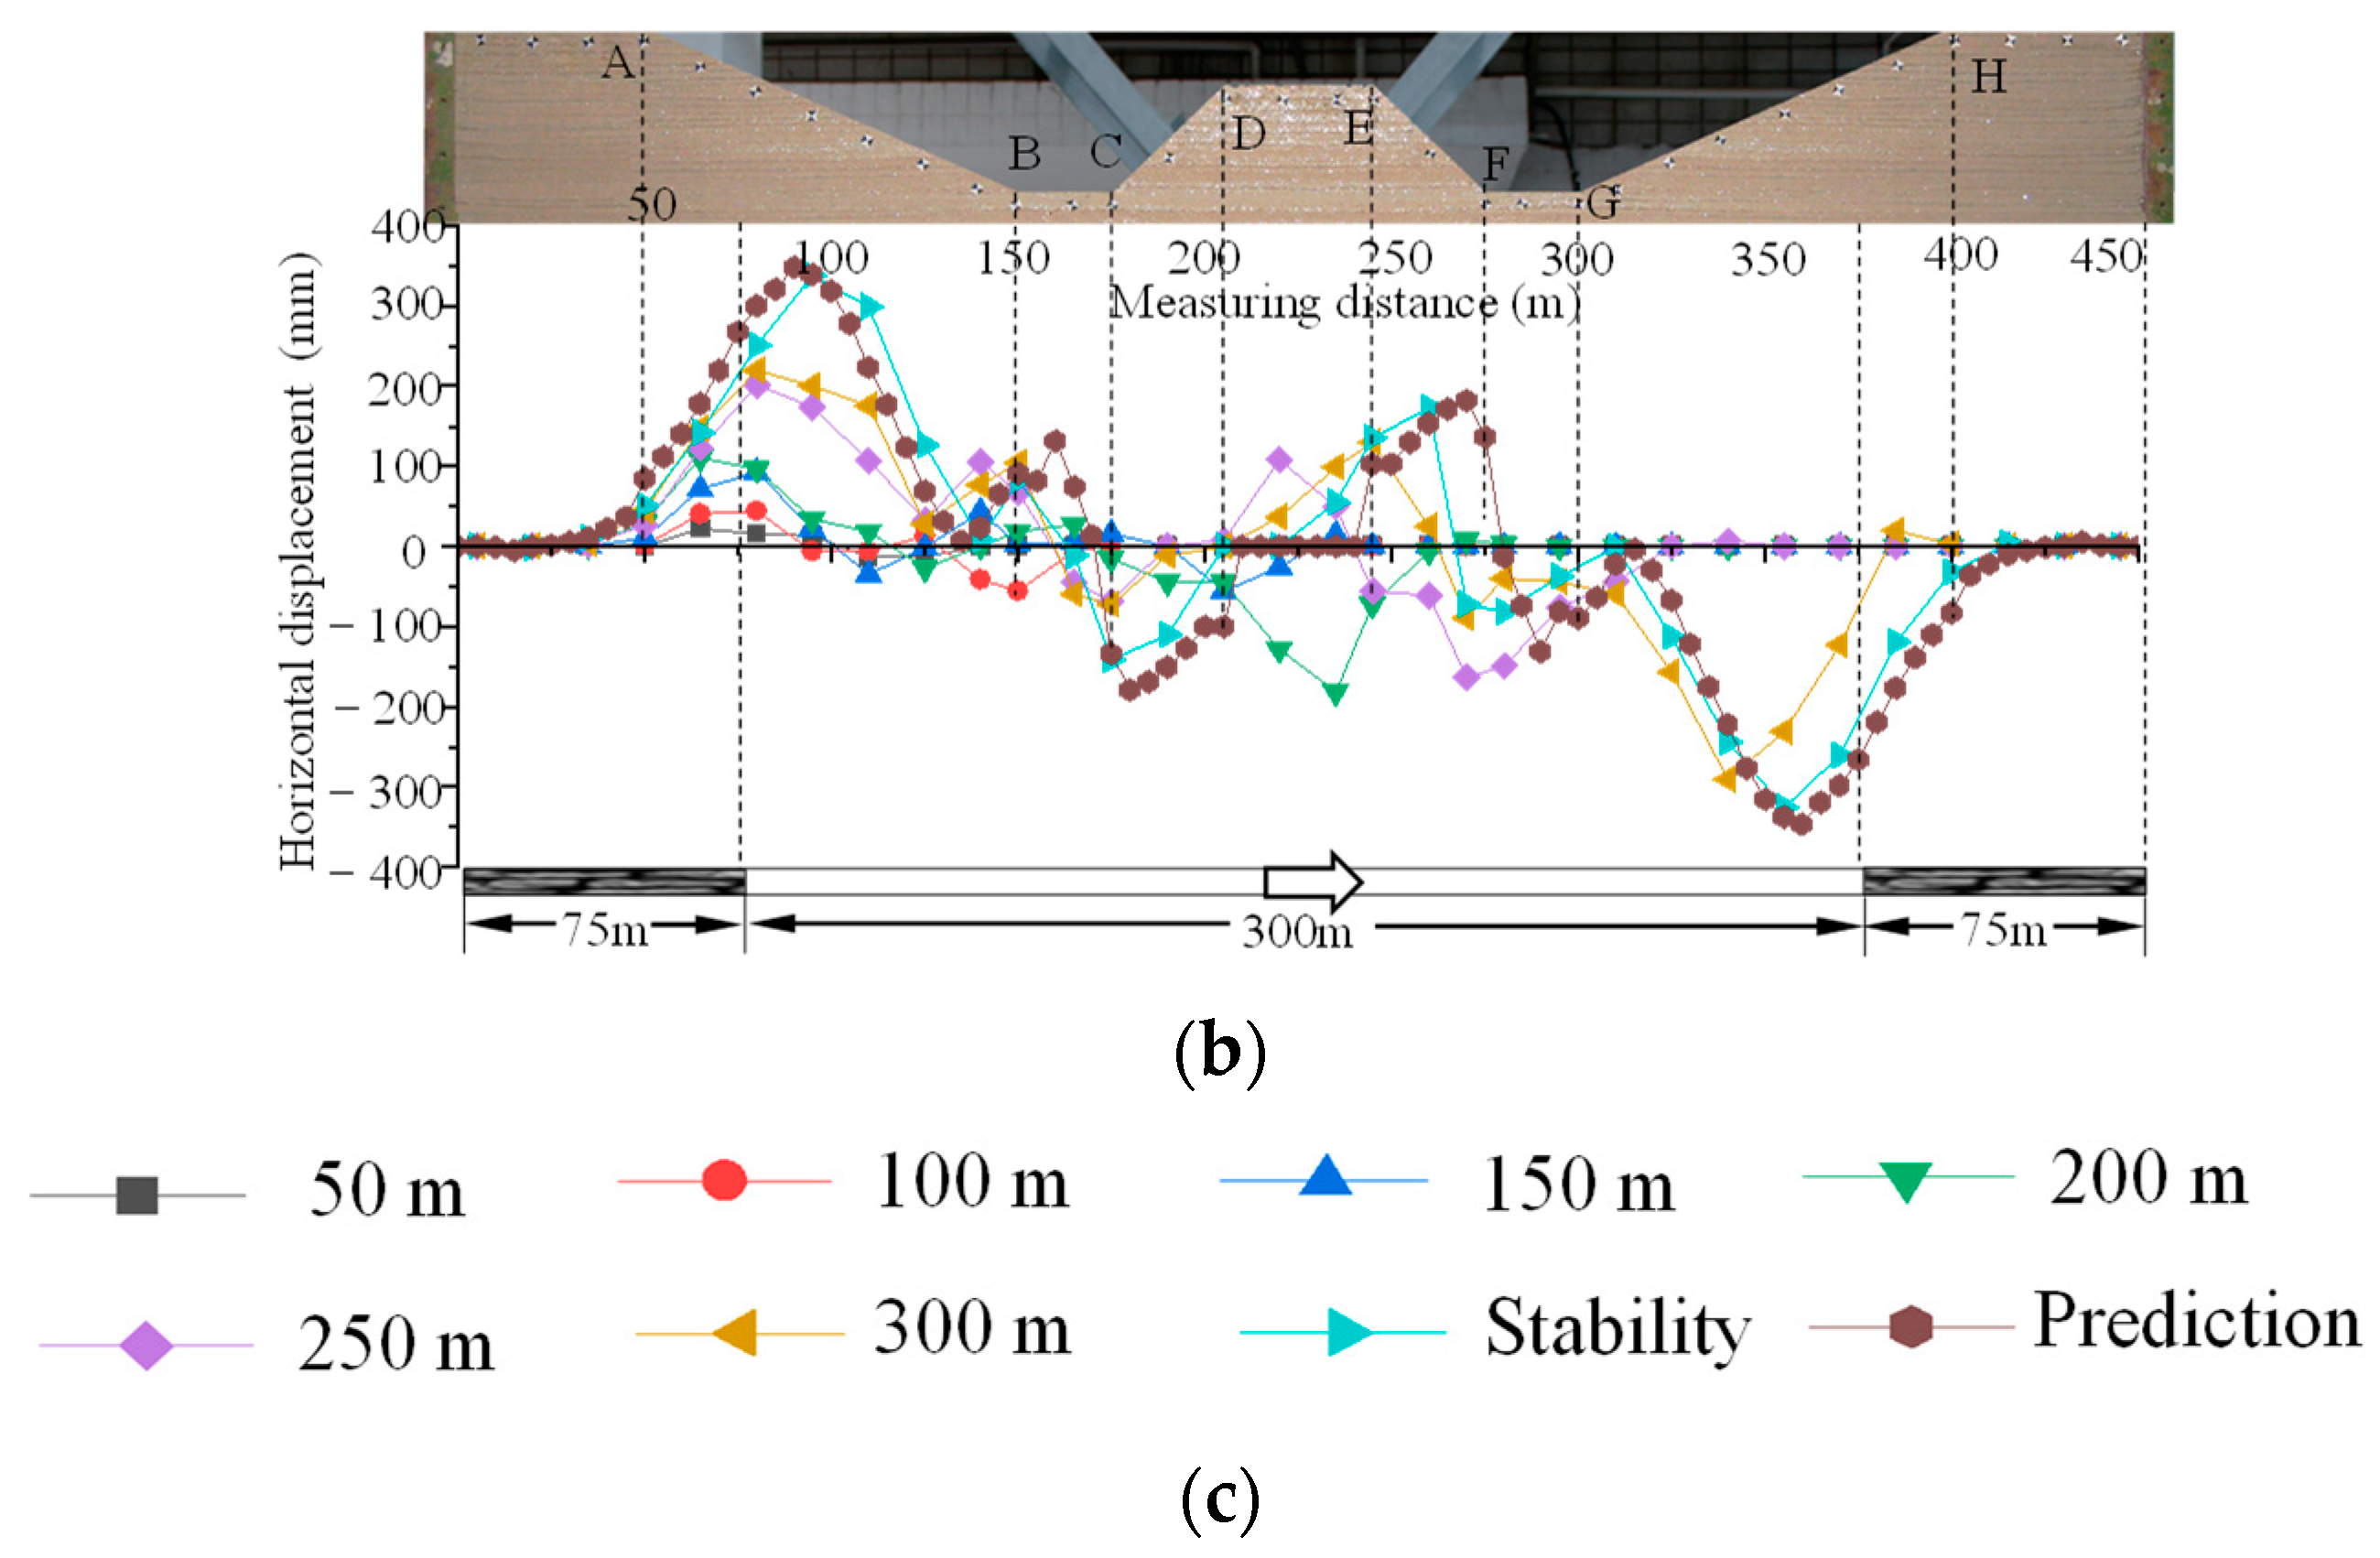
5.3. Similar Simulation Test

To verify the accuracy of the theoretical prediction results, an example model was built using artificial materials in a certain proportion. The theoretical prediction model is a three-dimensional model with a length of 450 m, a width of 450 m and a height of 73.5~120 m. In order to realise the whole visualization of movement and deformation of mining slope surface, a two-dimensional experimental device was used for simulation. According to the surface and stratum distribution of the example model in Figure 7, a similar simulation test model was built with a geometric similarity ratio of 1:150. At the same time, as there is no limit to the displacement in the Y-direction of the model, the Y direction of the model meets the requirement of full mining [32]. The model was 3000 mm long, 20 mm wide and 490~800 mm high, as shown in Figure 10a. Clay, river sand, glycerine and Vaseline were chosen to simulate the soil material. River sand, gypsum and flour were chosen as rock material. The material strength similarity ratio was 1:150, and the interlayer joints of the rock layer were simulated by mica powder. The measurement lines were placed on the surface and in the thick and hard rock stratum respectively. The horizontal spacing of the measuring points was 15 m, and the spacing of the measuring points at the inflection point of the surface slope was appropriately increased or decreased. The time similarity ratio was 1:13, and the coal seam mining process was simulated by manually controlling the mining time. The model changes after 300 m coal mining are shown in Figure 10b.
As the coal seam advances from 0 m to 300 m, the height of the caving zone and the height of the fracture zone increase with the increase in advancing distance. Figure 10b shows that full mining is achieved when the coal seam is mined for 300 m. The height of the caving zone and the fracture zone reach the maximum values of 7.5 m and 25.5 m, respectively. At this point, the slope area is in the bending subsidence zone and the deformation is continuous. High-precision total station measurement was used to record the dynamic movement and deformation process of the slope surface during coal seam mining. The movement and deformation curve of surface during the mining process and the theoretical prediction curve in Figure 9 are summarised in Figure 11.
Figure 11 shows that the surface movement and deformation change with the increase of coal seam mining distance, and the surface movement and deformation stop changing when the subsidence basin is completely stable. The maximum surface subsidence value is 1239.14 mm, located at the top of the EF slope. The maximum horizontal movement values of the surface are 337.38 mm and 346.18 mm, respectively, 20 m and 10 m from the edge of the goaf. Compared with the theoretical prediction results, it can be seen that the deviation between the theoretical prediction results of the maximum subsidence value and the experimental results is 2.03%, and the deviation of the maximum horizontal movement value is between 3.30% and 6.43%. The theoretically predicted extreme position is basically in agreement with the experimental results.
In conclusion, the calculation equation of mining loess slope slip with Kms as the key parameter is established by strata movement theory and probability integral theory, and a prediction method of loess slope surface movement and deformation in underground coal seam mining is designed. The theoretical prediction and similar simulation results show that, based on the average maximum subsidence (1129.44 mm) at the centre of the goaf of the test model, the maximum additional value of mining slope slip is 109.70 mm and the theoretical maximum additional value of mining slope slip is 104.40 mm, with a deviation of 4.84%. The test results verify the impact of slope stability on slope slip, indicating that the main factor affecting the mining slope slip is the mining slip tendency, and its value mainly depends on the slope stability before mining and underground mining parameters. On the other hand, the theoretical prediction results are basically consistent with the similar simulation test results, and the method could be used to evaluate the surface mining damage of loess slope.

6. Conclusions

In order to improve the accuracy of loess slope movement and deformation prediction and the reliability of geological disaster assessment, the influence mechanism of underground coal seam mining on the stability and slip of loess slope was studied by means of theoretical analysis, numerical simulation and a similar simulation test. The following conclusions are drawn.
(1)
Based on the slope stability theory and numerical simulation results, the calculation equation of the mining slope stability coefficient of loess slope (Kms) with different mining directions is derived, and whether mining induces slope instability and landslide is judged. When Kms > 1, the stability is good; mining only causes the loess slope to slip and does not induce landslides. When 0.95 ≤ Kms ≤ 1, the stability is poor and there is a potential risk of loess slope landslide induced by mining. When Kms < 0.95, the stability is very poor and the risk of mining induced loess slope landslides is higher.
(2)
The impact of mining along the slope and mining against the slope on Kms is basically the same. However, due to the superposition of slope movement caused by mining subsidence and slope slip tendency, the slope stability of mining against the slope is slightly higher than that of mining along the slope.
(3)
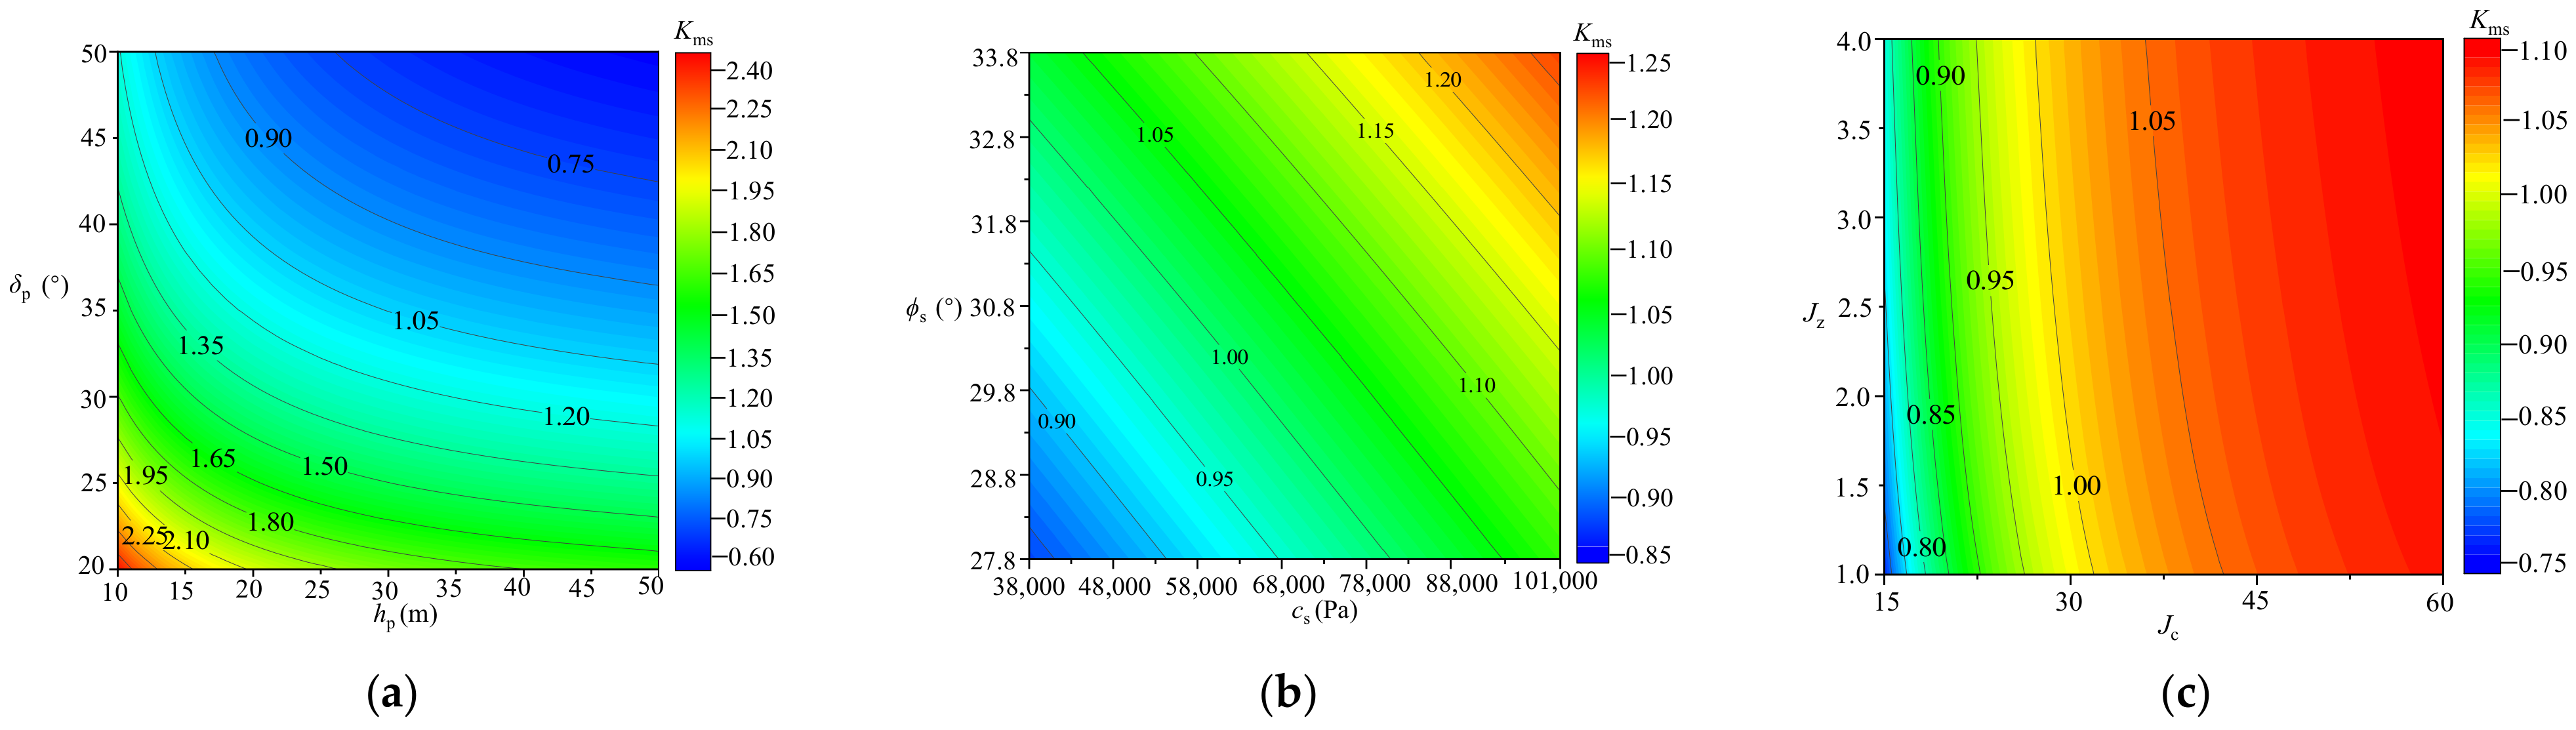
The sensitivity of different factors affecting the mining stability of loess slope from large to small is δp (0.828), hp (0.675), Jc (0.662), Jz (0.648), γs (0.615), φs (0.624) and cs (0.568). δp and hp are the main factors affecting Kms. Jc and Jz are positively correlated with Kms, and the correlation is relatively strong. The range of variation of the mechanical parameters of the loess slope (γs, φs and cs,) is small, and the influence on Kms is weak.
(4)
The calculation equation of mining loess slope slip with Kms as the key parameter is established by strata movement theory and probability integral theory, and a prediction method of loess slope surface movement and deformation in underground coal seam mining is designed. The deviation between the theoretical prediction results of the maximum subsidence value and the experimental results is 2.03%, the deviation of the maximum horizontal movement value is between 3.30% and 6.43% and the predicted results basically meet the engineering requirements.

Author Contributions

This article is presented by the four authors mentioned, each of whom were responsible for various aspects of the work. Conceptualization, B.Z. and Y.G.; methodology, B.Z. and Y.G.; software, B.Z. and Y.G.; validation, B.Z. and Y.G.; formal analysis, Y.G.; investigation, B.Z. and Y.G.; resources, B.Z.; data curation, B.Z.; writing—original draft preparation, Y.G.; writing—review and editing, B.Z., W.W. and S.H.; visualization, Y.G.; supervision, W.W. and S.H.; project administration, B.Z.; funding acquisition, B.Z. All authors have read and agreed to the published version of the manuscript.

Funding

This research was funded by the National Natural Science Foundation of China through (Grant Nos. 51874230 and 52074208).

Institutional Review Board Statement

Not applicable.

Informed Consent Statement

Not applicable.

Data Availability Statement

Not applicable.

Conflicts of Interest

The authors declare no conflict of interest.

Nomenclature

Latin characters
csloess cohesion (Pa)
hpslope height (m)
Jcratio of rock stratum thickness to mining height
Jzratio of rock stratum thickness to soil stratum thickness
Ksstability coefficient of slope
Kmsstability coefficient of mining slope
Hmining depth (m)
mmining height (m)
nmrate of change of slope stability before and after mining
p(x)influence function of slope height on mining slip
q(x)influence function of slope angle on mining slip
rmining influence range (m)
R(x)influence function of additional value of the mining slope slip
w(x)influence function of mining subsidence
Greek characters
δpslope angle (°)
γsloess volume weight (N/m3)
φsloess internal friction angle (°)
ηsubsidence coefficient
Δu(x)additional horizontal movement value (mm)
Δw(x)additional subsidence value (mm)
Abbreviations
FEMFinite element method
LEMLimit equilibrium method

References

  1. Zhao, B.C.; Tong, C.; Liu, Z.R. Characteristics of mining-induced surface damage in western ecological fragile region. J. Cent. South Univ. 2017, 48, 2990–2997. [Google Scholar]
  2. Yu, X.Y.; Zhang, E.Q. Mining Damage Science; China Coal Industry Publishing House: Beijing, China, 2010. [Google Scholar]
  3. Feng, J.; Wang, S.J.; Hou, E.K.; Ding, X.; Duan, H.J. Determining the Height of Water-Flowing Fractured Zone in Bedrock-Soil Layer in a Jurassic Coalfield in Northern Shaanxi, China. Adv. Civ. Eng. 2021, 2021, 9718802. [Google Scholar] [CrossRef]
  4. Huang, Q.X. Research on roof control of water conservation mining in shallow seam. J. China Coal Soc. 2017, 42, 50–55. [Google Scholar] [CrossRef]
  5. Bai, Q.S.; Tu, S.H.; Yuan, Y.; Wang, F.T. Back analysis of mining induced responses on the basis of goaf compaction theory. J. China Univ. Min. Technol. 2013, 42, 355–369. [Google Scholar] [CrossRef]
  6. Ma, S.; Qiu, H.; Yang, D.; Wang, J.; Zhu, Y.; Tang, B.; Sun, K.; Cao, M. Surface multi-hazard effect of underground coal mining. Landslides 2023, 20, 39–52. [Google Scholar] [CrossRef]
  7. Yu, X.Y.; Mao, X.W. A preliminary discrimination model of a deep mining landslide and its application in the Guanwen coal mine. Bull. Eng. Geol. Environ. 2020, 79, 485–493. [Google Scholar] [CrossRef]
  8. Hou, H.P.; Ding, Z.Y.; Zhang, S.L.; Guo, S.C.; Yang, Y.J.; Chen, Z.X.; Mi, J.X.; Wang, X. Spatial estimate of ecological and environmental damage in an underground coal mining area on the Loess Plateau: Implications for planning restoration interventions. J. Clean. Prod. 2021, 287, 125061. [Google Scholar] [CrossRef]
  9. Guo, W.B.; Yu, X.Y.; Liu, Z.Y. Analysis of Mining Subsidence Disasters in Loess Gully Areas and its Control Countermeasures. Appl. Mech. Mater. 2015, 737, 456–460. [Google Scholar] [CrossRef]
  10. Liu, H.; Deng, K.Z.; Lei, S.G.; Bian, Z.F. Mechanism of formation of sliding ground fissure in loess hilly areas caused by underground mining. Int. J. Min. Sci. Technol. 2015, 25, 553–558. [Google Scholar] [CrossRef]
  11. Alimohammadlou, Y.; Najafi, A.; Yalcin, A. Landslide process and impacts: A proposed classification method. Catena 2013, 104, 219–232. [Google Scholar] [CrossRef]
  12. Huang, Y.H. Slope Stability Analysis by the Limit Equilibrium Method: Fundamentals and Methods; American Society of Civil Engineers: Reston, VA, USA, 2014. [Google Scholar] [CrossRef]
  13. Karthik, A.V.R.; Manideep, R.; Chavda, J.T. Sensitivity analysis of slope stability using finite element method. Innov. Infrastruct. Solut. 2022, 7, 184. [Google Scholar] [CrossRef]
  14. Ozbay, A.; Cabalar, A.F. FEM and LEM stability analyses of the fatal landslides at Çöllolar open-cast lignite mine in Elbistan, Turkey. Landslides 2015, 12, 155–163. [Google Scholar] [CrossRef]
  15. Kumar, N.; Verma, A.K.; Sardana, S.; Sarkar, K.; Singh, T.N. Comparative analysis of limit equilibrium and numerical methods for prediction of a landslide. Bull. Eng. Geol. Environ. 2018, 77, 595–608. [Google Scholar] [CrossRef]
  16. Vanneschi, C.; Eyre, M.; Burda, J.; Žižka, L.; Francioni, M.; Coggan, J.S. Investigation of landslide failure mechanisms adjacent to lignite mining operations in North Bohemia (Czech Republic) through a limit equilibrium/finite element modelling approach. Geomorphology 2018, 320, 142–153. [Google Scholar] [CrossRef]
  17. Cheng, H.; Zhou, X.P. A novel displacement-based rigorous limit equilibrium method for three-dimensional landslide stability analysis. Can. Geotech. J. 2015, 52, 2055–2066. [Google Scholar] [CrossRef]
  18. Tolovkhan, B.; Demin, V.; Amanzholov, Z.; Smagulova, A.; Tanekeyeva, G.; Zairov, S.; Krukovskyi, O.; Cabana, E. Substantiating the rock mass control parameters based on the geomechanical model of the Severny Katpar deposit, Kazakhstan. Min. Miner. Depos. 2022, 16, 123–133. [Google Scholar] [CrossRef]
  19. Nie, L.; Li, Z.C.; Zhang, M.; Xu, L.N. Deformation characteristics and mechanism of the landslide in West Open-Pit Mine, Fushun, China. Arab. J. Geosci. 2015, 8, 4457–4468. [Google Scholar] [CrossRef]
  20. Xie, L.F.; Yan, E.C.; Ren, X.B.; Lu, G.D. Sensitivity analysis of bending and toppling deformation for anti-slope based on the grey relation method. Geotech. Geol. Eng. 2015, 33, 35–41. [Google Scholar] [CrossRef]
  21. Sun, S.G.; Zhang, Y.J.; Miao, Z.Z.; Wang, J.; Xie, Y. Effect of Slope Stability during Transition from Open-pit and Underground Mining. Met. Mine 2016, 45, 171–174. [Google Scholar] [CrossRef]
  22. Salmi, E.F.; Nazem, M.; Karakus, M. Numerical analysis of a large landslide induced by coal mining subsidence. Eng. Geol. 2017, 217, 141–152. [Google Scholar] [CrossRef]
  23. Fernández, P.R.; Granda, G.R.; Krzemień, A.; Cortés, S.G.; Valverde, G.F. Subsidence versus natural landslides when dealing with property damage liabilities in underground coal mines. Int. J. Rock Mech. Min. Sci. 2020, 126, 104175. [Google Scholar] [CrossRef]
  24. Marschalko, M.; Yilmaz, I.; Bednárik, M.; Kubečka, K.; Bouchal, T.; Závada, J. Subsidence map of underground mining influence for urban planning: An example from the Czech Republic. Q. J. Eng. Geol. Hydrogeol. 2012, 45, 231–241. [Google Scholar] [CrossRef]
  25. Yuan, M.Z.; Li, M.; Liu, H.; Lv, P.Y.; Li, B.; Zheng, W.B. Subsidence monitoring base on SBAS-InSAR and slope stability analysis method for damage analysis in mountainous mining subsidence regions. Remote Sens. 2021, 13, 3107. [Google Scholar] [CrossRef]
  26. Yang, D.D.; Qiu, H.J.; Ma, S.Y.; Liu, Z.J.; Du, C.; Zhu, Y.R.; Cao, M.M. Slow surface subsidence and its impact on shallow loess landslides in a coal mining area. Catena 2022, 209, 105830. [Google Scholar] [CrossRef]
  27. Tang, F.Q.; Huang, H.; Sun, X.Y.; Qiao, D.J.; Bai, F. The influence of mining subsidence on terrain factors in gully region of loess. J. Arid. Land Resour. Environ. 2016, 30, 124–128. [Google Scholar] [CrossRef]
  28. Sun, X.Y.; Zhang, H.X.; Lu, M.J.; Li, C.; Miao, L.T. The development law of surface cracks in shallow coal seam mining through doublegullies terrain. Coal Geol. Explor. 2021, 49, 212–229. [Google Scholar] [CrossRef]
  29. Liu, T.T.; Lu, G.B.; Tong, L.M. Numerical simulation study of the influence on stability of slope by underground mining under opencast coal mine slope. J. Coal Sci. Eng. 2011, 17, 397–400. [Google Scholar] [CrossRef]
  30. Zhao, B.C.; Guo, Y.X.; Mao, X.X.; Zhai, D.; Zhu, D.F.; Huo, Y.M.; Sun, Z.D.; Wang, J.J. Prediction Method for Surface Subsidence of Coal Seam Mining in Loess Donga Based on the Probability Integration Model. Energies 2022, 15, 2282. [Google Scholar] [CrossRef]
  31. Takhanov, D.; Muratuly, B.; Rashid, Z.; Kydrashov, A. Geomechanics substantiation of pillars development parameters in case of combined mining the contiguous steep ore bodies. Min. Miner. Depos. 2021, 15, 50–58. [Google Scholar] [CrossRef]
  32. Yanli, H.; Jixiong, Z.; Baifu, A.; Qiang, Z. Overlying strata movement law in fully mechanized coal mining and backfilling longwall face by similar physical simulation. J. Min. Sci. 2011, 47, 618–627. [Google Scholar] [CrossRef]
Figure 1. Analysis of the stress state of the slope before coal seam mining.
Sustainability 15 06485 g001
Figure 2. Numerical model of slope stability in mining: (a) Jz = 1.0; (b) Jz = 2.0; (c) Jz = 3.0; (d) Jz = 4.0; (e) Legend.
Sustainability 15 06485 g002
Figure 3. Contour map of maximum shear strain increment.
Sustainability 15 06485 g003
Figure 4. Calculation results of the different influence factors of the nm.
Sustainability 15 06485 g004
Figure 5. The grey correlation coefficient of different factors in the orthogonal test.
Sustainability 15 06485 g005
Figure 6. Coupling relation between related factors and Kms: (a) hp and δp; (b) cs and φs; (c) Jc and Jz.
Sustainability 15 06485 g006
Figure 7. Calculation model: (a) Initial example model; (b) Equivalent partition model; (c) Legend.
Sustainability 15 06485 g007
Figure 8. Predicted results of mining probability integral: (a) The subsidence nephogram; (b) The horizontal movement nephogram.
Sustainability 15 06485 g008
Figure 9. Prediction and correction of mining slope surface movement and deformation: (a) Subsidence; (b) Horizontal movement; (c) Legend.
Sustainability 15 06485 g009aSustainability 15 06485 g009b
Figure 10. Similar simulation test: (a) Similar simulation model; (b) 1−2 Coal seam mining 300 m.
Sustainability 15 06485 g010
Figure 11. Comparison of slope surface movement and deformation: (a) Subsidence; (b) Horizontal movement; (c) Legend.
Sustainability 15 06485 g011aSustainability 15 06485 g011b
Table 1. Slope stability evaluation criteria.
KS>10.95~10.87~0.95<0.87
Slope stability ExcellentGoodPoorVery Poor
Table 2. Range of physical and mechanical parameters of loess in northern Shaanxi coalfield.
TypeNorthern Shaanxi Loess
moisture content/(%)11.9~17.3
volumetric weight/(N/m3)16,200~18,600
ratio2.69~2.71
void ratio0.62~0.88
void degree/(%)38.3~46.9
cohesion/(kPa)38~101
angle of internal friction/(°)27.8~33.8
coefficient of compressibility/(MPa−1)0.08~0.25
modulus of compression/(MPa)7.0~22.1
unconfined compression strength/(kPa)119~159
Table 3. Value range and calculation results of influencing factors of orthogonal test.
Numberhp/(m)δp/(°)γs/(N/m3)cs/(Pa)ϕs/(°)JcJzKms
11 (10)1 (10)1 (16,200)1 (38,000)1 (27.8)1 (15.0)1 (1.0)1.29
21 (10)2 (30)2 (17,400)2 (69,500)2 (30.8)2 (37.5)2 (2.5)1.57
31 (10)3 (50)3 (18,600)3 (101,000)3 (33.8)3 (60.0)3 (4.0)1.61
42 (30)1 (10)1 (16,200)2 (69,500)2 (30.8)3 (60.0)3 (4.0)2.02
52 (30)2 (30)2 (17,400)3 (101,000)3 (33.8)1 (15.0)1 (1.0)0.81
62 (30)3 (50)3 (18,600)1 (38,000)1 (27.8)2 (37.5)2 (2.5)0.54
73 (50)1 (10)2 (17,400)1 (38,000)3 (33.8)2 (37.5)3 (4.0)1.84
83 (50)2 (30)3 (18,600)2 (69,500)1 (27.8)3 (60.0)1 (1.0)0.87
93 (50)3 (50)1 (16,200)3 (101,000)2 (30.8)1 (15.0)2 (2.5)0.49
101 (10)1 (10)3 (18,600)3 (101,000)2 (30.8)2 (37.5)1 (1.0)3.02
111 (10)2 (30)1 (16,200)1 (38,000)3 (33.8)3 (60.0)2 (2.5)1.40
121 (10)3 (50)2 (17,400)2 (69,500)1 (27.8)1 (15.0)3 (4.0)0.86
132 (30)1 (10)2 (17,400)3 (101,000)1 (27.8)3 (60.0)2 (2.5)1.98
142 (30)2 (30)3 (18,600)1 (38,000)2 (30.8)1 (15.0)3 (4.0)0.68
152 (30)3 (50)1 (16,200)2 (69,500)3 (33.8)2 (37.5)1 (1.0)0.77
163 (50)1 (10)3 (18,600)2 (69,500)3 (33.8)1 (15.0)2 (2.5)1.36
173 (50)2 (30)1 (16,200)3 (101,000)1 (27.8)2 (37.5)3 (4.0)0.95
183 (50)3 (50)2 (17,400)1 (38,000)2 (30.8)3 (60.0)1 (1.0)0.56
Table 4. Stratigraphic region probability integral parameters.
Stratigraphic RegionsSoil Stratum Thickness (m)Rock Stratum Thickness (m)Subsidence CoefficientHorizontal Displacement CoefficientIntegrated Moving Angle
(°)
Deviation Distance of Inflection Point
(m)
I33640.580.26662.313.5
II10640.580.28666.810.3
III25640.580.27263.612.4
IV40640.580.26263.714.5
V25640.580.27263.612.4
VI10640.580.28666.810.3
VII33640.580.26662.313.5
Table 5. Mining stability coefficient of slope area.
Slope RegionSlope ParametersMining ParameterResults
hp/(m)δp/(°)Mining DirectionJcJzKms
AB46.024.7Along slope32.01.941.37
CD30.045.0Against slope32.02.560.80
EF30.045.0Along slope32.02.560.78
GH46.024.7Against slope32.01.941.41
Disclaimer/Publisher’s Note: The statements, opinions and data contained in all publications are solely those of the individual author(s) and contributor(s) and not of MDPI and/or the editor(s). MDPI and/or the editor(s) disclaim responsibility for any injury to people or property resulting from any ideas, methods, instructions or products referred to in the content.

