Article

Beneficial Microorganisms in the Anaerobic Digestion of Cattle and Swine Excreta

by
Paulina-Soledad Vidal-Espinosa
1,*,
Manuel Alvarez-Vera
1,2,
Andrés Cárdenas
1,2 and
Juan-Carlos Cobos-Torres
1,2,*
1
Unidad Académica de Posgrado, Universidad Católica de Cuenca, Cuenca 010107, Ecuador
2
Unidad Académica de Ingeniería Industria y Construcción, Universidad Católica de Cuenca, Cuenca 010105, Ecuador
*
Authors to whom correspondence should be addressed.
Sustainability 2023, 15(8), 6482; https://doi.org/10.3390/su15086482
Submission received: 9 February 2023 / Revised: 31 March 2023 / Accepted: 6 April 2023 / Published: 11 April 2023
(This article belongs to the Special Issue Energy Recovery, Sustainability and Waste Management)

Abstract

:
The accumulation of solid organic waste is reaching critical levels in almost all regions of the world. It must be managed sustainably to avoid the depletion of natural resources, minimize risks to human health, reduce environmental burdens, and maintain an overall balance in the ecosystem. This research focuses on the anaerobic digestion of bovine and swine excreta with and without applying beneficial microorganisms as a viable option for recycling agricultural solid wastes. Three greenhouse gases (GHGs)—methane, carbon dioxide, and ammonia—produced by cattle and swine excreta that were treated with and without beneficial microorganisms in bioreactors were quantified. A monitoring and gas concentration measurement system was implemented inside the bioreactors. The behavior of the GHGs and the efficiency of the beneficial microorganisms in treating the farm animal waste were analyzed according to the phases of anaerobic digestion. Average reductions in the concentration in units of ppm of CH4 during the composting process of 46.95% and 34.48% were observed for the cattle and swine excreta treatments, respectively. It was concluded that the studied GHGs had different behaviors in the anaerobic digestion of the treatments in cattle and swine excreta with and without beneficial microorganisms due to the different types of feeding. However, it must be emphasized that beneficial microorganisms are an essential tool for reducing GHGs in anaerobic digestion.

1. Introduction

Several natural processes that occur in the environment emit greenhouse gases [1], such as volcanic eruptions, which are geological processes [1]. The same happens with the flatulence of cattle and the degradation of their excreta, which emits methane (CH4) due to the enteric fermentation carried out by microorganisms on the food ingested in the digestion process [1]. Although these animals emit CH4, it would not be correct to link methane from cattle and climate change because cattle are not a significant source of pollution [1]. The problem arises from the increase in animal production (intensive meat industry), which, in recent decades, has generated an 18% increase in total GHG emissions [2] based on the fact that, since the 1950s, the production of cattle, swine, and poultry has significantly increased [3]. Thus, de Blas et al. [4] found that the highest concentration of pollutant emissions in the agricultural sector was mainly due to ruminants. This was linked to a high rate of deforestation for the generation of forage pastures that the livestock sector produces due to changes in land use [5].
The accelerated exploitation of natural resources, food production, anaerobic sediments, compost piles, manure pits, sewage, and landfills has sharply increased due to population dynamics worldwide [6]. In addition, indiscriminate water consumption and the disposal of biological waste are several causes of increased environmental pollution, becoming a driving force of global climate change [7]. For example, since the 1980s, there has been a surge in demand for livestock products in the Organization for Economic Cooperation and Development (OECD) [8,9]. Thus, it has been estimated that the livestock industry produces seven gigatons (GTs) of GHG pollutants per year (40% of this pollution comes from cattle), which is similar to the amount produced by vehicles [9].
There is great concern among environmental organizations worldwide, with a particular interest in the increase in environmental pollution on a global scale. For instance, studies are currently being conducted in Iran [10], Indonesia [11], Israel [12], and Pakistan [13], among others, on the utilization of GHGs in renewable energy and their transformation into different raw materials in order to decrease pollution, as well as on the search for waste treatment and management mechanisms for obtaining biogas through CH4 and, thus, generating energy. Meanwhile, in developing countries, such as Argentina, projects have been carried out to capture and measure methane gas from cattle through cannulas that are inserted into the animal’s body; then, the gas is transformed it into biofuel. However, this project failed because it is painful to keep a foreign device inside a ruminant [14].
Currently, studies are focused on using waste through a thermal or burning process for solid waste treatment without considering that thermal oxidation processes affect the environment and human health [8]. Therefore, this strategy is being changed, and now the goal is to reduce methane emissions produced by animals and their waste by using microorganisms that could compete with methanogenic bacteria and redirect hydrogen away from methanogenesis, which has become a promising method for ruminal methane mitigation [15]. For instance, Cai et al. [16] found that iron can function as an acceptor within a bioreactor for anaerobic methane oxidation mediated by microorganisms, thus decreasing CH4 emissions in the atmosphere. Likewise, Pelcastre et al. [17] showed how the foliage of tropical tree and shrub species significantly affects the reduction in methanogenesis in ruminants due to an improvement in the nutritional quality of their diet, as well as the presence of secondary metabolites.
On the other hand, Eugène et al. [18] conducted a systematic analysis of the quality and type of forage and its influence on the decrease in methane gas emissions due to the ease of digestion of forage. These researchers concluded that good-quality forage would reduce the carbon footprint of livestock and agriculture and improve productive ruminants’ efficiency in developing and developed countries. However, Aboagye and Beauchemin [19] emphasized the lack of studies on the effects of tannins on intake, digestibility, ruminal fermentation, and methane production. For example, Sánchez [20] demonstrated how using brewer’s yeast (Saccharomyces cerevisiae) in ruminant feed does not significantly reduce methane production; however, the author recommended strengthening the study with different yeast doses, application in other strains, and the development of experimental designs.
There are many alternatives for reducing GHGs, but they can be very costly [21]. In other cases, feeding animals a feed supplement could harm human health or be traumatic for the animals [21]. However, there are other less aggressive alternatives for minimizing GHGs, such as treating animal excreta with microorganisms [10,11,12,13].
Therefore, this study aimed to quantify the GHGs (methane, carbon dioxide, and ammonia) produced by cattle and swine excreta that were treated with beneficial microorganisms by implementing a system for measuring and accounting for gas concentrations with phases analysis during anaerobic fermentation. This will make it possible to visualize the behavior of GHGs and determine beneficial microorganisms’ efficiency in treating farm animal waste. The study is based on the hypothesis that using beneficial microorganisms can decrease GHGs by varying environmental factors, such as temperature and humidity [11]. Additionally, a more significant decrease in GHGs generated by swine excreta than by cattle excreta is expected [22], which is mainly due to their different diets.

2. Materials and Methods

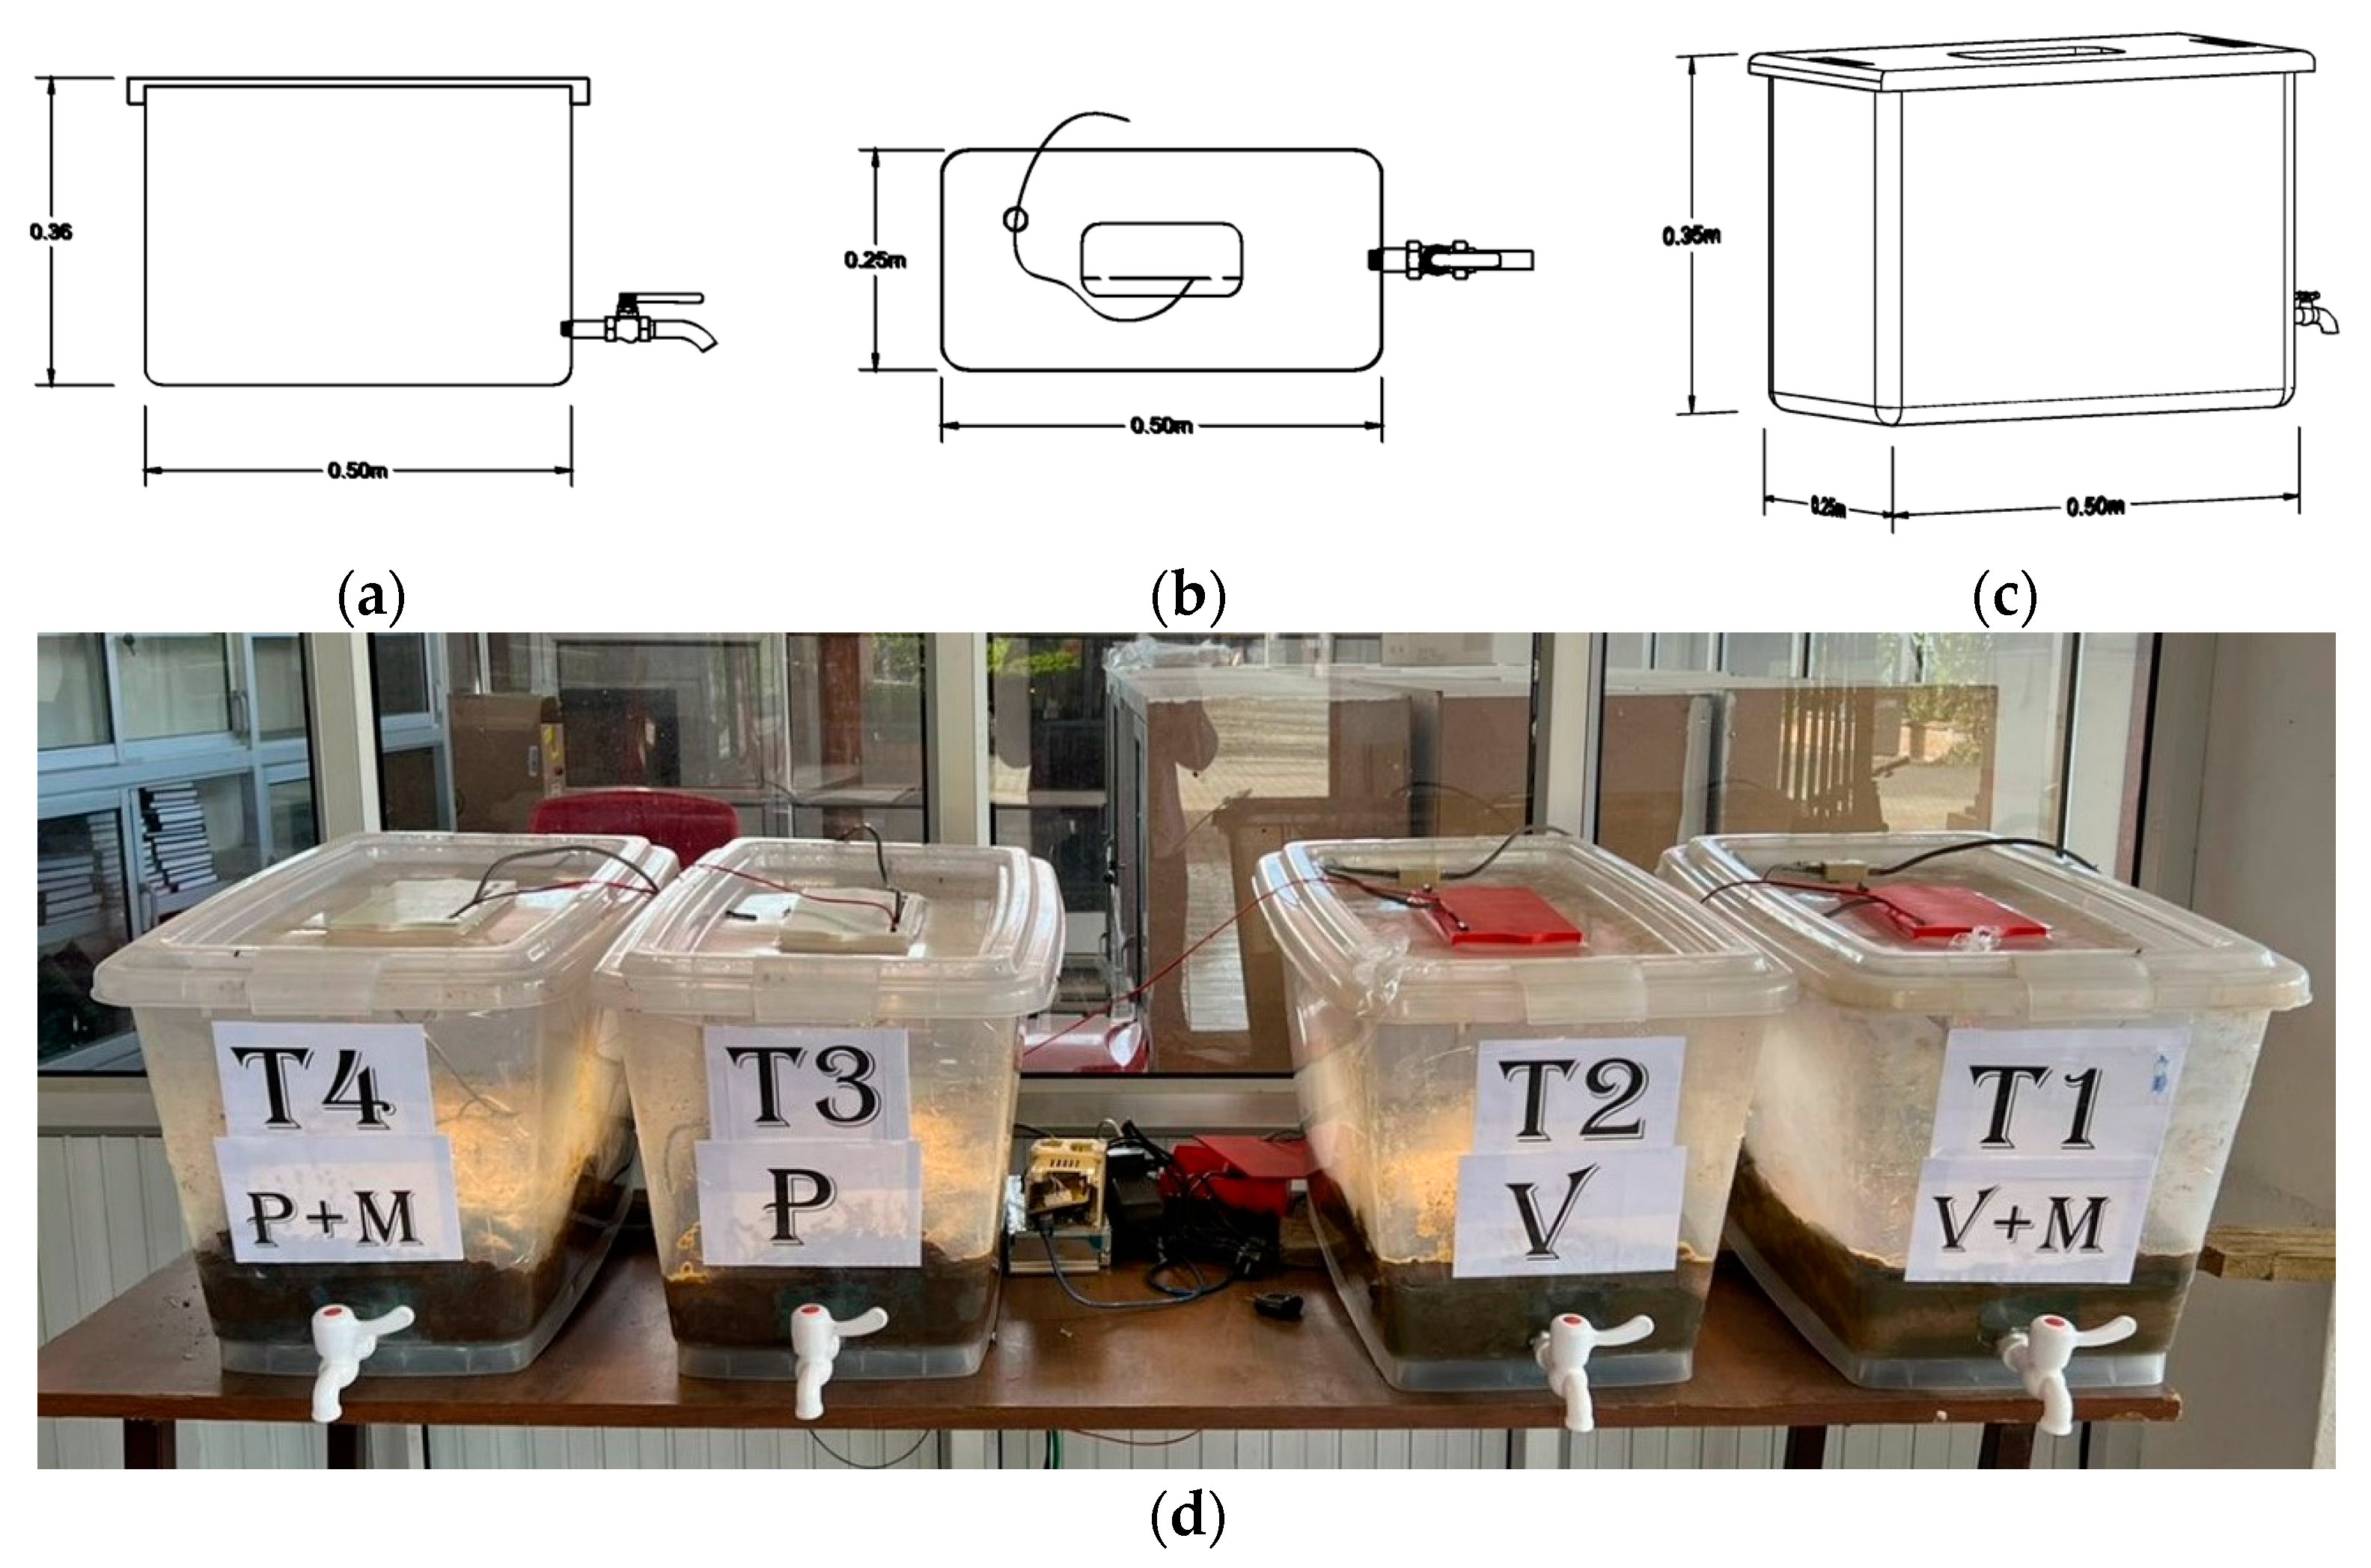
2.1. Bioreactors for the Biological Treatment of Manure

The design criteria for the bioreactor were based on a tank that was closed for 30 days, which should have the facility for transferring heat between a medium and beneficial microorganisms. The microorganisms were uniformly inoculated throughout the volume of the excreta. The bioreactors were made of polypropylene material with dimensions of 50 × 36 × 28 cm each, and they had a volume capacity of 50.4 L. Plastic faucets were attached at the front of the four bioreactors to allow leachate discharge (Figure 1).
In these four bioreactors, animal excreta from cattle and swine were distributed in a semi-solid state. The beneficial microorganisms were applied in two treatments: T1 bovine and T4 swine. T2 and T3 were the controls. This bioreactor, which was constructed with an inert material, was non-toxic for the development of beneficial microorganisms, which was an advantage. In addition, its physical and thermal properties, chemical resistance, and density were close to 1 gcm−3, making its conditions optimal for microbial growth.

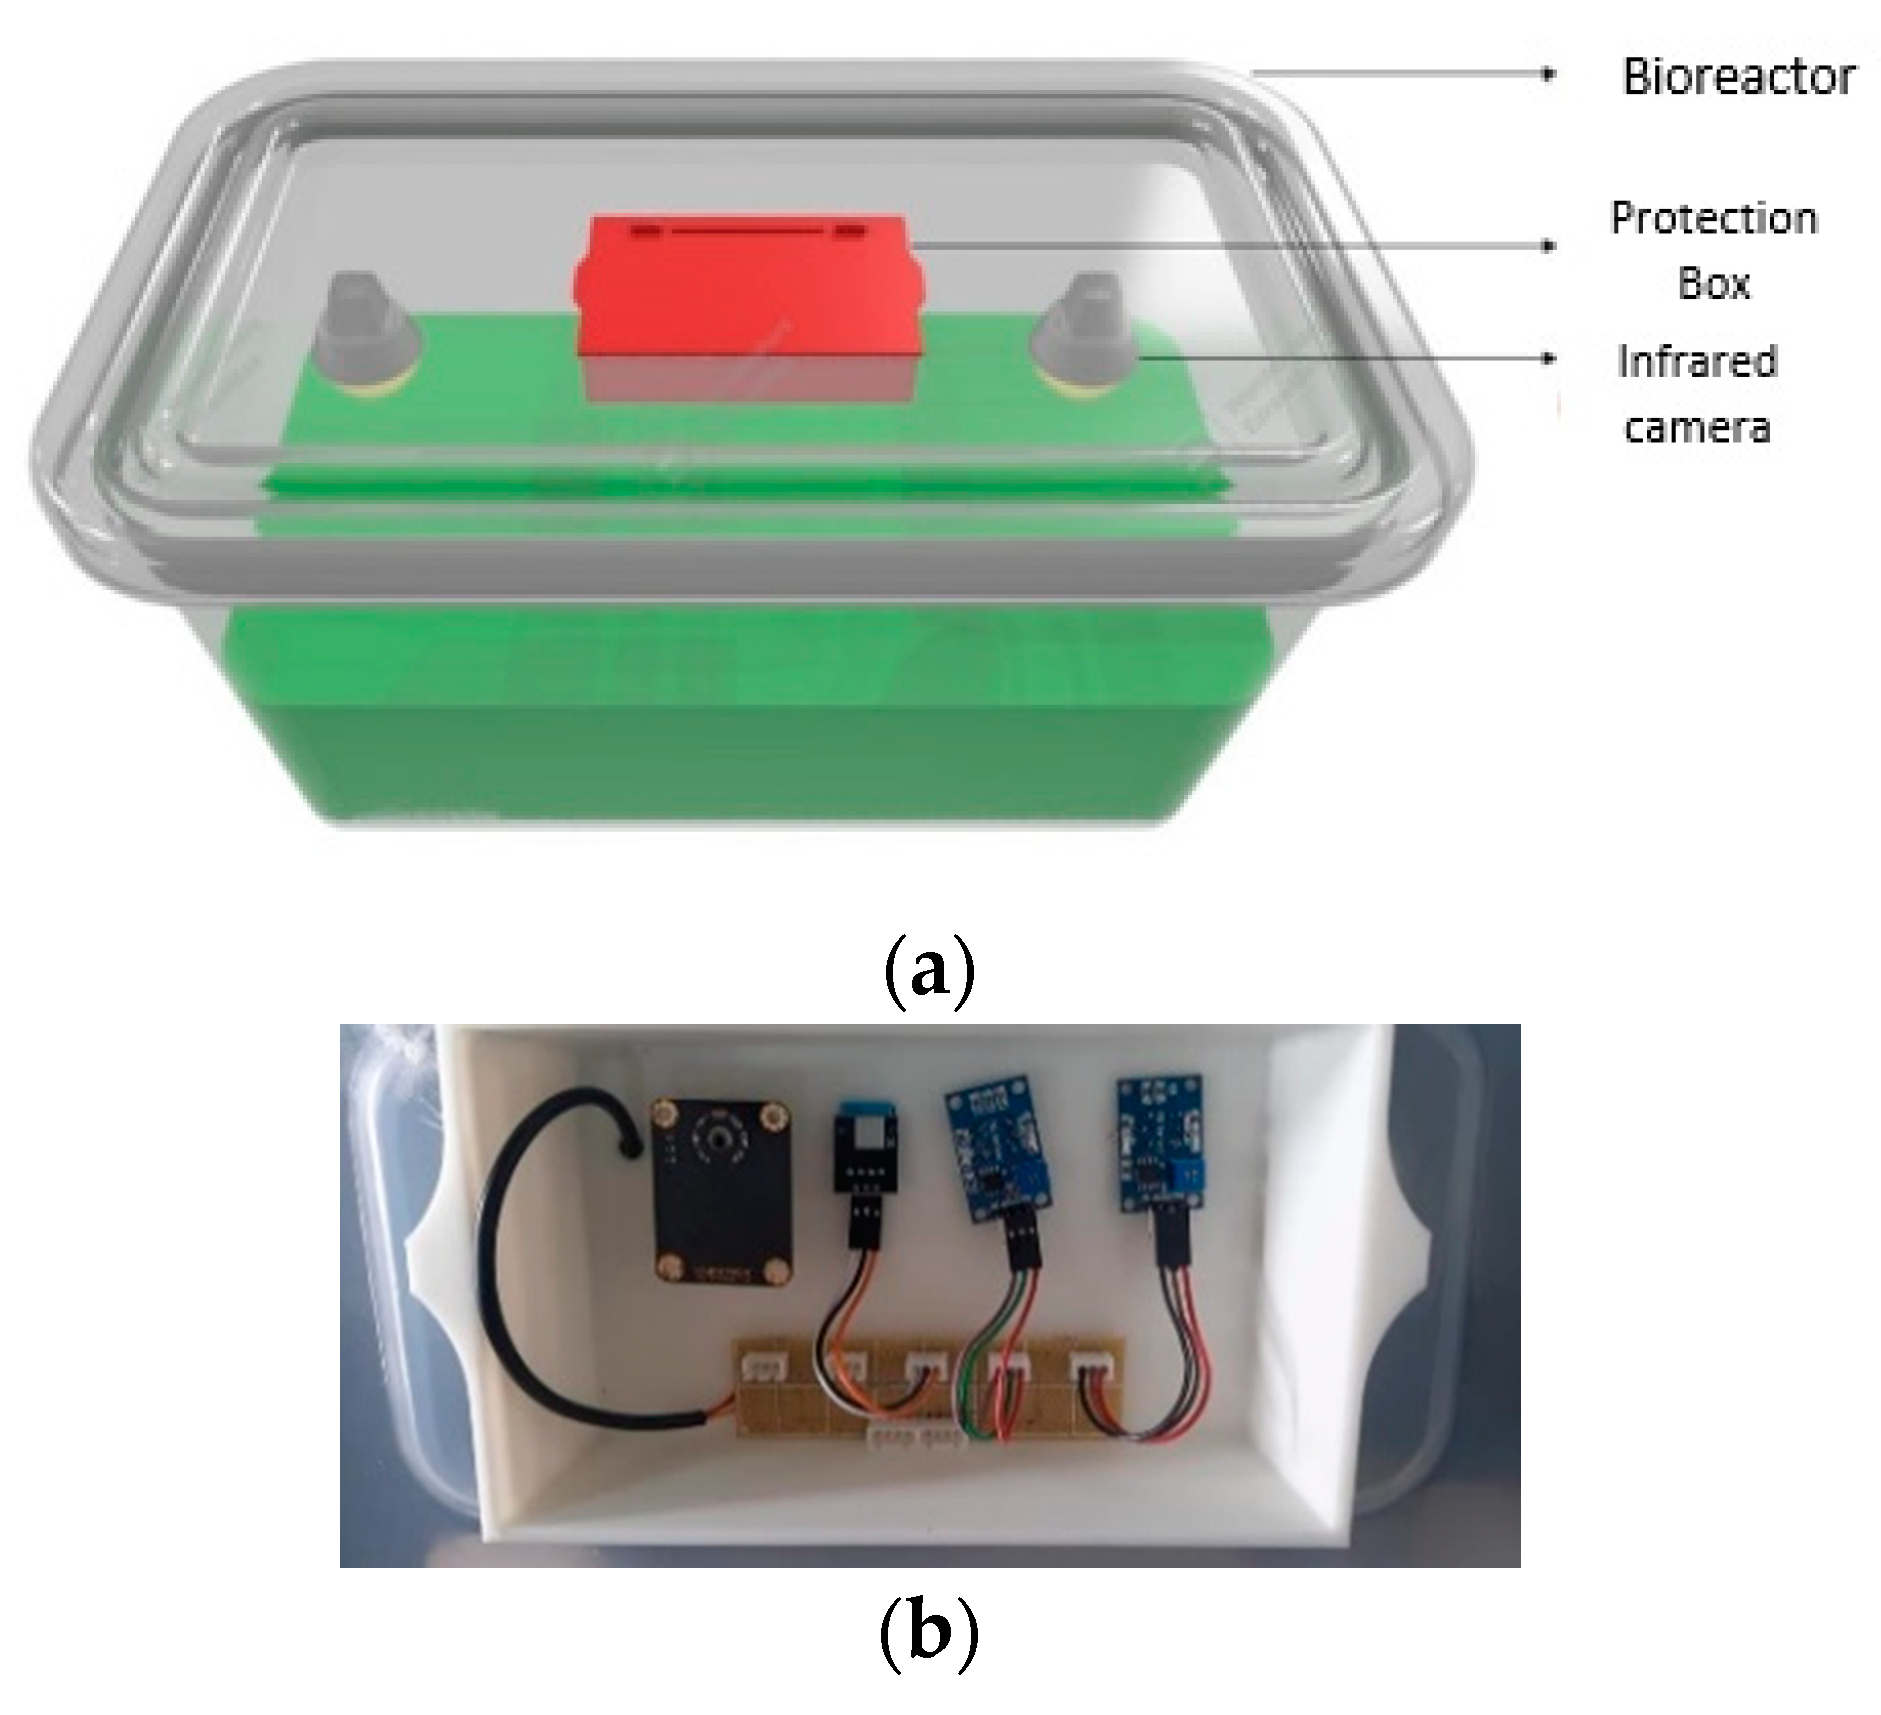
2.2. Electronic Data Processing and Monitoring System

Electrochemical and electronic sensors were used to measure GHGs, humidity, and temperature (Figure 2). The system was based on the design presented by Reyes-Ordoñez et al. [23].
The analog signals were converted into digital signals by using a microcontroller system (Arduino Mega, Arduino, Monza, Italy); this involved an open-source microcontroller based on free hardware and free software.
The information processed by the microcontroller was transmitted to a Raspberry Pi microcomputer. This was in charge of data storage and processing; a Python script was created for this purpose. Additionally, the script sent the information to an IoT platform (Thingspeak, Marlborough, MA, USA), which allowed the data to be visualized in real time and graphically.
Methane (CH4), ammonia (NH3), and carbon dioxide (CO2) were monitored. The sensors reacted with the gases, which caused a change in their resistance values inside the biogas bioreactors (Table 1).
All sensors were placed on top of the bioreactors. In each bioreactor, the entire sensing system was installed in a protective box for the measurement system, as shown in Figure 3.
Finally, an RGB camera was placed inside each bioreactor to monitor images of the excreta, and this also made it possible to verify the behavior of the decomposing biomass at the surface level.

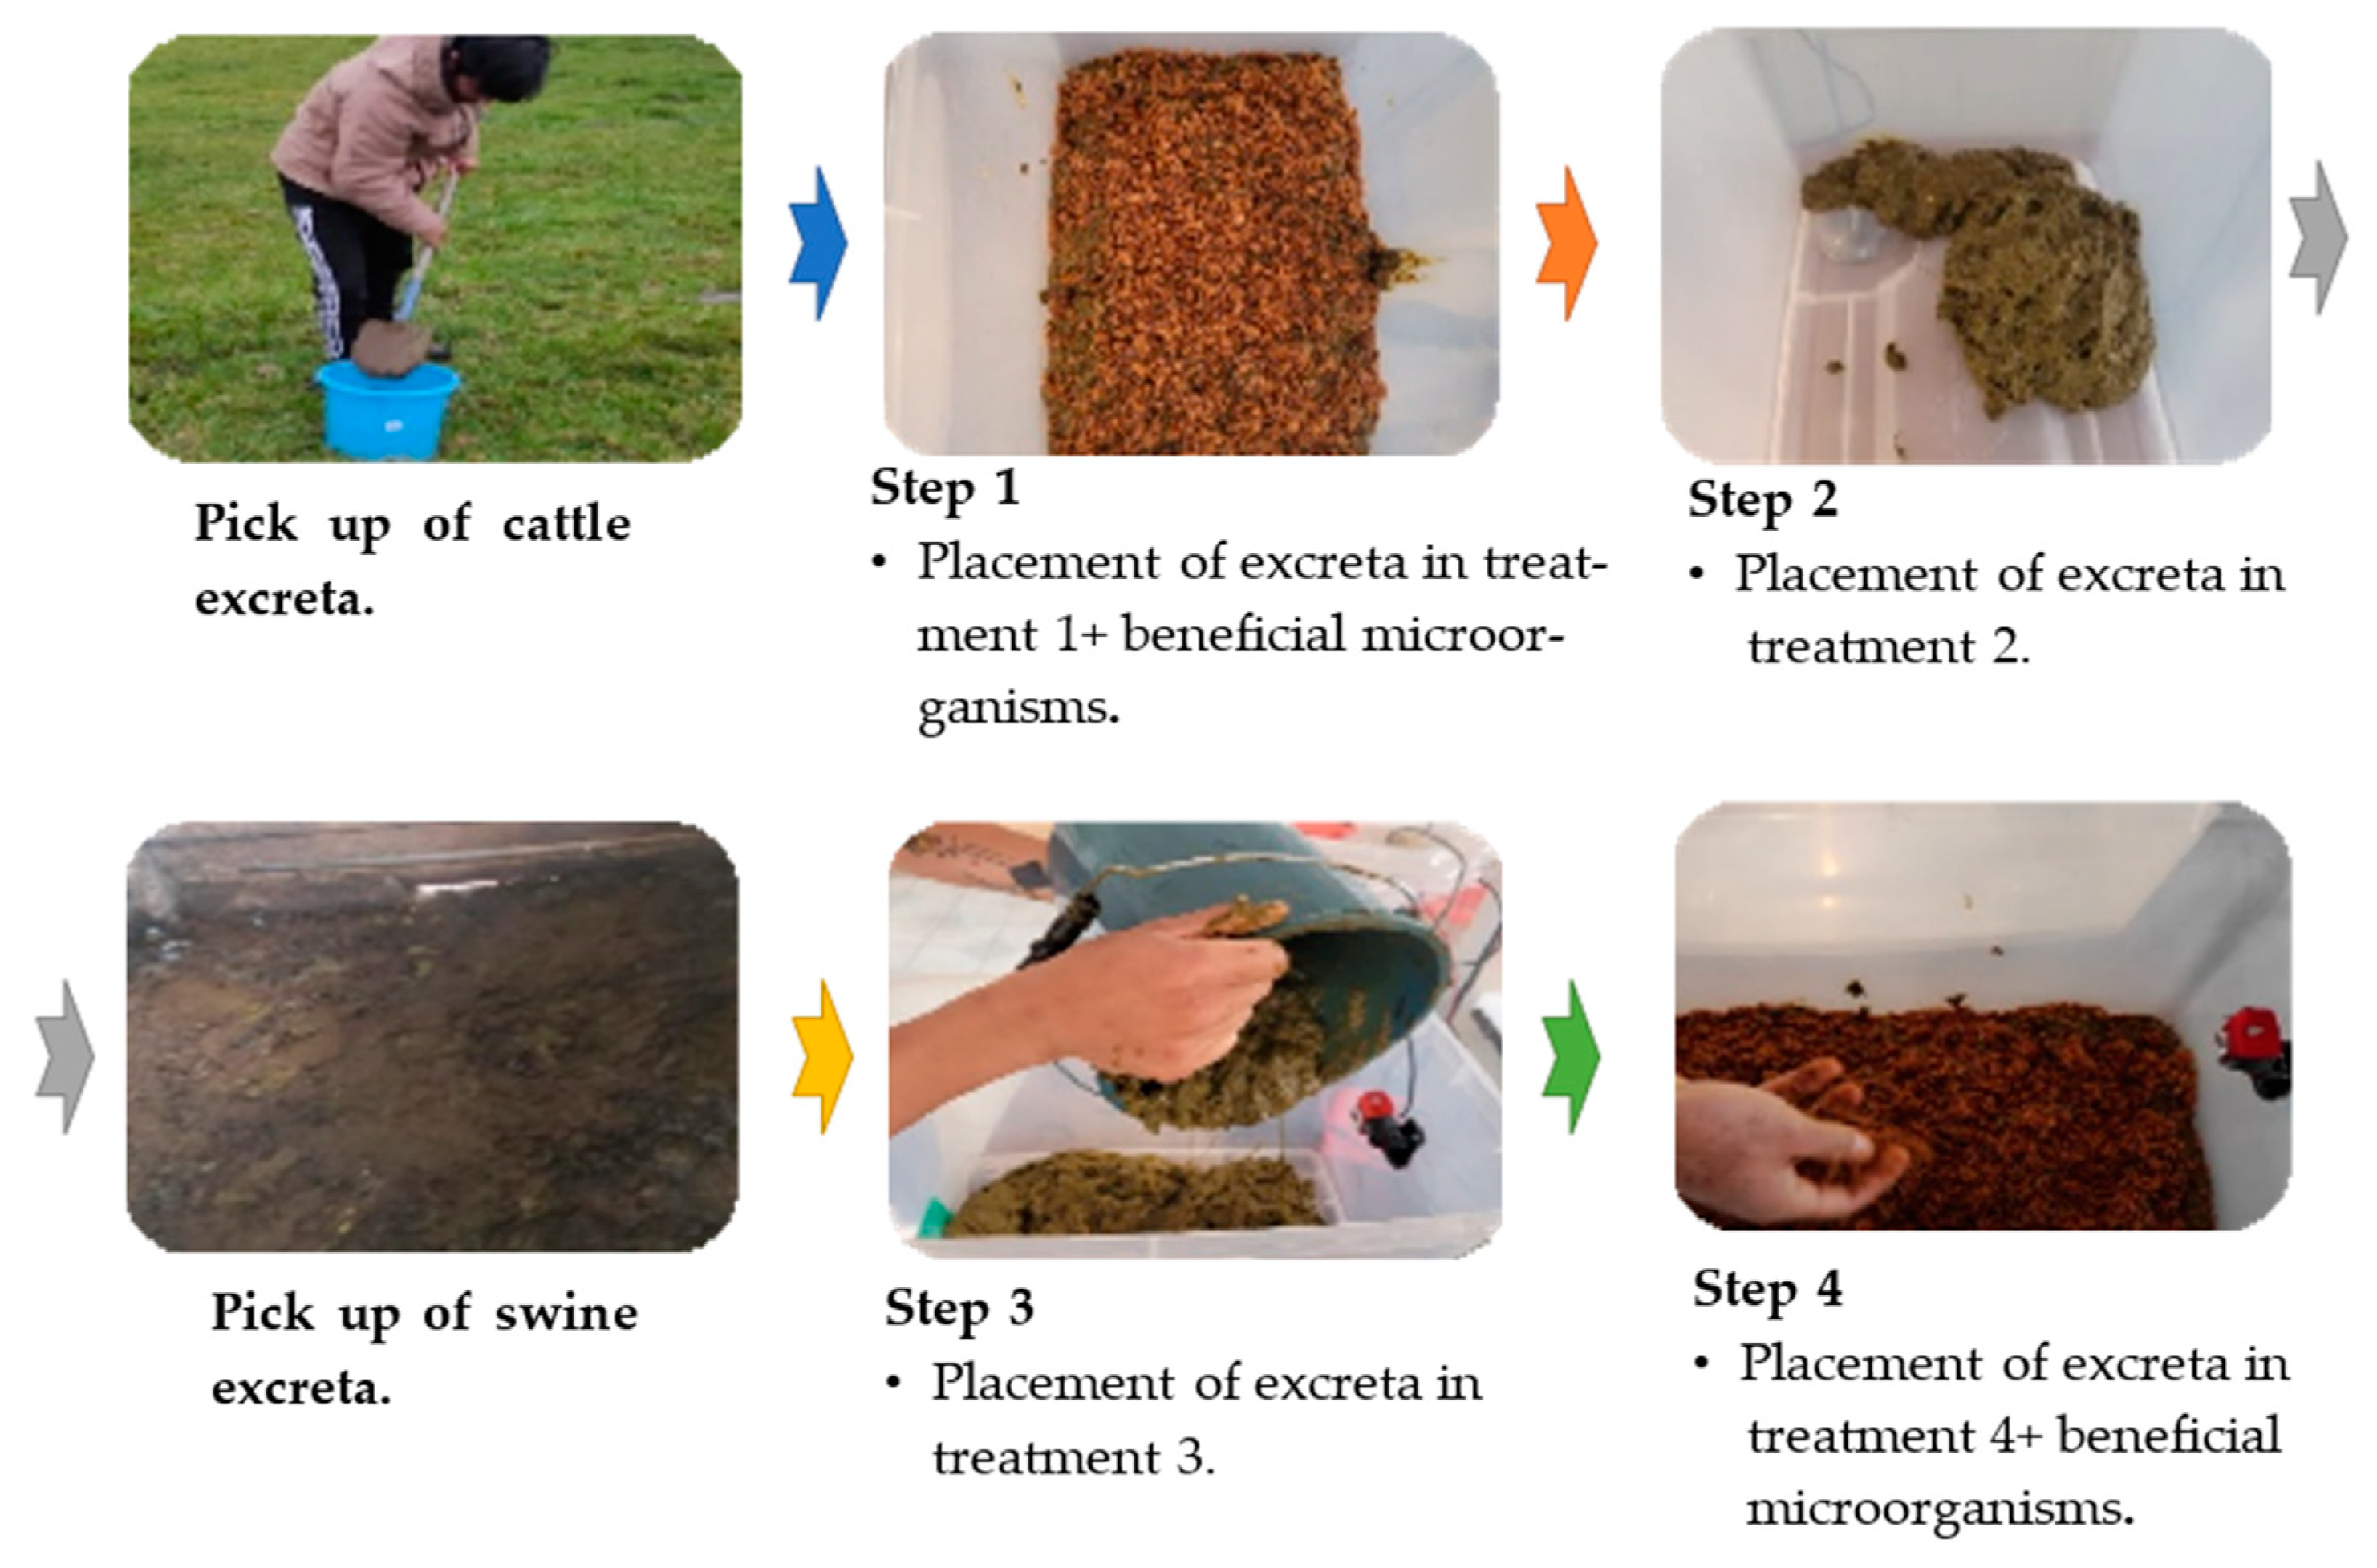
2.3. Biomass Collection

The biomass was collected at the “Shararán” farm (located in the Tarqui parish of the Cuenca canton), which was mainly dedicated to milk production. A total of 8 kg of fresh cattle excreta and 8 kg of fresh swine excreta were collected from the herd’s stables. A plastic container was used for this activity, and several 1 kg samples were taken, placed, and mixed inside a container intended for this purpose. Once the excreta were made uniform, 16 kg were extracted and transported to the experimental site. The sequence of the collection and placement of the biomass in the bioreactors is shown in Figure 4.
For the collection of the samples, they were extracted from female cows of steer age and of the Holstein breed for dairy production; on the other hand, for the collection of the swine samples, they were taken from male Landrace breed pigs of 7 months of age. The chemical characteristics of the fresh cattle excreta: Humidity =46.1 (%); pH = 7.47; Electric conductivity = 7.53 (dS m−1); Organic material = 664 (g kg−1); Lignin = 185 (g kg−1); Cellulose = 122.1 (g kg−1); Hemicellulose = 325.3 (g kg−1); Total organic carbon = 369.1 (g kg−1); Total nitrogen = 369.1 (g kg−1); Total nitrogen = 19.4 (g kg−1); C/N = 19; Phosphorus = 2.5 (g kg−1); Calcium = 63.7 (g kg−1); Magnesium = 8.8 (g kg−1); Iron = 1442 (g kg−1); Copper = 23 (g kg−1); Manganese = 191 (g kg−1); Zinc= 159 (g kg−1) [24]. Table 2 shows the chemical characteristics of the swine excreta.
The tools and equipment were sterilized to avoid any external contamination that could alter the sample.

2.4. Immobilization of Beneficial Microorganisms in Inert Material

The liquid solution with beneficial microorganisms used in this research was obtained in the laboratory of the Postgraduate Academic Unit of the Catholic University of Cuenca. The concentration of the microorganism biopreparation in colony-forming units per milliliter of solution (CFU/mL) is presented in Table 3.
In the bioreactors, the immobilized beneficial microorganisms were applied in an inert material; in this case, wheat bran was used. For every 400 g of dry material, 250 mL of bio-preparation containing beneficial microorganisms was applied and mixed so that all of the bran had the sufficient humidity required by the product, which corresponded to 40%. A 2.5 kg bokashi product was made from wheat bran with the addition of beneficial microorganisms and added to the cattle and swine excreta in each treatment.

2.5. Adequacy of the Biomass in the Containers and the Application of Beneficial Microorganisms

The adaptation of the biomass inside the containers was carried out in two parts. First, 8 kg of cattle excreta (T2) were directly deposited in a container that did not receive the application of beneficial microorganisms until a height of 18 cm from the base was reached, and 8 kg of swine excreta without beneficial microorganisms (T3) were deposited in a second container until a height of approximately 18 cm was reached. This was to ensure that the gas monitoring equipment, cameras, and other components had sufficient space to record the data. Secondly, beneficial microorganisms were applied to 8 kg each of the cattle and swine excreta in the remaining two containers.
In the case of the application of a microbial load, the biomass was deposited in layers; initially, a layer of 2.66 kg of cattle and swine excreta was placed, followed by a layer of 150 g of immobilized microorganisms (microbial consortia) in inert material (wheat bran). This was done successively and alternately until three layers of both materials were completed, giving a total of 450 g of the microbial consortium and 8 kg of cattle and swine excreta for each treatment. Finally, two treatments of cattle excreta and two treatments of swine excreta were evaluated; two were carried out with beneficial microorganisms (T1, T4) and two were carried out without beneficial microorganisms (T2 and T3).

2.6. Data Collection, Analysis, and Interpretation
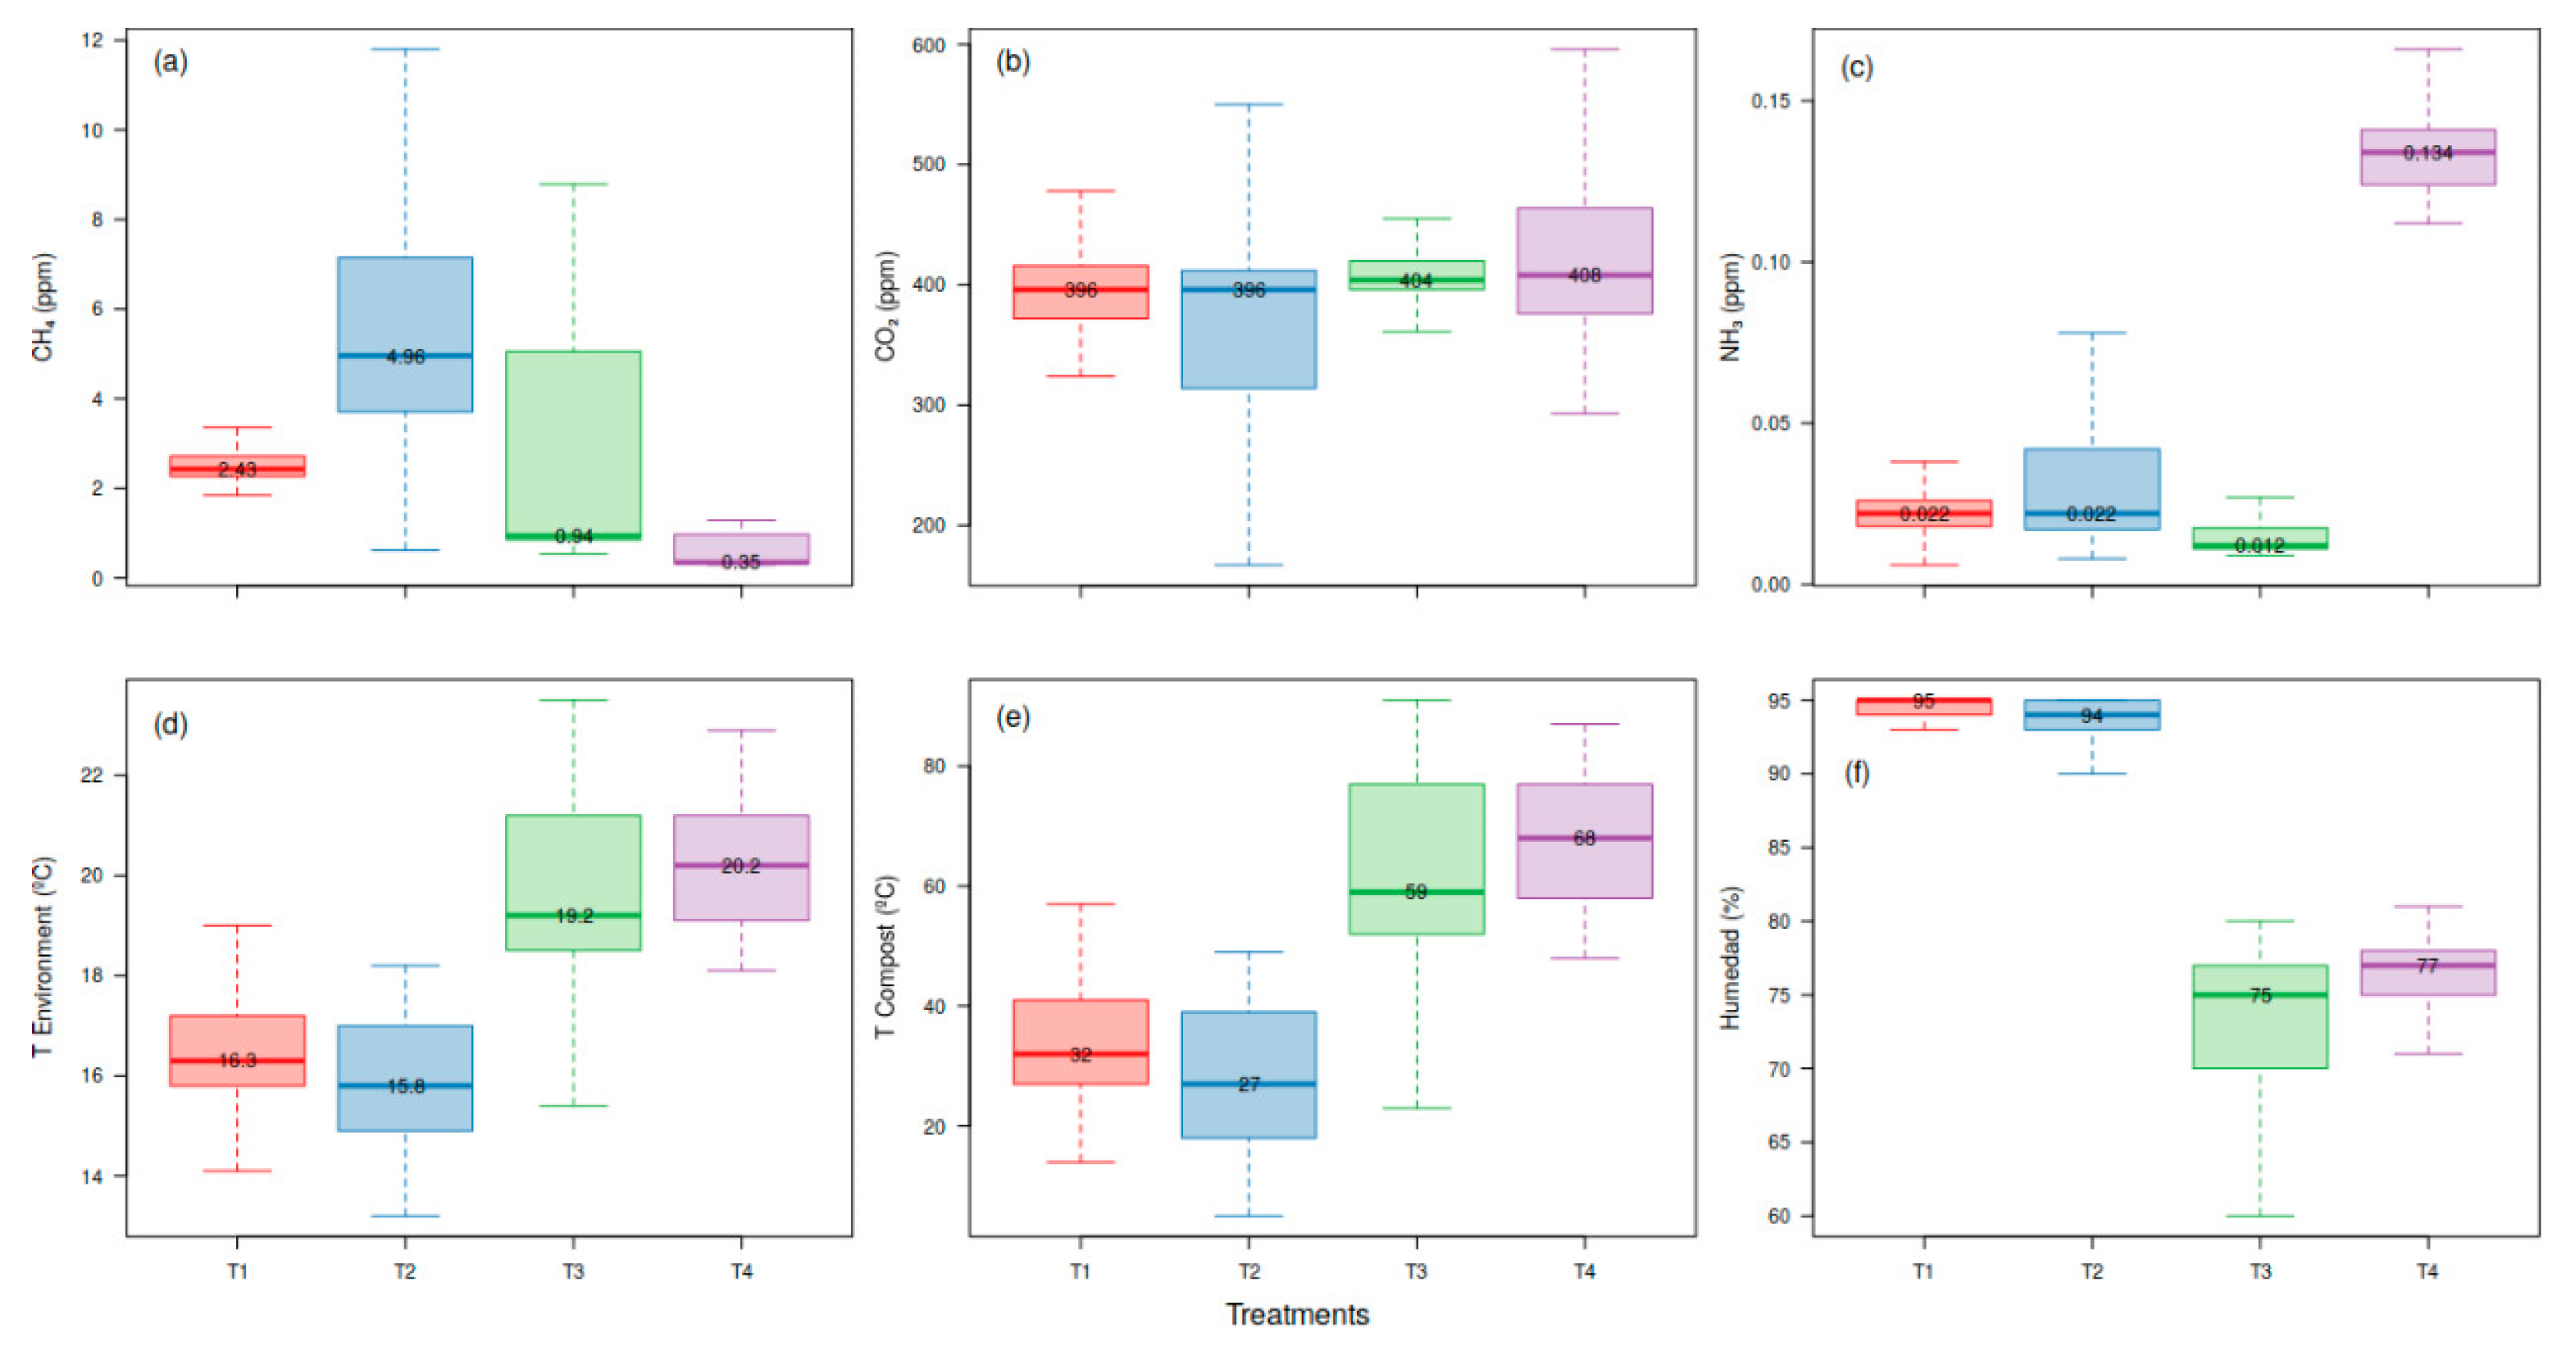
Data collection was carried out for 33 days, starting with placing the excreta and beneficial microorganisms in the bioreactors, which were sealed with an airtight plastic lid; during this period, the process of anaerobic fermentation and gas production was carried out. The data collection period was from July 11 to 12 August 2022. Measurements were performed at intervals of 30 min for each sensor. Abnormal or extreme observations were reviewed and eliminated. In the end, 1372 valid observations were obtained; for T1 (cattle + beneficial microorganisms), there were 397 valid observations; for T2 (cattle), there were 286; for T3 (swine), there were 289; for T4 (swine + beneficial microorganisms), there were 400.
For the four treatments, ANOVA (parametric) and Kruskal–Wallis (non-parametric) analysis of variance were performed, and the normality of the residuals of the preliminary univariate linear models was checked for each variable of interest in each treatment. The Anderson–Darling normality test was used, and non-normality was obtained. In addition, Kruskal–Wallis tests were performed to identify whether there was a difference between at least one pair of treatments for each variable of interest. All Kruskal–Wallis tests were significant, with p-values < 0.001. After obtaining this result, Dunn’s post hoc test was performed with Holm–Bonferroni correction by using the DunnTest function of the FSA package for the R program [26], as shown in Table 4.
In Table 5, differences between treatments were identified for all variables of interest. The phases of anaerobic digestion from 11 July 2022 to 12 August 2022 showed differences in time: PI (hydrolysis, nine days), PII (acidogenesis, seven days), PIII (acetogenesis, seven days), and PIV (methanogenesis, ten days).

3. Results

The methane (CH4) concentrations (in ppm) at the end of the experiment differed significantly among the treatments (Figure 5). T4 presented the lowest median that was recorded (0.35 ppm), followed by T1 (2.43 ppm); both of these included beneficial microorganisms.
At the same time, the controls showed higher CH4 concentrations; T2 presented the highest concentration, with a median of 4.96 ppm (Figure 5a). The carbon dioxide concentrations (in ppm) at the end of the experiment were similar among treatments. The treatments with beneficial microorganisms showed a median of 396 ppm in T1 (cattle excreta), while in T4 (swine excreta), the showed a median of 408 ppm; there was not a very marked difference in the four treatments. A higher CO2 concentration was observed in T4, while the treatment with the lowest CO2 concentration was T1 (Figure 5b). The concentration of ammonia (NH3) at the end of the experiment remained low, except for T4, which had a high concentration of NH3, with a median of 0.13 ppm. T1 had a median of 0.02 ppm, while T3 had the lowest value (0.01 ppm; Figure 5c).
The temperature showed values that differed between the treatments with cattle and swine excreta. Thus, a median of 68 °C was observed in T4 (swine excreta with beneficial microorganisms), while a median of 32 °C was observed in T1 (cattle excreta with beneficial microorganisms). Hence, the treatment with the highest temperatures was T4, while the lowest temperature values were obtained in T2 (cattle excreta without beneficial microorganisms) (Figure 5e). For the humidity, the values of T1 and T2 did not differ enormously from those of T3 and T4. However, a substantial difference between the containers with cattle and swine excreta was evidenced by an effect opposite to that of temperature: Containers with cattle excreta had a humidity greater than 90% and containers with swine excreta had a humidity of less than 80% (Figure 5f). That is, the containers with cattle excreta showed low temperatures and high humidity, while the containers with swine excreta showed high temperatures with low humidity (Figure 5e,f).
Paired comparisons in the post hoc test that was performed for phases I to IV concerning CH4, CO2, and NH3 led to them being grouped by treatment (Figure 6).
A substantial decrease in NH3, CH4, and CO2 could be observed in the first phase of T3 (Figure 7a–c). On the other hand, a significant increase in CH4 concentration was observed in phase III of T2 (Figure 7a). CO2, in general, did not show a specific pattern; however, this GHG fluctuated with increases and decreases in the four phases, except for T2, which remained stable between phases II and IV (Figure 7b). In fact, the behavior of T3 was similar for all three GHGs. For NH3, peaks were observed at T1, T2, and T3 in Phase I, while in Phase I, T4 increased and maintained high concentrations until the end of Phase IV, when it tended to decrease (Figure 7c). Both temperature and humidity increased in Phase I, with slight peaks; however, this was more marked for temperature than for humidity. On the other hand, while the temperatures of T1 and T2 were low and they had a high humidity during Phases II, III, and IV, T3 and T4 showed high temperatures and low humidity during Phases II, III, and IV (Figure 7d,e).

4. Discussion

It was found that GHGs (CH4, CO2, and NH3), as well as temperature and humidity, had different behaviors during anaerobic digestion among the different treatments with and without beneficial microorganisms. CH4 showed a significant decrease in the treatments with beneficial microorganisms (T1, T4), while CO2 presented similar medians in the four treatments. Ammonia (NH3) showed low concentrations in the first three treatments, with a significant increase for T4 (with beneficial microorganisms in swine). The temperature and humidity showed different behaviors, while the temperature was significantly higher in T3 and T4 (swine), but humidity was significantly higher in T1 and T2 (cattle). The drop in methane in Phase I (hydrolysis), which was more marked in T3, indicated a substantial effect of anaerobic digestion on reducing this GHG. However, our results indicated that the effect of anaerobic digestion did not maintain stable methane concentrations in the treatment of cattle excrement without beneficial microorganisms, especially in acidogenesis (Phase III). On the other hand, the variation in CO2 without a defined pattern indicated different effects of anaerobic digestion on treatments with and without beneficial microorganisms. Specifically, the substantial variation in T2 (cattle excreta without beneficial microorganisms) showed a wide variation in CO2 in the four phases of anaerobic digestion, with a significant increase during Phase IV (methanogenesis). In contrast, the similar fluctuations in CO2 in the treatments with beneficial microorganisms indicated an analogous process of variation in this GHG in T1 and T4 during Phases I, II, and IV of anaerobic digestion. Conversely, the sharp drop in T3 without beneficial microorganisms in swine excreta during Phase I and the stability during the following phases suggested a significant decrease in CO2 due to anaerobic digestion without the need for the inclusion of beneficial microorganisms. On the other hand, the significant decrease in ammonia for T2, T3, and T4 during Phase I and the decreasing trend suggested a substantial effect on decreasing this GHG with and without beneficial microorganisms. However, the substantial increase in ammonia for T4 (swine excreta with beneficial microorganisms) and its high concentration in all phases indicated a strong production of this GHG under the effect of anaerobic digestion when including beneficial microorganisms. The marked differences in temperature and humidity among the treatments suggested that there were significant differences in the anaerobic digestion of cattle and swine excreta with and without beneficial microorganisms. The similarity in the patterns of treatments with and without beneficial microorganisms indicated the very different effects of anaerobic digestion on cattle and swine excreta.
Studying microbial communities’ dynamics is essential for understanding the mechanisms behind CH4 emissions and the development of effective mitigation strategies [27]. The decrease in CH4 for T1 and T4 with beneficial microorganisms and the subsequent low concentrations for the cattle and swine excreta suggested a strong effect of beneficial microorganisms on decreasing this greenhouse gas. This is in agreement with previous studies, which showed a significant decrease in CH4 by using beneficial microorganisms; this is particularly applicable for solid-type excreta [27,28,29]. In fact, the decrease in all four treatments at the beginning of Phase I (hydrolysis), which was most marked in T3, with a substantial increase for T2 in Phase III (acetogenesis), suggested a significant effect of beneficial microorganisms on decreasing this GHG. Similarly, previous studies reported a substantial decrease in and maintenance of low methane values during anaerobic digestion, mainly in organic wastes treated with beneficial microorganisms [30,31]. However, Pessuto et al. [32] found that adding microorganisms increased the biogas volume and methane mole fraction.
The marked variation in carbon dioxide among the treatments indicated a non-significant effect of anaerobic digestion of cattle and swine excreta, in spite of the inclusion of beneficial microorganisms. This may have been because large amounts of degraded organic compounds were directly converted into CO2 during anaerobic digestion, which also substantially reduced the energy yield of methane [28]. On the other hand, CO2 has been found to be efficient in biomass degradation and biogas production [33]. This is because anaerobic digestion generally comprises carbon dioxide and methane, although there is no comprehensive review of CO2 in beneficial microorganisms for the degradation of organic matter [34]. Recently, however, more attention has been paid to biogas research and CO2 sequestration in anaerobic digestion—for example, to promote carbon neutrality [35].
Although ammonia is an essential nutrient for the growth of microorganisms, it can inhibit methanogenesis at very high concentrations during anaerobic digestion [36]. Thus, high concentrations of NH3 could cause toxicity and failure of the anaerobic process at high concentrations, which is mainly dependent on feedstock characteristics and loading rates [37]. Ammonia concentrations of approximately 200 mg/L are commonly stated to be beneficial for anaerobic processes because nitrogen is an essential nutrient for anaerobic microorganisms [36]. Nevertheless, despite the extensive research on ammonia inhibition, the effect of NH3 on each stage of anaerobic digestion and the associated microorganisms is still not fully understood [38]. In this study, ammonia showed low concentrations in the first three treatments; however, a substantial increase in this GHG was observed in the treatment of swine excreta with beneficial microorganisms. This suggested a substantial increase in nitrogen, especially in the treatment of swine after inoculation with beneficial microorganisms. Previous studies found evidence of ammonia inhibition in cattle excreta [38], which was probably due to pH [39]. In addition, it was observed that nitrogen and phosphorus could be stabilized and/or simultaneously removed via the anaerobic digestion of NH3 [40].
The apparent differences in temperature and humidity in the cattle and swine excreta with and without beneficial microorganisms suggested that there are different conditions for the decomposition processes of excreta from herbivorous and omnivorous livestock. Previous studies reported significant effects of temperature on the microbial community, process stability, and methane yield [41,42,43]. Microbial dynamics are strongly related to performance parameters, such as substrate composition, process temperature, retention time, and organic loading rate [44]. Thus, low temperatures reduce microbial growth, biogas production, and substrate utilization rates [45,46,47]. A low temperature is one of the limiting factors for anaerobic digestion [48], and it can lead to the depletion of cellular energy, leakage of intracellular substances, or complete lysis of beneficial microorganisms [49]. For example, Wang et al. [50] found that low temperature was detrimental to the performance in the acidogenic and methanogenic phases, while moderate temperatures of above 25 °C were more conducive to high biogas production efficiency. Lowering the storage temperature could effectively reduce CH4 emissions, which was particularly applicable to solid-type excreta [27]. For example, Castillo et al. [51] found that the operating temperature was 35 °C with a digestion period of 18 days, while a slight fluctuation from 35 to 30 °C caused a reduction in the biogas production rate. Conversely, high temperatures reduced biogas production due to the generation of volatile gases such as ammonia, thus suppressing methanogenic activities [29,52]. Specifically, the authors of [53], in agreement with this study, found that the highest rates of biogas production and of the degradation of methane and volatile solids were achieved, for a given time, at 35 °C in cattle excreta. Generally, a temperature range from 35 to 37 °C is considered adequate for methane production; shifting from mesophilic to thermophilic temperatures can cause a sharp decrease in biogas production [29]. Brisky et al. [54] reported that, for biodegradation, the temperature must be below 65 °C because enzyme denaturation occurs above this temperature. However, thermophilic conditions result in a faster rate of degradation of organic wastes, higher gas and biomass production, lower effluent viscosity, and more significant pathogen destruction [55].
Meanwhile, in agreement with what was reported by Chinwendu et al. [22], we observed a significant difference in humidity between the cattle excreta and swine excreta treatments. A high humidity usually facilitates anaerobic digestion; however, it is difficult to maintain the same water availability throughout the digestion cycle [56]. A high water content will likely affect process performance by dissolving easily degradable organic matter [56]. It was observed that the highest methane production rates occurred at 60% to 80% humidity [57]. For example, Hernández-Berriel et al. [56] found that the onset of the methanogenic phase took place around day 70 in both cases at (70% and 80% humidity); more leachate was produced and there was a higher methane production rate at 70% humidity.
Finally, our results show that beneficial microorganisms play an essential role in the decomposition of cattle and swine excreta with an associated decrease in GHGs. The advantages of anaerobic digestion technology in organic solid waste treatments for bioenerg y recovery have been demonstrated worldwide [35]. In addition, treatment with a microbial consortium has been shown to improve biodegradability and increase methane production from cotton stalks, for example [58]. The microorganisms that carry out the degradation reactions in each phase differ widely in their physiology, nutritional requirements, growth kinetics, and environmental sensitivity [59]. Microbial consortia can ferment volatile fatty acids while decomposing a certain amount of lignocellulose, which is also considered one of the critical factors for increasing the methane yield of anaerobic digestion [58]. Anaerobic digestion is a complex process with various interactions among microorganisms [50]. Therefore, substrate composition is crucial in anaerobic digestion [59]. Depending on the origin of a residue, its composition may include inhibitory and/or toxic substances [36].

5. Conclusions

This study shows that the effect of anaerobic digestion contributes to a decrease in the concentration of GHGs in cattle and swine excreta. However, the effects tended to differ among treatments, with the temperature and humidity showing marked differences between cattle and swine excreta. Additionally, the inclusion of beneficial microorganisms showed a significant effect on the decrease in methane in the excreta and a substantial increase in ammonia in the swine excreta. Temperature and humidity play an important role in anaerobic digestion and indicate different conditions in the process of decomposition of the excrement of herbivores and omnivores. This study emphasizes that the interactions of various drivers must be considered for a holistic understanding of the mechanisms that shape anaerobic digestion patterns in different types of organic matter and the effects of beneficial microorganisms that are associated with the processes of hydrolysis, acidogenesis, acetogenesis, and methanogenesis. It can be concluded that understanding the dynamics of GHGs in response to changes in temperature and humidity is essential for projecting GHG concentrations in organic wastes from farm animals and their potential effects on global climate change. This research is being expanded by improving the sensing system so that only a fraction of the air in the bioreactors is directed to the sensors every so often. It is important to note that during the enteric fermentation process, there is an increase in the environmental humidity inside the bioreactors, and this can affect the sensors. In the case of the present investigation, the experiment had to be repeated a few times because some sensors were damaged (by water condensation). The solution was simple: A material that absorbed some of the humidity that was generated was used (a fan over the treatments). Thus, anaerobic digestion was maintained and excess moisture that condensed was absorbed. In the future, to improve the measurement process, a double electromechanical valve system will be generated; from time to time, this will allow the passage of gases into a chamber in which the sensors will be housed to be measured. Once the measurements are completed, the gases will be removed from the chamber, and the cycle will be for a new measurement. On the other hand, it is important to carry out future tests on agricultural crops with the digestate resulting from the treatments and, thus, to find the benefits of each of these by evaluating their performance as fertilizers and examining the results in terms of plant growth. Additionally, in ongoing research, laboratory analyses are being carried out to find out the compositions of treatments before, during, and after the digestion process. On the other hand, it would be beneficial for society to implement this type of treatment with beneficial microorganisms in less favored countries in which methane generation cannot be used for energy production. The investigation and implementation of enteric digestion of livestock waste should be encouraged through adequate policies that allow the management of this type of waste on farms or in the livestock sector in order to mitigate the environmental contamination caused by cattle and swine excreta, which, in turn, would generate fertilizer for crops and pastures.

Author Contributions

Conceptualization, P.-S.V.-E., M.A.-V., A.C. and J.-C.C.-T.; methodology, P.-S.V.-E., M.A.-V., A.C. and J.-C.C.-T.; software, P.-S.V.-E., M.A.-V. and J.-C.C.-T.; validation, P.-S.V.-E., M.A.-V. and J.-C.C.-T.; formal analysis, P.-S.V.-E., M.A.-V., A.C. and J.-C.C.-T.; investigation, P.-S.V.-E., M.A.-V. and J.-C.C.-T.; resources, M.A.-V. and J.-C.C.-T.; data curation, P.-S.V.-E., M.A.-V. and J.-C.C.-T.; writing—original draft preparation, P.-S.V.-E.; writing—review and editing, P.-S.V.-E., M.A.-V., A.C. and J.-C.C.-T.; visualization, P.-S.V.-E., M.A.-V. and J.-C.C.-T.; supervision, M.A.-V. and J.-C.C.-T. project administration, M.A.-V. and J.-C.C.-T.; funding acquisition, M.A.-V. and J.-C.C.-T. All authors have read and agreed to the published version of the manuscript.

Funding

This research received no external funding.

Institutional Review Board Statement

Not applicable.

Informed Consent Statement

Not applicable.

Data Availability Statement

Not applicable.

Acknowledgments

This article is part of the research and degree work for the Master’s degree in Renewable Energy at the Universidad Católica de Cuenca. This research was undertaken as part of the work of the research group “Sistemas Embebidos y Visión Artificial en Ciencias Arquitectónicas, Agropuecuarias, Ambientales y Automática (SEVA4CA)” under a project entitled “Prototipado de Compostador Acelerado de Residuos Orgánicos”.

Conflicts of Interest

The authors declare no conflict of interest.

References

  1. Ropero-Portillo, S. ¿Las Vacas Contaminan? Available online: https://www.ecologiaverde.com/las-vacas-contaminan-3233.html (accessed on 6 April 2023).
  2. Herrero, M.A.; Gil, S.B. Consideraciones Ambientales de La Intensificación En Producción Animal. Ecol. Austral 2008, 18, 273–289. [Google Scholar]
  3. Burkholder, J.A.; Libra, B.; Weyer, P.; Heathcote, S.; Kolpin, D.; Thorne, P.S.; Wichman, M. Impacts of Waste from Concentrated Animal Feeding Operations on Water Quality. Environ. Health Perspect. 2007, 115, 308–312. [Google Scholar] [CrossRef] [PubMed] [Green Version]
  4. De Blas, C.; García-Rebollar, P.; Cambra-López, M.; Torres, A.G. Contribución de Los Rumiantes a Las Emisiones de Gases Con Efecto Invernadero. In XXIV Curso de Especialización FEDNA; Editorial FEDNA: Madrid, Spain, 2008; pp. 121–150. [Google Scholar]
  5. Steinfeld, H.; Gerber, P.; Wassenaar, T.D.; Castel, V.; Rosales, M.; Rosales, M.; de Haan, C. Livestock’s Long Shadow: Environmental Issues and Options; Food & Agriculture Organization of the United Nations: Rome, Italy, 2006; ISBN 9251055718. [Google Scholar]
  6. Sutaryo, S.; Ward, A.J.; Møller, H.B. Thermophilic Anaerobic Co-Digestion of Separated Solids from Acidified Dairy Cow Manure. Bioresour. Technol. 2012, 114, 195–200. [Google Scholar] [CrossRef] [PubMed]
  7. Gutiérrez, W.B. Biodiversidad y Cambio Climático. Apunt. Cienc. Soc. 2015, 5, 5–10. [Google Scholar]
  8. Directorate-General JRC. Integrated Pollution Prevention and Control (IPPC) Reference Document on Best Available Techniques for Intensive Rearing of Poultry and Pigs Draft Dated July 2001; Citeseer: University Park, PA, USA, 2001. [Google Scholar]
  9. FAO. El Papel de La FAO En La Producción Animal. Available online: https://www.fao.org/animal-production/es#:~:text=La FAO trabaja para mejorar,vista económico%2C social y ambiental (accessed on 6 April 2023).
  10. Safieddin Ardebili, S.M. Green Electricity Generation Potential from Biogas Produced by Anaerobic Digestion of Farm Animal Waste and Agriculture Residues in Iran. Renew Energy 2020, 154, 29–37. [Google Scholar] [CrossRef]
  11. Khalil, M.; Berawi, M.A.; Heryanto, R.; Rizalie, A. Waste to Energy Technology: The Potential of Sustainable Biogas Production from Animal Waste in Indonesia. Renew. Sustain. Energy Rev. 2019, 105, 323–331. [Google Scholar] [CrossRef]
  12. Szufa, S.; Piersa, P.; Adrian, Ł.; Sielski, J.; Grzesik, M.; Romanowska-Duda, Z.; Piotrowski, K.; Lewandowska, W. Acquisition of Torrefied Biomass from Jerusalem Artichoke Grown in a Closed Circular System Using Biogas Plant Waste. Molecules 2020, 25, 3862. [Google Scholar] [CrossRef] [PubMed]
  13. Yaqoob, H.; Teoh, Y.H.; Ud Din, Z.; Sabah, N.U.; Jamil, M.A.; Mujtaba, M.A.; Abid, A. The Potential of Sustainable Biogas Production from Biomass Waste for Power Generation in Pakistan. J. Clean. Prod. 2021, 307, 127250. [Google Scholar] [CrossRef]
  14. Berra, G. La “Vaca Mochilera”, Un Invento Argentino Contra El Cambio Climático. Available online: https://www.agenciacyta.org.ar/2010/01/la-“vaca-mochilera”-un-invento-argentino-contra-el-cambio-climatico/ (accessed on 6 April 2023).
  15. Lan, W.; Yang, C. Ruminal Methane Production: Associated Microorganisms and the Potential of Applying Hydrogen-Utilizing Bacteria for Mitigation. Sci. Total Environ. 2019, 654, 1270–1283. [Google Scholar] [CrossRef]
  16. Cai, C.; Leu, A.O.; Xie, G.J.; Guo, J.; Feng, Y.; Zhao, J.X.; Tyson, G.W.; Yuan, Z.; Hu, S. A Methanotrophic Archaeon Couples Anaerobic Oxidation of Methane to Fe(III) Reduction. ISME J. 2018, 12, 1929–1939. [Google Scholar] [CrossRef]
  17. Sandoval Pelcastre, A.A.; Ramirez Mella, M.; Rodríguez Ávila, N.L.; Candelaria Martinez, B. Tropical Trees and Shrubs with Potential to Reduce the Production of Methane in Ruminants. Trop. Subtrop. Agroecosyst. 2020, 23, 33. [Google Scholar]
  18. Eugène, M.; Klumpp, K.; Sauvant, D. Methane Mitigating Options with Forages Fed to Ruminants. Grass Forage Sci. 2021, 76, 196–204. [Google Scholar] [CrossRef]
  19. Aboagye, I.A.; Beauchemin, K.A. Potential of Molecular Weight and Structure of Tannins to Reduce Methane Emissions from Ruminants: A Review. Animals 2019, 9, 856. [Google Scholar] [CrossRef] [Green Version]
  20. Sánchez Ramírez, J.M. Incluencia de Saccharomyces Cerevisiae En La Eficiencia Ambiental de La Producción de Metano En Ganado Lehero y Ganado de Engorda: Meta-Análisis; Universidad Autónoma del Estado de México: Toluca, Mexico, 2018. [Google Scholar]
  21. Castillo-Lopez, E.; Clark, K.; Dominguez-Ordonez, M.; Kononoff, P. Salud Y Enfermedades Metabólicas Relacionados Con Factores Nutricionales En Vacas Lecheras (G1743S). Available online: https://extensionpubs.unl.edu/publication/9000018609715/salud-y-enfermedades-metabolicas-relacionados-con-factores-nutricionales-en-vacas-lecheras-g1743s/ (accessed on 1 April 2023).
  22. Chinwendu, S.; Chibueze, U.; Tochukwu, E. Anaerobic Digester Considerations of Animal Waste. Am. J. Biochem. 2013, 2013, 93–96. [Google Scholar] [CrossRef]
  23. Reyes-Ordoñez, H.R.; Ortiz-Torres, J.I.; Álvarez-Vera, M.S.; Cobos-Torres, J.C. Evaluación de La Degradación de Materia Orgánica Mediante Técnicas de Visión Artificial y Sensores. Rev. Arbitr. Interdiscip. Koinonía 2020, 5, 421–436. [Google Scholar] [CrossRef]
  24. Tortosa, G.; Alburquerque, J.A.; Ait-Baddi, G.; Cegarra, J. The Production of Commercial Organic Amendments and Fertilisers by Composting of Two-Phase Olive Mill Waste (“alperujo”). J. Clean. Prod. 2012, 26, 48–55. [Google Scholar] [CrossRef]
  25. Moreno Ayala, L.; Cadillo Castro, J. Uso Del Estiércol Porcino Sólido Como Abono Orgánico En El Cultivo Del Maíz Chala. An. Cient. 2018, 79, 415. [Google Scholar] [CrossRef] [Green Version]
  26. Ogle, D.H.; Doll, J.C.; Wheeler, A.P.; Dinno, A. FSA: Simple Fisheries Stock Assessment Methods. Available online: https://fishr-core-team.github.io/FSA/ (accessed on 1 April 2023).
  27. Im, S.; Petersen, S.O.; Lee, D.; Kim, D.H. Effects of Storage Temperature on CH4 Emissions from Cattle Manure and Subsequent Biogas Production Potential. Waste Manag. 2020, 101, 35–43. [Google Scholar] [CrossRef]
  28. Hu, Y.; Hao, X.; Zhao, D.; Fu, K. Enhancing the CH4 Yield of Anaerobic Digestion via Endogenous CO2 Fixation by Exogenous H2. Chemosphere 2015, 140, 34–39. [Google Scholar] [CrossRef]
  29. Khalid, A.; Arshad, M.; Anjum, M.; Mahmood, T.; Dawson, L. The Anaerobic Digestion of Solid Organic Waste. Waste Manag. 2011, 31, 1737–1744. [Google Scholar] [CrossRef]
  30. Rodhe, L.K.K.; Ascue, J.; Willén, A.; Persson, B.V.; Nordberg, Å. Greenhouse Gas Emissions from Storage and Field Application of Anaerobically Digested and Non-Digested Cattle Slurry. Agric. Ecosyst. Env. 2015, 199, 358–368. [Google Scholar] [CrossRef]
  31. Khalid, M.; Hassani, D.; Bilal, M.; Asad, F.; Huang, D. Influence of Bio-Fertilizer Containing Beneficial Fungi and Rhizospheric Bacteria on Health Promoting Compounds and Antioxidant Activity of Spinacia oleracea L. Bot. Stud. 2017, 58, 35. [Google Scholar] [CrossRef] [PubMed] [Green Version]
  32. Pessuto, J.; Scopel, B.S.; Perondi, D.; Godinho, M.; Dettmer, A. Enhancement of Biogas and Methane Production by Anaerobic Digestion of Swine Manure with Addition of Microorganisms Isolated from Sewage Sludge. Process Saf. Environ. Prot. 2016, 104, 233–239. [Google Scholar] [CrossRef]
  33. Salomoni, C.; Caputo, A.; Bonoli, M.; Francioso, O.; Rodriguez-Estrada, M.T.; Palenzona, D. Enhanced Methane Production in a Two-Phase Anaerobic Digestion Plant, after CO2 Capture and Addition to Organic Wastes. Bioresour. Technol. 2011, 102, 6443–6448. [Google Scholar] [CrossRef] [PubMed]
  34. Yang, W.; Li, S.; Qv, M.; Dai, D.; Liu, D.; Wang, W.; Tang, C.; Zhu, L. Microalgal Cultivation for the Upgraded Biogas by Removing CO2, Coupled with the Treatment of Slurry from Anaerobic Digestion: A Review. Bioresour. Technol. 2022, 364, 128118. [Google Scholar] [CrossRef]
  35. Xu, S.; Qiao, Z.; Luo, L.; Sun, Y.; Wong, J.W.C.; Geng, X.; Ni, J. On-Site CO2 Bio-Sequestration in Anaerobic Digestion: Current Status and Prospects. Bioresour. Technol. 2021, 332, 125037. [Google Scholar] [CrossRef]
  36. Czatzkowska, M.; Harnisz, M.; Korzeniewska, E.; Koniuszewska, I. Inhibitors of the Methane Fermentation Process with Particular Emphasis on the Microbiological Aspect: A Review. Energy Sci. Eng. 2020, 8, 1880–1897. [Google Scholar] [CrossRef] [Green Version]
  37. Chen, L.; Neibling, H. Anaerobic Digestion Basics; University of Idaho Extension: Moscow, ID, USA, 2014; Volume 6, pp. 1–6. [Google Scholar]
  38. Mlinar, S.; Weig, A.R.; Freitag, R. Influence of NH3 and NH4+ on Anaerobic Digestion and Microbial Population Structure at Increasing Total Ammonia Nitrogen Concentrations. Bioresour. Technol. 2022, 361, 127638. [Google Scholar] [CrossRef]
  39. Shehu, M.S.; Abdul Manan, Z.; Wan Alwi, S.R. Optimization of Thermo-Alkaline Disintegration of Sewage Sludge for Enhanced Biogas Yield. Bioresour. Technol. 2012, 114, 69–74. [Google Scholar] [CrossRef]
  40. Lee, J.J.; Choi, C.U.; Lee, M.J.; Chung, I.H.; Kim, D.S. A Study of NH3-N and P Refixation by Struvite Formation in Hybrid Anaerobic Reactor. Water Sci. Technol. 2004, 49, 207–214. [Google Scholar] [CrossRef]
  41. De La Rubia, M.A.; Perez, M.; Romero, L.I.; Sales, D. Anaerobic Mesophilic and Thermophilic Municipal Sludge Digestion. Chem. Biochem. Eng. Q. 2002, 16, 119–124. [Google Scholar]
  42. Bouallagui, H.; Rachdi, B.; Gannoun, H.; Hamdi, M. Mesophilic and Thermophilic Anaerobic Co-Digestion of Abattoir Wastewater and Fruit and Vegetable Waste in Anaerobic Sequencing Batch Reactors. Biodegradation 2009, 20, 401–409. [Google Scholar] [CrossRef] [PubMed]
  43. Riau, V.; De la Rubia, M.Á.; Pérez, M. Temperature-Phased Anaerobic Digestion (TPAD) to Obtain Class A Biosolids: A Semi-Continuous Study. Bioresour. Technol. 2010, 101, 2706–2712. [Google Scholar] [CrossRef] [PubMed]
  44. Schnürer, A. Biogas Production: Microbiology and Technology. In Anaerobes in Biotechnology; Hatti-Kaul, R., Mamo, G., Mattiasson, B., Eds.; Springer International Publishing: Cham, Switzerland, 2016; pp. 195–234. ISBN 978-3-319-45651-5. [Google Scholar]
  45. Babaee, A.; Shayegan, J.; Roshani, A. Anaerobic Slurry Co-Digestion of Poultry Manure and Straw: Effect of Organic Loading and Temperature. J. Environ. Health Sci. Eng. 2013, 11, 15. [Google Scholar] [CrossRef] [PubMed] [Green Version]
  46. Trzcinski, A.P.; Stuckey, D.C. Treatment of Municipal Solid Waste Leachate Using a Submerged Anaerobic Membrane Bioreactor at Mesophilic and Psychrophilic Temperatures: Analysis of Recalcitrants in the Permeate Using GC-MS. Water Res. 2010, 44, 671–680. [Google Scholar] [CrossRef] [Green Version]
  47. Kim, J.K.; Oh, B.R.; Chun, Y.N.; Kim, S.W. Effects of Temperature and Hydraulic Retention Time on Anaerobic Digestion of Food Waste. J. Biosci. Bioeng. 2006, 102, 328–332. [Google Scholar] [CrossRef]
  48. Yao, Y.; Huang, G.; An, C.; Chen, X.; Zhang, P.; Xin, X.; Shen, J.; Agnew, J. Anaerobic Digestion of Livestock Manure in Cold Regions: Technological Advancements and Global Impacts. Renew. Sustain. Energy Rev. 2020, 119, 109494. [Google Scholar] [CrossRef]
  49. Kashyap, D.R.; Dadhich, K.S.; Sharma, S.K. Biomethanation under Psychrophilic Conditions: A Review. Bioresour. Technol. 2003, 87, 147–153. [Google Scholar] [CrossRef]
  50. Wang, S.; Ma, F.; Ma, W.; Wang, P.; Zhao, G.; Lu, X. Influence of Temperature on Biogas Production Efficiency and Microbial Community in a Two-Phase Anaerobic Digestion System. Water 2019, 11, 133. [Google Scholar] [CrossRef] [Green Version]
  51. Castillo M., E.F.; Cristancho, D.E.; Victor Arellano, A. Study of the Operational Conditions for Anaerobic Digestion of Urban Solid Wastes. Waste Manag. 2006, 26, 546–556. [Google Scholar] [CrossRef]
  52. Fezzani, B.; Cheikh, R. Ben Two-Phase Anaerobic Co-Digestion of Olive Mill Wastes in Semi-Continuous Digesters at Mesophilic Temperature. Bioresour. Technol. 2010, 101, 1628–1634. [Google Scholar] [CrossRef] [PubMed]
  53. Torres-Castillo, R.; Llabrés-Luengo, P.; Mata-Alvarez, J. Temperature Effect on Anaerobic Digestion of Bedding Straw in a One Phase System at Different Inoculum Concentration. Agric. Ecosyst. Env. 1995, 54, 55–66. [Google Scholar] [CrossRef]
  54. Briski, E.; VanStappen, G.; Bossier, P.; Sorgeloos, P. Laboratory Production of Early Hatching Cysts of Artemia Sp. by Selection. In Departmental Seminar; Great Lakes Institute for Environmental Research, University of Windsor: Windsor, ON, Canada, 2007. [Google Scholar]
  55. Zhu, B.; Gikas, P.; Zhang, R.; Lord, J.; Jenkins, B.; Li, X. Characteristics and Biogas Production Potential of Municipal Solid Wastes Pretreated with a Rotary Drum Reactor. Bioresour. Technol. 2009, 100, 1122–1129. [Google Scholar] [CrossRef] [PubMed]
  56. Hernández-Berriel, M.C.; Márquez-Benavides, L.; González-Pérez, D.J.; Buenrostro-Delgado, O. The Effect of Moisture Regimes on the Anaerobic Degradation of Municipal Solid Waste from Metepec (México). Waste Manag. 2008, 28, 14–20. [Google Scholar] [CrossRef]
  57. Bouallagui, H.; Ben Cheikh, R.; Marouani, L.; Hamdi, M. Mesophilic Biogas Production from Fruit and Vegetable Waste in a Tubular Digester. Bioresour. Technol. 2003, 86, 85–89. [Google Scholar] [CrossRef]
  58. Yuan, Y.; Guo, S.; Li, F.; Wu, B.; Yang, X.; Li, X. Coupling Electrokinetics with Microbial Biodegradation Enhances the Removal of Cycloparaffinic Hydrocarbons in Soils. J. Hazard. Mater. 2016, 320, 591–601. [Google Scholar] [CrossRef]
  59. Adekunle, K.F.; Okolie, J.A. A Review of Biochemical Process of Anaerobic Digestion. Adv. Biosci. Biotechnol. 2015, 06, 205–212. [Google Scholar] [CrossRef] [Green Version]
Figure 1. Bioreactors with treatment and leachate discharge valves. Bioreactor schematic: (a) front view; (b) plan view; (c) isometric view; (d) laboratory implementation.
Sustainability 15 06482 g001
Figure 2. The connection of the sensors to the microcontroller system. The sensors collected variations in the gases mentioned above and in temperature and humidity.
Sustainability 15 06482 g002
Figure 3. Model of a bioreactor: (a) coupling of devices in the bioreactor; (b) protective box for the sensors.
Sustainability 15 06482 g003
Figure 4. Sequence of the collection and placement of biomass in bioreactors. This figure shows the cattle and swine collection event.
Sustainability 15 06482 g004
Figure 5. Fluctuations in the main factors in the four treatments during anaerobic digestion. (a) Variations in methane (CH4); (b) variations in carbon dioxide (CO2); (c) variations in ammonium (NH3); (d) the temperature of the environment; (e) the temperature of the digestate; (f) the relative humidity of the digestate. Each box represents the median and the 25th and 75th percentiles of the four treatments in the four phases of anaerobic digestion (whiskers indicate the normal data range).
Sustainability 15 06482 g005
Figure 6. Fluctuations in greenhouse gases (GHGs) in the four treatments within the four phases of anaerobic digestion. Each box represents the median and 25th and 75th percentiles of treatments within each phase of anaerobic digestion. The whiskers indicate the normal data range, and the circles represent outliers.
Sustainability 15 06482 g006
Figure 7. Fluctuations in the main factors in the four treatments within the four phases of anaerobic digestion. (a) Variations in methane (CH4); (b) variations in carbon dioxide (CO2); (c) variations in ammonium (NH3); (d) the temperature of the environment; (e) the temperature of the digestate; (f) the relative humidity of the digestate. Subfigure: I Hydrolysis, II Acidogenesis, III Acetogenesis and IV Methanogenesis. The lines of different colors represent the mean of each treatment, and the gray shading represents the standard error.
Sustainability 15 06482 g007
Table 1. Technical characteristics of the electrochemical and electronic sensors.
SensorGasesUnitRange PrincipleVoltageOutput
MQ4Methaneppm200–10,000Resistive5 VAnalog
MQ135Ammoniappm100–300Resistive5 VAnalog and Digital
MG811Carbon dioxideppm0–10,000Resistive5 VAnalog and Digital
DHT11Temperature and humidity°C and %0–50 °CNTC and resistive5 VAnalog and Digital
DS18B20Relative temperature°C−55–125 °CNTC and resistive5 VAnalog
Table 2. Chemical composition of the swine excreta (EC: electrical conductivity; OM: organic material); modified from [25].
MO % Humidity %pHEC dS/mN %P2O5 %K2O %CaO%MgO %Na %Fe ppm Cu ppm Zn ppm Mn ppm B ppm
80.8626.236.366.272.04 6.11.633.982.00.23 2938515804881417
Table 3. Composition of the beneficial microbial consortia in colony-forming units per milliliter of solution.
MicroorganismCFU/mL
1Acinetobacter sp.0.34298
2Aeromonas sp.129.475
3Alcaligenes sp.28.472
4Bacillus cereus202.941
5Bacillus subtilis121.231
6Candida sp.0.98246
7Clostridium sp.190.928
8Lactobacillus sp.0.39875
9Listeria monocytogenes0.45922
10Micrococcus sp.213.476
11Pseudomonas aeruginosa0.6439
12Pseudomonas fluorescens0.27424
13Pseudomonas putida162.572
14Saccharomyces cerevisiae274.925
15Salmonella sp.0.29289
16Yarrowia lipolytica123.827
Table 4. Resulting p-values for paired post hoc comparisons that were performed with Dunn’s test. Comparisons with significant differences (significance level: p < 0.05) are shown in bold.
Post Hoc (Dunn’s Test)
Kruskal-Wallis ModelT1–T2 T1–T3 T2–T3 T1–T4 T2–T4 T3–T4
Temperature ~ Treatment<0.001 <0.001 <0.001 <0.001 <0.001 0.061
Humidity ~ Treatment<0.001 <0.001 <0.001 <0.001 <0.001 0.014
CO2 ~ Treatment0.024 <0.001 <0.001 0.30.174 <0.001
CH4 ~ Treatment0.002 <0.001 <0.001 <0.001 0.036 <0.001
NH3 ~ Treatment<0.001 0.016 <0.001 <0.001 <0.001 <0.001
Table 5. Phases and duration of anaerobic digestion in the reactors.
SymbologyPhaseTime (Days)
PIHydrolysis9
PIIAcidogenesis7
PIIIAcetogenesis7
PIVMethanogenesis10
Disclaimer/Publisher’s Note: The statements, opinions and data contained in all publications are solely those of the individual author(s) and contributor(s) and not of MDPI and/or the editor(s). MDPI and/or the editor(s) disclaim responsibility for any injury to people or property resulting from any ideas, methods, instructions or products referred to in the content.

