Abstract
Offshore solar emergence is driven by a lack of available land and the immense decarbonisation targets. It is a promising area of solar photovoltaic application, with multiple benefits when co-located with offshore wind, and with almost unlimited potential for nations living close to the sea. Research to understand the environmental implications of offshore solar must be carried out in parallel with the realization of the first pilot demonstrations. Such pilots provide important opportunities to learn to collect field data that can be used to verify untested assumptions about possible negative and positive impacts on the marine ecosystem and serve as input data for models that can forecast the effects of much larger-scale offshore solar. This paper reports on (1) the monitoring methods and first results of water quality parameters collected underneath a small (50 kWp and 400 m2) floating solar farm and at a reference location in the open sea; (2) observations of birds on top of the floating solar platforms and (3) biogeochemistry characteristics of the seabed around the solar farm. Both the water quality and the seabed characteristics studied here did not show a clear trend or deviation from normal conditions. The observations of birds on the floating platform were first-of-its-kind; no comparison is made to other floating infrastructure or other locations. Useful insights were gathered with respect to monitoring approaches around floating solar structures in high wave conditions.
1. Introduction
1.1. Need for Offshore Solar
With approximately 70% of Earth’s surface being water, offshore solar can contribute considerably to the world’s need to accelerate the share of renewables in the global energy portfolio. Offshore floating solar technology replaces the need to install (more) photovoltaic (PV) power plants over valuable land. This is important for regions where land resources are scarce, or the land is undesirable for PV installations, that is, when it conflicts with, e.g., urbanisation, nature, or agricultural use [1]. A country that is very densely populated and has few land resources is the Netherlands. For future climate-neutral scenarios, PV is an important renewable resource for the Netherlands. Due to the electrification of energy, PV is projected to increase two- or threefold from its 14 GW capacity that was reached by the end of 2021 [2]. The development of land space-intensive renewable energy technologies, such as solar and wind, increasingly sees more grid connection issues due to congestion, as well as stakeholder conflicts, resulting in more expensive projects (higher rents, longer procedures) and fewer CO2 reductions (projects remain smaller, implementation times are longer, fewer projects).
Various studies have resulted in area requirements for PV at other terrains, such as water areas [3,4]. Especially offshore locations for PV provide an incredibly large potential as the Dutch North Sea covers 58.500 km2; in comparison, the Dutch land area covers 41.850 km2. Both land and sea in the Netherlands are intensively used, and placement of offshore PV will also require careful spatial planning. It is foreseen that offshore solar will follow the same path as the Dutch wind energy sector took at the beginning of the 21st century when large-scale developments of wind parks offshore became favoured over onshore wind projects as the level of public acceptance dropped due to the Not-In-My-Backyard (NIMBY) syndrome, and costs for utility-scale wind parks offshore came down partly as a result of this. The Netherlands is taking a leading role in moving the novel technology of offshore solar towards commercial applications [5] with a world’s-first demonstration pilot (Figure 1). The Technology Readiness Level (TRL) of this design is six at the time of writing, which means the design has been tested and demonstrated in a relevant environment [6].
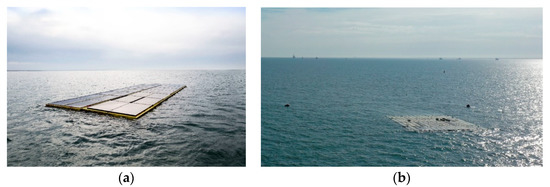
Figure 1.
(a) First two modules of the offshore floating solar array of Oceans of Energy installed nearshore in the Dutch North Sea in 2019; (b) Sixty-four (64) interconnected modules creating a floating farm with one-third the size of a football field, operational 12 km offshore from The Hague, the Netherlands since 2020. Farm will be expanded to 1 MW-size in 2023; 1 MW-size is approximately one football field large [7].
1.2. Advantages of Offshore Solar
Aside from saving valuable land resources, offshore PV has a higher energy yield per module than land-based solar PV due to the higher efficiency of water and wind-cooled PV modules and the reflective properties of water [1,8]. These factors combined, plus an additional effect of albedo, cause an efficiency increase of up to 14% compared to onshore PV, as modelled for a Dutch case study [9,10]. Another reason for the higher energy yield is the less partial shading on the floating panels on the open sea [1,8].
From a spatial perspective, offshore solar is best placed in the empty space between individual wind turbines that are placed approximately 1.5 km apart. Based on Oceans of Energy’s design, the installed energy capacity per square kilometre in Dutch wind parks can be up to 150–200 MWp (depending on the efficiency of PV modules) of installed solar capacity at 1 km2 versus approximately four wind turbines of 10–14 MWp installed capacity. It was recently estimated that a 200 TWh/yr offshore PV potential (equivalent to 229 GWp installed capacity) for the Dutch North Sea [11] would correspond to using 25% of the available area (adding to 1650 km2, which is 2.8% of the North Sea) within future offshore wind parks (covering 6600 km2), if these are deployed to 60 GW the upper ranges in the Dutch energy scenarios for 2050 [12]. In the context of increasingly busy sea spaces, this kind of marine spatial planning of energy multi-use can facilitate the development of a sustainable blue economy. Other advantages follow from the co-location of the solar farms in between the wind parks. First of all, benefits of combining offshore wind with solar can likely be incurred in domains, such as shared installation, shared operations and maintenance, and system benefits, such as a wave dampening function of floating solar that results in lower impacts on wind turbines and calmer seas which is also advantageous for aquaculture activities. Finally, there is a techno-economic advantage to combining offshore solar and wind, which is the principle of cable pooling [13]. The wind farm capacity factor (defined as the ratio of energy generated over a time period, usually a year, divided by the installed capacity) is assumed to be between 30 and 35%. Cable pooling allows us to add floating solar capacity to the export cable of the wind park. Due to the negative correlation between solar and wind resources, this sharing of infrastructure maximizes offshore renewable electricity generation without additional costs and limited curtailment of (solar) energy. Figure 2 shows an example of an energy production profile with wind (blue) and solar (yellow) combined for a location on the Dutch North Sea. Overall, the production profile increases and becomes more stable throughout the year.
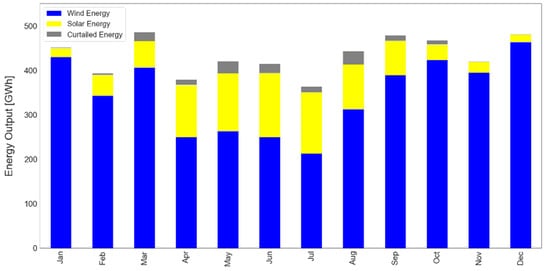
Figure 2.
Monthly generation profiles of 1000 MW offshore wind (blue), 1000 MW offshore solar (yellow) and curtailed energy (grey) as a result of a 1000 MW power export cable constraint. Curtailment means that due to the limited capacity of the power export cable, surplus (solar) power generated cannot be utilised and goes unused. It can be seen that throughout the year, the energy production profile is more stable with the added solar energy. Very limited curtailment of solar energy is foreseen based on a North Sea wind and solar dataset, accessed through the LaRC POWER Project API service, from January 2020 to December 2020, located at the Borssele I and II wind park. Similar results are obtained in [13], suggesting a 1:1 ratio of wind and solar can already be established in current wind parks without modifications to the export cable. Source: Offshore Solar Integration computation model for assessing solar resource potential made by Oceans of Energy.
1.3. Expected Interactions of Offshore Solar with the Marine Environment
Like any man-made offshore development, offshore solar may result in changes to the environment. Some impacts, whether negative or positive, are non-specific to offshore solar, while others are. To the authors’ knowledge, up till now, there have not been any environmental field studies published concerning the specific impacts of offshore solar. Knowledge of the impacts of inland floating photovoltaics (FPV) is emerging [14,15,16,17,18,19,20], but insight is not readily transferable to marine environments as they are unbounded, tidal, saline, highly ecologically diverse, and generally experience stronger winds, waves, and currents [21].
The Netherlands is taking a leading role in initiating the first environmental studies aiming to increase the understanding of the impacts of offshore solar on the marine ecosystem. Various field studies from universities and research institutes are ongoing at a 1 MW-sized-to-be pilot farm (Figure 1b) [22], situated 12 km offshore of The Hague in water depths of 22 m, high waves, and strong currents, but no results from these studies have been published yet. A first modelling study [23] aiming to understand the effects of large-scale floating platforms on hydrodynamics and primary production in a coastal sea like the North Sea was carried out in 2020. This study used a water column model, which indicated the dominance of shading effects. However, for platform coverage of up to 20% of the model surface, which translates to exceedingly large-scale FPV farms (tens of kms), modelled reductions of phytoplankton primary production were only small. The other primary effects very investigated included reduced wind forcing of the water, drag of the structures on the flow and reductions in wave conditions, which resulted in relatively minor additional or compensating contributions. Apart from primary production, other variables were also affected, such as temperature, stratification, and suspended sediment concentrations [23].
Table 1 lists the hypothesised empirical offshore solar-specific environmental effects we address in this paper, with a focus on flora and fauna, its cause or stressor and the receptor. The offshore floating solar pilot described in this paper presented the first opportunity to (1) develop and test various environmental field monitoring approaches that could also be used for upscaled offshore solar farms; (2) perform scientific research that allows for a preliminary assessment of possible environmental impacts of offshore solar and (3) provide first field data that can be used to update the water column model.

Table 1.
Some hypothesised environmental effects on flora and fauna of offshore solar discussed in this paper.
Figure 3 shows the four monitoring foci through which we attempted to gather information: (a) continuous monitoring of water quality parameters underneath the floating system; (b) vertical light profiling underneath the floating system; (c) sampling of the sediment bed underneath and around the floating system and (d) observations of marine life (birds) on top of the floating platforms.
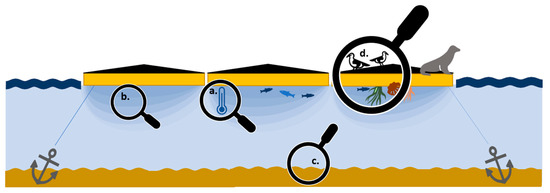
Figure 3.
Overview of environmental observation and research activities at small-scale offshore solar farms. (a) (semi-)continuous monitoring of a number of water quality parameters 60 cm underneath the floating system; (b) vertical light profiles underneath the floating system to understand the shadow effect. Note that the space (‘light tunnel’) in between the floaters is 35 cm; (c) sampling of the sediment bed; (d) observation of aggregation of marine life on top and underneath the platforms.
1.4. Offshore Solar System and Environmental Site Description
The floating solar farm, designed and built by Oceans of Energy, was installed at a sea site approximately 1 km from the Dutch coast in the Province of Zeeland (Figure 4a) from November 2019 till May 2021 (18 months). The floating PV system with a system capacity of 50 kWp consisted of nine individual platforms (rectangular, each covering 30 m2, having a very low draft and reaching just above the waterline, see Figure 1a) attached to each other, creating a horizontal footprint of approximately 400 m2.
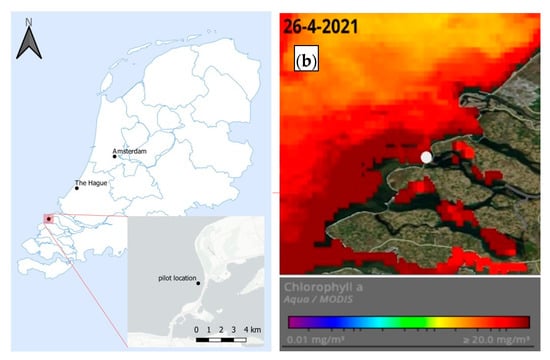
Figure 4.
(a) Map of the Netherlands with an inset of pilot location in the southwest province of Zeeland. (b) Chlorophyll-a concentrations (mg/m3) on 26 April 2021 as captured by satellite Aqua/MODIS. The sampling location is indicated with a white dot. Source: NASA Earth Data.
Water depth ranges between 4–7 m depending on tides. Tidal velocities are low (spring tides around 0.3 m/s) and move bi-diurnally up and down along the NNE-SSW-oriented coast. In this part of the North Sea, the chlorophyll-a concentration is high (Figure 4b), which is indicative of high primary productivity. The coastal area is part of a larger coalescing ebb-tidal delta that stretches along (former) islands of the estuaries that define the southwest of the Netherlands. The site is partly bounded by sandbanks yet still experiences significant wave and wind action, particularly during the winter months. The general wind direction is southwest. Throughout the operational phase, the floating system was subjected to several extreme weather conditions, including significant wave heights of up to 5 m during storm Odette in September 2021. The system withstood all wind and waves forces and was successively transported to a test site located further offshore (12 km off the coast of The Hague), where it is still today and will become the first 1 MW-sized farm in high waves conditions in 2023.
2. Materials and Methods
2.1. Water Quality
A multi-sensor sonde (YSI EXO3) was used to measure the following water quality parameters: water temperature (°C), salinity (ppt), turbidity (FNU), chlorophyll-a (as a measure of phytoplankton, RFU) and dissolved oxygen (mg/L). The Formazin Nephelometric Units (FNU) and Relative Fluorescence Units (RFU) for turbidity and chlorophyll, respectively, are used as a surrogate for, respectively, total suspended solids (organic and inorganic fine particles) (mg/L) and phytoplankton concentrations (mg/L), as these cannot be measured directly in the field with the used multi-sensor sonde. The relationships between the measured units and the real concentrations (mg/L) are instrument and site-specific. Correlation curves between measured units and concentrations in mg/L have not been established as this was not deemed necessary for the purpose of this study.
Two types of measurement techniques were tested. Time-series measurements were carried out, collecting data every 20 min at one (central) location underneath the platform. The sensor was deployed in a custom-made, very robust construction frame, placing the sensor vertically in the water column at 60 cm water depth. This depth was chosen to minimize the effects of turbulence and air bubbles on measurements while at the same time measuring as close to the water surface as possible (where effects, if any, are expected to be largest and, therefore, easiest detected). Equivalent time series measurements at reference sites were not collected due to limited resources and a lack of reference stations available in the area.
In addition, vertical profiles were made, collecting data at a 1 s interval, in which the multi-sensor sonde was lowered steadily (roughly 10 cm/s) towards the seabed at slack tide using a manual winch system. This was performed underneath the FPV farm by lowering the sensor through the gap between two individual platforms as close to the centre of the farm as possible; and immediately after at a nearby ‘open sea’ reference site 100 m to the north. The time period between the data collection of the two vertical profiles was always 15–20 min. Data were binned at 0.5 m intervals (i.e., 0–0.5 m, 0.5–1 m, 1–1.5 m, etc.) and subsequently, unpaired t-tests (Welch’s unequal variances t-tests) were used at each depth interval to test the hypothesis that the two populations (data collected underneath the farm and at the reference site) have equal means.
2.2. Light Attenuation
In order to obtain a first insight into the extent of the shadow cast by the floating platforms, simple light intensity/temperature sensors (HOBO MX2202) were used to compare the light conditions under the platforms to a nearby ‘open sea’ reference site. Two lines with every 7 sensors were suspended from the central platform in the farm and from an anchored marker buoy located 100 m from the platform array. Weights were added to the lines to ensure the lines would hang straight and not drift with the tidal currents. The logging interval was 30 s, and lines were kept in place for 1 h (starting 30 min before the slack tide and ending 30 min after the slack tide). Pressure sensors (HOBO U20L) were attached to the lowest light logger of each line in order to determine its depth and the theoretical depth of the other light loggers (using a reading of local atmospheric pressure as well). Data were binned at 0.5 m intervals (i.e., 0–0.5 m, 0.5–1 m, 1–1.5 m, etc.), and again Welch’s unequal variances t-tests were used to test for significant differences between the two sites at each depth interval.
2.3. CN Elemental Analysis of the Sediment
A CN elemental analysis of the sediment was carried out to be able to verify the hypothesis that input organic matter (OM) increased and led to an enrichment of the sediment below the platforms. A week before the platforms were removed in May 2021, a large sediment campaign was carried out. In total, 24 cores were taken from a boat with a monocorer (54 mm diameter) below the platforms and along transects (10 m–30 m–50 m–100 m) in all four wind directions around the platforms (Figure 5). Of each core, ten samples were taken. The top 5 cm of the core was sliced into 1 cm thick slices. From 5 cm to 15 cm, each sample was 2 cm thick, resulting in a total of 10 samples per core and a total of 240 samples. These were separately stored and put in a freezer at −20 °C before geochemical analysis was carried out in the lab one month later.
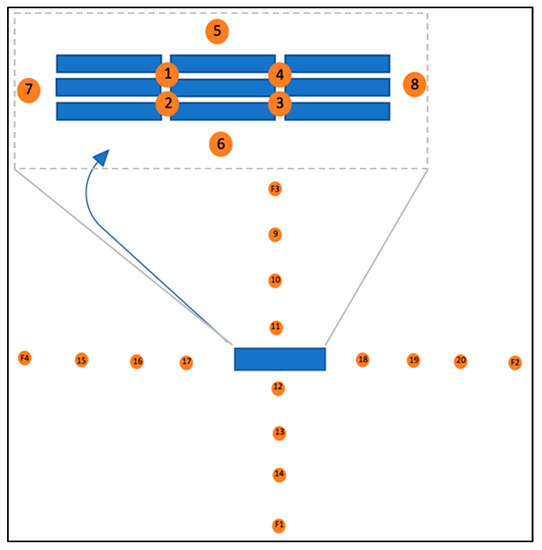
Figure 5.
Sampling locations taken from the platform (number 1–8), and the transects taken from the boat (9–20 and F1–F4). The transects were taken at 10–30–50–100 m from the platforms in each wind direction. Top of the figure is a zoomed-in view of the single blue rectangle in the middle.
In the lab, the samples were freeze-dried and powdered by hand using a mortar and pestle. Approximately 0.3 g of each sample was decalcified with 1 M HCl to remove the CaCO3 component and then weighed again. The decalcified residue was used to prepare the (5–10 mg) samples for CN elemental analysis. The amount of organic carbon (Corg) was calculated using the following formula:
- C% = result of CN analyser in decalcified sample
- M1 = weight of sample before decalcification
- M2 = weight of sample after decalcification
The amount of organic nitrogen (Norg) was calculated using the formula:
- M1 = weight of sample before decalcification
Corg content is used as an indication of the potential input of Organic Matter (OM) from the floating solar system.
2.4. Aggregation of Marine Life
For a period of 18 months (from December 2019 to May 2021), a timelapse camera (Brinno TLC200 PRO) was installed on the floating solar array that allowed for visual monitoring of the interactions of birds and seals with the platforms. The camera was installed using a double-layered watertight case system mounted to a pole elevated about 1.5 m from the floating platforms. The time-lapse interval was not consistent throughout the monitoring period and varied between 2 s to 1 h. The position of the camera also changed during the monitoring period, as did the size and configuration of the offshore farm. The camera was not suitable for capturing images at night. For these reasons, we only report on general qualitative observations. Nevertheless, this marine life monitoring exercise was valuable in shaping ongoing and future research methods for this topic.
The timelapse footage was analysed, and all animals that were observed on the floating system were classified into broad classes. Birds were not identified at the species level nor according to age classes (i.e., juvenile, adult) because of a lack of expertise and generally low image quality. We did not count any flying birds. Animal counts were then compared with weather data (i.e., significant wave height) in order to determine during what wave conditions animals visit the floating system.
3. Results
3.1. Water Quality Measurements
Long-term monitoring (throughout the operational phase of the solar farm) of various water quality parameters is expected to be mandatory from an environmental regulatory perspective as large-scale offshore solar becomes a reality in the near future. What type of water quality parameter monitoring will be required, and in what manner (surface measurements, vertical profiles) is probably to some degree site-specific; at the very least, we expect temperature, turbidity, chlorophyll, and dissolved oxygen to be important water quality parameters. With the above in mind, this pilot was a first opportunity to gain experience with collecting such data in a new and challenging environment, that is, underneath the platforms in the upper part of the water column close to the sea surface. The method used to install the sensor on the offshore solar farm turned out to be a good way to collect quality data. Even when waves were high, we did not see any disturbance (e.g., by turbulence or air bubbles) in the data. Fortunately, the setup also made it easy to install and remove the sensor from its mooring cage with minimal tools and without having to work underwater.
The final dataset contained several short periods of trial data and one uninterrupted time series from March to August 2020 (Figure 6). Surface water temperature ranged between 5–20 °C. Turbidity was generally constant with the exception of some high turbidity peaks (lasting ±10 days). Salinity ranged roughly between 25–34 psu, with lower salinity values coinciding with rainfall events. Note that the occasional drop in salinity is accompanied by a peak in turbidity, reflecting bad weather events with prolonged rainfall and high wave conditions, stirring up suspended sediment from the seabed. On the other hand, peaks in turbidity are not necessarily accompanied by a drop in salinity, suggesting there are also other factors influencing local turbidity. The multi-sensor sonde did not include a dissolved oxygen and chlorophyll sensor yet.
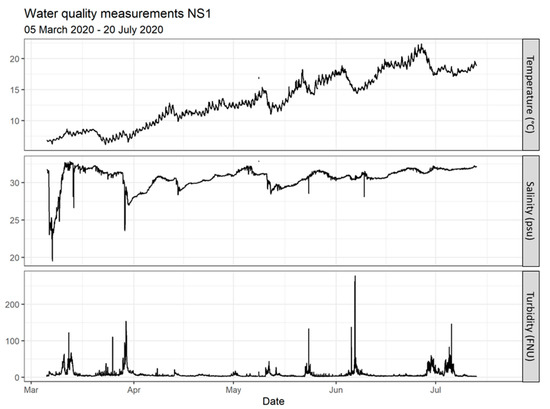
Figure 6.
Logged times series of temperature, salinity, and turbidity throughout several months in 2020. Location was at 60 cm depth into the water column underneath the (centre of the) floaters.
Next, we experimented with gathering water quality data throughout the entire water column underneath the floating farm as well as at a reference site and with only one multi-sensor sonde. It is important to note that these were single ‘dips’ to the bottom and back up, and that the vertical profiles underneath the farm and at the reference site were not taken at the exact same time. The main objective, again, was to gain experience with collecting data in this manner and to find out if this was an approach that could be used as well in the next field campaigns.
Figure 7 shows the vertical profiles of temperature, salinity, turbidity, chlorophyll, and dissolved oxygen on three different days in the winter of 2020–2021. Some statically significant differences can be observed between the two populations (underneath the solar farm and at a reference site) at certain depth intervals (especially in the turbidity and chlorophyll data); however, no clear conclusion can be drawn due to the fact that the dataset is too limited and too scattered, and the field monitoring technique proved suboptimal, that is, only one sensor was available, and thus we were not able to collect the two vertical profiles at the same time, which would have eliminated temporal variations. Recommendations for monitoring improvements are given in the Discussion section.
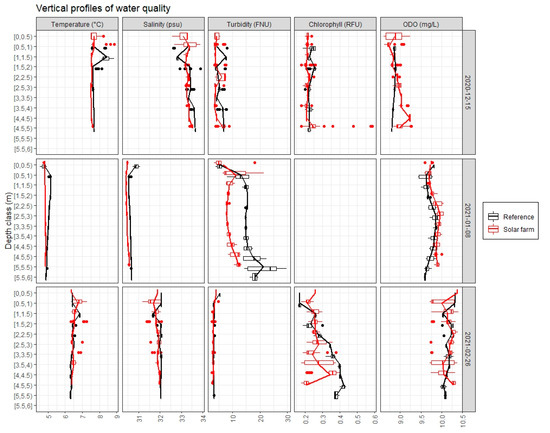
Figure 7.
Vertical profiles of temperature, salinity, turbidity, chlorophyll (as a measure of phytoplankton) and dissolved oxygen taken underneath the floating solar farm (red line) and at a reference site in open water nearby (black line) on 15 December 2020, 8 January, and 26 February 2021. Boxplots represent data distribution (from the 25th percentile to the 75th percentile) within each binned depth interval. The dots indicate outliers. No significant trends could be observed. Note that there is no chlorophyll data on 8 January 2021 due to a faulty sensor.
Figure 8a shows one vertical profile of temperature in spring. This temperature data was collected by the same sensor that measured light (Figure 8b). An interesting observation is a more constant temperature throughout the water column underneath the solar farm, compared with the reference site, where some stratification seems to be occurring (warmer in the upper water layers, colder in the lower water layers). This temperature stratification is not observed in the three winter temperature profiles.
3.2. Light Attenuation
Figure 8b shows an example of a comparison of light attenuation through the water column underneath the floating farm and at the reference site measured on 20 May 2021. As expected, a shadow zone is present due to the floating solar farm up to 4.5 m deep. At this depth, the light levels at the reference site become equally low (approaching zero), indicating no surface light can penetrate due to the highly turbid waters at the site location. Note that the buoy at the reference site, from which the line with light sensors was attached, also casts a shadow affecting the measurements in the first 1.5 m of the water column. The light profile underneath the solar farm does show a slight peak between 1.5–2 m, indicating light is able to diffuse underneath the platforms from the sides of the farm and through the gaps (~35 cm) in between platforms.

Figure 8.
(a) Vertical depth profile of temperature and (b) light (lux) taken underneath the floating solar farm (red) and at a reference site in open water nearby (black) on 20 May 2021.
Figure 8.
(a) Vertical depth profile of temperature and (b) light (lux) taken underneath the floating solar farm (red) and at a reference site in open water nearby (black) on 20 May 2021.

3.3. Biodeposition
Offshore solar structures are highly likely to attract marine life, predominantly in the form of marine biofouling. The most dominant species to colonize structures in the North Sea is the blue mussel Mytilus edulis [24], which is what was also observed in this pilot in a separate study where the biofouling community was identified. These suspension feeders play a key role in the production of OM as they remove suspended matter, excrete (pseudo)faeces, and dissolve inorganic materials [25]. Not only does Mytilus contribute to the production of OM, micro- and macro algae, plankton, and dead organisms could enrich the sediment as the OM sinks down, potentially accumulating in the sediment. Subsequently, different organisms, oxidants and intermediate compounds degrade the organic matter (Figure 9). This study presents the first data collected in order to understand if biofouling on floating marine structures and subsequent OM production could lead to an enrichment of OM below the platform.
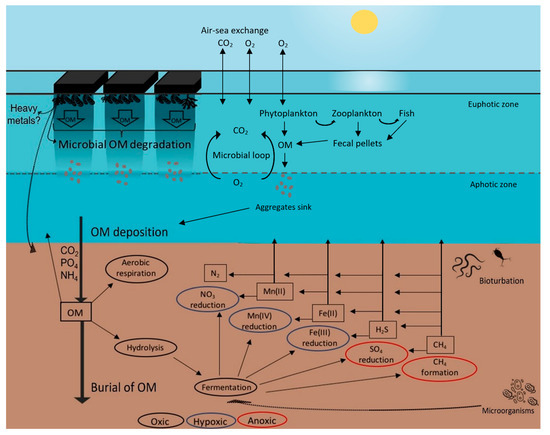
Figure 9.
Conceptual model of the production of OM by the floating solar system, the uptake and production of DOM (dissolved OM), and one of the potential OM degradation pathways in marine sediment. Under normal conditions, primary producers produce organic material, most of which is respired to carbon dioxide by microorganisms (microbial loop). In the case of the floating solar system, the OM originates from biofouling that grows on the bottom of the platforms. The effect of shadow on the degradation of OM in the water column is unknown. OM deposition on the seabed is followed by oxidation steps of OM and fermentation of smaller compounds by respiring microorganisms and methanogens. Aerobic respiration only occurs under oxic, whereas the reduction of sulphate and methane formation occur under anoxic conditions. Furthermore, bioturbation by benthic fauna can alter OM burial and degradation [26,27,28]. Figure adapted from [27,28].
To test the hypothesis that the floating structure leads to an enrichment of organic material, the concentration of both organic nitrogen and organic carbon was determined. At all sites and throughout all depths, both the concentration of Norg and Corg remained high and relatively constant (Figure 10). The amount of Norg in wt% was between 0.12 wt% and 0.27 wt%, with an average of 0.19 wt% (σ = 0.02 wt%). The amount of Corg was between 0.20 wt% and 2.77 wt% with an average of 1.82 wt% (σ = 0.33 wt%). The C/N ratio was calculated using both Corg and Norg in mol, leading to an average C/N ratio of 11.16 mol/mol (σ = 2.5 mol/mol). The C/N ratio was constant at all sites and throughout the entire section. These results imply there is no enrichment of carbon and nitrogen below the floating solar farm. To further study if the redox conditions changed due to increased OM input below and around the platform, several solid-phase depth profiles (Fe, Mn, CaCO3, S, P) were also made and statistically analysed, but none showed distinct changes among the different sites and throughout different depths [26].
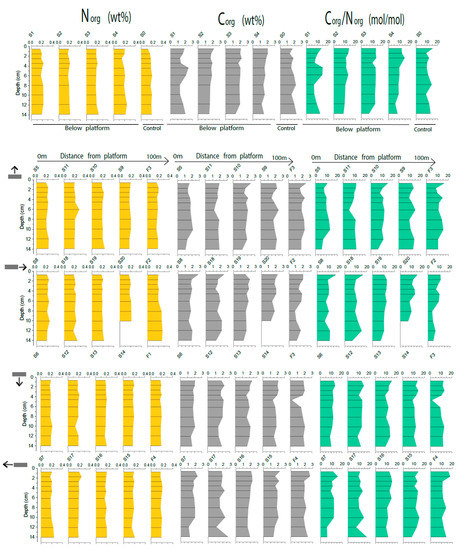
Figure 10.
Concentration of Norg in wt%, Corg in wt% and C/N ratio in mol/mol for all 25 locations. The upper row indicates the four sites below the platform and the control site. The four lower rows indicate the sites North (1st row), East (2nd row), South (3rd row) and West (4th row) [26].
3.4. Aggregation of Marine Life
Observations of birds on the floating platforms were grouped by season. Fall and winter were characterised by terns (Sterninae); in the spring and summer, mostly seagulls (Laridae) were present (Table 2). Figure 11a shows the total number of seabirds counted on timelapse images over time per month. The bar graph shows the average number of birds per individual platform. Sometimes a flock of birds spent several hours foraging on the floating farm, and in these instances, it was very difficult to determine whether a new bird had arrived or just moved position. Likely, the same birds were counted multiple times during those events.
Table 2.
Overview of observed birds on a floating solar farm over an 18-month period.
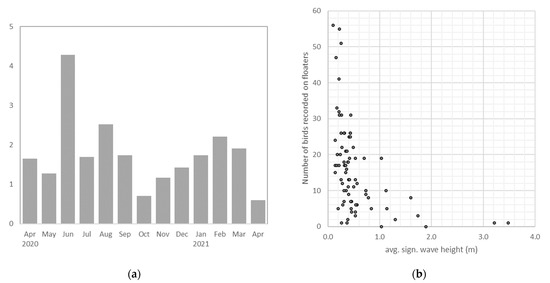
Figure 11.
(a) The average number of birds per day per individual platform that were recorded from April 2020 until April 2021; (b) The number of seabirds that were recorded at various wave conditions from February 2021 until May 2021.
Figure 11b shows the average significant wave height against the number of birds counted. It is clear that birds are predominantly present when wave conditions are relatively calm. From observations during field visits, we can confirm that most birds fly away when the platforms start moving or getting wet due to more vigorous wave action. The overtopping waves also ensure the photovoltaic panels are easily rinsed clean from bird droppings.
Seals were very rarely spotted on the floating farm (i.e., only 22 individuals in 18 months). All seals observed were Phoca vitulina, commonly known as harbour seals, which is a common species of seal along the Dutch coastline. Almost every observation was of an individual seal rather than groups of seals. There was no seasonal pattern in seal observations.
4. Discussion
4.1. Water Quality
Abiotic conditions of the ecosystem can be assessed through water quality parameters, such as temperature, turbidity, oxygen, nutrient and chlorophyll-a concentrations, each with its own implications for the functioning of the ecosystem. If the presence of an FPV farm affects one or more parameters, these could become a limiting factor for primary production [29], an important process in the ocean for all life forms. In addition, changed abiotic conditions could impact other trophic levels, such as the biofouling community and fish. For this reason, we monitored temperature, turbidity, chlorophyll-a, and oxygen in a first-ever data-gathering field campaign underneath a floating solar farm at sea. Below, we discuss the most familiar hypotheses of the effect of offshore solar on water quality, and we hold the data collected here against the light of these assumptions. However, due to the very small size of the pilot farm, meaningful differences in water quality underneath the farm and at a reference site were not detected and not expected either.
Additionally, we conclude that in order to be able to compare data from two different locations (underneath the farm and at a reference site), the measurements need to be taken at exactly the same time to make sure that any temporal variability due to tides, for instance, is eliminated. Ideally, future impact studies should follow the Before-After-Control-Impact (BACI) principle, which would account for both spatial and temporal variations. This means the impacted areas and control areas are studied before and after the floating infrastructure and anchors are installed. The vertical profiling methodology can be improved by ensuring the bottom is not disturbed by the touch of the sensor. This can be accomplished by simply measuring the water depth first before lowering the sensor. In addition, vertical profiles should cover all seasons, as the southern North Sea is known to experience seasonal stratification. At the same time, there are strong patterns in chlorophyll-a concentrations due to spring and autumn algal blooms; and turbidity is linked to weather and metocean conditions. We also recommend collecting metocean data, such as current profiles and wave spectra, especially with future ecosystem modelling in mind. These data can be collected from another nearby reference site, provided it has the same depth and bathymetry.
4.1.1. Temperature
Offshore floating solar platforms are likely to reduce the heat coming into the water by simply blocking and reflecting the irradiation. Exley et al. [30] suggested that blocking heat from the sun may affect thermal stratification, although this was specifically (modelled) for a lake system and might not be similar in the open sea. The decrease in solar radiation could cause a drop in surface water temperature, resulting in an easier mixing of the water layers. The extent of this ‘cooling’ effect depends on local conditions, such as water depth, currents, and waves, all dictating whether the site is generally well-mixed or (seasonally) stratified, which also controls what the additional impact is of the friction and wind shielding of the platforms on mixing. We did not observe typical thermal stratification in the three vertical profiles taken during the winter. We did see two contrasting vertical temperature profiles in May, between the reference site and underneath the farm, whereby the temperature underneath the farm was more constant, and the temperature at the reference site was higher close to the surface and lower close to the bottom (Figure 8). Even though it was only one observation, and the data should be interpreted very cautiously, this is indeed the trend one could expect to see in larger solar farms deployed in deeper water.
4.1.2. Chlorophyll-a
Chlorophyll-a is a parameter often used as an index of phytoplankton biomass, as it can be easily measured in the water column with a fluorometer. The number of phytoplankton is often used as an indicator of the health of a marine ecosystem. Phytoplankton requires sunlight in order to live and grow; photosynthesis is the process that makes this happen in the upper part of the water column, the photic zone. The general hypothesis is that due to the shadow cast by floating platforms, photosynthesis is prevented from taking place, and the health of phytoplankton is jeopardised or concentrations diminished. Primary production, simply the product of phytoplankton biomass times phytoplankton growth rate, is also affected in this way. An ecologically significant decline in primary production is indeed considered to be one of the major issues for freshwater FPV, but in marine waters, due to the constant motion of the seawater and the large volume of water compared to the size of solar farms, this decline of primary production with significant ecological consequences at a regional scale is very unlikely to happen. Considering the M2 harmonic constituent as the dominant tidal component, taking the tidal current amplitudes at a representative location for future large offshore solar farms in the North Sea, and integrating over half a tidal cycle (6.25 h), the estimated tidal excursion length is approximately 10 km [23]. This is the net horizontal distance travelled by a phytoplankton particle from low tide to high tide or vice versa. The largest single-body offshore solar farm now being considered realistically possible is a maximum of 1 kilometre in length, leaving ample space and time for individual phytoplankton particles to take up sunlight. Moreover, several studies have shown that various marine phytoplankton species can survive days or even months in the dark [31,32,33]. The only known field study that assessed the effect of very large floating structures on primary production, which took place in the much calmer semi-closed bay of Tokyo with current velocities in the order of cm/s, showed only a very slight diminishing impact on primary production [31].
The few vertical profiles of chlorophyll data collected in this field study do not show any conclusive trends, as anticipated, considering the small size of the pilot. This does not exempt us from stopping the monitoring of this parameter at future solar farms. The chlorophyll data will also be a valuable indicator of the degree of filter feeder activity carried out by mussels and other epifauna present underneath the solar farm. Furthermore, we see the importance of taking water samples next to collecting chlorophyll time series. As mentioned before, this is needed to establish the local relationship between RFU and mg/L chlorophyll concentration. Moreover, the phytoplankton composition can be analysed from the water samples; changes being indicative of other water mixing patterns under the platforms, bringing in phytoplankton communities from other depth layers, for instance. As mentioned before, additional hydrodynamic monitoring (i.e., waves and depth current profiles) would provide useful insights.
4.1.3. Turbidity
Due to friction induced by the platforms (and biofouling organisms present on the underside of the platforms), currents likely weaken around and under the platforms. This causes less mixing and, thus, less suspended sediment in the upper part of the water column, which reduces turbidity. Reduced wind stress due to the limitation of the free surface of the water column also reduces turbidity. These effects have been modelled with a water column model for two well-mixed locations in the North Sea [23]. Due to the direct relationship between turbidity and light attenuation, the reduction of suspended sediment at the surface in the model allowed more light to penetrate the water column. This overall decrease in suspended sediment could have a positive effect beyond the extent of the offshore floating solar farm footprint, especially in regions with light-dependent marine habitats, such as seagrass meadows, kelp forests or patch reefs, that depend on certain levels of light penetration.
The vertical turbidity profiles taken in this field study underneath the solar platforms and at a reference site do not show clear trends. There is a slightly lower turbidity observed below the solar farm compared to the reference site. However, this difference was not consistent throughout the water column, and we are also not confident this difference is due to the presence of the solar farm or part of the natural (temporal) variations.
4.1.4. Dissolved Oxygen
Dissolved oxygen is crucial for sustaining marine life, particularly that of marine organisms which rely on respiration. The physical presence of the platforms could potentially change the air-water exchange of gases, such as oxygen and CO2. Moreover, through its potential effects on stratification, the platforms could also alter the vertical mixing of oxygen (and nutrients) [34]. An indirect effect of the platforms on dissolved oxygen is the complex (and largely unknown) dynamics between filter feeders growing underneath the platforms and phytoplankton. Although filter feeders graze on oxygen-producing phytoplankton, their pseudo faeces may also provide nutrient regeneration for phytoplankton growth [35]. For these reasons, it is important to continue monitoring dissolved oxygen at (future) larger offshore solar farm sites, underneath the platforms, and throughout the water column. The vertical profiles taken in this study show slightly higher dissolved oxygen levels underneath the farm than at the reference site. However, these data are too few to be conclusive.
4.2. Light and the Benthic Community
The reduction of light attenuation due to the platforms and its effect on phytoplankton growth is discussed above in the chlorophyll section. Other effects of changes in light intensity and duration due to the platforms are discussed here. There are some cases known where the behaviour of underwater organisms in relation to their vertical migration, orientation, habitat selection, foraging and predator-prey dynamics can be affected by constant darkness [36,37]. The extent of these impacts is unknown, multi-faceted and complicated, but can be mitigated through careful positioning of the entire floating array according to the sun’s movement and also through design implementations. For example, the modular design of Oceans of Energy leaves ample light ‘tunnels’ of 35 cm wide over the entire length of the individual platforms that allow for at least 10% of light to be able to attenuate into the water column.
Whether or not light is of importance to the benthic community will depend on local benthic community composition and spatial and temporal variations of light penetration. The benthic community at the study site is unknown, although through the sediment core sampling, information about the meiofauna community was collected [26]. The diversity and abundance of meiofauna were observed to be low, containing mostly Nematoda, Copepoda and Oligochaeta, all organisms not light-dependent. Due to the very sediment-rich waters at this nearshore location, light does not penetrate to the bottom (personal findings of the divers). This is the case for the entire coastal zone up to approximately 20 km offshore due to the fact that the southwest of the Netherlands is part of the Rhine–Meuse–Scheldt delta complex with an outflow of very sediment-rich rivers [38]. Benthic habitats at the location of the present and planned wind park areas, where offshore solar is also envisioned, are adapted to very low light levels. We do not foresee any impact due to the shadow zones created by offshore solar farms.
For future studies on light attenuation under offshore solar installations, we recommend measuring light attenuation using quantum sensors instead of measuring lux, as was undertaken in this study. Quantum sensors only measure light in the wavelength range of 400–700 nm, also known as Photosynthetically Active Radiation (PAR). This is the segment of solar radiation used for photosynthesis and is, therefore, more ecologically relevant. As turbidity and chlorophyll-a concentrations directly affect the transmissibility of light through the water column, it is recommended that light attenuation profiles should always be taken in conjunction with water quality profiles. Light attenuation profiles should be taken throughout the seasons, as the changing solar elevation angle (from summer to winter) may affect how much light is able to diffuse into the water column, and seasonal variations in turbidity and chlorophyll-a may also occur.
4.3. Biodeposition
The biogeochemistry results demonstrate that the sediment at the studied site is organic-rich but that there is no detectable enrichment for this relatively short-duration deployment. However, it should be noted that in order to detect organic enrichment in an environment that is already organic-rich, the effects would need to be large. The hypothesis of additional input of OM into the sediment underneath or around the floating farm was derived from studies where organic enrichment was reported at fish farms [39,40]. Next to fish farms, we also compared our results [26] with two mussel farms, one in Scotland [41] and one in the Mediterranean [42]. Both sites did not monitor an enrichment of organic carbon, while the conditions were comparable to our site, that is, low flow velocities and comparative shallow depths. The comparative study [26] supports the general idea that shellfish farming has a smaller impact than fish farming [43] and that the small solar farm likely has little to no impact.
How much net biodeposition will take place on the seabed around a (future, large-scale) offshore solar farm will obviously depend on the size of the farm, the amount of biofouling (the influx) and the amount of time the floating infrastructure is present, and, on the other hand on the size and sinking velocity of the faecal pellets [44] and the local conditions, such as mean velocity range and tidal elevation (the outflux). These dynamics can be modelled in a dispersal model, as has been undertaken for mussel farms [45,46]. Again, this highlights the importance of collecting metocean data.
We recommend continuing to monitor the biofouling growth underneath the floating platforms for every new location. In-situ measurements of OM fallout, using sediment traps right below the platforms and near the sediment surface, could provide valuable insights into the biodeposition rate and dispersal of organic material. Such data are important to calibrate site-specific dispersal models. Finally, to assess the impact of floating platforms on benthic fauna, we suggest the collection of sediment samples in a radius using a BACI approach.
4.4. Aggregation of Marine Life
The camera observations of birds at the nearshore pilot site aim to obtain first insights into what direct and indirect opportunities floating solar farms would provide for the presence and foraging behaviour of seabirds. On a critical note, the pilot location was close to the land (<1 km), while future offshore solar farms will be located much further from land (>12 km), and therefore the amount and community species of visiting birds might be very different. With this in mind, we hypothesise two direct foraging opportunities may be present. The first one is provided by (anchored) species on the (under)sides of the floating platforms, such as mussels and possibly crabs. Especially Larus argentatus, commonly known as the herring gull, likes to feed on such macro zoobenthos. The second foraging opportunity created by the offshore farm is for species feeding on (juvenile) pelagic fish that may aggregate under the floating structure. Obviously, many more observations are needed (at future solar farms) to obtain an entire comprehension of the times, types, numbers of birds (and marine mammals) visiting, and the foraging opportunities created by the floating structures.
For future monitoring of marine wildlife on floating solar installations, we recommend using dedicated marine wildlife observation stations. Camera positions, angles, and timelapse intervals should remain consistent throughout the monitoring period, and ideally, good-quality cameras are used, which are also suitable for night-time use. In addition, to account for farm sizes changing over time, animal counts should be standardised by reporting on counts per m2. This will allow comparison across different offshore solar farm designs and potentially also other offshore infrastructure or ship-based surveys. Animals should also be identified at the species level and preferably also according to age classes. This will provide valuable information on community compositions.
In order to further investigate foraging opportunities, we suggest collecting and analysing pellets and faeces left behind by birds and marine mammals in order to determine the origin of their prey. We also suggest monitoring marine mammals underwater, for example, by using underwater cameras, acoustic monitoring techniques, and/or environmental DNA techniques.
5. Conclusions
This paper describes environmental field observations carried out at a small floating solar farm deployed for 18 months in the Dutch North Sea. This is the first offshore solar demonstrator in the world that successfully withstood waves up to 5 m high. Measurements of water quality were carried out (temperature, salinity, turbidity, chlorophyll, dissolved oxygen), bird presence on top of the floating platforms was noted, and sediment samples were taken underneath the floating structure to check for the enrichment of carbon and nitrogen. No clear trends or deviations from the normal environmental conditions were shown, which is explained as the cause of the small size of the new floating infrastructure in the marine setting.
The impact on the aspects of the ecosystem we focused on in this study, i.e., water quality, birds, and biodeposition, but also other important aspects, such as biofouling or associated Fish Aggregating Device effects, depends on the offshore solar project size, as well as on environmental variables, such as geography, water depth, distance to shore and local hydro-and oceanographical conditions. Future offshore solar systems in the Netherlands are expected to have a much larger horizontal footprint (>10.000 m2) and lie further offshore (>12 km) in deeper waters (~20–30 m), co-located with wind parks. It is possible certain variations in the (a)biotic conditions will then occur due to the co-location of wind and solar parks. Physical and biogeochemical coupled models will then be, and are already now, a very powerful tool to understand the causal relationships between variables and predict certain directions for ecosystem change. However, these models need to be fed with actual field measurements. Even small pilots like the one we monitored here can bring valuable calibration data to the existing (and new) models. We emphasise the importance of gathering field data, both in time series at one location in the water column for the duration of at least one year to account for seasonal changes, as well as regular (once per month) vertical profiles at no less than two locations (underneath farm and at reference site nearby with open sea conditions). Such calibrated datasets will provide the basis to further our understanding of the effect of offshore floating solar farms on the (a)biotic environment. Learnings from these studies will also be useful to understand the effects of other (ultra-)large floating infrastructures in the marine environment that are likely to appear.
Summarising, the actual results of this study, and particularly the bird observations, are not exceptionally representative for future offshore solar farms, given the location was very close to shore, and water depths, waves and currents were much lower than at future offshore farm locations, at least in the Netherlands. Nevertheless, it is our opinion that others can benefit from the lessons learnt shared here on field measurement techniques and observations, as well as obtain a first insight into what environmental impacts can be expected from offshore solar and, therefore, what research should ideally be developed to understand the interaction at any future demonstrations of offshore solar with the marine environment, as the potential is enormous and roll-out of the technology, in the North Sea but also worldwide, could be very rapid.
Author Contributions
Conceptualization, B.V.; Methodology, B.V., P.R. and M.N.; Validation, P.R.; Formal analysis, P.R. and M.N.; Investigation, B.V., P.R. and M.N.; Data curation, P.R. and M.N.; Writing – original draft, B.V., P.R. and M.N.; Writing – review & editing, B.V. and P.R.; Visualization, P.R. and M.N.; Supervision, B.V. All authors have read and agreed to the published version of the manuscript.
Funding
This research was partly funded by the Netherlands Enterprise Agency (RVO) within the framework of the Dutch Topsector Energy (funding number TEHE117022) and the Olaf Schuilingfonds of the Utrecht University Fund, that specifically financed the biogeochemistry laboratory work.
Institutional Review Board Statement
Not applicable.
Informed Consent Statement
Not applicable.
Data Availability Statement
The data presented in this study are available on request from the corresponding author. The data are not publicly available due to use of the data in ongoing projects.
Acknowledgments
The authors wish to thank Joshua Amato for his modelling work that generated Figure 2. We like to thank Joop Coolen and Ninon Mavraki for their support since the very start of our offshore monitoring work and for sharing their knowledge about biofouling communities on artificial structures in the North Sea. We thank the many students who helped with fieldwork and field data analyses in the past years.
Conflicts of Interest
The authors declare no conflict of interest.
References
- World Bank Group; ESMAP; SERIS. Where Sun Meets Water: Floating Solar Market Report; World Bank Group: Washington, DC, USA, 2019; Available online: http://documents.worldbank.org/curated/en/579941540407455831/Floating-Solar-Market-Report-Executive-Summary (accessed on 18 January 2023).
- DNE Research. Nationaal Solar Trendrapport; DNE Research: Hoboken, NJ, USA, 2022. [Google Scholar]
- Folkerts, W.; van Sark, W.; de Keizer, C.; van Hooff, W.; van den Donker, M. ROADMAP PV Systemen En Toepassingen; University Utrecht: Utrecht, The Netherlands, 2017. [Google Scholar]
- Oliveira-Pinto, S.; Stokkermans, J. Assessment of the Potential of Different Floating Solar Technologies—Overview and Analysis of Different Case Studies. Energy Convers. Manag. 2020, 211, 112747. [Google Scholar] [CrossRef]
- Soppe, W.; Kingma, A.; Hoogeland, M.; van den Brink, R.; Kroon, K.; Folkerts, W. TNO Report: Challenges and Potential for Offshore Solar. 2022. Available online: https://topsectorenergie.nl/sites/default/files/uploads/20220331_RAP_Challenges%20and%20potentialfor%20offshore%20solar_Final.pdf (accessed on 23 January 2023).
- Hofstra, J.; van der Leun, K.; Brosschot, S.; Smit, E. Integratie van Duurzame Bronnen Op Zee: Marktontwikkelingen van Golfenergie En Zon Op Zee Naast Wind Op Zee. 2022. Available online: https://www.invest-nl.nl/media/attachment/id/2305 (accessed on 28 December 2022).
- North Sea 2—Oceans of Energy. Available online: https://oceansofenergy.blue/north-sea-2/ (accessed on 19 January 2023).
- Liu, H.; Krishna, V.; Lun Leung, J.; Reindl, T.; Zhao, L. Field Experience and Performance Analysis of Floating PV Technologies in the Tropics. Prog. Photovolt. Res. Appl. 2018, 26, 957–967. [Google Scholar] [CrossRef]
- Golroodbari, S.Z.; van Sark, W. Simulation of Performance Differences between Offshore and Land-Based Photovoltaic Systems. Prog. Photovolt. Res. Appl. 2020, 28, 873–886. [Google Scholar] [CrossRef]
- Golroodbari, S.; van Sark, W. On the Effect of Dynamic Albedo on Performance Modelling of Offshore Floating Photovoltaic Systems. Sol. Energy Adv. 2022, 2, 100016. [Google Scholar] [CrossRef]
- van Hooff, W.; Kuijers, T.; Quax, R.; Witte, J.; Londo, M.; Matthijsen, J.; van Sark, W.; Sinke, W. Ruimtelijk Potentieel van Zonnestroom in Nederland; TKI Urban Energy: Utrecht, The Netherlands, 2021. [Google Scholar]
- Shell International B.V. Shell Scenarios. Sky: Meeting the Goals of the Paris Agreement. 2018. Available online: https://www.ourenergypolicy.org/wp-content/uploads/2018/03/shell-scenarios-sky-1.pdf (accessed on 19 January 2023).
- Golroodbari, S.Z.M.; Vaartjes, D.F.; Meit, J.B.L.; van Hoeken, A.P.; Eberveld, M.; Jonker, H.; van Sark, W.G.J.H.M. Pooling the Cable: A Techno-Economic Feasibility Study of Integrating Offshore Floating Photovoltaic Solar Technology within an Offshore Wind Park. Sol. Energy 2021, 219, 65–74. [Google Scholar] [CrossRef]
- Château, P.A.; Wunderlich, R.F.; Wang, T.W.; Lai, H.T.; Chen, C.C.; Chang, F.J. Mathematical Modeling Suggests High Potential for the Deployment of Floating Photovoltaic on Fish Ponds. Sci. Total Environ. 2019, 687, 654–666. [Google Scholar] [CrossRef]
- Dempster, T.; Taquet, M. Fish Aggregation Device (FAD) Research: Gaps in Current Knowledge and Future Directions for Ecological Studies. Rev. Fish Biol. Fish 2004, 14, 21–42. [Google Scholar] [CrossRef]
- Kumar, M.; Kumar, A. Experimental Characterization of the Performance of Different Photovoltaic Technologies on Water Bodies. Prog. Photovolt. Res. Appl. 2020, 28, 25–48. [Google Scholar] [CrossRef]
- Lee, I.; Joo, J.C.; Lee, C.S.; Kim, G.Y.; Woo, D.Y.; Kim, J.H. Evaluation of the Water Quality Changes in Agricultural Reservoir Covered with Floating Photovoltaic Solar-Tracking Systems. J. Korean Soc. Environ. Eng. 2017, 39, 255–264. [Google Scholar] [CrossRef]
- De Lima, R.L.P.; Paxinou, K.; Boogaard, F.C.; Akkerman, O.; Lin, F.Y. In-situ Water Quality Observations under a Large-scale Floating Solar Farm Using Sensors and Underwater Drones. Sustainability 2021, 13, 6421. [Google Scholar] [CrossRef]
- Rosa-Clot, M.; Tina, G.M. Current Status of FPV and Trends. In Floating PV Plants; Elsevier: Amsterdam, The Netherlands, 2020; pp. 9–18. [Google Scholar] [CrossRef]
- Sahu, A.; Yadav, N.; Sudhakar, K. Floating Photovoltaic Power Plant: A Review. Renew. Sustain. Energy Rev. 2016, 66, 815–824. [Google Scholar] [CrossRef]
- Hooper, T.; Armstrong, A.; Vlaswinkel, B. Environmental Impacts and Benefits of Marine Floating Solar. Sol. Energy 2021, 219, 11–14. [Google Scholar] [CrossRef]
- Oceans of Energy. Oceans of Energy Will Build 1 MW Offshore Solar off the Coast of Scheveningen—Oceans of Energy. Available online: https://oceansofenergy.blue/2021/11/11/oceans-of-energy-will-build-1-mw-offshore-solar-off-the-coast-of-scheveningen/ (accessed on 18 January 2023).
- Karpouzoglou, T.; Vlaswinkel, B.; van der Molen, J. Effects of Large-Scale Floating (Solar Photovoltaic) Platforms on Hydrodynamics and Primary Production in a Coastal Sea from a Water Column Model. Ocean. Sci. 2020, 16, 195–208. [Google Scholar] [CrossRef]
- Coolen, J.W.P.; van der Weide, B.; Cuperus, J.; Blomberg, M.; van Moorsel, G.W.N.M.; Faasse, M.A.; Bos, O.G.; Degraer, S.; Lindeboom, H.J. Benthic Biodiversity on Old Platforms, Young Wind Farms, and Rocky Reefs. ICES J. Mar. Sci. 2020, 77, 1250–1265. [Google Scholar] [CrossRef]
- Ostroumov, S.A. Suspension-Feeders as Factors Influencing Water Quality in Aquatic Ecosystems. In The Comparative Roles of Suspension-Feeders in Ecosystems; Springer: Dordrecht, The Netherlands, 2005; pp. 147–164. [Google Scholar] [CrossRef]
- Nelissen, M. Impact of Offshore Floating Solar Platforms on Sediment Biogeochemistry and Meiofauna Abundances at a Nearshore Site in the North Sea; Utrecht University: Utrecht, The Netherlands, 2021. [Google Scholar]
- Azam, F.; Malfatti, F. Microbial Structuring of Marine Ecosystems. Nat. Rev. Microbiol. 2007, 5, 782–791. [Google Scholar] [CrossRef]
- Middelburg, J.J.; Levin, L.A. Coastal Hypoxia and Sediment Biogeochemistry. Biogeosciences 2009, 6, 1273–1293. [Google Scholar] [CrossRef]
- Laufkotter, C.; Vogt, M.; Gruber, N.; Aita-Noguchi, M.; Aumont, O.; Bopp, L.; Buitenhuis, E.; Doney, S.C.; Dunne, J.; Hashioka, T.; et al. Drivers and Uncertainties of Future Global Marine Primary Production in Marine Ecosystem Models. Biogeosciences 2015, 12, 6955–6984. [Google Scholar] [CrossRef]
- Exley, G.; Armstrong, A.; Page, T.; Jones, I.D. Floating Photovoltaics Could Mitigate Climate Change Impacts on Water Body Temperature and Stratification. Sol. Energy 2021, 219, 24–33. [Google Scholar] [CrossRef]
- Antia, N.J. Effects of Temperature on the Darkness Survival of Marine Microplanktonic Algae. Microb. Ecol. 1976, 3, 41–54. [Google Scholar] [CrossRef]
- Jochem, F.J. Dark Survival Strategies in Marine Phytoplankton Assessed by Cytometric Measurement of Metabolic Activity with Fluorescein Diacetate. Mar. Biol. 1999, 135, 721–728. [Google Scholar] [CrossRef]
- Popels, L.C.; MacIntyre, H.L.; Warner, M.E.; Zhang, Y.; Hutchins, D.A. Physiological Responses during Dark Survival and Recovery in Aureococcus Anophagefferens (Pelagophyceae). J. Phycol. 2007, 43, 32–42. [Google Scholar] [CrossRef]
- Melet, A.V.; Hallberg, R.; Marshall, D.P. The Role of Ocean Mixing in the Climate System. In Ocean Mixing: Drivers, Mechanisms and Impacts; Elsevier: Amsterdam, The Netherlands, 2022; pp. 5–34. [Google Scholar] [CrossRef]
- Van Broekhoven, W.; Jansen, H.; Verdegem, M.; Struyf, E.; Troost, K.; Lindeboom, H.; Smaal, A. Nutrient Regeneration from Feces and Pseudofeces of Mussel Mytilus Edulis Spat. Mar. Ecol. Prog. Ser. 2015, 534, 107–120. [Google Scholar] [CrossRef]
- Bandara, K.; Varpe, Ø.; Wijewardene, L.; Tverberg, V.; Eiane, K. Two Hundred Years of Zooplankton Vertical Migration Research. Biol. Rev. 2021, 96, 1547–1589. [Google Scholar] [CrossRef] [PubMed]
- Walter, B.; Peters, J.; van Beusekom, J.E.E. The Effect of Constant Darkness and Short Light Periods on the Survival and Physiological Fitness of Two Phytoplankton Species and Their Growth Potential after Re-Illumination. Aquat. Ecol. 2017, 51, 591–603. [Google Scholar] [CrossRef]
- Aarup, T. Transparency of the North Sea and Baltic Sea—A Secchi Depth Data Mining Study. Oceanologia 2002, 44, 323–337. [Google Scholar]
- Weston, D.P. Quantitative Examination of Macrobenthic Community Changes along an Organic Enrichment Gradient. Mar. Ecol. Prog. Ser. 1990, 61, 233–244. [Google Scholar] [CrossRef]
- Pereira, P.M.F.; Black, K.D.; McLusky, D.S.; Nickell, T.D. Recovery of Sediments after Cessation of Marine Fish Farm Production. Aquaculture 2004, 235, 315–330. [Google Scholar] [CrossRef]
- Chamberlain, J.; Fernandes, T.F.; Read, P.; Nickell, T.D.; Davies, I.M. Impacts of Biodeposits from Suspended Mussel (Mytilus edulis L.) Culture on the Surrounding Surficial Sediments. ICES J. Mar. Sci. 2001, 58, 411–416. [Google Scholar] [CrossRef]
- Danovaro, R.; Gambi, C.; Luna, G.M.; Mirto, S. Sustainable Impact of Mussel Farming in the Adriatic Sea (Mediterranean Sea): Evidence from Biochemical, Microbial and Meiofaunal Indicators. Mar. Pollut. Bull. 2004, 49, 325–333. [Google Scholar] [CrossRef]
- Crawford, C.M.; Macleod, C.K.A.; Mitchell, I.M. Effects of Shellfish Farming on the Benthic Environment. Aquaculture 2003, 224, 117–140. [Google Scholar] [CrossRef]
- Giles, H.; Pilditch, C.A. Effects of Diet on Sinking Rates and Erosion Thresholds of Mussel Perna Canaliculus Biodeposits. Mar. Ecol. Prog. Ser. 2004, 282, 205–219. [Google Scholar] [CrossRef]
- Giles, H.; Broekhuizen, N.; Bryan, K.R.; Pilditch, C.A. Modelling the Dispersal of Biodeposits from Mussel Farms: The Importance of Simulating Biodeposit Erosion and Decay. Aquaculture 2009, 291, 168–178. [Google Scholar] [CrossRef]
- Callier, M.D.; Weise, A.M.; McKindsey, C.W.; Desrosiers, G. Sedimentation Rates in a Suspended Mussel Farm (Great-Entry Lagoon, Canada): Biodeposit Production and Dispersion. Mar. Ecol. Prog. Ser. 2006, 322, 129–141. [Google Scholar] [CrossRef]


Disclaimer/Publisher’s Note: The statements, opinions and data contained in all publications are solely those of the individual author(s) and contributor(s) and not of MDPI and/or the editor(s). MDPI and/or the editor(s) disclaim responsibility for any injury to people or property resulting from any ideas, methods, instructions or products referred to in the content. |
© 2023 by the authors. Licensee MDPI, Basel, Switzerland. This article is an open access article distributed under the terms and conditions of the Creative Commons Attribution (CC BY) license (https://creativecommons.org/licenses/by/4.0/).