Abstract
To detect sustainable changes in the production processes, memory-type control charts are frequently utilized. This study is conducted to assess the performance of the Bayesian adaptive exponentially weighted moving average (AEWMA) control chart using ranked set sampling schemes following two different loss functions in the presence of a measurement error for posterior and posterior predictive distributions using conjugate priors. This study is based on the covariate model and multiple measurement methods in the presence of a measurement error (ME). The performance of the proposed Bayesian-AEWMA control chart with ME has been evaluated through the average run length and the standard deviation of the run length. Finally, a real-life application in semiconductor manufacturing was conducted to evaluate the effectiveness of the proposed Bayesian-AEWMA control chart with a measurement error based on different ranked set sampling schemes. The results demonstrate that the proposed control chart, in the presence of a measurement error, performed well in detecting out-of-control signals compared to the existing control chart. However, the median ranked set sampling scheme (MRSS) proved to be better than the other two schemes in the presence of a measurement error.
1. Introduction
The main objective of statistical process control (SPC) is to distinguish deviations from optimal performance and discover unpredictable variations before producing defective items, as well as improve the production process. The graphical technique that is widely used in many industries to monitor a statistical process over time is known as a control chart (CC). The concept of the control chart was first proposed by Shewhart [1], which was also a memoryless type of CC that only used the current sample information and was effectively used for the detection of large, subtle drifts. After Shewhart, the memory type control chart developed by Page [2] and Roberts [3] is more suitable in cases of small to moderate shifts in the manufacturing process because it uses both the current and historical sample information, named the exponentially weighted moving average (EWMA) and cumulative sum (CUSUM) CCs. In recent years, the adaptive version of control chart schemes has received significant attention because of their efficient performance at the different sizes of shifts.
In recent years, the adaptive version of CC schemes has received significant consideration because of their efficiency at different shift sizes. A significant amount of literature has been available on memory-type adaptive CCs such as adaptive CUSUM (ACUSUM) and adaptive (AEWMA) CCs for detecting shifts in the manufacturing process. Yoon et al. [4] utilized the Kalman recursive average method to suggest the AEWMA-X CC and presented that the suggested CC is more efficient than the EWMA-X CC in detecting shift size. Capizzi and Masarotto [5] suggested an AEWMA CC based on the Huber score function that helps in combination with the EWMA and Shewhart CCs for the process mean. An efficient AEWMA CC was presented by Haq et al. [6] for monitoring the process mean by first estimating the shift size and comparing it with the existing AEWMA CCs. The application of the suggested CC has been studied in the semiconductor manufacturing process.
In many quality control applications, the effectiveness of CCs is influenced by the existence of significant levels of ME. Sometimes, an imprecise measurement of the study variable results in fluctuations caused by ME, which can prevent the CCs from detecting out-of-control signals that are caused by incorrect measurements of the study variable. Mittag and Stemann [7] proposed the CC as a way to visualize the impact of ME by taking into account the model , where X represents the true value of the study variable, Y is the observed value of the measurement operation, and represents the random error term. In the presence of ME, Stemann and Weihs [8] examined the EWMA CC. Linna and Woodall [9] studied CC in the presence of ME using the model , where A and B are fixed values. Linna et al. [10] studied the impact of ME on multivariate CCs. Noor-ul-Amin et al. [11] utilized different techniques, i.e., the covariate method, multiple measurements, and linearly increasing variance to check the effectiveness of the EWMA-Z CC in the presence of ME. The performance of the EWMA-Z CC is evaluated through a comprehensive Monte Carlo simulation approach. Typically, CCs based on the classical technique just use sample information and ignore previous knowledge, whereas the Bayesian approach uses the posterior distribution, which integrates both the sample information and prior knowledge. Menzefricke [12] studied the variance CC based on the Bayesian posterior predictive distribution and assessed the effectiveness of the CC using the semiconductor production process. Bayesian CUSUM CC was offered by Wu and Tian [13] to monitor the manufacturing process mean and variance, respectively, under the weighted LF. The Bayesian adaptive AEWMA CC is proposed by Noor-ul-Amin and Noor [14] to monitor the process mean using informative and non-informative priors under various LFs, such as SELF and LLF, to boost the detection capability of the CC. Noor-ul-Amin and Noor [15] suggested a Bayesian EWMA CC with ME utilizing different LFs and the performance of the CC has been checked by a variety of methodologies, including the covariate method, repeated measurements, and linearly rising variance. Imad et al. [16] suggested a Bayesian hybrid EWMA (HEWMA) CC applying various RSS schemes with an informative prior to monitor the location parameter. They used ARL and SDRL for performance evaluations and compared them with Bayesian-HEWMA and Bayesian-AEWMA CCs using SRS. The results revealed that the proposed method is more sensitive in detecting out-of-control signals. Moreover, the proposed method was applied to the hard-bake manufacturing process. The aforementioned work is performed for both the classical and Bayesian approaches using SRS.
The main motivation for this research is to study the performance of the AEWMA CC under Bayesian theory with ME utilizing various RSS schemes under two different LFs, such as SELF and LLF. An ME with two different methods is employed to determine the shift in the process mean. The ARL and SDRL are used to evaluate the effectiveness of the suggested Bayesian-AEWMA CC.
The remaining sections of the paper are organized as follows: A detailed explanation of the Bayesian approach and LFs is provided in Section 2. Several RSS schemes and ME are introduced in Section 3. The proposed Bayesian EWMA control chart with ME utilizing RSS methods is discussed in Section 4. Section 5 contains the simulation study, while Section 6 consists of discussion. A real-life application is discussed in Section 7, while the conclusion is presented in Section 8.
The application of ranked set sampling in industrial engineering can help improve the efficiency and sustainability of manufacturing processes by identifying and monitoring key location parameters. This can lead to improved quality control, reduced waste, and more sustainable production practices. Overall, this paper explores how the use of statistical methods such as ranked set sampling can contribute to sustainability efforts in industrial engineering by improving the accuracy and efficiency of monitoring and control processes.
2. Bayesian Approach
The Bayesian methodology makes use of the posterior distribution, which combines both the sample information and prior knowledge to estimate the values of population parameters that are not known. The prior distribution represents our pre-existing beliefs or assumptions about the parameter before incorporating any new information. Prior distributions can be classified as either informative or non-informative, depending on the level of detail that they provide. An informative prior is utilized whenever it is possible to directly know the value of a parameter of a prior distribution. If the sample and prior distributions are from the same family of distributions, this is referred to as a conjugate prior. For the in-control process, the research variable X has a mean of and a variance , and the conjugate prior distribution is assumed as normal prior with parameters and given below:
If no information about the population parameter of the prior distribution is available, it is known as a non-information prior, which has little or no impact on the posterior distribution. The prior distribution is directly proportional to the uniform distribution in the above-mentioned circumstances. The probability function of a uniform distribution is defined as , where c is the proportionality constant.
The posterior distribution that is structured when the sample and prior distribution for the parameter are combined is mathematically described as
The posterior predictive distribution for a new data point Y is created by using the posterior distribution as a prior distribution that is defined as
The role of loss function is very significant to minimize the risk related to Bayes estimator. In the current study, two various symmetric and asymmetric LFs were explored.
2.1. Squared Error Loss Function
The symmetric type LF SELF proposed by Gauss [17], if is an estimator for the unknown population parameter of the study variable X, with SELF is given by
Using SELF, the Bayes estimator is given by
2.2. Linex Loss Function
An asymmetric loss function in the Bayesian approach is a way of quantifying the cost or penalty associated with making incorrect predictions or decisions in a statistical model that incorporates prior knowledge. Unlike a symmetric loss function, which treats overestimation and underestimation equally, an asymmetric loss function assigns different weights to the two types of errors, reflecting the relative costs of each. By incorporating prior beliefs about the distribution of the data and the costs of different outcomes, an asymmetric loss function can help to improve the accuracy and efficiency of Bayesian inference. Varian [18] proposed an asymmetric LF named LLF. The LLF is preferred to mitigate the risk related to the Bayes estimator. It is defined as follows:
Under LLF, the Bayes estimator is given as
where 1.
3. Ranked Set Sampling
The concept of RSS was first discussed by Mclntyre [19]. RSS is suitable in certain circumstances that offer difficulties in the exact measurement of the study variable. Compared to simple random sampling (SRS), the estimator that utilizes the RSS approach is considered more efficient. The RSS scheme combines SRS with additional sources of information, such as expert knowledge or auxiliary data. The complete process for selecting a sample using the RSS method is outlined below:
Step 1. From the concerned population, select elements and distribute these elements into the m sets of the similar size randomly, and then arrange all the elements in the m sets in ascending order.
Step 2. After ranking, select the first element from the first set, and from the second element, the second, and so on, until the last unit is selected from the last set. This process constitutes a single cycle of RSS, which is of size m.
If necessary, the above aforementioned steps are repeated r times to reach the desired sample size, i.e., . The RSS procedure can be illustrated as follows: For a given cycle r, let represent the jth order statistic in the ith sample, where r = 1, 2, 3 … c, and = 1, 2, 3 … l. The estimator under RSS with a single cycle for population mean are as follows:
The RSS mean estimator is given as
With variance
3.1. Median Ranked Set Sampling
Muttalk [20] suggested another modified version of RSS for the efficient estimation of the population mean called the median ranked set sampling (MRSS) scheme. The complete method for selecting sample by MRSS are as follows:
Step 1. Similar to RSS, picked elements from the underlying population and allocated these elements into sets each of the same size. The elements in every set are arranged in ascending order.
Step 2. After ranking, if the sample size is odd, pick the order unit from all sets. For an even sample size , pick the ranked units and ranked units from the first and last sets. This procedure completes one cycle of MRSS sample of size .
The above two steps can be repeated times to achieve an MRSS sample size .
If the selected size for the sample is odd, the estimator under MRSS, using one cycle for the population mean is given by
With variance
In case of an even sample size, the estimator using MRSS for the population mean with one cycle is
With variance
3.2. Extreme Ranked Set Sampling
Samawi et al. [21] proposed a modified RSS scheme known as the extreme ranked set sampling (ERSS) scheme, which is useful as the collection of elements is a tougher task than extreme elements. The whole procedure for picking an ERSS sample is as follows:
Step 1. Randomly selected units from the population under consideration and arranged into sets each with the similar size ; the units within each set share similar characteristics with respect to the study variable.
Step 2. After ranking, if the sample size is even, select the smallest and largest units from the first and last th order sets, respectively. For an odd sample size, select the smallest and largest elements from the first and last th order sets, respectively, and the median elements is selected from the last order set. This completes a single cycle of ERSS.
If needed, repeat the above two steps times to obtain an ERSS sample of size . The estimator utilizing ERSS of one cycle in case of an even sample size for the population mean is defined as
With variance
The estimator under ERSS with for population mean one round, for an odd number of sample size is mathematized as
With variance
3.3. Measurement Error
The measurement error refers to the amount of inaccuracy or deviation that exists between the actual value of a quantity being measured and the value obtained through a measuring instrument or a measuring process. It is consistently present with a constant magnitude and does not exhibit variability across different observations. It can result from various sources, such as an imperfect calibration of the instrument, variations in the environmental conditions, or errors made by the person taking the measurements. Accurately assessing and minimizing measurement errors is crucial to ensuring the reliability and validity of scientific data. In the current study, we have considered a covariate model to address the ME, and we have utilized the multiple measurements technique as a means to mitigate its effects.
3.3.1. Covariate Model
Bennett [22] proposed a model to check the effect of MEs on the Shewhart CC defined as , where X represents the study variable and is considered normally distributed with mean and variance , respectively, for the in-control process and represents a stochastic error component arising from imprecision in the measurement process. Later, the covariate model was studied by Linna and Woodall (2001) given by
The model includes constants A and B, and is a normally distributed variable with a mean of zero and variance , i.e., . It is assumed that all the parameters in the model are known and X and are independent, i.e., . The measured variable Y is also normally distributed with mean and variance , i.e., .
3.3.2. Multiple Measurements Method
Multiple measurements per sampling unit have been utilized by Walden [14] instead of a single measurement, leading to a reduction in the variation of the ME. The variance of the ME component approaches zero as a result of the infinite number of multiple measurements. It is important to note that using multiple measurements without considering ME does not affect the performance of the CCs techniques. If a sample size of m is used with multiple measurements, the variance of the overall mean can be expressed as follows:
4. Suggested Bayesian-AEWMA CC with Different RSS Schemes Using LF under ME
The suggested AEWMA CC based on the Bayesian approach with an ME using various RSS techniques for monitoring the irregular variations in the location parameter of process mean of the normally distributed process. Let be a normally distributed random variable with a mean and variance and variance that are independently and identically distributed, and the probability density function is defined as
Let the mean shift estimate be an based AEWMA sequence given by
where and are the smoothing constant, the estimator for the in-control control corresponds to the unbiased; whereas for the out-of-control process, the estimator corresponds to the biased. To obtain an unbiased for both scenarios, Haq et al. [6] suggested which is defined as
The author suggested using for estimating .
The suggested Bayesian-AEWMA statistic under RSS schemes using the sequence for the process mean is given by
where , and such that
Atif et al. [23] introduced the function given in (24) to adapt the value of the smoothing constant based on the estimated shift. The constants used in are suggested to be and , when , and the value of for . The process is said to be out-of-control if the plotting statistic of Bayesian-AEWMA exceeds the threshold value ; otherwise, the process is in control.
If both the likelihood function and prior distribution have normal distributions, then the posterior distribution will be a normal distribution with a mean and variance and the probability density function is
where and , respectively.
4.1. Proposed Bayesian-AEWMA CC under an ME for Posterior and Posterior Predictive Distribution Using Different RSS Schemes under SELF for Covariate Model
The estimator based on suggested Bayesian-AEWMA CC under an ME applying different RSS methods for posterior and posterior predictive distribution under SELF, utilizing covariate model is given as
4.2. Proposed Bayesian-AEWMA CC with an ME for Posterior and Posterior Predictive Distribution Using Different RSS Schemes under SELF for Multiple Measurements Method
The estimator for the suggested Bayesian-AEWMA CC for posterior and posterior predictive distribution using different RSS schemes under SELF in the presence of ME with multiple measurements method is given as
where .
The remaining estimator of for the suggested Bayesian-AEWMA CC with an ME utilizing informative prior for both the covariate model and multiple measurements method and with various RSS schemes under LLF are given in Appendix A.
5. Simulation Study
The Monte Carlo simulation method is used to analyze the effectiveness of the Bayesian-AEWMA CC utilizing various RSS methods, with a focus on assessing its performance in the presence of ME. The evaluation is based on two measures, namely ARL and SDRL. To evaluate the impact of the suggested control, the smoothing constants are and 0.25 under different LF based on RSS schemes, with the in-control process set at 370. The simulation methodology for the proposed Bayesian-AEWMA CC is outlined in the following steps.
Step 1: Setting in-control ARL
- The standard normal distribution is selected for both the prior and sampling distribution, and the mean and variance are calculated using distinct LFs, i.e., and .
- For the specific value of the smoothing constant , the value of (threshold) is selected.
- To simulate an in-control process, a random sample of size n is generated from a normal distribution., i.e., .
- Calculate the suggested Bayesian-AEWMA statistic under the Bayesian approach and appraise the design-based procedure;
- If initially, the process is declared in-control, repeat the above steps until it is determined to be out of control, and then write down the frequency of the run-lengths for the in control process.
Step 2: For out-of-control ARL
- For a shifted process, the random samples are selected from the normal distribution, given as follows: .
- Calculate the Bayesian-AEWMA plotting statistic and analyze the process based on the recommended design.
- The aforementioned two steps are repeated until the process shows an out-of-control signal; write down the run length for the in-control process, if it is initially declared to be in-control.
- Compute the ARLs and SDRLs after repeating the above steps 100,000 times.
6. Results and Discussion
The results of the proposed Bayesian-AEWMA CC in the presence of an ME, with various RSS schemes based on various LFs and using an informative prior for posterior and posterior predictive distributions, are presented in Table 1, Table 2, Table 3, Table 4, Table 5 and Table 6. Table 1 provides information on the ARL and SDRL of the suggested CC under various RSS methods, using SELF with the covariate model using and , and with various values of . It is observed that with an increase in the values , the ARL and SDRL values increase. For example, at = 0.0, 0.5, and 1 with and , the ARL values are 17.42, 23.14, and 28.39 for RSS, and 14.99, 15.39, and 16.21 for the MRSS. The ARL results utilizing ERSS are 12.87, 18.03, and 25.84. Table 3 shows the effectiveness of the suggested CC under an ME applying LLF based on various RSS methods for posterior predictive distribution; it also reflects the impact of changes in the values of at smoothing constant . For example, at = 0.0, 0.5, and 1 with , the ARL values are 29.24, 36.13, and 44.50 for RSS, and 23.96, 29.93, and 36.66 using MRSS. The ARL results applying ERSS are 31.48, 39.46, and 48.12. When dealing with multiple measurements, the proposed Bayesian AEMWA CC exhibited an increase in both the ARL and SDRL values as the value of increased. This trend was observed using RSS schemes that utilized SELF for both posterior and posterior predictive distribution. For example, Table 4 showed that at = 0.0, 0.5, and 1 with , the ARL values are 17.42, 19.69, and 20.58 for RSS, and 14.99, 15.73 and 16.30 for MRSS and the values of ARL for ERSS are 12.87, 16.12, and 16.38. Table 6 shows the ARL and SDRL results of the suggested Bayesian-AEWMA CC for multiple measurements, using various RSS methods for posterior and posterior predictive with LLF. This reveals that as the increases, the efficiency of the proposed Bayesian-AEWMA CC decreases. For example, at = 0.0, 0.5, and 1 with , and , the ARL values are 18.11, 18.97, and 19.80, which are RSS, 14.72, 15.41, and 16.38. The ARL values for ERSS are 20.49, 21.71, and 30.95.

Table 1.
ARL and SDRL results under posterior and posterior predictive distribution using SELF for Bayesian-AEWMA CC with ME for covariate model, for = 0.25 and m = 5.
Table 2.
ARL and SDRL results under posterior distribution with ME, using LLF for covariate model, for = 0.25 and m = 5.
Table 3.
ARL and SDRL results under posterior predictive distribution with ME utilizing LLF for covariate model, for = 0.25 and m = 5.
Table 4.
ARL and SDRL results using posterior and posterior predictive distribution with ME utilizing SELF for multiple measurements, for = 0.25 and m = 5.
Table 5.
For multiple measurements method, the ARL and SDRL values using posterior distribution with ME, under LLF for = 0.25 and m = 5.
Table 6.
ARLs and SDRLs using posterior distribution under LLF in the presence of ME, under multiple measurements method, for = 0.25 and m = 5.
From the outcomes of the proposed Bayesian-AEWMA CC under a measurement error based on various RSS schemes, using informative prior for posterior and posterior predictive distribution using both LFs, i.e., SELF and LLF, the results reveal that the proposed Bayesian-AEWMA CC using the MRSS scheme is less vulnerable to the impacts of an ME compared to the other RSS schemes. This suggests that the MRSS scheme may be more accurate for accounting for the ME and producing reliable results.
7. Real Data Applications
The illustration of the suggested Bayesian-AEWMA CC with ME utilizing different RSS methods is evaluated through the data of the hard-bake process in semiconductor production taken from Montgomery [24]. The hard-bake process is an important step in semiconductor manufacturing, which is a closely related field to industrial engineering. Industrial engineers are often involved in designing and optimizing the processes used in semiconductor manufacturing to ensure that they are efficient, effective, and reliable. In the present article, we consider that the data contains 45 samples, which each have a size 5 wafers that consist of 225 observations; the flow width is measured in microns, and the time interval between each sample is one hour. Assume that the first 30 samples represent an in-control process (phase I dataset) that contains 150 observations, while the remaining 15 samples are considered an out-of-control process (phase II dataset) that contains 75 observations.
For the application of the proposed Bayesian-AEWMA control utilizing SELF for covariate model using RSS schemes, we take and different values of error ratio such as = 0.0, 0.5, and 1. Figure 1, Figure 2 and Figure 3 show that the suggested Bayesian-AEWMA CC for the covariate model using SELF using RSS for = 0.0, 0.5, and 1, which indicated that the process is out of control on the 35th, 37th, and 41st sample.
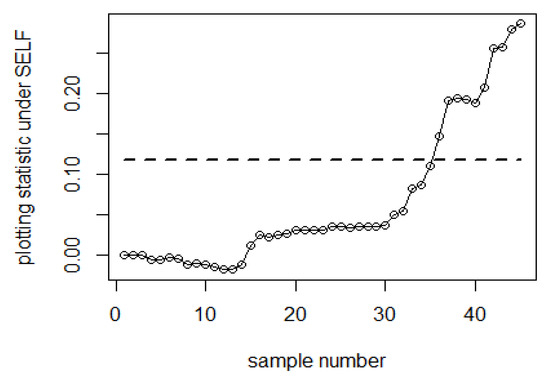
Figure 1.
Using RSS, Bayesian-AEWMA CC using SELF for .
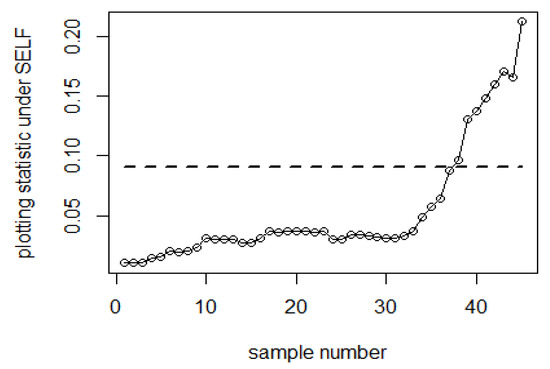
Figure 2.
Under RSS, Bayesian-AEWMA CC using SELF for .5.
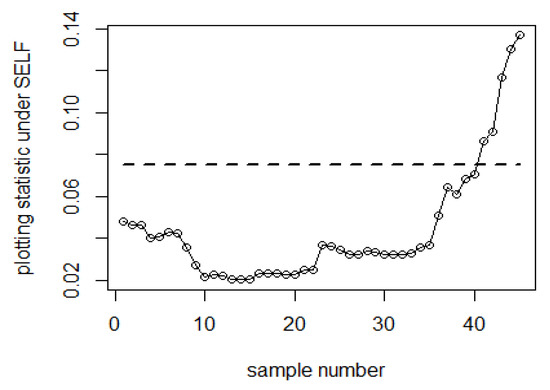
Figure 3.
Using RSS, Bayesian-AEWMA CC with SELF for = 1.
Figure 4, Figure 5 and Figure 6 depict the performance of proposed CC based on MRSS scheme utilizing SELF for covariate model taking = 0.0, 0.5, and 1, and . Which indicated that the process went out-of-control on the 33rd, 35th, and 39th sample. Similarly, Figure 7, Figure 8 and Figure 9 illustrate the effectiveness of the proposed CC utilizing ERSS scheme, which also demonstrate out of control indications on the 36th, 40th, and 42nd sample in the same situation.
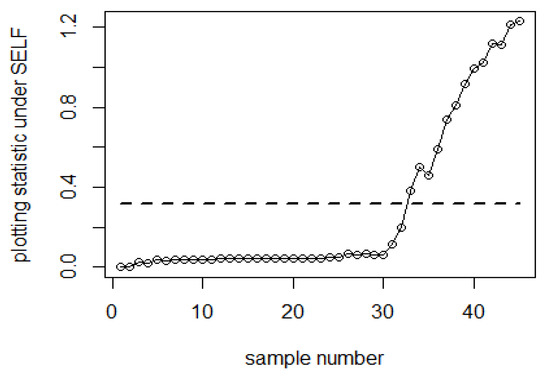
Figure 4.
Under SELF, Bayesian-AEWMA CC using MRSS for .
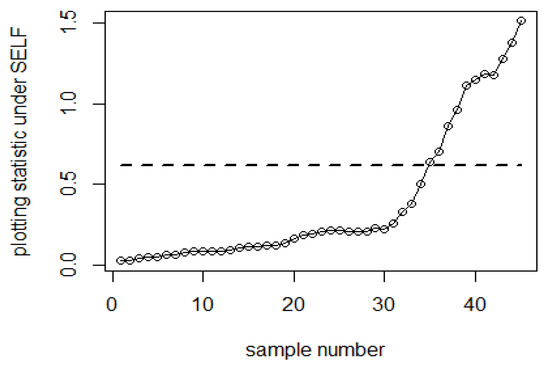
Figure 5.
Under SELF, Bayesian-AEWMA CC using MRSS for 0.5.
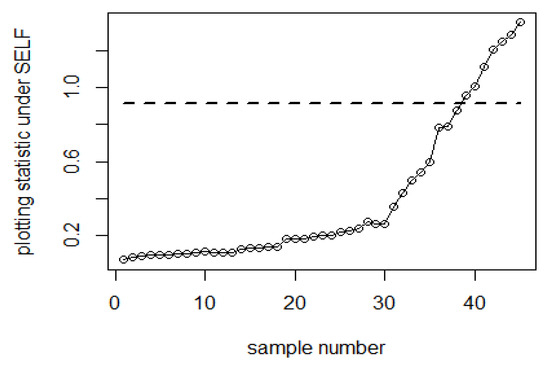
Figure 6.
Using MRSS, Bayesian-AEWMA CC under SELF for .
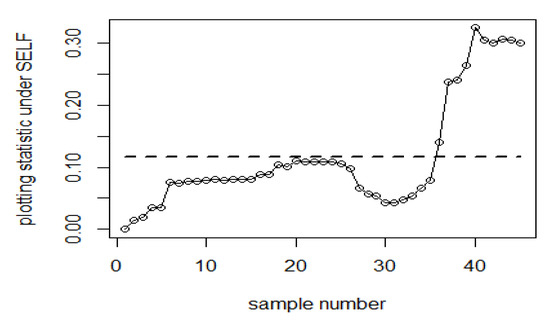
Figure 7.
Under ERSS, Bayesian-AEWMA CC utilizing SELF for .
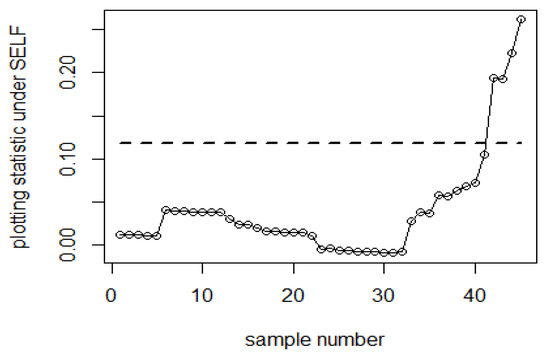
Figure 8.
Using SELF, Bayesian-AEWMA CC with ERSS for .
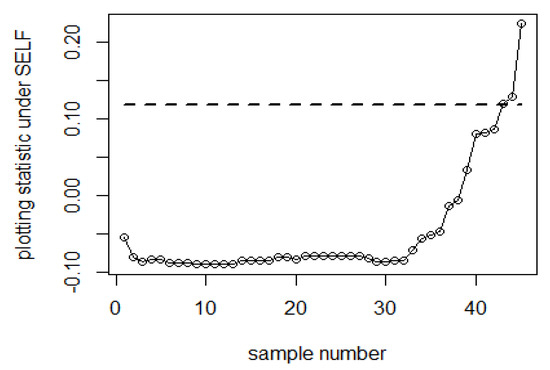
Figure 9.
Using SELF, Bayesian-AEWMA CC utilizing ERSS for .
8. Conclusions
In this article, the effect of the ME on the Bayesian AEWMA CC using RSS schemes under different LFs such as SELF and LLF has been reported. We computed the results of the ARL and SDRL to evaluate the performance of the suggested Bayesian AEWMA control chart under RSS schemes with an ME. The simulation results for the Bayesian AEWMA control using RSS schemes for the covariate method and multiple measurements are presented in Table 1, Table 2, Table 3, Table 4, Table 5 and Table 6. It is observed that the proposed Bayesian AEWMA CC using the MRSS scheme performed more efficiently than the other RSS schemes in the presence of an ME. It is therefore recommended to use the Bayesian AEWMA CC under MRSS for efficient monitoring of the process mean in the presence of an ME. The proposed CC with RSS schemes in the presence of an ME can be applied to other memory-type CCs. Furthermore, the proposed method can be used for distributions other than the normal distribution. For example, the method can be extended to handle data that follows a Poisson distribution or a binomial distribution. In this case, the likelihood function used in the Bayesian updating would need to be adjusted accordingly. The extension of the proposed method to other types of CCs and non-normal distributions can improve the effectiveness and efficiency of quality control processes in various industries, such as healthcare, finance, and manufacturing.
Author Contributions
Conceptualization, I.K.; methodology, D.M.K. and M.D.; software, M.N.-u.-A., M.D. and U.K.; validation, S.A.A.; formal analysis, D.M.K. and M.D.; investigation, M.D. and U.K.; resources, S.A.A., M.D. and U.K.; data curation, S.A.A. and U.K.; writing—original draft, I.K.; writing—review and editing, D.M.K. and M.N.-u.-A.; Supervision, D.M.K. and U.K.; visualization, S.A.A., M.D. and U.K.; project administration, D.M.K. and S.A.A.; funding acquisition, M.D. All authors have read and agreed to the published version of the manuscript.
Funding
This research is funded by the research supporting project number (RSPD2023R585), King Saud University, Riyadh, Saudi Arabia.
Conflicts of Interest
The authors declare no conflict of interest.
Appendix A
Appendix A.1
Bayes estimator for the Bayesian-AEWMA CC under covariate model with ME under LLF using different RSS schemes for posterior distribution.
Appendix A.2
Bayes estimator for the Bayesian-AEWMA CC under covariate model with ME under LLF using different RSS schemes for posterior predictive distribution.
Appendix A.3
Bayes estimator for the Bayesian-AEWMA CC under multiple measurements method with ME under LLF using different RSS schemes for Posterior distribution.
Appendix A.4
Bayes estimator for the Bayesian-AEWMA CC under multiple measurements method with ME under LLF using different RSS schemes for posterior predictive distribution.
References
- Shewhart, W.A. The application of statistics as an aid in maintaining quality of a manufactured product. J. Am. Stat. Assoc. 1925, 20, 546–548. [Google Scholar] [CrossRef]
- Page, E.S. Continuous inspection schemes. Biometrika 1954, 41, 100–115. [Google Scholar] [CrossRef]
- Roberts, S. Control chart tests based on geometric moving averages. Technometrics 1959, 42, 97–101. [Google Scholar] [CrossRef]
- Yoon, S.; Yoon, S.; Shin, Y. A study on the design of adaptive EWMA control chart using Kalman gain recursive average. J. Korean Soc. Qual. Manag. 1996, 24, 73–86. [Google Scholar]
- Capizzi, G.; Masarotto, G. An adaptive exponentially weighted moving average control chart. Technometrics 2003, 45, 199–207. [Google Scholar] [CrossRef]
- Haq, A.; Gulzar, R.; Khoo, M.B. An efficient adaptive EWMA control chart for monitoring the process mean. Qual. Reliab. Eng. Int. 2018, 34, 563–571. [Google Scholar] [CrossRef]
- Mittag, H.-J.; Stemann, D. Gauge imprecision effect on the performance of the XS control chart. J. Appl. Stat. 1998, 25, 307–317. [Google Scholar]
- Stemann, D.; Weihs, C. The EWMA-XS-control chart and its performance in the case of precise and imprecise data. Stat. Pap. 2001, 42, 207–224. [Google Scholar] [CrossRef]
- Linna, K.W.; Woodall, W.H. Effect of measurement error on Shewhart control charts. J. Qual. Technol. 2001, 33, 213–222. [Google Scholar] [CrossRef]
- Huwang, L.; Hung, Y. Effect of measurement error on monitoring multivariate process variability. Stat. Sin. 2007, 17, 749–760. [Google Scholar]
- Noor-ul-Amin, M.; Javaid, A.; Hanif, M.; Dogu, E. Performance of maximum EWMA control chart in the presence of measurement error using auxiliary information. Commun. Stat.-Simul. Comput. 2022, 51, 5482–5506. [Google Scholar] [CrossRef]
- Menzefricke, U. Control charts for the generalized variance based on its predictive distribution. Commun. Stat.—Theory Methods 2007, 36, 1031–1038. [Google Scholar] [CrossRef]
- Wu, Z.; Jiao, J.; Yang, M.; Liu, Y.; Wang, Z. An enhanced adaptive CUSUM control chart. IIE Trans. 2009, 41, 642–653. [Google Scholar] [CrossRef]
- Walden, C.T. An Analysis of Variables Control Charts in the Presence of Measurement Errors. Master’s Thesis, Mississippi State University, Starkville, MI, USA, 1991. [Google Scholar]
- Noor-ul-Amin, M.; Noor, S. Bayesian EWMA control chart with measurement error under different loss functions. Qual. Reliab. Eng. Int. 2021, 37, 3362–3380. [Google Scholar] [CrossRef]
- Khan, I.; Khan, D.M.; Noor-ul-Amin, M.; Khalil, U.; Alshanbari, H.M.; Ahmad, Z. Hybrid EWMA Control Chart under Bayesian Approach Using Ranked Set Sampling Schemes with Applications to Hard-Bake Process. Appl. Sci. 2023, 13, 2837. [Google Scholar] [CrossRef]
- Gauss, C. Methods Moindres Carres Memoire sur la Combination des Observations; Bertrand, J., Translator; Mallet-Bachelier: Paris, France, 1955. [Google Scholar]
- Varian, H.R. A Bayesian approach to real estate assessment. In Studies in Bayesian Econometric and Statistics in Honor of Leonard J. Savage; North-Holland Pub. Co.: Amsterdam, The Netherlands, 1975; pp. 195–208. [Google Scholar]
- McIntyre, G. A method for unbiased selective sampling, using ranked sets. Aust. J. Agric. Res. 1952, 3, 385–390. [Google Scholar] [CrossRef]
- Muttlak, H. Median ranked set sampling. J. Appl. Stat. Sci. 1997, 6, 245–255. [Google Scholar]
- Samawi, H.M.; Ahmed, M.S.; Abu-Dayyeh, W. Estimating the population mean using extreme ranked set sampling. Biom. J. 1996, 38, 577–586. [Google Scholar] [CrossRef]
- Bennett, C.A. Effect of measurement error on chemical process control. Ind. Qual. Control. 1954, 10, 17–20. [Google Scholar]
- Sarwar, M.A.; Noor-ul-Amin, M. Design of a new adaptive EWMA control chart. Qual. Reliab. Eng. Int. 2022, 38, 3422–3436. [Google Scholar] [CrossRef]
- Montgomery, D.C. Introduction to Statistical Quality Control; John Wiley & Sons: Hoboken, NJ, USA, 2009. [Google Scholar]


Disclaimer/Publisher’s Note: The statements, opinions and data contained in all publications are solely those of the individual author(s) and contributor(s) and not of MDPI and/or the editor(s). MDPI and/or the editor(s) disclaim responsibility for any injury to people or property resulting from any ideas, methods, instructions or products referred to in the content. |
© 2023 by the authors. Licensee MDPI, Basel, Switzerland. This article is an open access article distributed under the terms and conditions of the Creative Commons Attribution (CC BY) license (https://creativecommons.org/licenses/by/4.0/).