Article

Sustainability Indicators for Materials and Processes

Department of Chemical, Materials and Industrial Production Engineering, University of Naples Federico II, Piazzale V. Tecchio, 80, 80125 Naples, Italy
*
Author to whom correspondence should be addressed.
Sustainability 2023, 15(8), 6689; https://doi.org/10.3390/su15086689
Submission received: 28 February 2023 / Revised: 10 April 2023 / Accepted: 13 April 2023 / Published: 14 April 2023

Abstract

:
The concept of sustainability is nowadays employed to compare manufacturing processes or to define the correct path for material selection. Sometimes, this concept is only partially defined, including just low costs, profit maximization and/or CO2 emission reduction. Actually, a process or material can be defined as sustainable only if an objective function related to the economic, environmental and social impacts is simultaneously maximized. To this aim, it is necessary to define appropriate and specific sustainability indicators (i.e., values related to the economic, social and environmental aspects of a process or material under analysis). These indicators come about from simple calculations, and they are defined in terms of percentages and represented and compared using radar diagrams. Then, a process or specific material is identified by an objective function (i.e., the area included by the polygon that links the scores reported on the diagram). The scope of this representation of data is to individuate the major weaknesses of the process/material, proposing methods of optimization and trying to maximize the objective function in the retrieved diagram. This work aims to propose a general and simple method to calculate sustainability indicators on the basis of specific definitions related to a given process/material. To highlight the potential of this calculation and comparison instrument, two case studies are proposed: the first aims at comparing processes for the production of energy, while the second aims at driving the choice of manufacturing material. The selected indicators and adopted algorithm allowed for the identification of hydroelectric and eolic as the most sustainable processes for energy production; for materials, the results strictly depended on the assumptions made regarding favorable mechanical properties.

Graphical Abstract

1. Introduction

One of the main problems of modern society is the excessive exploitation of natural resources to support unsustainable activities and processes [1]. This issue began to be felt as a problem after decades of rough industrial development, aimed essentially at increasing profit, without taking into account the long-term effects and consequences on human health and the material supply lack [2]. In fact, since the earlier stages of the industrial revolution, the environmental impacts of all related human activities have been deliberately ignored, and there has been a reliance on the substantial (but not infinite) resilience of the environment to contain and neutralize any threat to or alteration of the natural conditions. Moreover, the continuous race towards technological and industrial progress of the countries participating in the Organization for Economic Co-operation and Development (OECD), and the late but substantial contribution posed by the developing countries, have determined exponential increases in waste generation, effluent emissions and more in general, of resource consumption and consequent depletion.
In recent decades, the scientific community has highlighted a substantial amount of evidence that suggests we have reached a point of no return, and that the evolution of modern society necessitates that we face the problems that are derived from industrial production and try to put forward effective solutions and adequate preventive measures. Profit itself should no longer be considered the only main variable describing the relationship between customers and manufacturers. The exponential increase in pollution in the world, which is linked to the demographic increase, has introduced the topic of environmental impact, and an awareness that it should not be neglected and ignored anymore. Nevertheless, the social and economic impacts are considered the fundamental variables to measure and compare for a thorough definition and quantification of the overall incidence of human activities.
Nowadays, the path that the world is following is particularly worrying, mainly because industrialized countries are characterized by societies that are currently difficult to satisfy [3]. Every living day obliges humans to balance the consumption of the earth’s resources with its natural tendency to regenerate them [4]. Manufacturing processes are employed in a number of production chains that transform raw materials into final objects for consumers. For example, in order to produce a mobile phone, several tens of different metals are necessary (such as aluminum, gold, rhodium, silver and copper). A T-shirt is made after the use of 0.23 kg of cotton or synthetic material, derived from crude. One loaf of bread is produced using about 0.39 kg of corn. The equivalent mass of water necessary to produce a plastic bottle containing 1 liter of drinkable water is about 1.39 L [5,6,7]. This means that, in order to let one person drink 1 liter of water, another living being is deprived of 1.39 L. Even though this problem has only been felt for a couple of decades [8], this kind of sacrifice cannot be tolerated any more. In this scenario, a transversal and highly impacting factor is the enormous need for energetic sources and assets, which make huge contributions in terms of emissions, waste generation and natural resource depletion. The global demand for energy is rapidly increasing because of population and economic growth, especially in emerging market economies. The rising demand has led to an abuse of fossil energy resources, which has created new issues and challenges. One of the possible solutions that is most agreed upon is the so-called energy transition process. However, the shift from an energy mix based on fossil fuels to low or zero carbon emissions, based on renewable energy sources, is not free from pitfalls because of the substantial need for natural resources to support the development and use of emerging technologies (e.g., metals and minerals for photovoltaic systems).
One of the main consequences of the continuous increase in industrial production volumes is the huge generation and accumulation of wastes [9]. Every process generates discarded materials, mainly due to the use of non-recyclable raw materials, or to the high costs associated with recycling. The actual situation has both environmental and social-economic implications due to two main factors: first, the inequality in the distribution of resources; second, the necessity to reduce resource consumption [10].
According to several studies [11,12,13] performed on the modern ways of living around the world, the National Footprint and Biocapacity accounts declared in 2021 that people living in the United States would need the resources of the equivalent of almost five Earths in order to balance the consumption of raw materials with their natural regeneration. Similarly, Australian people have an impact that is quantifiable in the need of 4.6 Earths, while Russians would need 3.4. In Europe, France, Germany, Italy, Portugal and Switzerland would need between 2.8 and 2.9 Earths, followed by England and Spain with 2.6 and 2.5, respectively. On this list, China ranks among the countries with unsustainable habits and processes (i.e., the resources needed are more than 1 Earth), with an environmental footprint that is equal to the need for 2.3 Earths to balance the resource consumption. Starting from India, with 0.7 Earths, several South and Central American countries, as well as some African and Asian countries, suffer from the unequal distribution of resources, with values significantly lower than 0.5 Earths. Summing up this information and data, the average value calculated for the entire world is in the need of around 1.7 Earths to counterbalance the negative generation of resources.
Among the possible solutions aimed at reducing and regulating the consumption of natural resources, it has become necessary to substitute the linear concept of economy [14] with the circular model [15,16,17,18,19,20]. In other words, the concept of waste should be eliminated from the actual concept of economy, and the route to achieve this important goal is multilevel [21]. Generally, we are used to defining the life of an object from the cradle to the grave, considering the path of raw materials during their transformation from the manufacturing processes to the final consumers [22]. The concept of the grave alludes to the elimination of the used objects as waste in order to substitute them with new updated ones. The concept of waste can be eliminated after setting up adequate processes to recycle, reuse or regenerate artefacts or their constitutive components. Of course, this politics starts from a reasoned choice of raw materials, based on their manufacturing processes, until the definition of their end of life, which should not only account for the immediate exigencies, but also for the long-term impact. In order to define a new balance on the earth, humans need to transform the waste step into dismantling, separation and reintroduction steps in the process chain [23]. However, as for the example of renewable energies, which can have a non-negligible environmental impact during their entire life cycles, the individuation of the most virtuous routes is not a trivial goal.
To achieve this fundamental target, it is necessary to introduce into our daily manufacturing, consuming and scientific lives the concept of sustainability [24,25]. This means that we do need to use natural resources in order to reasonably satisfy the necessities of human beings, but without compromising the availabilities of those resources for future generations [26,27]. This goal cannot be achieved by only thinking about the profit of manufacturing processes, but by also considering the environmental, economic and social impacts. The simultaneous reduction in the social and economic impacts for a process goes under the name of equity, the intersection of social and environmental impacts defines a bearable process, while the contemporary validation of environmentally friendly and economic processes is called viability. The simultaneous intersection of bearable, equitable and viable processes defines a process as sustainable [28,29]. In other words, if a process is able to maximize profit, minimize the consumption of resources and energy and maximize efficiency while reducing the social impact, then it has the power to reduce the consumption rate of resources compared with their regeneration rates. This kind of analysis can be applied to energy sources as well as to material selection (e.g., for the design and production of sustainable objects). At present, these topics are among the most important issues worldwide for their present impacts on the environment and catastrophic previsions for the future. Hence, dedicated efforts for the assessment of sustainability criteria appears to be a cogent and intriguing target.
The achievement of such an ambitious goal can be obtained through the simultaneous comparison of process or material variables in terms of energy requirements, social benefits, recyclability, environmental impact, efficiency, return on investment and so on. There are hundreds of known indicators reported in the literature; however, the greatest power of this discipline is linked to the possibility of building new sets, depending on the purposes of the analysis needed [30,31,32,33].
In general, the assessment of the sustainability of a process should define numerical criteria (indicators) that can quantify its environmental, social and economic impacts (the latter including the important energetic aspects). Most of indicator sets require experimental data, the knowledge of thermodynamic, physicochemical and toxicity properties as well as mass and energy flows, operating conditions, costs and equipment specifications for their correct and tuned definition. As reported in the literature [32,33], the existing methodology hypothesizes the best and worst conditions that are too generalized at the global level, while our innovation compares the best and worst cases within the same materials/processes to be evaluated.
According to these statements and having in mind these general properties, in this work, a simple method for sustainability analyses was proposed through the construction of ad hoc indicators. The aim was to highlight the great power of this method, which can be easily used by everyone, even without having specific knowledge of processes and materials. In particular, in this work, two case studies were proposed related to different but complementary areas of applications: the selection of a process for energy production, and the selection of a material for industrial design and manufacturing.

2. Methods

The sustainability indicators need to be specifically defined according to the multiple aspects that generally describe a process, or the selection of a material for a manufacturing process. This means that the process and material selection cannot be described only in terms of revenues or with a basic cost-and-benefit approach, but they might also be compared from several different points of view with other equivalent choices. It is worth adding that each manufacturing field has its own properties and features; therefore, it is necessary to define specific indicators starting from the collection of data. This could be the path to follow in order to individuate a specific weakness in the process and propose a further improvement in terms of sustainability, improving its environmental and social impacts without reducing the profit derived from the production.
Regardless of the specific process under analysis, it is generally suggested to define at least two indicators of cost: one related to the initial investment, and the second to the daily operation. These values of cost should be correlated to the functional unit that better allows for a quantification of the goods produced, and that represents the base for extensive parameter analysis (e.g., mass or volume or flow rate).
In this work, the technologies currently available for the production of energy were analyzed, accounting for both renewable and non-renewable sources. For this case study, the related indicators are defined in Table 1. The kWh produced (or its multiples) was adopted as the functional unit.
Therefore, according to Table 1, indicator #1 was built in order to define the cost of production per kWh of power generated during the operation of the plant. Similarly, indicator #6 defines the initial investment cost of the process related to each kWh of power generated during the lifetime of that specific plant. In order to define a process in terms of sustainability, the evaluation of the revenues needs to be coupled with the calculation of several other indicators related to the environmental impact of each process currently employed for the production of energy, the social impact and the onerous management of the effluents. Indeed, indicator #2 correlates the equivalent mass of carbon dioxide emitted to the atmosphere per kWh produced, while indicator #4 defines a specific correlation between the mass of water employed for utility along the process chain and the produced kWh. It is worth observing that, in this work, we did not account for pollutant management, which can be related to the different life steps of a single process (production starting raw materials, use for production and end-of-life disposal) and requires a dedicated study. Moreover, for the main regulated pollutants, it should be assumed that each process was conceived to respect the existing regulation; hence, the emission levels of the main pollutants should be similar or at least comparable.
The efficiency of the process (i.e., the ratio among the energy output over the total energy fed to the process (in terms of equivalent fuel)) is obviously a main parameter that must be accounted for. Indicator #8 defines the average lifetime of a process plant. The social perception of a productive plant is a non-negligible aspect for a fair evaluation of the impact of an energy plant on the community. Sometimes this parameter is influenced by the bias diffused by the media, or by the effect of distorted information, but this variable concept also needs to be taken into account. In this case, the literature generally gives a dimensionless scale from 1 to 10 to define the perception of a power plant built near a community: 1 in cases of the lowest impact perception, and 10 as the highest perceived impact. Another social aspect to be considered is the number of fatalities registered in a plant per unit of power produced; this is an indicator related to the safety of the process and needs to be evaluated before defining the choice. Finally, yet importantly, each power plant has a different need for the land to be used and, namely, occupied. According to this point, indicator #9 correlates the land surface use to the amount of power generated. This indicator considers the occupation of land near a city, which is subtracted from other economic and social activities, thus representing a term of environmental and social impact.
The list of the calculated indicators reported for the comparison of energy production processes as collected from the literature [34,35,36,37,38,39,40,41,42,43,44] is reported in Table 1.
As a second case study, in this work, we focused on a comparison of different manufacturing materials. In the same manner as the first case study, it is possible to address the choice of a specific material according to defined indicators of interest. In this case, a balance between technical and sustainability properties is necessary; thus, the sustainability parameters were integrated with specific customized properties related to the use of the material. Obviously, in this case, a preliminary selection of materials is mandatory, on the basis of the technical requirements among the available alternatives.
Among the mechanical properties, tensile strength, stiffness, ductility and density cannot be considered as optimal in an absolute manner because their evaluation depends on the destination use of the investigated material. In other words, depending on the application required by the designer, many different combinations of optimal parameters can bring about the best choice in terms of both the technical result and sustainability. For instance, a stated application could need a low-density material, but with high rigidity; alternatively, it could be more appropriate to increase the ultimate tensile strength with the lowest elastic modulus. Similarly, in terms of mechanical and thermal properties (for example, conductivity), the definition of the best and worst conditions must be considered case by case in terms of the material choice for the industrial or design applications.
On the contrary, the property related to the service temperature range is almost always considered as the best if the range between the minimum and maximum temperature is large, and it is considered the worst in cases of very narrow operating ranges. Similarly, indicators related to cost and carbon dioxide emissions for material production processes are considered as the worst if maximized and the best if minimized. There are no ambiguities or biases when considering the annual production rate, which is directly related to the supply risk of the specific material. Another prominent sustainability indicator related not only to the environment but also to the production cost minimization is the recyclability fraction, expressed in terms of percentage.
The list of the selected indicators for manufacturing material comparative analysis was collected from different studies retrievable in the pertinent literature [45,46,47,48,49,50,51,52,53,54,55], and it is reported in Table 2.
The data on the indicators reported in Table 1 and Table 2 were collected from the literature and analyzed after proper calculations. To compare the data shown, it is necessary to create dimensionless variables, expressed in terms of percentages. This goal can be achieved using Equation (1), which was first reported by Ruiz Mercado et al. [32,33,34]. The mathematical correlation defines the generalized way to calculate each specific indicator:
S c o r e = A c t u a l W o r s t B e s t W o r s t × 100
where “Actual” is the value of the indicator assumed by the process/material currently analyzed; “Best” is the value that maximizes the advantage described among the processes or materials investigated; “Worst” is the most critical value within the class of values analyzed. The calculated ratio multiplied by 100 defines the score obtained by the single material or process, expressed in terms of percentage. In this manner, the use of this simple mathematical correlation transforms raw values into dimensionless scores, according to the difference among the worst and best ones of that specific category, thereby allowing for a combined and fair comparison of the different indicators.
According to this correlation, a score of 100% means that the process or material has the highest score related to that analyzed indicator. Each indicator type can be correlated to a best and worst value, according to the significance of the value calculated. In other words, as for the optimal criterion-set definition, the best and worst values also depend on the specific destination use. For instance, if the indicator is related to the investment cost, then the best is obviously defined as the lowest value among the processes analyzed; similarly, when the indicator is related to carbon dioxide emissions, the best value is the lowest among all the processes analyzed.
Subsequently, to combine the results related to all the scores of the indicator set, the average value of the scores (Save) can be calculated to compare processes/materials by means of a single dimensionless value, as follows:
S a v e = i n S i n
where Si is the value of the i-th sustainability indicator, and n is their total number.

3. Results

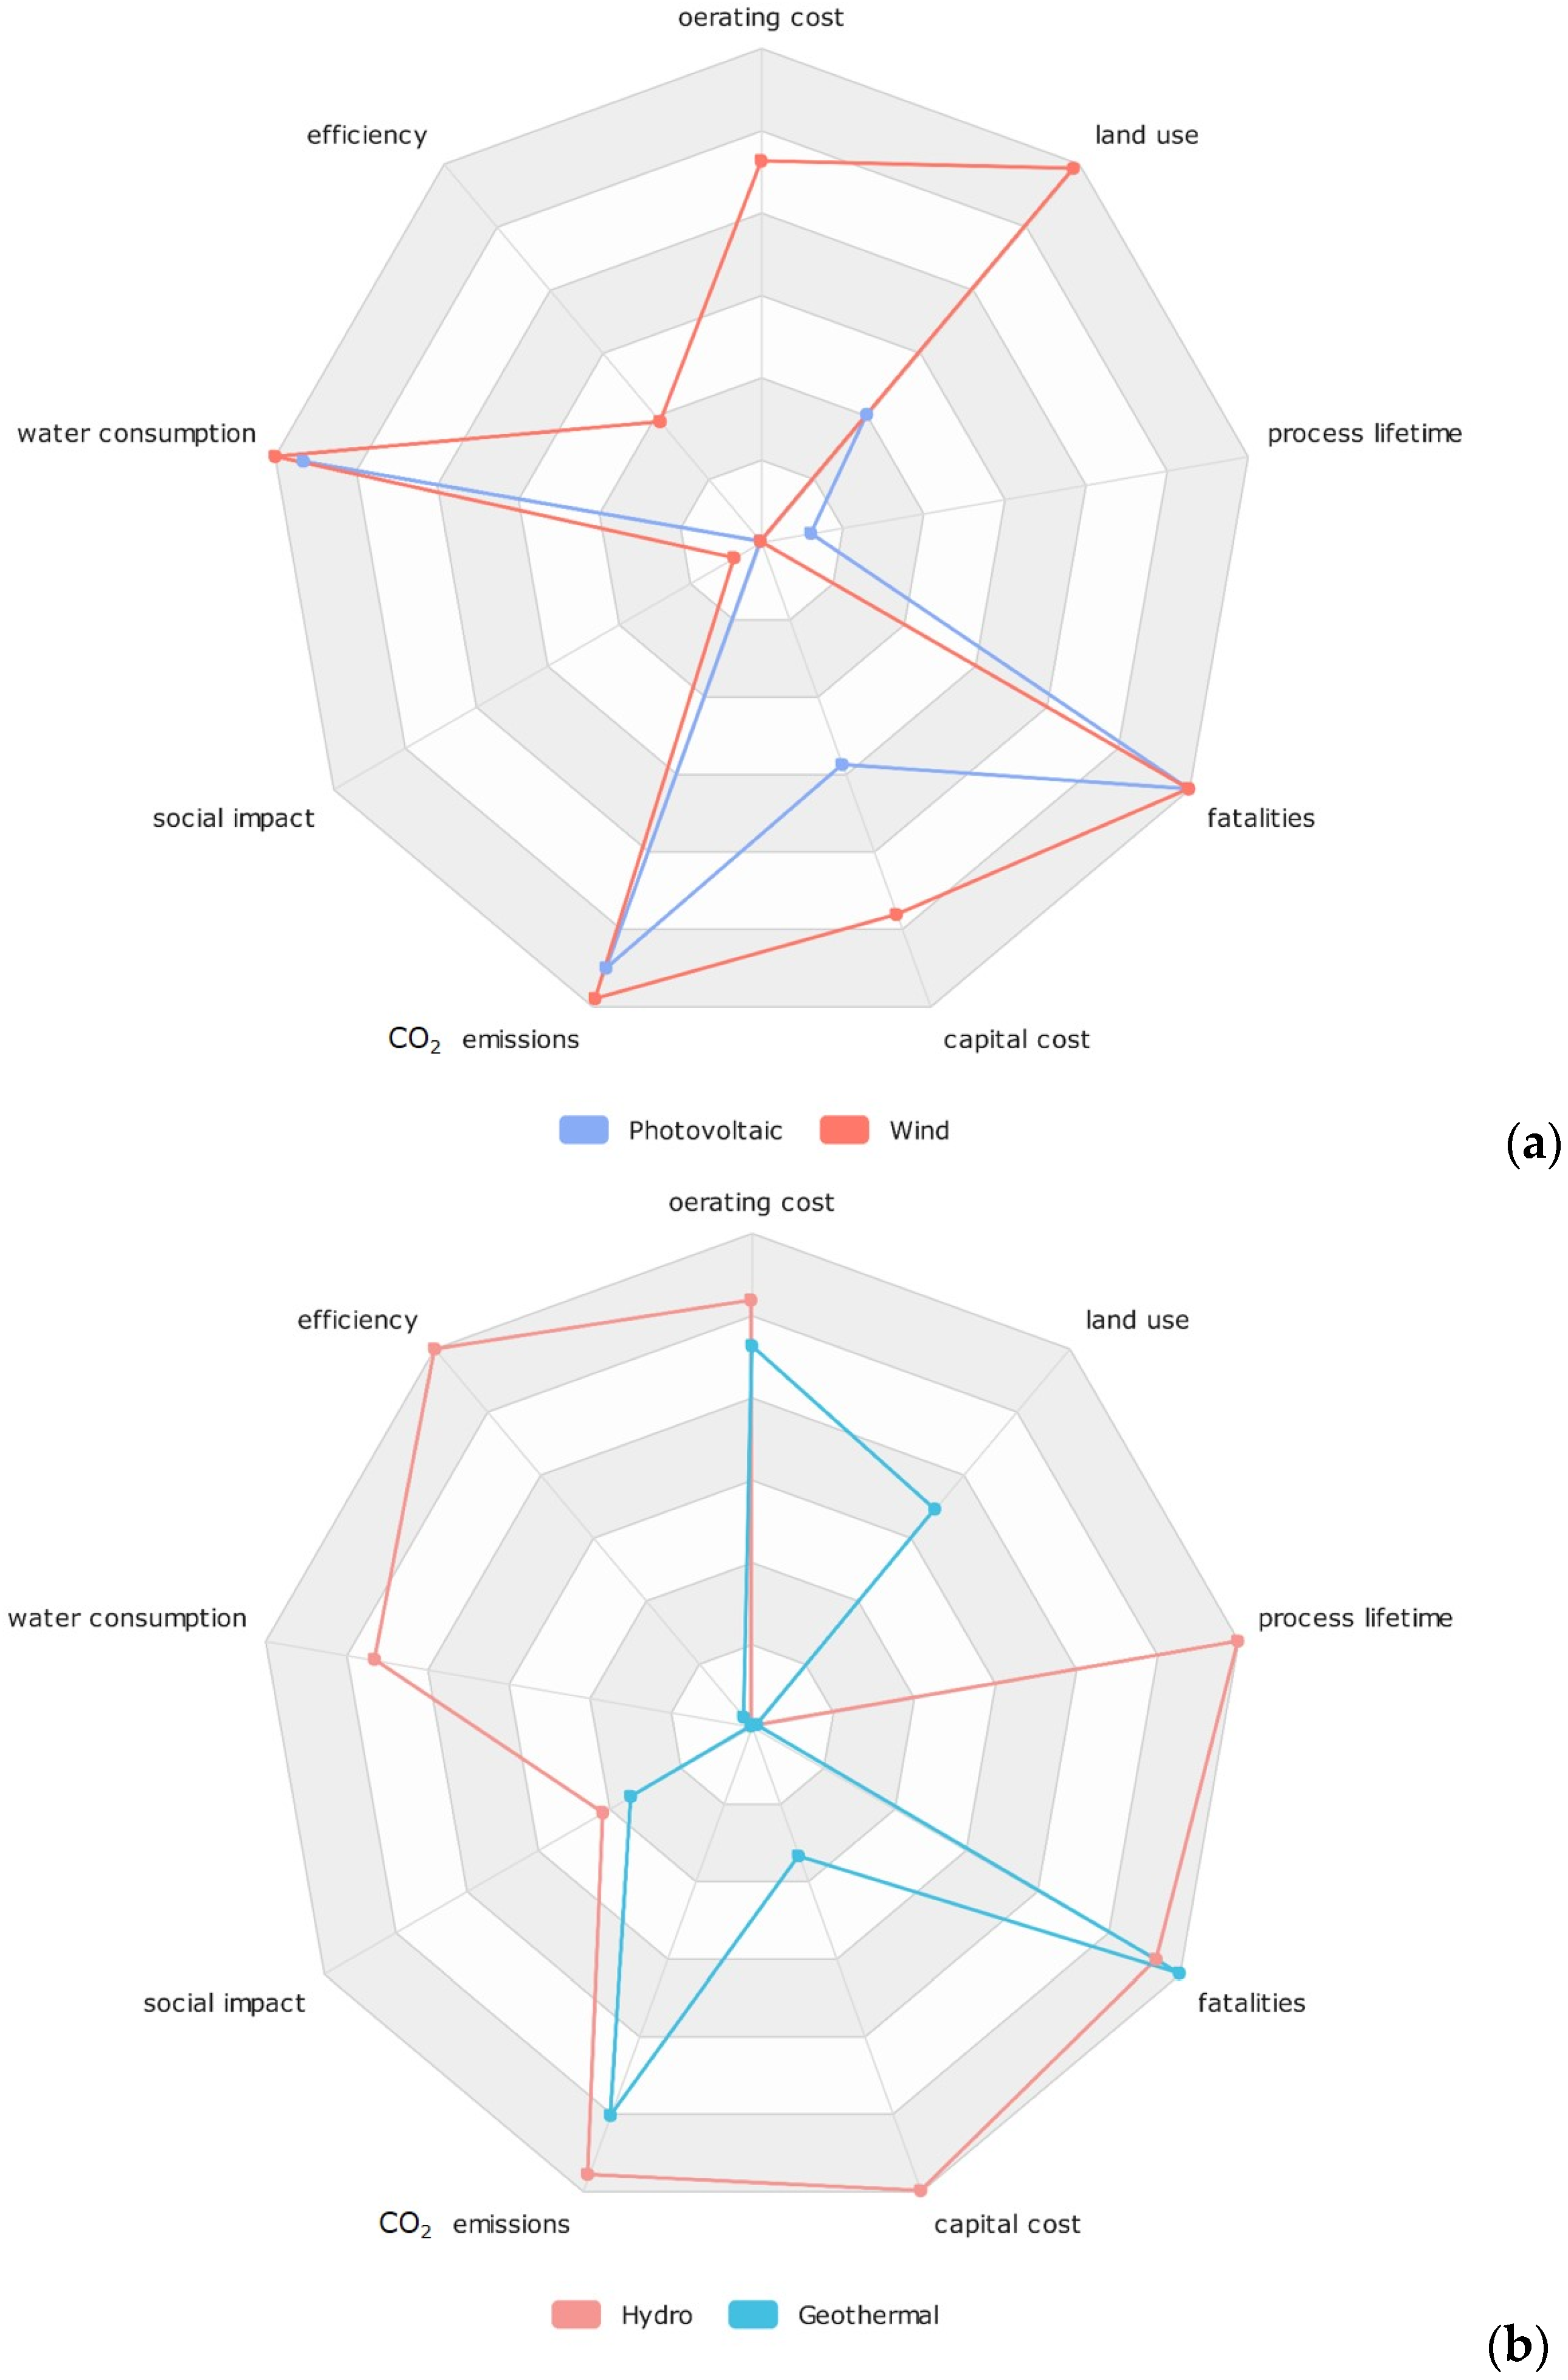
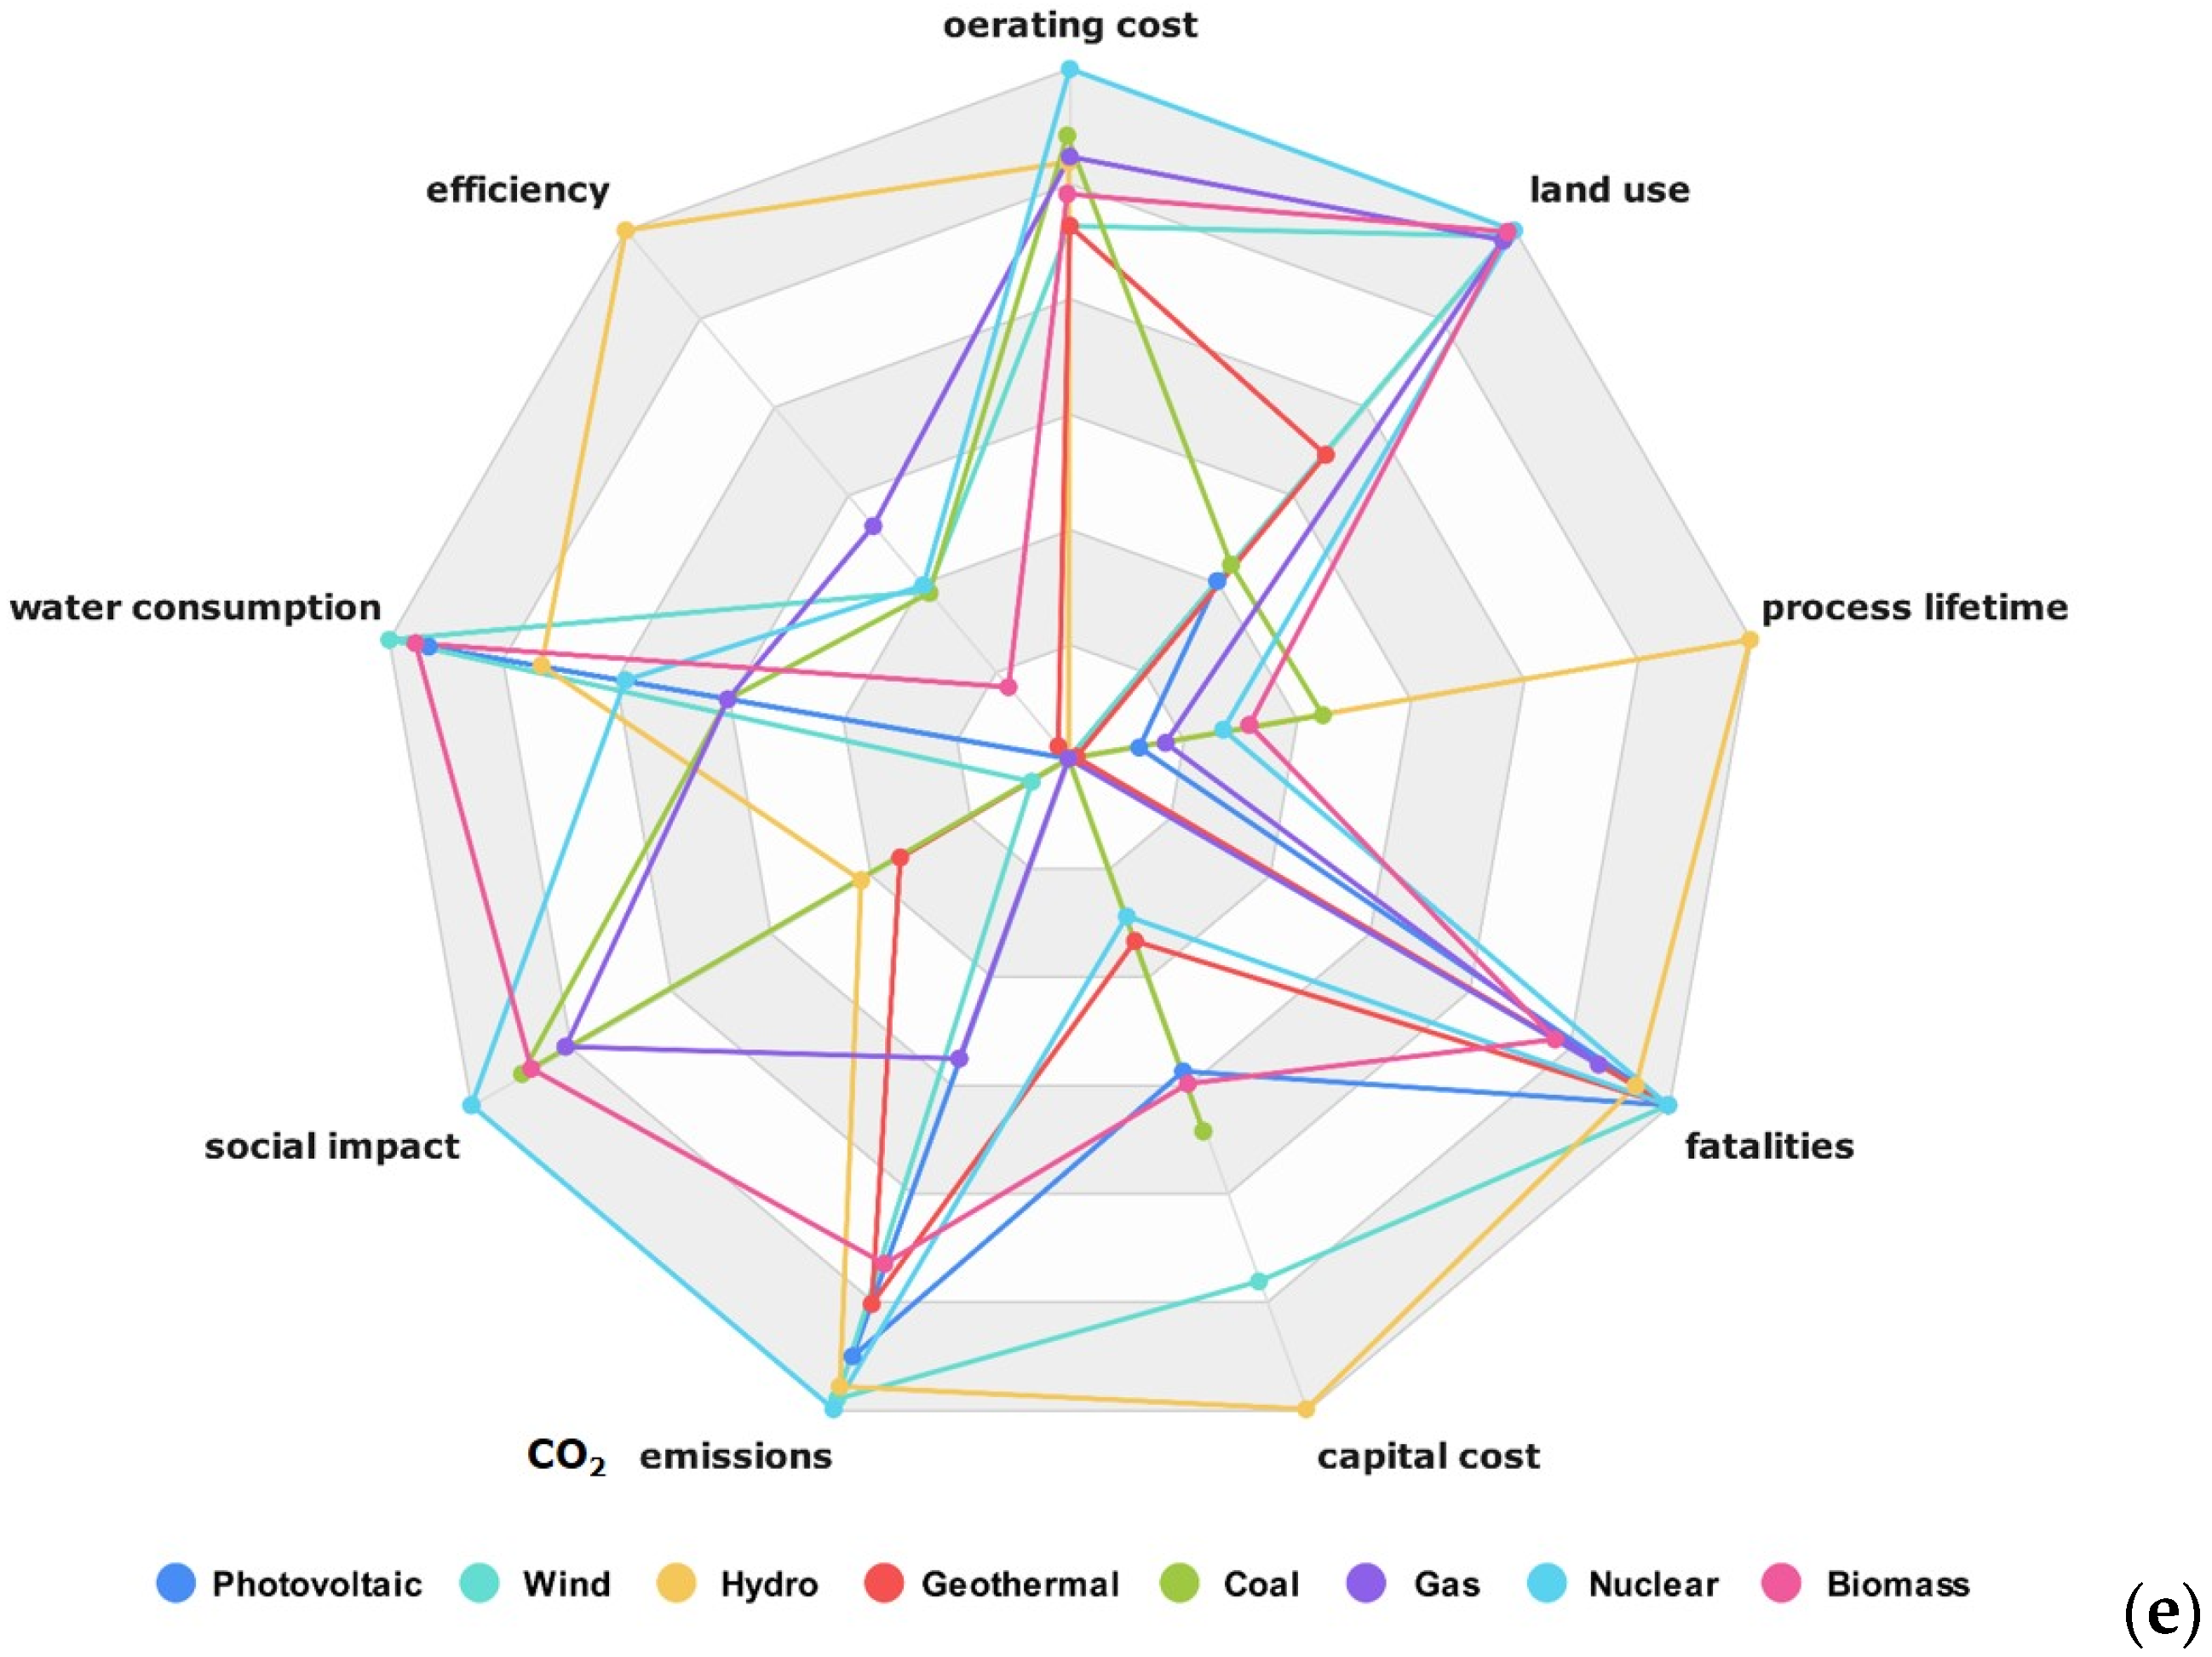
3.1. Sustainability of Energy Production Processes

The analysis of the sustainability of energy production processes included the comparison of the main processes that currently exist, based on both renewable and fossil-fuel sources, and it is reported in Table 3, in which the values related to each indicator defined in Table 1 are reported for each process of power generation. The newest technologies were compared with the traditional ones in order to create a portfolio of efficiency, environment, cost and social impact. For each of the nine selected indicators, the best and worst conditions were identified, according to the benefit or damage given by its related value, as indicated in the Methods section.
According to Equation (1), for each sustainability indicator (from 1 to 9), a percentage score was calculated on the basis of the best and worst conditions identified in Table 3. Therefore, Table 4 reports the obtained values of the scores of the sustainability indicators expressed in terms of percentages. For each row, a best condition (corresponding to a 100% score) and worst condition (corresponding to 0%) were identified; for example, the photovoltaic production of energy is characterized by a 100% score in terms of social impact and number of fatalities per unit of power produced, as compared with the other processes for energy production. On the contrary, photovoltaic appears to be the worst in terms of cost and efficiency among the processes selected for comparison, yet it is the best in terms of process longevity. The eolic production of energy has a 100% score in terms of water consumption (volumes minimized) and social impact (the lowest obtained value on the dimensionless perception scale from 1 to 10, based on surveys [37]). Hydroelectric production is the best in terms of efficiency, investment cost and maximum plant productivity, while geothermal only holds the first place for the score related to the lowest number of fatalities.
As expected, coal- and gas-based processes are more unsustainable, as they never reach the best values for any indicator. In the last decades, this was due to the low supply risk for coal- and gas-related processes; thus, countries and politics have favored the development and use of the so-called “brown” processes. Because the supply risk of these materials has been increasing in the last decades, together with the awareness of their severe environmental issues, greener power sources have begun replacing coal and gas.
Nuclear has the highest values in terms of operating costs, carbon dioxide emissions and use of land. Graphic representations of these results are reported in Figure 1 as radar charts, which allow for the visualization of multivariate data (as those under analysis) in a unique two-dimensional framework.
In particular, in Figure 1e, the overall comparison allows for a visualization of the strengths of all the processes at a single glance. The more outwardly the graph is distributed, and with the large included area, the more virtuous that process is in terms of sustainability (i.e., the synergistic balance of all the indicators identified). Following these indications, hydro, nuclear and wind appear to be the most sustainable processes.
In Figure 2, the average score value for each of the considered processes, calculated according to Equation (2), is reported in terms of a basic bar chart.
According to the applied methodology, the most sustainable process for energy production appears to be the one with the largest area drawn in the radar diagram by indicator values: the generation of power from hydroelectric, followed by wind and nuclear. This result is also confirmed by Figure 2, which indicates hydro and coal as the best and worst processes, respectively, according to the indicator set adopted for the analysis.

3.2. Sustainability of Manufacturing Materials

Table 5 reports the values of the selected indicators collected and calculated for the selected manufacturing materials used in the overall sustainability analysis. In this second case study, the purpose was to provide a methodology to select the best-performing material not only in terms of technical properties (strength, stiffness, ductility, conductivity, etc.), but also in terms of carbon dioxide emissions, recyclability, service temperature range, etc., which define its sustainability.
It is particularly important to assess that changing the area of interest (from a process to a material) results in the definition of completely different indicators. However, also for this second case study, it was possible to use the same analytical procedure defined in the Methods section, and for each indicator (numbered from 10 to 18), the best and worst values were calculated. Moreover, in Table 5, for the determination of oak wood properties, the fibers were assumed to be parallel to the grain, as wood is not an isotope material, and some of its mechanical properties may change according to the direction of the fibers. Of course, this assumption is negligible in terms of productivity, efficiency and carbon dioxide emissions.
In this case study, for a meaningful comparison, we assumed a defined destination use for the material (i.e., we hypothesized that the designer needed to select a material with high ductility, high rigidity, high density and high conductivity for a specific structure or design object). Imaging to select a material with the highest ultimate tensile strength, the best one would be polyurethane. Moreover, the highest stiffness value is for stainless steel, among the list of materials compared in Table 5. It is worth recalling that the definition of a value as best or worst strictly depends on the assumptions, which are defined on the basis of the desired application. That is why this method is as simple as it is powerful. Hence, when building the corresponding score (Equation (1)), the best value for density is considered either the lowest or highest depending on the necessity to minimize or maximize the weight per unit volume of a finite object. Regarding the service temperature range, in this study, the best value for the materials is the one with the largest difference between the maximum and minimum service temperature values. For a fair comparison of the materials, one of the most important indicators is the carbon dioxide emissions per unit mass of the chosen materials; in this study, it is calculated as the best for stainless steel and the worst for porcelain. The results in terms of cost are totally different, and porcelain has the best score. Furthermore, the largest annual manufacturing amount is related to oak wood; thus, it assures the lowest risk supply, which has an indirect effect on the social impact. The conductivity, once again, is an indicator that we may need to maximize or minimize; therefore, the best or worst values will depend on the kind of application required. In our case, we assumed that aluminum has the best score. Among the most available materials, aluminum is non-corrosive, ductile and highly conductive, having a relatively low weight. Moreover, its supply risk is particularly low, as it is one of the first five most common elements in the earth’s crust. It is the most employed metal after steel for its similar stiffness, with the advantage of being cheaper.
In Table 6, the obtained values of the scores of the sustainability indicators expressed in terms of percentages for manufacturing materials are listed.
Moreover, for this case study, radar diagrams of these calculations were built and are reported in Figure 3 (singularly and in pairs), while, in Figure 4, histograms comparing the average percentage scores allow for a final comparison.
Considering as best conditions for this study high rigidity, elastic behavior, density and thermal conductivity, the best-performing material is undoubtedly stainless steel. Of course, this study could give completely different results in cases of different mechanical properties desired by the researcher or customer. Designers should be aware of this before starting calculations and looking for data to build their own sustainability indicators.

4. Conclusions

The massive development of industrial production based on the extensive use of natural resources and the extremely high energy demand has determined the urgent need to face the environmental, economic and social consequences inevitably derived. In particular, the depletion of natural resources, the generation of huge amounts of wastes and the emissions of polluting substances, especially those that are climate-changing, push for a revision of the productive paradigms of modern societies, orienting all changes in light of the concept of sustainability. As all the choices should be made aiming at the most sustainable one, there is a growing interest in defining methodologies, procedures and easy-to-apply algorithms for their thorough individuation.
The main aim of this work is to propose a methodology to select a process or material based on the definition of specific criteria, which accounts for its sustainability. The numerical criteria (indicators) are specifically related to the environmental, social, energetic and economic impacts; each of them is correlated to an indicative functional unit, which represents the basis for extensive parameter analysis (e.g., mass or volume or flow rate).
As case studies, the methodology was applied to the main technologies currently available for the production of energy, accounting for both renewable and non-renewable sources, and to the main manufacturing materials.
The main steps of the proposed methodology are as follows:
  • Individuation of the alternative processes/materials to be compared;
  • Definition of the most representative set of indicators;
  • Collection and calculation of numerical values of each indicator, for all the alternatives previously individuated;
  • Calculation of the scores, by the individuation of the best and worst among all the previous defined indicator values on the basis of the assumptions;
  • Calculation of an average score value and radar representation for the final comparison of processes/material.
Following these steps, it was possible to assess that hydroelectric, biomass and nuclear sources are the most sustainable options for the production of energy. Among the materials, high rigidity, elastic behavior, density and thermal conductivity are the desired properties. Thus, the best-performing material is stainless steel.
This study can be easily applied to other similar scopes or interest areas dealing with environmental, social and economic issues (i.e., to those applications in which the individuation of the most sustainable option is still an open issue). At the same time, the obtained results represent the starting point for the implementation of improvement and enhancement procedures, promoting the use of the recycling, reuse, reducing (both energy and resources employed), regenerating and repairing approaches to human activities.
As a final consideration, the proposed methodology can be easily extended to a larger number of indicators (e.g., including acidification, basification, mass or number of hazardous raw materials and other kinds of pollutant management) or performed with an alternative set, which could be objects of future investigations.

Author Contributions

Conceptualization, P.T. and A.E.; methodology, P.T.; software, P.T.; validation, P.T. and A.E.; formal analysis, P.T. and A.E.; investigation, P.T. and A.E.; resources, P.T. and A.E.; data curation, P.T.; writing—original draft preparation, P.T. and A.E.; writing—review and editing, P.T. and A.E.; visualization, P.T. and A.E.; supervision, P.T. and A.E.; funding acquisition, P.T. All authors have read and agreed to the published version of the manuscript.

Funding

This research received no external funding.

Institutional Review Board Statement

Not applicable.

Informed Consent Statement

Not applicable.

Data Availability Statement

We confirm that all data shown in this results section is new and never published elsewhere. This values were obtained from the definitions and the calculations of sustainability indicators, starting from process and materials raw data acquired from the literature.

Conflicts of Interest

The authors declare no conflict of interest.

References

  1. Mohan Das Gandhi, N.; Selladurai, V.; Santhi, P. Unsustainable development to sustainable development: A conceptual model. Manag. Environ. Qual. Int. J. 2006, 17, 654–672. [Google Scholar] [CrossRef]
  2. Schor, J.B. Prices and quantities: Unsustainable consumption and the global economy. Ecol. Econ. 2005, 55, 309–320. [Google Scholar] [CrossRef]
  3. Haberl, H.; Fischer-Kowalski, M.; Krausmann, F.; Martinez-Alier, J.; Winiwarter, V. A socio-metabolic transition towards sustainability? Challenges for another Great Transformation. Sustain. Dev. 2011, 19, 1–14. [Google Scholar] [CrossRef]
  4. Wall, G.; Gong, M. On exergy and sustainable development—Part 1: Conditions and concepts. Exergy Int. J. 2001, 1, 128–145. [Google Scholar] [CrossRef]
  5. Szamałek, K.; Galos, K. Metals in Spent Mobile Phones (SMP)–a new challenge for mineral resources management. Miner. Resour. Manag. 2016, 32, 45–58. [Google Scholar] [CrossRef]
  6. Khan, M.M.R.; Islam, M.M. Materials and manufacturing environmental sustainability evaluation of apparel product: Knitted T-shirt case study. Text. Cloth. Sustain. 2015, 1, 8. [Google Scholar] [CrossRef] [Green Version]
  7. Bourekoua, H.; Benatallah, L.; Zidoune, M.N.; Rosell, C.M. Developing gluten free bakery improvers by hydrothermal treatment of rice and corn flours. Lwt 2016, 73, 342–350. [Google Scholar] [CrossRef] [Green Version]
  8. Shue, H. Global environment and international inequality. Int. Aff. 1999, 75, 531–545. [Google Scholar] [CrossRef]
  9. Alabi, O.A.; Ologbonjaye, K.I.; Awosolu, O.; Alalade, O.E. Public and environmental health effects of plastic wastes disposal: A review. J. Toxicol Risk Assess 2019, 5, 1–13. [Google Scholar]
  10. Wahiba, N.F.; El Weriemmi, M. The relationship between economic growth and income inequality. Int. J. Econ. Financ. Issues 2014, 4, 135–143. [Google Scholar]
  11. Sarkodie, S.A. Environmental performance, biocapacity, carbon & ecological footprint of nations: Drivers, trends and mitigation options. Sci. Total Environ. 2021, 751, 141912. [Google Scholar]
  12. Lin, D.; Wambersie, L.; Wackernagel, M. Estimating the Date of Earth Overshoot Day 2021. In Nowcasting the World’s Footprint & Biocapacity for 2021; Global Footprint Network: Oakland, CA, USA, 2021; pp. 1–8. [Google Scholar]
  13. Gabbi, G.; Matthias, M.; Patrizi, N.; Pulselli, F.M.; Bastianoni, S. The biocapacity adjusted economic growth. Developing a new indicator. Ecol. Indic. 2021, 122, 107318. [Google Scholar] [CrossRef]
  14. Lee, R.P.; Keller, F.; Meyer, B. A concept to support the transformation from a linear to circular carbon economy: Net zero emissions, resource efficiency and conservation through a coupling of the energy, chemical and waste management sectors. Clean Energy 2017, 1, 102–113. [Google Scholar] [CrossRef] [Green Version]
  15. Geisendorf, S.; Pietrulla, F. The circular economy and circular economic concepts—A literature analysis and redefinition. Thunderbird Int. Bus. Rev. 2018, 60, 771–782. [Google Scholar] [CrossRef]
  16. Camacho-Otero, J.; Boks, C.; Pettersen, I.N. Consumption in the circular economy: A literature review. Sustainability 2018, 10, 2758. [Google Scholar] [CrossRef] [Green Version]
  17. Stahel, W.R. The circular economy. Nature 2016, 531, 435–438. [Google Scholar] [CrossRef] [Green Version]
  18. Velenturf, A.P.; Purnell, P. Principles for a sustainable circular economy. Sustain. Prod. Consum. 2021, 27, 1437–1457. [Google Scholar] [CrossRef]
  19. Morseletto, P. Targets for a circular economy. Resour. Conserv. Recycl. 2020, 153, 104553. [Google Scholar] [CrossRef]
  20. Ogunmakinde, O.E.; Sher, W.; Egbelakin, T. Circular economy pillars: A semi-systematic review. Clean Technol. Environ. Policy 2021, 23, 899–914. [Google Scholar] [CrossRef]
  21. Čiarnienė, R.; Vienažindienė, M. Lean manufacturing: Theory and practice. Econ. Manag. 2012, 17, 726–732. [Google Scholar] [CrossRef] [Green Version]
  22. Mazzi, A. Introduction. Life cycle thinking. In Life Cycle Sustainability Assessment for Decision-Making Methodologies and Case Studies; Elsevier: Amsterdam, The Netherlands, 2020; pp. 1–19. [Google Scholar]
  23. Puckett, J.C.; Stauss, R.L.; Wilson, C. Cradle-to-Grave Material Management. AACE Int. Trans. 1991, O6, 1–9. [Google Scholar]
  24. Souren, R. Material flow analysis in closed-loop supply chains: Modelling of packaging waste recycling at different hierarchical levels. Int. J. Integr. Supply Manag. 2004, 1, 117–138. [Google Scholar] [CrossRef]
  25. Bañon Gomis, A.J.; Guillén Parra, M.; Hoffman, W.M.; McNulty, R.E. Rethinking the concept of sustainability. Bus. Soc. Rev. 2011, 116, 171–191. [Google Scholar] [CrossRef]
  26. Gäbler, K. Green capitalism, sustainability, and everyday practice. Global Sustainability: Cultural Perspectives and Challenges for Transdisciplinary Integrated Research; Springer: Berlin/Heidelberg, Germany, 2015; pp. 63–86. [Google Scholar]
  27. Glavič, P.; Lukman, R. Review of sustainability terms and their definitions. J. Clean. Prod. 2007, 15, 1875–1885. [Google Scholar] [CrossRef]
  28. Rosário, A.T.; Dias, J.C. Sustainability and the Digital transition: A literature review. Sustainability 2022, 14, 4072. [Google Scholar] [CrossRef]
  29. Dergan, T.; Ivanovska, A.; Kocjančič, T.; Iannetta, P.P.; Debeljak, M. ‘Multi-SWOT’Multi-Stakeholder-Based Sustainability Assessment Methodology: Applied to Improve Slovenian Legume-Based Agri-Food Chains. Sustainability 2022, 14, 15374. [Google Scholar] [CrossRef]
  30. Christensen, D. Computational Thinking to Learn Environmental Sustainability: A Learning Progression. J. Sci. Educ. Technol. 2022, 32, 26–44. [Google Scholar] [CrossRef]
  31. Saidani, M.; Yannou, B.; Leroy, Y.; Cluzel, F.; Kendall, A. A taxonomy of circular economy indicators. J. Clean. Prod. 2019, 207, 542–559. [Google Scholar] [CrossRef] [Green Version]
  32. Ruiz-Mercado, G.J.; Smith, R.L.; Gonzalez, M.A. Sustainability indicators for chemical processes: I. Taxonomy. Ind. Eng. Chem. Res. 2012, 51, 2309–2328. [Google Scholar] [CrossRef]
  33. Ruiz-Mercado, G.J.; Smith, R.L.; Gonzalez, M.A. Sustainability indicators for chemical processes: II. Data needs. Ind. Eng. Chem. Res. 2012, 51, 2329–2353. [Google Scholar] [CrossRef]
  34. Ruiz-Mercado, G.J.; Gonzalez, M.A.; Smith, R.L. Sustainability indicators for chemical processes: III. Biodiesel case study. Ind. Eng. Chem. Res. 2013, 52, 6747–6760. [Google Scholar] [CrossRef]
  35. Verma, P.; Raghubanshi, A.S. Urban sustainability indicators: Challenges and opportunities. Ecol. Indic. 2018, 93, 282–291. [Google Scholar] [CrossRef]
  36. Kothari, R.; Tyagi, V.V.; Pathak, A. Waste-to-energy: A way from renewable energy sources to sustainable development. Renew. Sustain. Energy Rev. 2010, 14, 3164–3170. [Google Scholar] [CrossRef]
  37. Evans, A.; Strezov, V.; Evans, T.J. Assessment of sustainability indicators for renewable energy technologies. Renew. Sustain. Energy Rev. 2009, 13, 1082–1088. [Google Scholar] [CrossRef]
  38. Monnin, P. The Impact of Interest Rates on Electricity Production Costs; Council on Economic Policies: Zurich, Switzerland, 2015. [Google Scholar]
  39. Liu, G. Development of a general sustainability indicator for renewable energy systems: A review. Renew. Sustain. Energy Rev. 2014, 31, 611–621. [Google Scholar] [CrossRef]
  40. Barreto, R.A. Fossil fuels, alternative energy and economic growth. Econ. Model. 2018, 75, 196–220. [Google Scholar] [CrossRef] [Green Version]
  41. Spada, M.; Sutra, E.; Burgherr, P. Comparative accident risk assessment with focus on deep geothermal energy systems in the Organization for Economic Co-operation and Development (OECD) countries. Geothermics 2021, 95, 102142. [Google Scholar] [CrossRef]
  42. Dicorato, M.; Forte, G.; Pisani, M.; Trovato, M. Guidelines for assessment of investment cost for offshore wind generation. Renew. Energy 2011, 36, 2043–2051. [Google Scholar] [CrossRef]
  43. Gunnarsdóttir, I.; Davidsdottir, B.; Worrell, E.; Sigurgeirsdóttir, S. Review of indicators for sustainable energy development. Renew. Sustain. Energy Rev. 2020, 133, 110294. [Google Scholar] [CrossRef]
  44. Alabbasi, A.; Sadhukhan, J.; Leach, M.; Sanduk, M. Sustainable Indicators for Integrating Renewable Energy in Bahrain’s Power Generation. Sustainability 2022, 14, 6535. [Google Scholar] [CrossRef]
  45. Onat, N.; Bayar, H. The sustainability indicators of power production systems. Renew. Sustain. Energy Rev. 2010, 14, 3108–3115. [Google Scholar] [CrossRef]
  46. Karana, E.; Pedgley, O.; Rognoli, V. Materials Experience: Fundamentals of Materials and Design; Butterworth-Heinemann: Oxford, UK, 2013. [Google Scholar]
  47. Karana, E.; Barati, B.; Rognoli, V.; Zeeuw Van Der Laan, A. Material driven design (MDD): A method to design for material experiences. Int. J. Des. 2015, 9, 35–54. [Google Scholar]
  48. Hague, R.; Mansour, S.; Saleh, N. Material and design considerations for rapid manufacturing. Int. J. Prod. Res. 2004, 42, 4691–4708. [Google Scholar] [CrossRef]
  49. Thompson, R.; Thompson, M. The Materials Sourcebook for Design Professionals; Thames & Hudson: London, UK, 2017. [Google Scholar]
  50. Pal, U.B. A lower carbon footprint process for production of metals from their oxide sources. JOM 2008, 60, 43–47. [Google Scholar] [CrossRef]
  51. Clarke, D.R. Materials selection guidelines for low thermal conductivity thermal barrier coatings. Surf. Coat. Technol. 2003, 163, 67–74. [Google Scholar] [CrossRef]
  52. Leejarkpai, T.; Mungcharoen, T.; Suwanmanee, U. Comparative assessment of global warming impact and eco-efficiency of PS (polystyrene), PET (polyethylene terephthalate) and PLA (polylactic acid) boxes. J. Clean. Prod. 2016, 125, 95–107. [Google Scholar] [CrossRef]
  53. Çavuş, V.; Şahin, S.; Esteves, B.; Ayata, U. Determination of thermal conductivity properties in some wood species obtained from Turkey. Bioresources 2019, 14, 6709–6715. [Google Scholar] [CrossRef]
  54. Turner, L.K.; Collins, F.G. Carbon dioxide equivalent (CO2-e) emissions: A comparison between geopolymer and OPC cement concrete. Constr. Build. Mater. 2013, 43, 125–130. [Google Scholar] [CrossRef]
  55. Marland, G.; Rotty, R.M. Carbon dioxide emissions from fossil fuels: A procedure for estimation and results for 1950–1982. Tellus B Chem. Phys. Meteorol. 1984, 36, 232–261. [Google Scholar] [CrossRef]
Figure 1. Radar representations of scores: (a) coupled photovoltaic and wind; (b) coupled hydroelectrical and geothermal; (c) coupled coal and gas; (d) coupled nuclear and biomass; (e) comparison of all the processes included in this study.
Sustainability 15 06689 g001aSustainability 15 06689 g001bSustainability 15 06689 g001c
Figure 2. Average scores obtained by power plant production processes.
Sustainability 15 06689 g002
Figure 3. Radar representations of scores: (a) triple aluminum alloy, stainless steel, brass; (b) coupled PET and PU; (c) coupled oak wood and porcelain; (d) comparison of all the materials included in this study.
Sustainability 15 06689 g003aSustainability 15 06689 g003b
Figure 4. Average scores obtained by material selection.
Sustainability 15 06689 g004
Table 1. Indicators defined for the comparison of energy production processes.
#Type of ImpactDefinitionUnit of Measure
1 EconomicCost of energy production (i.e., operating cost per kWh generated)€/kWh
2 EnvironmentalEquivalent CO2 mass emitted to atmosphere per kWh generatedgCO2/kWh
3 Environmental/EconomicRatio among energy output over total energy fed to the process in terms of equivalent fuel (efficiency)%
4 EnvironmentalWater consumption per kWh generatedg/kWh
5 SocialSocial perception of the process (scale from 1 to 10)dimensionless
6 EconomicInvestment cost of the process per kWh generated€/kWh
7 SocialNumber of fatalities per TWh generated1/TWh
8 Environmental/EconomicProcess plant lifetimeYear
9 Environmental/SocialUse of land to build process plants related to energy producedm2/kWh
Table 2. Indicators defined on the basis of material properties and their manufacturing conditions.
#Type of ImpactDefinitionUnit of Measure
10Environmental/EconomicUltimate tensile strength (i.e., maximum strength that the material can withstand)MPa
11Environmental/EconomicStiffness (i.e., resistance to plastic deformation)MPa
12Environmental/EconomicDensity of the materialkg/m3
13EconomicDifference between the maximum and minimum service temperatures°C
14EnvironmentalEquivalent mass of carbon dioxide produced per specific material unit mass producedkgCO2/kg
15EconomicCost of material per unit mass€/kg
16Economic/SocialAnnual productivity, related to supply risk of this materialton
17EnvironmentalRecyclability fraction%
18Environmental/Economic/SocialCapability to transfer heatW/m K
Table 3. Values of indicators (see numbers in Table 1) related to power generation processes [34,35,36,37,38,39,40,41,42,43,44].
Sustainability Indicators123456789
Processes
photovoltaic0.249013109.5735680.000023022
eolic0.07253919.1123860.0000422.00.8
hydroelectric0.054195367.0616790.0013010033
geothermal0.07170151567.5342860.000022314
coal0.04100438783.0132160.024625121
gas0.0554349783.5453130.00282331
nuclear0.02940552.3844350.00003400.3
biomass0.06230247.23.1235000.00463430.5
best condition0.0299512.3816790.000021000.3
worst condition0.241004131569.5753130.024622233
Table 4. Scores (%) calculated for each indicator of the accounted power generation processes.
Sustainability IndicatorPhotovoltaicWindHydroGeothermalCoalGasNuclearBiomass
operating cost0.0077.2786.3677.2790.0087.27100.0081.59
efficiency0.0031.71100.002.4431.1043.9032.9313.54
water consumption94.19100.0077.420.0050.3250.3265.1696.00
social impact0.006.4034.9128.3791.2483.87100.0089.71
CO2 emissions 91.8698.3996.7883.820.0046.33100.0077.79
investment cost 48.0280.53100.0028.2657.710.0024.1649.89
# of fatalities100.0099.9294.80100.000.0088.6299.9681.26
process lifetime10.260.00100.001.2837.1814.1023.0826.92
land use33.6498.560.0057.5736.7097.86100.0099.29
Table 5. Values of indicators (see numbers in Table 2) related to manufacturing materials [45,46,47,48,49,50,51,52,53,54,55].
Sustainability Indicators101112131415161718
Materials
aluminum alloy31069,000270046021.85.0 × 107 50251
stainless steel820200,000790011000.9534.6 × 1087015.0
brass525110,00085305101.152.5 × 10640130
polyethylene terephthalate (PET)79330013801302.1521.5 × 107350.235
polyurethane (PU)3447.56651202.7552.59.5 × 106100.025
oak wood (parallel to grain)5.513,600690671.72548.0 × 105600.197
porcelain10040,000240012503.71.64.0 × 10601
best condition3447.5200,000853012500.951.64.6 × 10870251
worst condition5.5665673.758.0 × 10500.025
Table 6. Scores (%) calculated for materials in percentages.
Sustainability IndicatorsAluminum AlloyStainless SteelBrassPETPUOak WoodPorcelain
tensile strength 8.8523.6615.092.14100.000.002.75
stiffness34.50100.0055.001.650.006.8020.00
density31.1392.56100.0015.530.007.3827.58
service temperature range33.2292.5637.455.334.480.00100.00
CO2 emissions61.82100.0094.5556.3634.3671.820.00
cost94.1258.820.0088.2473.5329.41100.00
annual productivity10.71100.000.373.091.890.000.70
recyclability71.43100.0057.1450.0014.2985.7185.71
conductivity100.005.9751.790.080.000.070.39
Disclaimer/Publisher’s Note: The statements, opinions and data contained in all publications are solely those of the individual author(s) and contributor(s) and not of MDPI and/or the editor(s). MDPI and/or the editor(s) disclaim responsibility for any injury to people or property resulting from any ideas, methods, instructions or products referred to in the content.

