Abstract
Winery wastewater (WWW) handling strategies often include co-treatment at municipal wastewater treatment plants (WWTPs). Despite this, definitive information regarding oxidation kinetics and process and performance impacts due to co-treatment is lacking. A combined Michaelis–Menten–University of Cape Town kinetic model has been found to best describe the pH-inhibited aerobic biological oxidation of WWW by heterotrophs in activated sludge from four municipal WWTPs. The specific rate of substrate consumption was highest in biomass that had been exposed to WWW (57.3 mg COD/g MLVSS·h) compared to biomass that had not (20.7 mg COD/g MLVSS·h). Bench-scale aerobic co-treatment trials confirm that sorption is a key removal mechanism, with up to 98% chemical oxygen demand and 97% total organic carbon removal after 6 h of reaction time. The WWW solids are quickly incorporated into the biological floc and may improve settleability at loading rates above 75 mg WWW suspended solids/L bioreactor volume at the expense of significantly increasing the observed yield. The aerobic-activated sludge system at municipal WWTPs can effectively co-treat WWW, provided the organic loading rates are limited and the WWTP is designed to accommodate the seasonal loadings of winery wastewater. The identified mitigation measures can be used by co-treating facilities to optimize the co-treatment performance of WWW along with domestic wastewater.
1. Introduction
Wine-making produces a large volume of winery wastewater (WWW) that is highly seasonally variable in both strength and volume [1]. On-site WWW treatment systems are used at many wineries, with the effluent either disposed of to the natural environment or reused for irrigation [2,3,4]. In other cases, WWW is co-treated at municipal wastewater treatment plants (WWTPs), using the existing infrastructure of the WWTPs, where such facilities exist [5,6]. Despite meeting or exceeding the regulatory treatment requirements, the co-treated WWW still exerts significant environmental impacts on surface water bodies [7]. In addition, the practice of co-treating is not viable in the long-term due to capacity limitations and performance concerns at municipal WWTPs [8,9].
Reported negative process impacts of WWW co-treatment in the liquid treatment trains of municipal WWTPs include inconsistent effluent quality, deterioration in sludge settleability, and oxygenation limitations [5,9]. The use of historic full-scale operating data from municipal WWTPs to quantify performance, capacity, process performance, and limitations specific to WWW co-treatment is challenging due to the periodic frequency of sample collection, limited availability of monitoring data, and confounding factors that also impact the overall process performance such as wet weather flow events, temperature variations, co-treatment of other wastes, internal waste stream handling, and equipment malfunction, among others. Even with advances in instrumentation and online monitoring capabilities, the complexity of the processes involved in the treatment of wastewaters by activated sludge systems cannot be easily elucidated from full-scale operating data. Therefore, these studies do not provide a detailed evaluation or quantification of the removal mechanisms or reaction kinetics associated with WWW co-treatment by aerobic-activated sludge systems. While the use of activated sludge models can provide some insight with respect to the anticipated co-treatment performance, their inability to accurately predict impacts on sludge settling characteristics limits their utility [10].
The overall objective of this study was to improve the understanding of the behavior and performance of aerobic biological treatment trains at municipal WWTPs during the co-treatment of WWW by conducting (i) a kinetic assessment of the biological oxidation of WWW using mixed liquor from municipal WWTPs, and (ii) bench-scale co-treatment trials to assess the overall pollutant removal efficiencies and mechanisms and the impacts on mixed liquor characteristics.
To accomplish these objectives, the co-treatment performance of activated sludge from four municipal WWTPs in the Niagara Region, Ontario, Canada, was used as a case study. The wine industry in Niagara Region has experienced a significant growth in the past several decades, and is now responsible for approximately 18,000 jobs and attracting over two million tourists to the area per year [11]. With this growth in wine-making, there has been an associated increase in the generation of WWW and its treatment needs in the region [8]. Despite most wineries in Niagara Region being equipped with on-site treatment systems, their configurations and treatment limitations require that a portion of the WWW be co-treated at municipal WWTPs [8]. As the wine industry continues to grow in the Niagara Region, the volume of WWWs requiring co-treatment is growing year over year, putting additional strain on the municipal WWTPs, and requiring a better understanding of biodegradation kinetics and process performance impacts.
2. Materials and Methods
2.1. Chemicals
Sodium hydroxide diluted with distilled water to 1 N was used for pH adjustment. 2-Chloro-6 (trichloromethyl) pyridine, potassium hydroxide, and nutrient buffer pillows used for respirometric tests were supplied by HACH Canada.
2.2. Winery Wastewater
Samples of actual WWWs were collected directly from loads hauled by truck to municipal WWTPs in Niagara Region, ON, Canada. Samples were collected during the vintage periods (September to December) of 2017 and 2018. Because hauled loads can contain WWW from one or more wineries, it was not possible to obtain detailed information from the source wineries. The vintage period was selected to capture high-strength wastewater associated with crushing and racking activities. Furthermore, WWW’s highly variable nature has led to variable performance impacts on co-treating municipal WWTPs in Niagara Region. Therefore, three separate WWW samples were used for the biological treatment system testing to observe the impact of variable WWW quality on biological treatment system performance. Characteristics of the WWW used in the biodegradation kinetics and aerobic biological co-treatment trials are summarized in Table 1.

Table 1.
Characteristics of actual WWW samples used for kinetic and co-treatment trials. WWW samples collected from loads hauled to Facility A for the co-treatment. Filtered parameter values are from samples filtered using 0.45-micron glass Whatman filter papers.
2.3. Mixed Liquor
Mixed liquor samples were collected from the aerobic bioreactors of four municipal WWTPs in Niagara Region. Facilities A, B, C, and D, respectively, are as follows: a conventional activated sludge (CAS) plant with mechanical aeration in the bioreactors; a CAS plant with diffused aeration in the bioreactors; a CAS plant with an anoxic selector ahead of bioreactors with diffused aeration; and an extended aeration (EA) plant with diffused aeration in the bioreactors, respectively.
Mixed liquor samples used for oxygen uptake rate (OUR) testing were collected from Facilities A, B, C, and D in October 2018, while samples used for aerobic biological treatment system testing were collected from Facility A during the vintage periods of 2017 and 2018. Facility A was chosen for biological treatment system testing since Niagara Region utilizes this WWTP for co-treatment of a large fraction of the annual WWW volumes processed at their facilities.
2.4. Experimental Set-Up and Procedures
2.4.1. OUR Testing
Mixed liquor used for testing was stored in 20 L flat-bottomed, open-topped containers with a diameter of 29 cm, each equipped with a 9 cm-diameter ceramic fine bubble diffuser. Aeration was provided by an 8-outlet ActiveAQUA AAPA25L air pump (Hydrofarm, California) providing 2.5 L/min per container controlled by a rotameter.
OUR testing was conducted in sealed 500 mL PET bottles that were continuously mixed using a stir bar. A total of 400 mL of mixed liquor was transferred to the test bottle, and 0.27 g/L of 2-chloro-6 (trichloromethyl) pyridine was added to inhibit nitrification. After 15 s of mixing, the test volume of WWW was added, and the bottle completely filled with mixed liquor. The lid was sealed, ensuring no air entrapment within the bottle. Test duration was 10 min, with DO concentrations recorded every 30 s for the first four minutes and every minute thereafter. Mixed liquor was diluted as needed, using either distilled water or WWTP secondary effluent, to ensure that DO concentrations remained > 1.5 mg/L at the end of the test.
The OUR was calculated by plotting the recorded DO concentration vs. time using least squares regression to determine the line of best fit and its slope, based on Equation (1):
where OUR is the oxygen uptake rate (mg O2/L·h), is the concentration of dissolved oxygen (DO) (mg O2/L), and t is time (h). Specific OUR (SOUR), a measure of OUR normalized for biomass content, was calculated as follows:
where SOUR is the specific oxygen uptake rate (mg O2/g MLVSS·h) and MLVSS is the mixed liquor volatile suspended solids concentration (g/L) used as an estimate of the biomass fraction of the mixed liquor [12].
OUR testing was conducted at temperatures of 15.3 ± 1.5 °C. Reported OUR and SOUR values were adjusted to 15 °C using the Arrhenius temperature correction factor of θ = 1.072 [13] and Equation (3):
where OURT is the oxygen uptake rate at temperature T (mg O2/L·h), and OUR15 is the oxygen uptake rate at the reference value of 15 °C (mg O2/L·h).
Mixed liquor was aerated for a minimum of 24 h prior to testing to allow aerobically biodegradable substrate that was stored in the mixed liquor to be oxidized, resulting in more consistent SOUR rates driven mostly by endogenous respiration [13]. After 24 h of aeration, the SOUR of all mixed liquor samples were ≤4.86 mg O2/g MLVSS/h.
Due to the nature of the WWW, with live microorganisms continuing to ferment the sugars and other organic constituents, all OUR testing was conducted as quickly as possible to ensure consistency in the WWW characteristics from one run to another. Testing occurred over a period of 33 h, and test run order was randomized. When possible, the WWW was kept in a fridge (set to approximately 5 °C), with small aliquots (approximately 100 mL) removed prior to testing for pH adjustment and to allow the temperature to stabilize to room temperature. Due to time limitations, it was not possible to conduct triplicate runs for all test conditions. OUR testing was done in triplicates for 2 runs, and the standard deviation was less than 2.2% of the mean SOUR value, indicating good reproducibility.
2.4.2. Aerobic Biological Treatment System
The containers used as the bench-scale aerobic biological reactors were the same as those used to store mixed liquor for OUR testing (see Section 2.4.1). Bioreactor temperatures were allowed to vary with room temperature. All runs used mixed liquor from Facility A. To prepare each reactor, 12 to 16 L of mixed liquor was taken directly from a Facility A bioreactor, and left to settle for 30 min, whereupon 6 to 7 L of supernatant was removed. Feed for the reactor was a combination of primary effluent collected from the discharge of Facility A’s primary clarifier plus varying test volumetric loadings of WWW. Simulated secondary effluent samples were collected by removing a 200 mL aliquot of mixed liquor from the reactor and allowing it to settle for 10 min in a glass beaker. The supernatant was removed for further analysis, and the remaining beaker contents were returned to the reactor.
For multi-day tests, the reactors were fed every 12 h. After 11.5 h of aerated reaction time, aeration was suspended and the reactor contents were allowed to settle for 20 min. Samples of simulated secondary effluent were collected from the supernatant layer. Additional supernatant was removed as needed, and the reactor was fed with an equivalent volume of feed mixture. Aeration was resumed at the 12 h mark.
2.5. Analytical Methods
A handheld 2100P Turbidimeter (HACH, London, ON, Canada) was used to measure turbidity, while ultra-violet transmittance (UVT) was measured using a P200 Portable UVT Analyzer with quartz sample cell (RealTech Inc., London, ON, Canada). A portable HQ30d Meter equipped with an LDO101 optical DO probe and PHC101 pH electrode (HACH, Canada) was used to measure in situ reactor DO, temperature and pH, and instantaneous DO concentrations during OUR tests.
The 5-day biochemical oxygen demand (BOD5), total suspended solids (TSS), and volatile suspended solids (VSS) were analyzed as per APHA [14] Section 5210 B and Section 2540 as appropriate. Chemical oxygen demand (COD) analyses followed Hach Method 8000. Total organic carbon (TOC) was analyzed using a Shimazdu TOC-500A. Total ammonia nitrogen (TAN), total Kjeldahl nitrogen (TKN), and total phosphorous (TP) were analyzed using a Skalar SAN Plus 3000/5000 Segmented Flow Analyzer following methods 155–324 w/r, 155–324 w/r, and 503–324 w/r, respectively. Further, 0.45 Micron glass Whatman filter papers were used for sample filtering.
Microscopic analyses were conducted on live, unstained mixed liquor samples using a Leica optical microscope. Sludge volume index (SVI) was measured using unstirred settleometers (1.4 L capacity) with a 30 min settling time. Respirometry was conducted using a BODTrak™ II apparatus (Hach Canada) while the temperature was held at 20 ± 1 °C for the duration of the incubation period.
2.6. Determination of Kinetic Model Parameter Values
Kinetic model parameter values were determined by minimizing the mean squared error of the model fitted to the experimental data using the built-in Microsoft Excel (Version 1909) solver function. Biomass yield in an activated sludge system has a relationship with the substrate consumption as follows [12]:
where X is biomass concentration (g VSS/L), μ is specific growth rate (h−1), Y is biomass yield (g VSS/mg substrate), and S is substrate concentration (mg/L). Rearranging Equation (4):
where is the specific rate of substrate consumption (mg substrate/g VSS·h). Given Equations (4) and (5) and the Monod/Michaelis–Menten kinetic behavior of the system, the aerobic biological oxidation of WWW under non-inhibitory conditions can be described as follows:
where μmax is the maximum specific growth rate (h−1), is the maximum specific rate of substrate consumption (mg substrate/g VSS·h), and Ks is the half saturation constant (mg substrate/L).
Several empirical models have been developed to quantify the impact of pH inhibition on microbial growth of the general form:
where μmax,I is the inhibited maximum specific growth rate (h−1). Given the proportionality between μmax and (Equation (5)), this can be rewritten as follows:
where is the inhibited maximum specific rate of substrate consumption (mg substrate/g VSS·h). As shown in Table 2, four empirical models were assessed as part of this study, namely, the University of Cape Town (UCT), United States Environmental Protection Agency (USEPA), the Cpt or “pseudo toxic concentration” [15], and a relationship developed by Tyagi et al. [16]. Each of these relationships has two constants: C, a unitless variable, and pHref, the pH at which inhibition effects are first predicted. Due to the nature of the relationships, the UCT, USEPA, and Tyagi models resulted in > for pH > pHref, which is inconsistent with the behavior of the system; therefore, it was assumed that the = at all pH > pHref for these models.
Table 2.
Empirical models quantifying the impact of pH inhibition in activated sludge systems evaluated.
3. Results and Discussion
3.1. Winery Wastewater Quality and Respirometric Assessment
In general, all WWW samples were low in pH and high in strength, with a large fraction of the BOD5 in soluble form, ranging from 75 to 95%. The WWW sample from co-treatment Trial 2, as shown in Table 1, was selected for respirometric assessment as its characteristics were typical of WWW co-treated in the Niagara Region during the vintage season [19]. The WWW was diluted by a factor of 19.6 and seeded with 20 mL of mixed liquor from Facility A, and the measured BOD was adjusted to represent the oxygen demand associated with undiluted WWW (Figure 1). Rapid oxygen demand was measured during the first 24 h (approximately 39,000 mg/L) with a slower rate of oxidation over the remaining 4 days (approximately 19,500 mg/L), a trend observed with other WWW samples (results not shown). It could be concluded that there was a large fraction of readily biodegradable constituents in the WWW with a small fraction of more slowly biodegradable content. The readily biodegradable fraction likely mainly consists of sugars, which constitute a large fraction of the grape juice (20% v/v) found in WWWs [20], and which has been found in concentrations of up to 13 g sugars/L in WWWs [3]. Despite this, the low BOD5:COD ratios (ranging from 0.22 to 0.56) indicate that the WWW is generally poorly biodegradable, which is consistent with findings elsewhere [19,21].
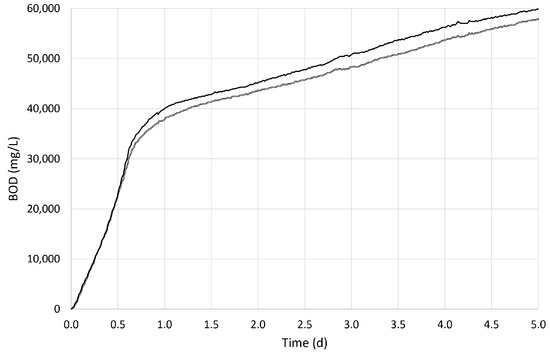
Figure 1.
Oxygen demand curve for the aerobic biodegradation via respirometry using mixed liquor from Facility A as the seed culture and WWW from co-treatment Trial No. 2 as the substrate (duplicate analyses shown).
Due to the nature and limitations associated with the respirometric method, dilution of the WWW was necessary, as well as the addition of a nutrient buffer solution to stabilize pH and provide excess nutrients to the biomass. Therefore, these results represent aerobic biodegradation under idealized conditions and cannot be used to assess the impact or effectiveness of WWW co-treatment at municipal WWTPs, which can be subject to shock-loadings, limited reaction times, and nutrient and oxygen transfer limitations.
3.2. Aerobic Biodegradation Kinetics
Although the biodegradation kinetics of WWW by acclimated aerobic mixed liquor from a municipal WWTP have been reported in the open literature [22], in which, the kinetic behavior was assessed against measured supernatant COD concentrations. This approach cannot take into account the impact of the adsorption of the particulate and the absorption of readily biodegradable COD fractions on the observed removal rates, which is a limitation acknowledged by the authors. In contrast, SOUR is a direct quantification of the rate of aerobic biodegradation, making this a more effective measure of biological oxidation rates; as a result, it was used for the basis of the following analyses.
3.2.1. Influence of pH on Biodegradation Rates
The inhibition of microbial activity in the biomass from all facilities, resulting in a decrease in SOUR, was observed by increasing the WWW concentrations (Figure 2). The maximum observed SOUR varied significantly between ML samples (from 51.4 mg O2/g MLVSS/h for Facility A to 14.0 mg O2/g MLVSS/h for Facility C), and the inhibitory effects were most pronounced at Facilities A and B, which also had the highest observed maximum SOUR values. Inhibition was observed at low volumetric loadings of WWW (0.1% to 0.5%, v/v) for all mixed liquor samples, ultimately resulting in similar SOUR values at a WWW hydraulic loading of 2.0% (ranging from 10.9 to 14.0 mg O2/g MLVSS/h).
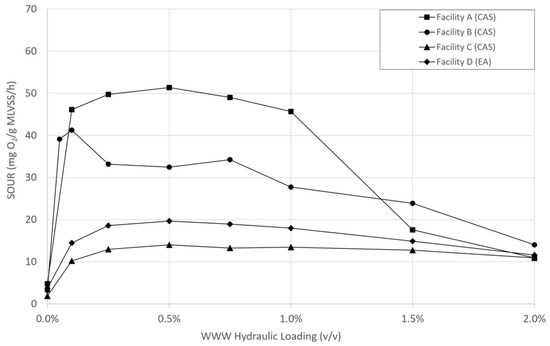
Figure 2.
Impact of the addition of WWW at hydraulic loadings from 0 to 2.0% v/v on SOUR (adjusted to 15 °C) of mixed liquor samples from four municipal WWTPs.
Due to the high initial MLVSS concentration (4068 mg/L) and rapid decrease in DO concentrations during the OUR tests, it was necessary to dilute mixed liquor from Facility B to ensure that a minimum 1.5 mg DO/L remained at the end of the OUR tests. Dilution to an MLVSS concentration of 1017 mg/L was accomplished using either a secondary effluent or distilled water, resulting in differences in the buffering capacity of the mixtures. From these runs, it was determined that pH was the main factor inhibiting microbial activity. Furthermore, inhibition could be eliminated by adjusting the WWW pH to 8.0 prior to its addition to the mixed liquor at all volumetric loadings tested (up to 5.0% v/v, equivalent to CODo of 10,050 mg/L). Using pH-adjusted WWW, the behavior of the biodegradation of WWW for all mixed liquor samples was consistent with the Monod/Michaelis–Menten relationship [23].
3.2.2. Kinetic Model Selection and Parameter Estimates
The observed SOUR (mg O2/g MLVSS·h) during OUR testing is equivalent to the specific rate of substrate consumption, (mg COD/g MLVSS·h). To eliminate the oxygen demands associated with endogenous respiration, all the observed SOUR values were adjusted by subtracting the measured SOUR in the absence of WWW. Experimental runs using WWW with pH adjusted to 8.0 were used to determine the Michaelis–Menten parameter values, and Ks (Equation (4)). The parameter values describing pH inhibition (C and pHref, in Equations (10)–(13)) were determined using experimental runs without pH-adjusted WWW. For Facility B, two experimental runs were used for the calibration of C and pHref:, namely, those diluted with a secondary effluent and distilled water. Data were not available for SOUR associated with the addition of pH-adjusted WWW for Facility C; therefore, the Michaelis–Menten parameter values were developed using the UCT model relationship (see discussion below). The results are presented in Table 3 and Figure 3.
Table 3.
Key operating conditions, kinetic model parameter estimates (corrected to 15 °C), and mean squared error associated with the aerobic biological oxidation of WWW by activated sludge from four municipal WWTPs.
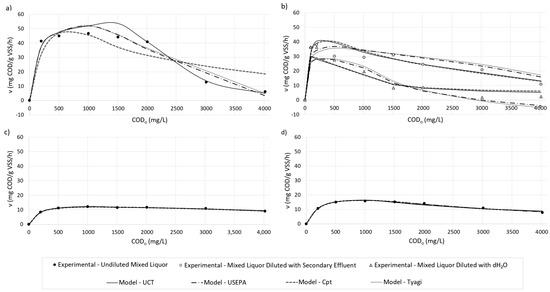
Figure 3.
Comparison of experimental and model predicted specific rate of substrate consumption corrected to 15 °C based on Michaelis–Menten kinetics with empirical pH-inhibition relationships using mixed liquor from (a) Facility A, (b) Facility B, (c) Facility C, and (d) Facility D.
3.2.3. Influence of Aerobic Biomass Source on Biodegradation Rates
The aerobic oxidation of WWW by a heterotrophic biomass from all four municipal WWTPs followed Michaelis–Menten kinetics with pH inhibition. From the experimental data, it could be concluded that inhibition was observed at similar pH values (ranging from 7.1 to 7.5) regardless of the biomass source (Table 3). On the other hand, varied significantly from facility to facility (Table 3). Three key WWTP operating strategy and parameter values were considered for their potential impact on , namely: exposure to WWW prior to testing, biomass age (solids retention time (SRT)), and operating mode (CAS vs. EA). The operating data provided by the Niagara Region for the two months prior to testing, including operating mixed liquor suspended solids (MLSS) concentrations, waste activated sludge (WAS) suspended solids, and WAS volumetric flow rates were used to determine operating SRT. These key operating parameters are presented in Table 3. The biomass from Facilities A and B, which were exposed to WWW as part of standard operating procedures during the two months prior to testing, had the highest recorded (57.3 and 56.8 mg COD/g VSS·h), while Facilities C and D, which had never been exposed to WWW, had significantly lower (14.5 and 20.7 mg COD/g VSS·h). It is possible that prior exposure to WWW significantly impacted the maximum biodegradation rates. The acclimation of activated sludge systems to the specific characteristics of industrial wastewaters is a well-known phenomenon [24]. Although the frequency of exposure to WWW differed between Facilities A and B, the calculated was similar for both mixed liquors. This suggests that acclimation may not require daily exposure to the WWW.
The presence (CAS Facilities A, B, and C) or absence (EA Facility D) of primary clarifiers appears to have little to no effect on . The value of for Facility B is much higher than that for Facility D, in spite of both systems operating at similar SRTs (10.7 d and 11.4 d, respectively). In addition, the values of for Facilities A and B are very close, in spite of Facility B operating at an SRT approximately twice that of Facility A (10.7 d and 5.9 d, respectively). This suggests that SRT is not a significant factor affecting the value ; however, additional studies are required to confirm this finding.
3.2.4. Evaluation of pH-Inhibition Model Accuracy and Fit
Values of C reported elsewhere for USEPA (0.833 for nitrifying bacteria [18] and Tyagi (−1.33 for sulfur-oxidizing bacteria present in activated sludge) [16] are consistent with those predicted for all the facilities (Table 3). However, the value of pHref calculated for Facility B using the USEPA model was inconsistent with the pH at which inhibition was observed experimentally, pHinhib,obs (Table 3).
The Cpt model predicted that the pHref values for all facilities were significantly higher than the pHinhib,obs. While the values of C determined for Facilities A, B, and D (0.908, 1.32, and 1.19, respectively) are consistent with those reported elsewhere (ranging from 0.784 to 1.194 for the activated sludge treatment of textile wastewater [15]), the value determined for Facility C (4.82) was not.
The pHref values calculated using UCT were consistent with pHinhib,obs for all facilities, and for Facilities B, C, and D, the values of C were consistent with values reported elsewhere (2.35 for nitrifying bacteria) [17].
All four models were in good agreement with the experimental data for Facilities C and D; the model fit was poorer for Facilities A and B. At volumetric loading rates of 2% v/v WWW, the pH of the mixed liquor decreased by up to 3.1 units, with the most significant pH differences observed for Facilities A and B. Due to the form of Equations (8) and (10), USEPA and Tyagi models result in negative predicted values of at low pH (Figure 3b), limiting the usefulness of these models over a wide pH range. Both the Cpt and UCT models are better able to predict performance over a wide range of pH due to their asymptotic nature (Table 2). The predicted values of by the Cpt and UCT models were consistent for Facility B (Figure 3b); however, the UCT model was able to best fit the experimental data for Facility A, particularly at high CODo levels (Figure 3a).
Given these results, it can be concluded that the combined Michaelis–Menten–UCT equation can be used to describe the biological oxidation of COD in WWW by heterotrophs in the activated sludge of municipal WWTPs, as shown in Equation (14):
The model fit was best for biomass that had no prior exposure to WWW. The exposure and acclimation to WWW modified the characteristics of the biomass in its ability to utilize the biodegradable fraction of the WWW, suggesting that the kinetic relationship is more complex than that described by Equation (14). In spite of this, the Michaelis–Menten–UCT relationship provides reasonable estimates of specific substrate consumption, even in an acclimated biomass.
3.3. Aerobic Biological Co-Treatment of Winery and Domestic Wastewaters
Three co-treatment trials were conducted using the mixed liquor from Facility A over the vintage periods of 2017 and 2018. In addition to WWW, the bench-scale bioreactors were fed with primary effluent collected on the day of testing at Facility A. Multiple bench-scale bioreactors were operated in parallel during each trial, varying only in the volumetric loading of WWW in the feed (trial runs). During each trial, one bioreactor was fed with primary effluent alone as a control for the observed treatment performance in the absence of WWW (control run). Trials 1 and 2 investigated the short-term impacts of co-treating WWW (reaction period of 6 h), while Trial 3 investigated the operational and performance impacts over a longer period (72 h). The details associated with each trial are presented in Table 4, while the concentrations of the key parameters in the WWW are summarized in Table 1.
Table 4.
Experimental conditions during co-treatment trials.
3.3.1. Operating Conditions and Effluent Quality
DO and pH were monitored regularly in each bench-scale bioreactor throughout each trial. Because the bioreactor pH remained at or above 7.5 for all runs (above the pHinhib,obs of 7.1 to 7.4 for Facility A’s mixed liquor, Table 3), the pH inhibition was not a factor during the co-treatment trials. It can be concluded that the buffering capacity of the mixed liquor and primary effluent was sufficient to maintain a stable pH at the WWW volumetric loadings tested. Despite this, the bioreactor pH should be monitored during full-scale co-treatment since a low pH can significantly reduce the biological oxidation rates (Section 3.3) and insufficient alkalinity can impact the ability of a WWTP to nitrify [12].
Air feed rates were equivalent to an aeration rate of 0.63 L/s per m2 of the bioreactor surface area, which is consistent with the minimum design guideline rate of 0.61 L/m2·s for fine-bubble aeration systems [25]. The measured DO concentrations decreased in all bench-scale bioreactors at the outset of each trial, returning to values above 2.0 mg/L for all Trial 1 and 2 runs within 5 min. During the first feed cycle of Trial 3, the DO concentrations remained below 2.0 mg/L for the first 0.5 h for the control and 0.1% v/v WWW runs, and for the first 3 h for the 1.0% v/v WWW run; during subsequent feed cycles, the DO concentration was only observed to drop below 2.0 mg/L for the bioreactor fed with the 1.0% v/v WWW mixture and only during the first hour after addition. Therefore, the co-treatment trials operated under oxygen limited conditions (<2.0 mg/L) only transiently.
The initial feed (0 h) and simulated secondary effluent COD, TOC, and BOD5 concentrations over the first 6 h of the reaction for all trials are shown in Figure 4. Simulated secondary effluent quality at 6 h of reaction time was consistent regardless of the WWW addition rates up to initial feed concentrations of 1550 mg/L, 374 mg/L, and 774 mg/L for COD, TOC, and BOD5, respectively. The overall observed removal rates at 6 h of reaction time were as high as 89% COD, 84% TOC, and 83% BOD5 for runs fed with primary effluent only, and up to 98%, 97%, and 99% for runs fed with a mixture of primary effluent and WWW. Given the low BOD5:COD ratios of the WWW, it can be concluded that the high rates of COD removal are due to sorption with the biological floc rather than biological oxidation. In spite of these high removal rates, elevated secondary effluent concentrations were still observed at high initial organic loading conditions, as illustrated in Figure 4. Because municipal WWTPs in Ontario and other North American jurisdictions are required to meet effluent concentration limits as part of their approval permits, periods of high loadings could result in effluent non-compliance. Equalization to control the addition of WWW to the liquid treatment train, and to avoid slug loads, could be an effective method to improve the co-treatment performance.
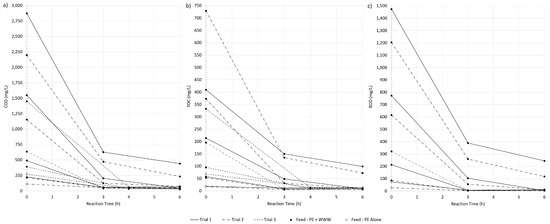
Figure 4.
Initial feed and simulated secondary effluent concentrations during the first 6 h of aerobic co-treatment of primary effluent and WWW by activated sludge from Facility A in terms of (a) COD, (b) TOC, and (c) BOD5.
Periods of poor sludge settleability and pin floc as well as poor UV disinfection performance were reported by the Niagara Region staff at co-treating WWTPs. It was hypothesized that the fine and poorly settling particulate solids fraction of the WWW may have contributed to poor sludge settleability and elevated effluent TSS concentrations, and that the complex and often refractory aromatic compounds in the WWW may remain in the treated effluent, resulting in a decrease in the secondary effluent UVT. The trial results suggest that WWW had little to no impact on the simulated secondary effluent turbidity or UVT, as depicted in Figure 5, and may, conversely, improve the quality of the treated supernatant. After 6 h for all trials, runs fed with WWW had lower supernatant turbidity than the control run, with the exception of the 2.0% v/v WWW run from Trial 2 (initial feed COD and TSS concentrations of 5300 mg/L and 776 mg/L, respectively). During Trial 2, improved supernatant quality was observed after 5 h for all runs fed with WWW as compared to the control run (Figure 5a). During Trial 3, consistent supernatant turbidity and UVT were observed for all three runs (0% v/v, 0.1% v/v, and 1.0% v/v) over the entire 72 h testing period. It can be concluded that the poorly settling solids and aromatic compounds present in the WWW did not increase the turbidity or decrease UVT during the co-treatment trials, suggesting that other mechanisms are responsible for these negative impacts on effluent quality in full-scale WWTPs during the co-treatment of WWW.
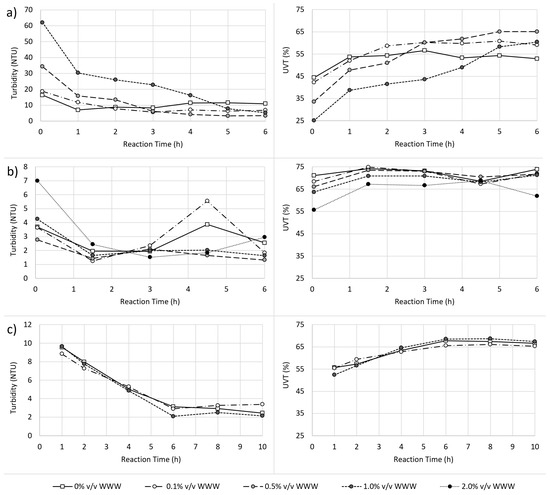
Figure 5.
Bench-scale aerobic bioreactor supernatant turbidity and UVT vs. time at various initial hydraulic feed loadings of WWW for (a) Trial 1, (b) Trial 2, and (c) Trial 3.
3.3.2. Changes in Mixed Liquor Characteristics and Solids Yield
The microscopic characteristics of the solids in the WWW are presented in Figure 6, along with a microscopic analysis of the mixed liquor from Trial 3 after 56 h of reaction time. Generally, the solids in the WWW are fine and dispersed, ranging in size from 3 to 7 μm, although some larger flocs of agglomerated solids and pieces of grape skin with dimensions of up to approximately 80 μm were also observed, as illustrated in Figure 6a. The mixed liquor floc from the control run, which was fed with primary effluent alone (Figure 6b), was smaller and less dense than that from the run fed a mixture of WWW and the primary effluent (Figure 6c). Given the clarity of the supernatant, as observed microscopically and measured by turbidity levels (Figure 5), and the microscopic composition of the floc in Figure 6c, it is clear that the solids present in the WWW are readily incorporated into the activated sludge floc structure.
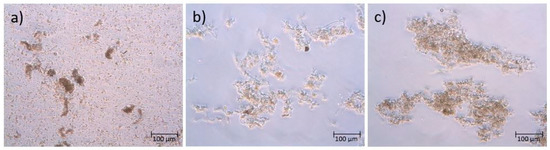
Figure 6.
Wet-mount optical microscopic analysis of (a) winery wastewater, and mixed liquor taken from bench-scale bioreactors during Trial 3 after (b) 53 h of reaction time and five feed cycles of primary effluent alone, and (c) 53 h of reaction time and four feed cycles of 1.0% v/v WWW in primary effluent and one cycle of primary effluent alone.
Furthermore, the incorporation of these solids did not impact the SVI of the mixed liquor in Trials 1 or 3, and it appears to improve settleability at overall WWW solids loadings of 75 mg/L or more; however, a negative impact on SVI was observed during Trial 2, as shown in Figure 7.
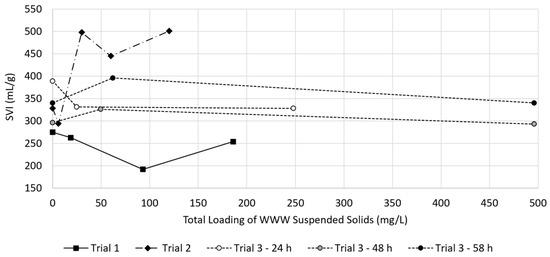
Figure 7.
Measured SVI of mixed liquor samples during the co-treatment trials at various overall WWW solids loadings.
The settling characteristics of the WWW used during Trial 2 differed from that used in Trials 1 and 3 (Table 4). While the source of the floating solids could not be identified, their presence likely contributed to the increase in SVI during Trial 2. The co-treatment of WWW with floating solids in the liquid treatment train should be avoided; where possible, these WWWs should be co-treated in the WWTP’s anaerobic digester to avoid poor sludge settleability in the liquid treatment train.
In the absence of floating solids, the incorporation of the WWW’s fine solids into the biological floc combined with the nature of the settleable solids in the WWW maintained the sludge settling characteristics (Figure 7). It is likely that the presence of fining materials, which are added to clarify wine prior to bottling [26], helps to maintain the settling properties of the mixed liquor during co-treatment.
The co-treatment of WWW significantly and rapidly increases the operating MLSS concentrations (Table 5). During Trial 3, the addition of 1.0% v/v WWW feed caused the MLSS concentration to increase by 790 mg/L at 60 h of reaction time, compared with 250 mg/L with the addition of 0.1% v/v WWW feed and 130 mg/L in the control bioreactor. The increase in MLSS concentrations for all runs consisted almost exclusively of VSS, which is consistent with the high VSS:TSS ratio in the WWW and primary effluent, and anticipated biomass generation due to biological oxidation.
Table 5.
Observed mixed liquor solids concentrations, solids mass balance, and observed yield during co-treatment trial 3.
Compared to the control run, the observed VSS yield almost doubled with the addition of 1.0% v/v WWW. MLVSS is typically used as a proxy to estimate the concentration of active biomass in the system; however, based on the microscopic analysis of mixed liquor characteristics, it can be concluded that the majority of the increase in the observed yield was due to the incorporation of WWW solids into the floc structure. Therefore, MLVSS concentrations may not provide a representative estimate of the biomass in the co-treating activated sludge system.
The mixed liquor color is also used as a visual indication of biomass health. Visual observations during the co-treatment trials indicate that the bioreactor contents turn dark brown to black at progressively higher WWW loadings. Similar color changes were observed in WWW samples as the pH was increased above approximately 6.5. Dark or black mixed liquor is typically associated with septic or otherwise impaired conditions in the activated sludge; however, color should not be used as a diagnostic criterion during WWW co-treatment. The biomass condition and health should instead be monitored via microscopic analysis.
An increase in WAS rates would be needed during co-treatment to maintain consistent operating MLSS concentrations, which would decrease the operating SRT. To maintain a target SRT, co-treating WWTPs need to be designed to accommodate not only the additional oxygen demands associated with WWW’s organic loadings, but also additional solids inventory during the co-treatment period. This could be accomplished by oversizing bioreactors and/or providing additional secondary clarification capacity to operate at elevated MLSS concentrations.
Due to the generally good settling characteristics of WWW solids, adding this waste upstream of WWTP’s primary clarifiers would reduce solid loading on the downstream bioreactors, reducing the observed yield. However, due to the large fraction of soluble BOD5 in the WWW (Table 1), this approach would do little to reduce the oxygen demands in the downstream bioreactors. High solids and organic loadings to the primary clarifiers can promote the generation of septic conditions that result in rising sludge and poor removal rates across primary treatment [27], which are consistent with issues reported by Niagara Region staff at their co-treating municipal WWTPs.
Ultimately, the results of this study were used as the basis for the development of a novel biological pre-treatment system to improve the co-treatment of high-strength wastewaters, including WWW, at municipal WWTPs [28].
4. Conclusions
A combined Michaelis–Menten–UCT kinetic model was found to best describe the pH-inhibited biological oxidation of WWW by heterotrophs in the mixed liquors from four municipal WWTPs. The maximum specific rate of the COD consumption was found to be substantially higher in facilities that had been exposed to WWW during normal operating conditions, suggesting the acclimation of the biomass. Despite this, mixed liquors that had never been exposed to WWW were able to oxidize the biodegradable components of the WWW. In all cases, inhibition was observed at similar pH values (ranging from 7.1 to 7.5), regardless of the biomass source. Adjusting the pH of the WWW prior to its addition to the mixed liquor eliminated its inhibitory effects.
Bench-scale bioreactors seeded with activated sludge from a non-nitrifying CAS municipal WWTP were used to investigate the performance and process impacts of co-treating WWW. The rapid removal of COD, TOC, and BOD5 was observed, with removal rates up to 98%, 97%, and 99%, respectively, at 6 h. Absorption into and adsorption onto the biological floc were determined to be key removal mechanisms. Furthermore, it was determined that the WWW solids are quickly incorporated into the biological floc (within 6 h). While these solids may improve sludge settleability, particularly at loadings of more than 75 mg WWW suspended solids/L of bioreactor volume, their presence significantly increases the observed VSS yield. Finally, poorly settling solids and aromatic compounds that were present in the WWW did not increase the simulated secondary effluent turbidity or decrease UVT during the co-treatment trials, suggesting that other mechanisms are responsible for the negative impacts on effluent solids and UV disinfection system performance observed during full-scale co-treatment.
Overall, it can be concluded that the aerobic-activated sludge system at municipal WWTPs can effectively co-treat WWW at initial combined bioreactor feed COD concentrations of up to 1550 mg/L. However, co-treating WWTPs should be designed to accommodate the significant seasonal organic loadings associated with WWW, including additional oxygenation capacity, bioreactor volume, and/or secondary clarification capacity. Other measures that can be implemented include equalizing the addition of WWW to avoid slug loads in the liquid treatment train, ensuring adequate bioreactor pH control is available, and modifying protocols for monitoring biomass inventory and health.
Author Contributions
Investigation, M.B.J.; Supervision, M.M. The manuscript was written through contributions from all authors. All authors have read and agreed to the published version of the manuscript.
Funding
Funding was provided by the Natural Sciences and Engineering Research Council of Canada (NSERC), the Region of Niagara, and the Toronto Metropolitan University Faculty of Engineering and Architectural Science Dean’s Research Fund.
Institutional Review Board Statement
Not applicable.
Informed Consent Statement
Not applicable.
Data Availability Statement
Data are contained within the article.
Acknowledgments
We thank the Region of Niagara (Canada) for providing access to their equipment and facilities to support this study. The financial support of the Natural Sciences and Engineering Research Council of Canada (NSERC), the Region of Niagara, and the Toronto Metropolitan University Faculty of Engineering and Architectural Science Dean’s Research Fund is greatly appreciated.
Conflicts of Interest
The authors declare no conflict of interest.
Abbreviations
| APHA | American Public Health Association |
| BOD | biochemical oxygen demand |
| BOD5 | 5-day biochemical oxygen demand |
| CAS | conventional activated sludge |
| COD | chemical oxygen demand |
| Cpt | pseudo-toxic concentration |
| DO | dissolved oxygen |
| EA | extended aeration |
| MLSS | mixed liquor suspended solids |
| MLVSS | mixed liquor volatile suspended solids |
| MOE | Ministry of the Environment |
| SRT | solids retention time (d) |
| SVI | sludge volume index (mL/g) |
| TAN | total ammonia nitrogen |
| TKN | total Kjeldahl nitrogen |
| TOC | total organic carbon |
| TP | total phosphorus |
| TSS | total suspended solids |
| UCT | University of Cape Town |
| USEPA | United States Environmental Protection Agency |
| UVT | ultra-violet transmittance |
| VSS | volatile suspended solids |
| WAS | waste activated sludge |
| WEAO | Water Environment Association of Ontario |
| WWTP | wastewater treatment plant |
| WWW | winery wastewater |
| Symbols | |
| θ | Arrhenius temperature correction factor |
| μ | specific growth rate (h−1) |
| C | unitless variable |
| dissolved oxygen concentration (mg/L) | |
| Ks | half saturation constant (mg substrate/L) |
| OUR | oxygen uptake rate (mg O2/L·h) |
| pHref | pH at which inhibition effects first predicted |
| S | substrate concentration (mg/L) |
| SOUR | specific oxygen uptake rate (mg O2/g MLVSS·h) |
| t | time (h) |
| specific rate of substrate consumption (mg substrate/g VSS·h) | |
| X | biomass concentration (g VSS/L) |
| Y | biomass yield (g VSS/mg substrate or mg VSS/mg substrate) |
| Subscripts | |
| f | filtered |
| I | inhibited |
| max | maximum |
| o | initial value |
| T | temperature (°C) |
References
- Johnson, M.B.; Mehrvar, M. From Field to Bottle: Water Footprint Estimation in the Winery Industry. In Water Footprint; Muthu, S., Ed.; Springer Nature: Singapore, 2021; pp. 103–136. [Google Scholar] [CrossRef]
- Flores, L.; Garcia, J.; Pena, R.; Garfi, M. Constructed wetlands for winery wastewater treatment: A comparative Life Cycle Assessment. Sci. Total Environ. 2019, 659, 1567–1576. [Google Scholar] [CrossRef] [PubMed]
- Masi, F.; Rochereau, J.; Troesch, S.; Ruiz, I.; Soto, M. Wineries wastewater treatment by constructed wetlands: A review. Water Sci. Technol. 2015, 71, 1113–1127. [Google Scholar] [CrossRef] [PubMed]
- Mosse, K.P.M.; Patti, A.F.; Christen, E.W.; Cavagnaro, T.R. Review: Winery wastewater quality and treatment options in Australia. Aust. J. Grape Wine Res. 2011, 17, 111–122. [Google Scholar] [CrossRef]
- Bolzonella, D.; Papa, M.; Da Ros, C.; Muthukumar, L.A.; Rosso, D. Winery wastewater treatment: A critical overview of advanced biological processes. Crit. Rev. Biotechnol. 2019, 39, 489–507. [Google Scholar] [CrossRef] [PubMed]
- Lofrano, G.; Meric, S. A comprehensive approach to winery wastewater treatment: A review of the state-of-the-art. Desalin. Water Treat. 2016, 57, 3011–3028. [Google Scholar] [CrossRef]
- Johnson, M.B.; Mehrvar, M. An assessment of the grey water footprint of winery wastewater in the Niagara Region of Ontario, Canada. J. Clean. Prod. 2019, 214, 623–632. [Google Scholar] [CrossRef]
- Johnson, M.B.; Mehrvar, M. Winery wastewater management and treatment in the Niagara Region of Ontario, Canada: A review and analysis of current regional practices and treatment performance. Can. J. Chem. Eng. 2020, 98, 5–24. [Google Scholar] [CrossRef]
- Bolzonella, D.; Zanette, M.; Battistoni, P.; Cecchi, F. Treatment of winery wastewater in a conventional municipal activated sludge process: Five years of experience. Water Sci. Technol. 2007, 56, 79–87. [Google Scholar] [CrossRef] [PubMed]
- Beck, C.; Prades, G.; Sadowski, A.-G. Activated sludge wastewater treatment plants optimisation to face pollution overloads during grape harvest periods. Water Sci. Technol. 2005, 51, 81–88. [Google Scholar] [CrossRef] [PubMed]
- Vallier, K. “The Futre of Ontario’s Wine Industry,” The Niagara Independent, 8 March 2019. Available online: https://niagaraindependent.ca/the-future-of-ontarios-wine-industry/ (accessed on 24 January 2020).
- Metcalf and Eddy. Wastewater Engineering: Treatment and Resource Recovery, 5th ed.; McGraw-Hill: New York, NY, USA, 2014; ISBN 978-0-07-340118-8. [Google Scholar]
- Friedrich, M.; Takacs, I. A new interpretation of endogenous respiration profiles for the evaluation of the endogenous decay rate of heterotrophic biomass in activated sludge. Water Res. 2013, 47, 5639–5646. [Google Scholar] [CrossRef] [PubMed]
- APHA (American Public Health Association). Standard Methods for the Examination of Water and Wastewater, 22nd ed.; APHA: Washington, DC, USA, 2012; ISBN 0875530133. [Google Scholar]
- Ko, J.H.; Choi, K.S.; Woo, H.J.; Lee, H.I.; Kim, C.W. Evaluation of pH inhibition effect on activated sludge by the pseudo toxic concentration (CPT) concept model. Water Sci. Technol. 2001, 43, 65–72. [Google Scholar] [CrossRef] [PubMed]
- Tyagi, R.D.; Sreekrishnan, T.R.; Campbell, P.G.C.; Blais, J.F. Kinetics of heavy metal bioleaching from sewage sludge—II. Mathematical model. Water Res. 1993, 27, 1653–1661. [Google Scholar] [CrossRef]
- UCT (University of Capetown). Theory, Design and Operation of Nutrient Removal Activated Sludge Process; Water Research Commission, WRC Report No. TT16/84; UCT: Pretoria, South Africa, 1984. [Google Scholar]
- USEPA. Process Design Manual for Nitrogen Control; Document ED 162 870; USEPA: Walnut Creek, CA, USA, 1975. [Google Scholar]
- Johnson, M.B.; Mehrvar, M. Characterising winery wastewater composition to optimise treatment and reuse. Aust. J. Grape Wine Res. 2020, 26, 410–416. [Google Scholar] [CrossRef]
- Conradie, A.; Sigge, G.O.; Cloete, T.E. Influence of winemaking practices on the characteristics of winery wastewater and water usage of wineries. S. Afr. J. Enol. Vitic. 2013, 35, 10–19. [Google Scholar] [CrossRef]
- Bustamante, M.A.; Paredes, C.; Moral, R.; Moreno-Caselles, J.; Perez-Espinosa, A.; Perez-Murcia, M.D. Uses of winery and distillery effluents in agriculture: Characterisation of nutrient and hazardous components. Water Sci. Technol. 2005, 51, 145–151. [Google Scholar] [CrossRef] [PubMed]
- Silva, F.; Pirra, A.; Sousa, J.; Arroja, L.; Capela, I. Biodegradation kinetics of winery wastewater from port wine production. Chem. Biochem. Eng. Q. 2011, 25, 493–499. [Google Scholar]
- Reynolds, T.D.; Richards, P.A. Unit Operations and Processes in Environmental Engineering, 2nd ed.; Cengage Learning: Stamford, CT, USA, 1996; ISBN 978-0-534-94884-9. [Google Scholar]
- Eckenfelder, W.W.; Musterman, J.L. Activated Sludge Treatment of Industrial Wastewater; Technomic Publishing Company Inc.: Lancaster, PA, USA, 1995; ISBN 1-56676-302-9. [Google Scholar]
- Ministry of the Environment. Design Guidelines for Sewage Works. 2008. Available online: https://www.ontario.ca/document/design-guidelines-sewage-works-0 (accessed on 1 October 2018).
- Grainger, K.; Tattersall, H. Wine Production: Vine to Bottle; Blackwell Publishing Ltd.: Oxford, UK, 2005; ISBN 978-14051-1365-6. [Google Scholar]
- Water Environment Association of Ontario, Ministry of the Environment, Environment Canada. Optimization Guidance Manual for Sewage Works; Water Environment Association of Ontario: Mississauga, ON, Canada, 2010. [Google Scholar]
- Mehrvar, M.; Johnson, M.B. Method and System for Pre-Treating High Strength Wastewater. International Patent Application No. PCT/CA2022/050507 (WO 2022/204823), 4 April 2022. [Google Scholar]


Disclaimer/Publisher’s Note: The statements, opinions and data contained in all publications are solely those of the individual author(s) and contributor(s) and not of MDPI and/or the editor(s). MDPI and/or the editor(s) disclaim responsibility for any injury to people or property resulting from any ideas, methods, instructions or products referred to in the content. |
© 2023 by the authors. Licensee MDPI, Basel, Switzerland. This article is an open access article distributed under the terms and conditions of the Creative Commons Attribution (CC BY) license (https://creativecommons.org/licenses/by/4.0/).