
Comparative Study on Strategies for the Division of Earthquake-Proof Strengthening Segments to Reinforce the Reliability of Water Supply Systems

Abstract
:1. Introduction
2. Methods of Composing Strategic Earthquake-Proof Pipeline
2.1. Hydraulic Analysis Technique for Seismic Events
2.2. Method of Strategic Segment Division of Earthquake-Proof Strengthening of WSS
2.3. Evaluation of Costs of Earthquake-Proof Strengthening for Each Strategy
3. Reliability Evaluation of Earthquake Strategy
3.1. Subject Regions
3.2. Results of Segment Division According to Earthquake-Proof Strengthening Strategies
3.3. Application Results
3.3.1. Results of Water Supply Reliability (, System Serviceability)
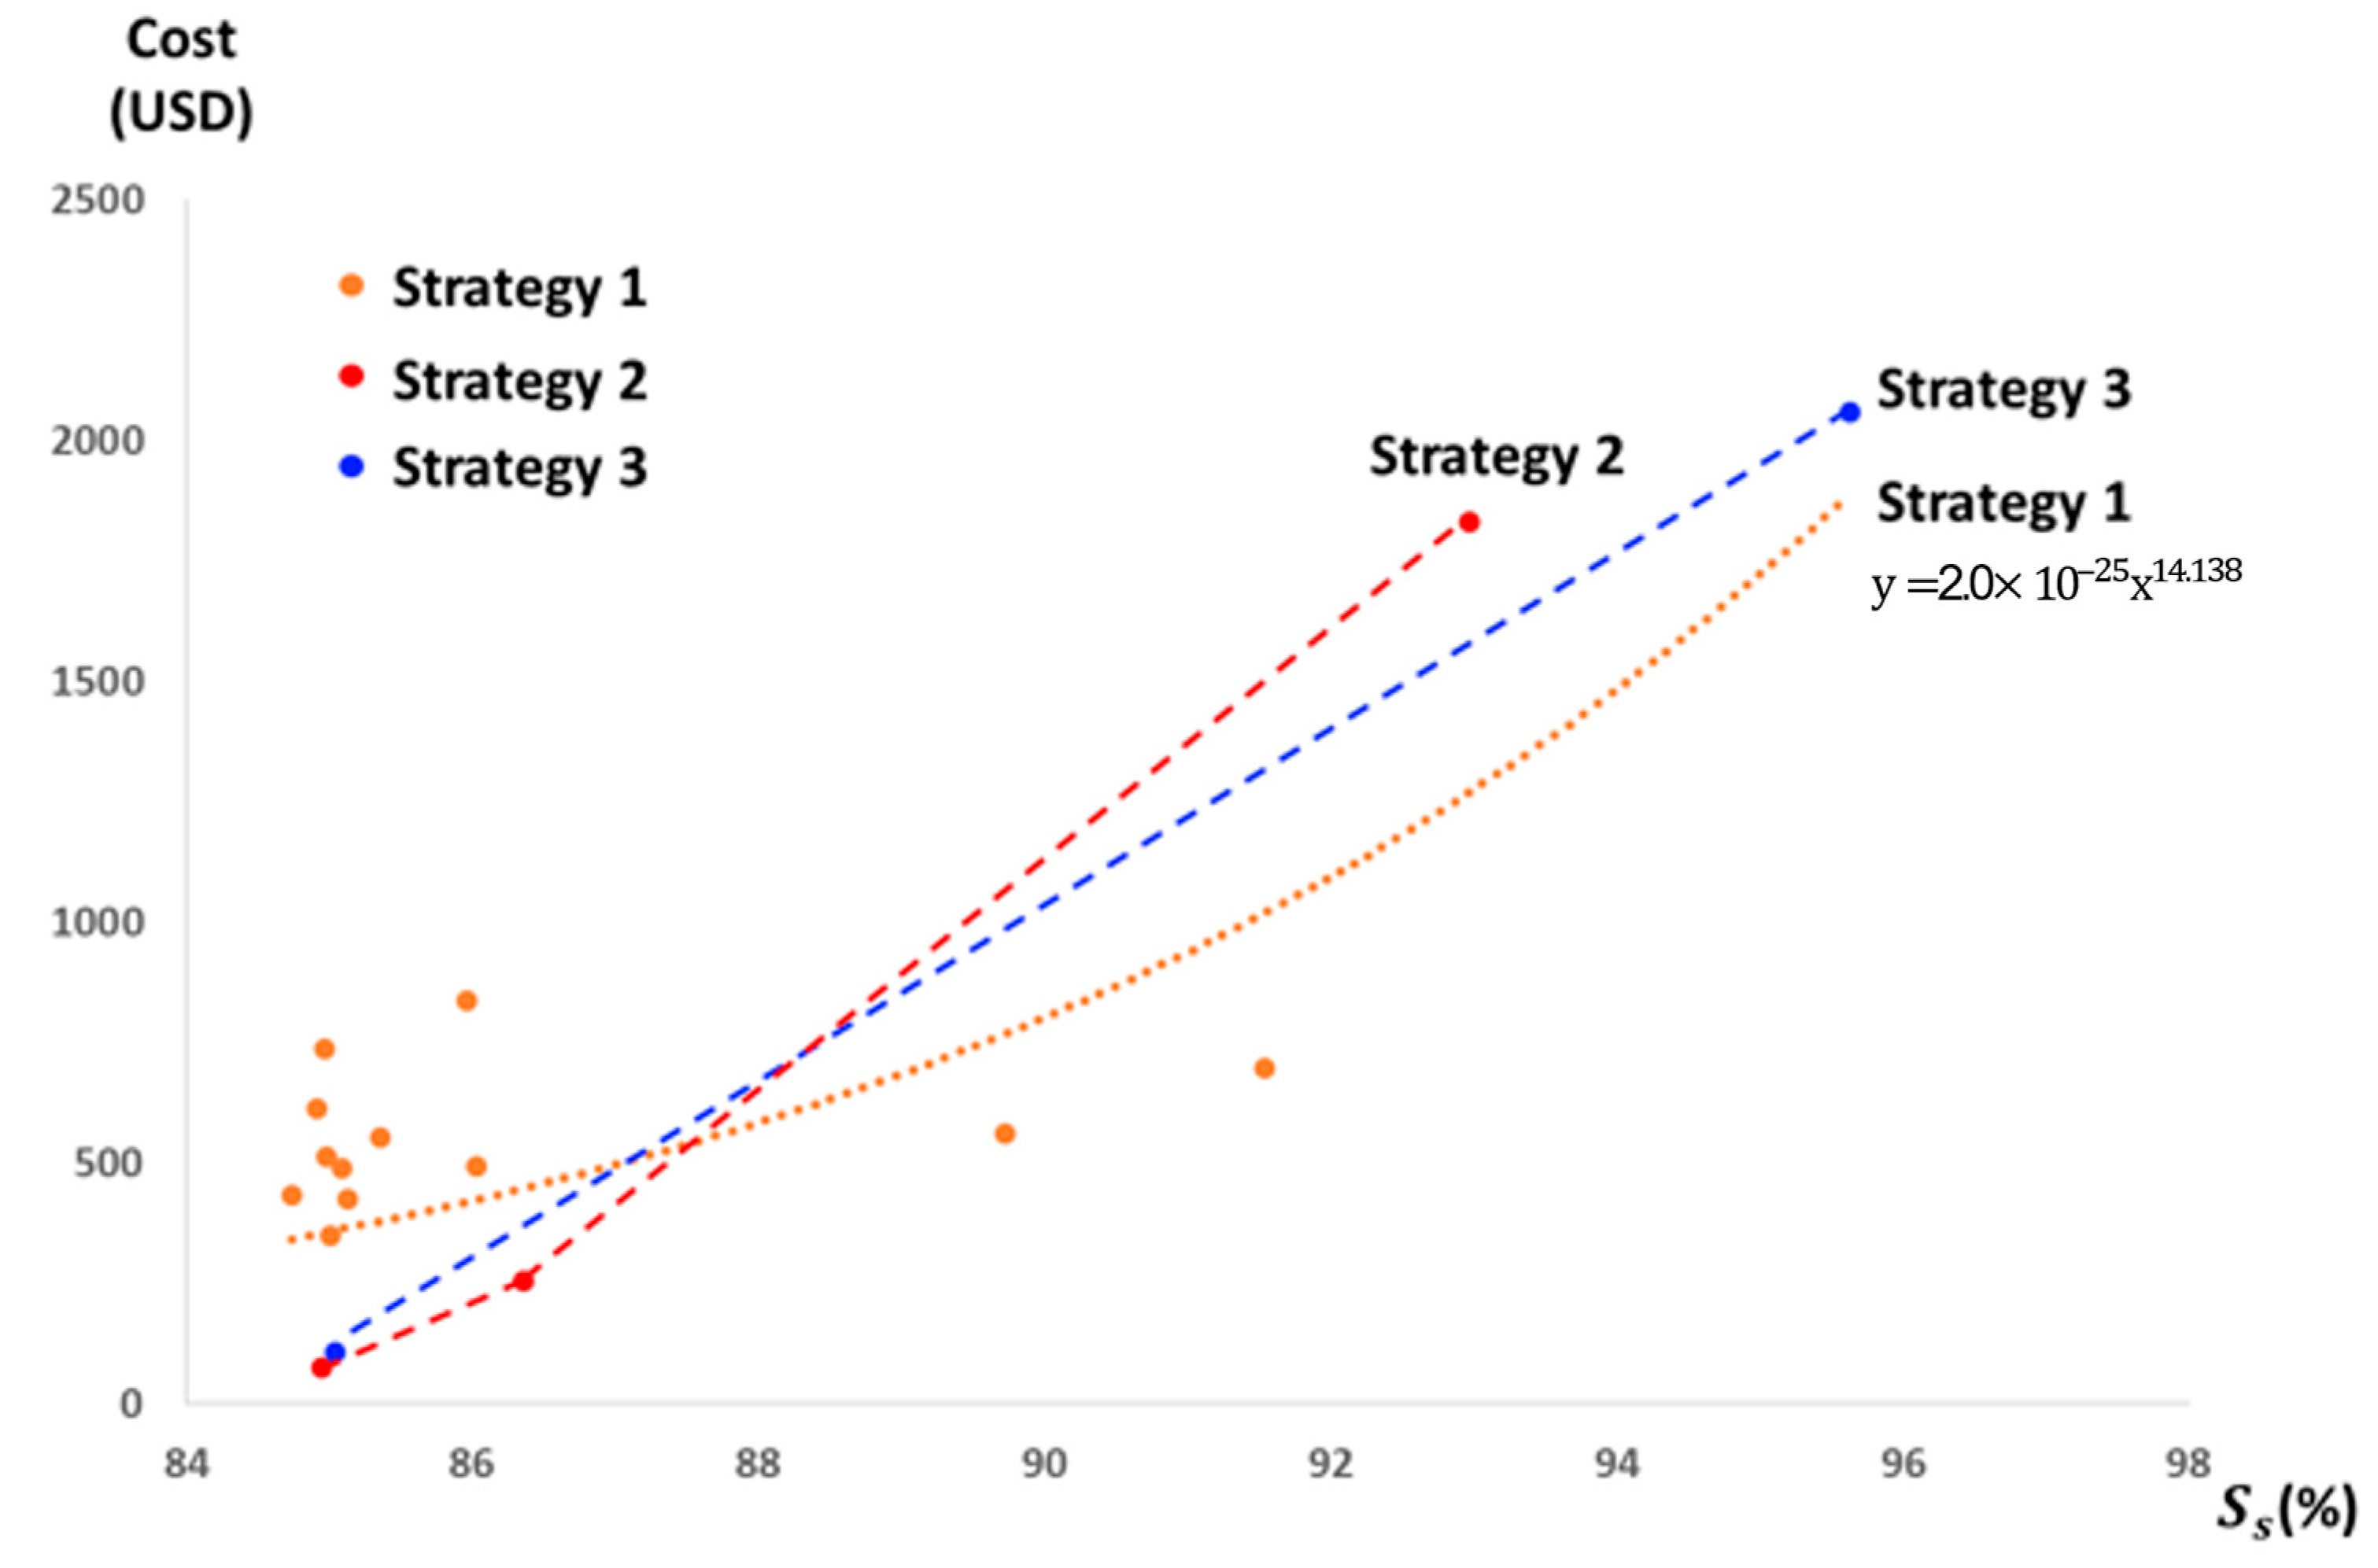
3.3.2. Results of Evaluation of Economic Value
3.4. Comprehensive Evaluation
4. Conclusions
Author Contributions
Funding
Institutional Review Board Statement
Informed Consent Statement
Data Availability Statement
Conflicts of Interest
References
- Valis, D.; Hasilová, K.; Forbelská, M.; Pietrucha-Urbanik, K. Modelling water distribution network failures and deterioration. In Proceedings of the 2017 IEEE International Conference on Industrial Engineering and Engineering Management (IEEM), Singapore, 10–13 December 2017; pp. 924–928. [Google Scholar]
- Pietrucha-Urbanik, K.; Studziński, A. Qualitative analysis of the failure risk of water pipes in terms of water supply safety. Eng. Fail. Anal. 2019, 95, 371–378. [Google Scholar] [CrossRef]
- Studziński, A.; Pietrucha-Urbanik, K. Failure risk analysis of water distributions systems using hydraulic models on real field data. Ekon. I Sr. 2019, 1, 152–165. [Google Scholar]
- Yoo, D.G.; Jung, D.; Kang, D.; Kim, J.H.; Lansey, K. Seismic Hazard Assessment Model for Urban Water Supply Networks. J. Water Resour. Plan. Manag. 2016, 142, 04015055. [Google Scholar] [CrossRef]
- Klise, K.A.; Bynum, M.; Moriarty, D.; Murray, R. A software framework for assessing the resilience of drinking water systems to disasters with an example earthquake case study. Environ. Model. Softw. 2017, 95, 420–431. [Google Scholar] [CrossRef] [PubMed]
- Davis, C.A. Seismic practices to improve water system resilience. In Proceedings of the 14th World Conference on Earthquake Engineering (14WCEE), Beijing, China, 12–17 October 2008; p. S21-015. [Google Scholar]
- Tabucchi, T.H.; Davidson, R.A. Post-earthquake Restoration of the Los Angeles Water Supply System; University at Buffalo: Buffalo, NY, USA, 2008. [Google Scholar]
- Luna, R.; Balakrishnan, N.; Dagli, C.H. Postearthquake recovery of a water distribution system: Discrete event simulation using colored petri nets. J. Infrastruct. Syst. 2010, 17, 25–34. [Google Scholar] [CrossRef]
- Ouyang, M.; Wang, Z. Resilience assessment of interdependent infrastructure systems: With a focus on joint restoration modeling and analysis. Reliab. Eng. Syst. Saf. 2015, 141, 74–82. [Google Scholar] [CrossRef]
- Zhang, Q.; Zheng, F.; Diao, K.; Ulanicki, B.; Huang, Y. Solving the battle of post-disaster response and restauration (BPDRR) problem with the aid of multi-phase optimization framework. In Proceedings of the First International Water Distribution System Analysis/Computing and Control in the Water Industry Joint Conference, Kingston, ON, Canada, 23–25 July 2018. [Google Scholar]
- Choi, J.; Yoo, D.G.; Kang, D. Post-earthquake restoration simulation model for water supply networks. Sustainability 2018, 10, 3618. [Google Scholar] [CrossRef]
- Han, Z.; Ma, D.; Hou, B.; Wang, W. Seismic resilience enhancement of urban water distribution system using restoration priority of pipeline damages. Sustainability 2020, 12, 914. [Google Scholar] [CrossRef]
- Song, Z.; Liu, W.; Shu, S. Resilience-based post-earthquake recovery optimization of water distribution networks. Int. J. Disaster Risk Reduct. 2022, 74, 102934. [Google Scholar] [CrossRef]
- Kuwata, Y.; Takada, S. Seismic risk assessment and upgrade strategy of hospital-lifeline performance. In Advancing Mitigation Technologies and Disaster Response for Lifeline Systems; American Society of Civil Engineers: Pushton, VA, USA, 2003; pp. 82–91. [Google Scholar]
- Ballantyne, D. Seismic vulnerability assessment and design of pipelines. J. Am. Water Work. Assoc. 2010, 102, 88–97. [Google Scholar] [CrossRef]
- Nair, G.S.; Dash, S.R. Review of seismic mitigation techniques for buried pipelines in fault zones. In Structural Engineering Convention; International Association for Bridge and Structural Engineering (IABSE): Zurich, Switzerland, 2015; pp. 2794–2810. [Google Scholar]
- Sundberg, C. Large Diameter Couplings for Seismic Conditions. In Pipelines 2018: Utility Engineering, Surveying, and Multidisciplinary Topics; American Society of Civil Engineers: Reston, VA, USA, 2018; pp. 299–303. [Google Scholar]
- Pudasaini, B.; Shahandashti, S.M. Identification of Critical Pipes for Proactive Resource-Constrained Seismic Rehabilitation of Water Pipe Networks. J. Infrastruct. Syst. 2018, 24, 04018024. [Google Scholar] [CrossRef]
- Shahandashti, S.M.; Pudasaini, B. Proactive seismic rehabilitation decision-making for water pipe networks using simulated annealing. Nat. Hazards Rev. 2019, 20, 04019003. [Google Scholar] [CrossRef]
- Yoo, D.G.; Kang, D.; Kim, J.H. Optimal Design of Water Supply Networks for Enhancing Seismic Reliability. Reliab. Eng. Syst. Saf. 2016, 146, 79–88. [Google Scholar] [CrossRef]
- Yoo, D.G.; Jung, D.; Kang, D.; Kim, J.H. Seismic-reliability-based optimal layout of a water distribution network. Water 2016, 8, 50. [Google Scholar] [CrossRef]
- Yoo, D.G.; Jung, D.; Kang, D.; Kim, J.H. Seismic Reliability–Based Multiobjective Design of Water Distribution System: Sensitivity Analysis. J. Water Resour. Plan. Manag. 2017, 143, 06016005. [Google Scholar] [CrossRef]
- Davis, C.A. Developing a seismic resilient pipe network using performance based seismic design procedures. In Proceedings of the 10th Taiwan-Japan-US Workshop on Water System Seismic Practices, WRF/JWWA, Tainan, Taiwan, 18–20 October 2017; pp. 18–20. [Google Scholar]
- Lee, C.W.; Kwon, H.J.; Yoo, D.G. Seismic reliability assessment of water supply systems considering critical paths. Appl. Sci. 2020, 10, 8056. [Google Scholar] [CrossRef]
- Rossman, L.; Woo, H.; Tryby, M.; Shang, F.; Janke, R.; Haxton, T. EPANET 2.2 User Manual; U.S. Environmental Protection Agency: Washington, DC, USA, 2020; EPA/600/R-20/133.
- Rossman, L.A. EPANET 2: User’s Manual; U.S. Environmental Protection Agency: Washington, DC, USA, 2000.
- Isoyama, R.; Ishida, E.; Yune, K.; Shirozu, T. Seismic damage estimation procedure for water supply pipelines. In Proceedings of the 12th World Conference on Earthquake Engineering (WCEE), Auckland, New Zealand, 1–4 January 2000; p. 1762. [Google Scholar]
- American Lifelines Alliance. Seismic Fragility Formulations for Water Systems Part 1 Guideline; American Lifeline Alliance: Washington, DC, USA, 2001. [Google Scholar]
- Horton, R.E. Erosional development of streams and their drainage basins; hydrophysical approach to quantitative morphology. Geol. Soc. Am. Bull. 1945, 56, 275–370. [Google Scholar] [CrossRef]


| Case | ||
|---|---|---|
| Quasi-PDA | PDA | |
| Case 1 (M = 5) | 66.4 | 75.7 |
| Case 2 (M = 7) | 42.8 | 45.4 |
| Earthquake- Proof Strengthening Strategy No. | Method of Establishing the Strategy | Detailed Issues |
|---|---|---|
| 1 | In the order of demand of the supply line to high-demand end user | Strengthen the pipelines connecting the largest-demand nodes |
| Earthquake-proof strengthening in the order of demand | ||
| 2 | In the order of pipeline diameter size | Commence earthquake-proof strengthening in three stages by classifying the diameter of the pipelines of the corresponding system (in the case of the ‘A’ system in Republic of Korea, apply by classifying into 700~1500 mm, 200~600 mm and 0~150 mm segments) |
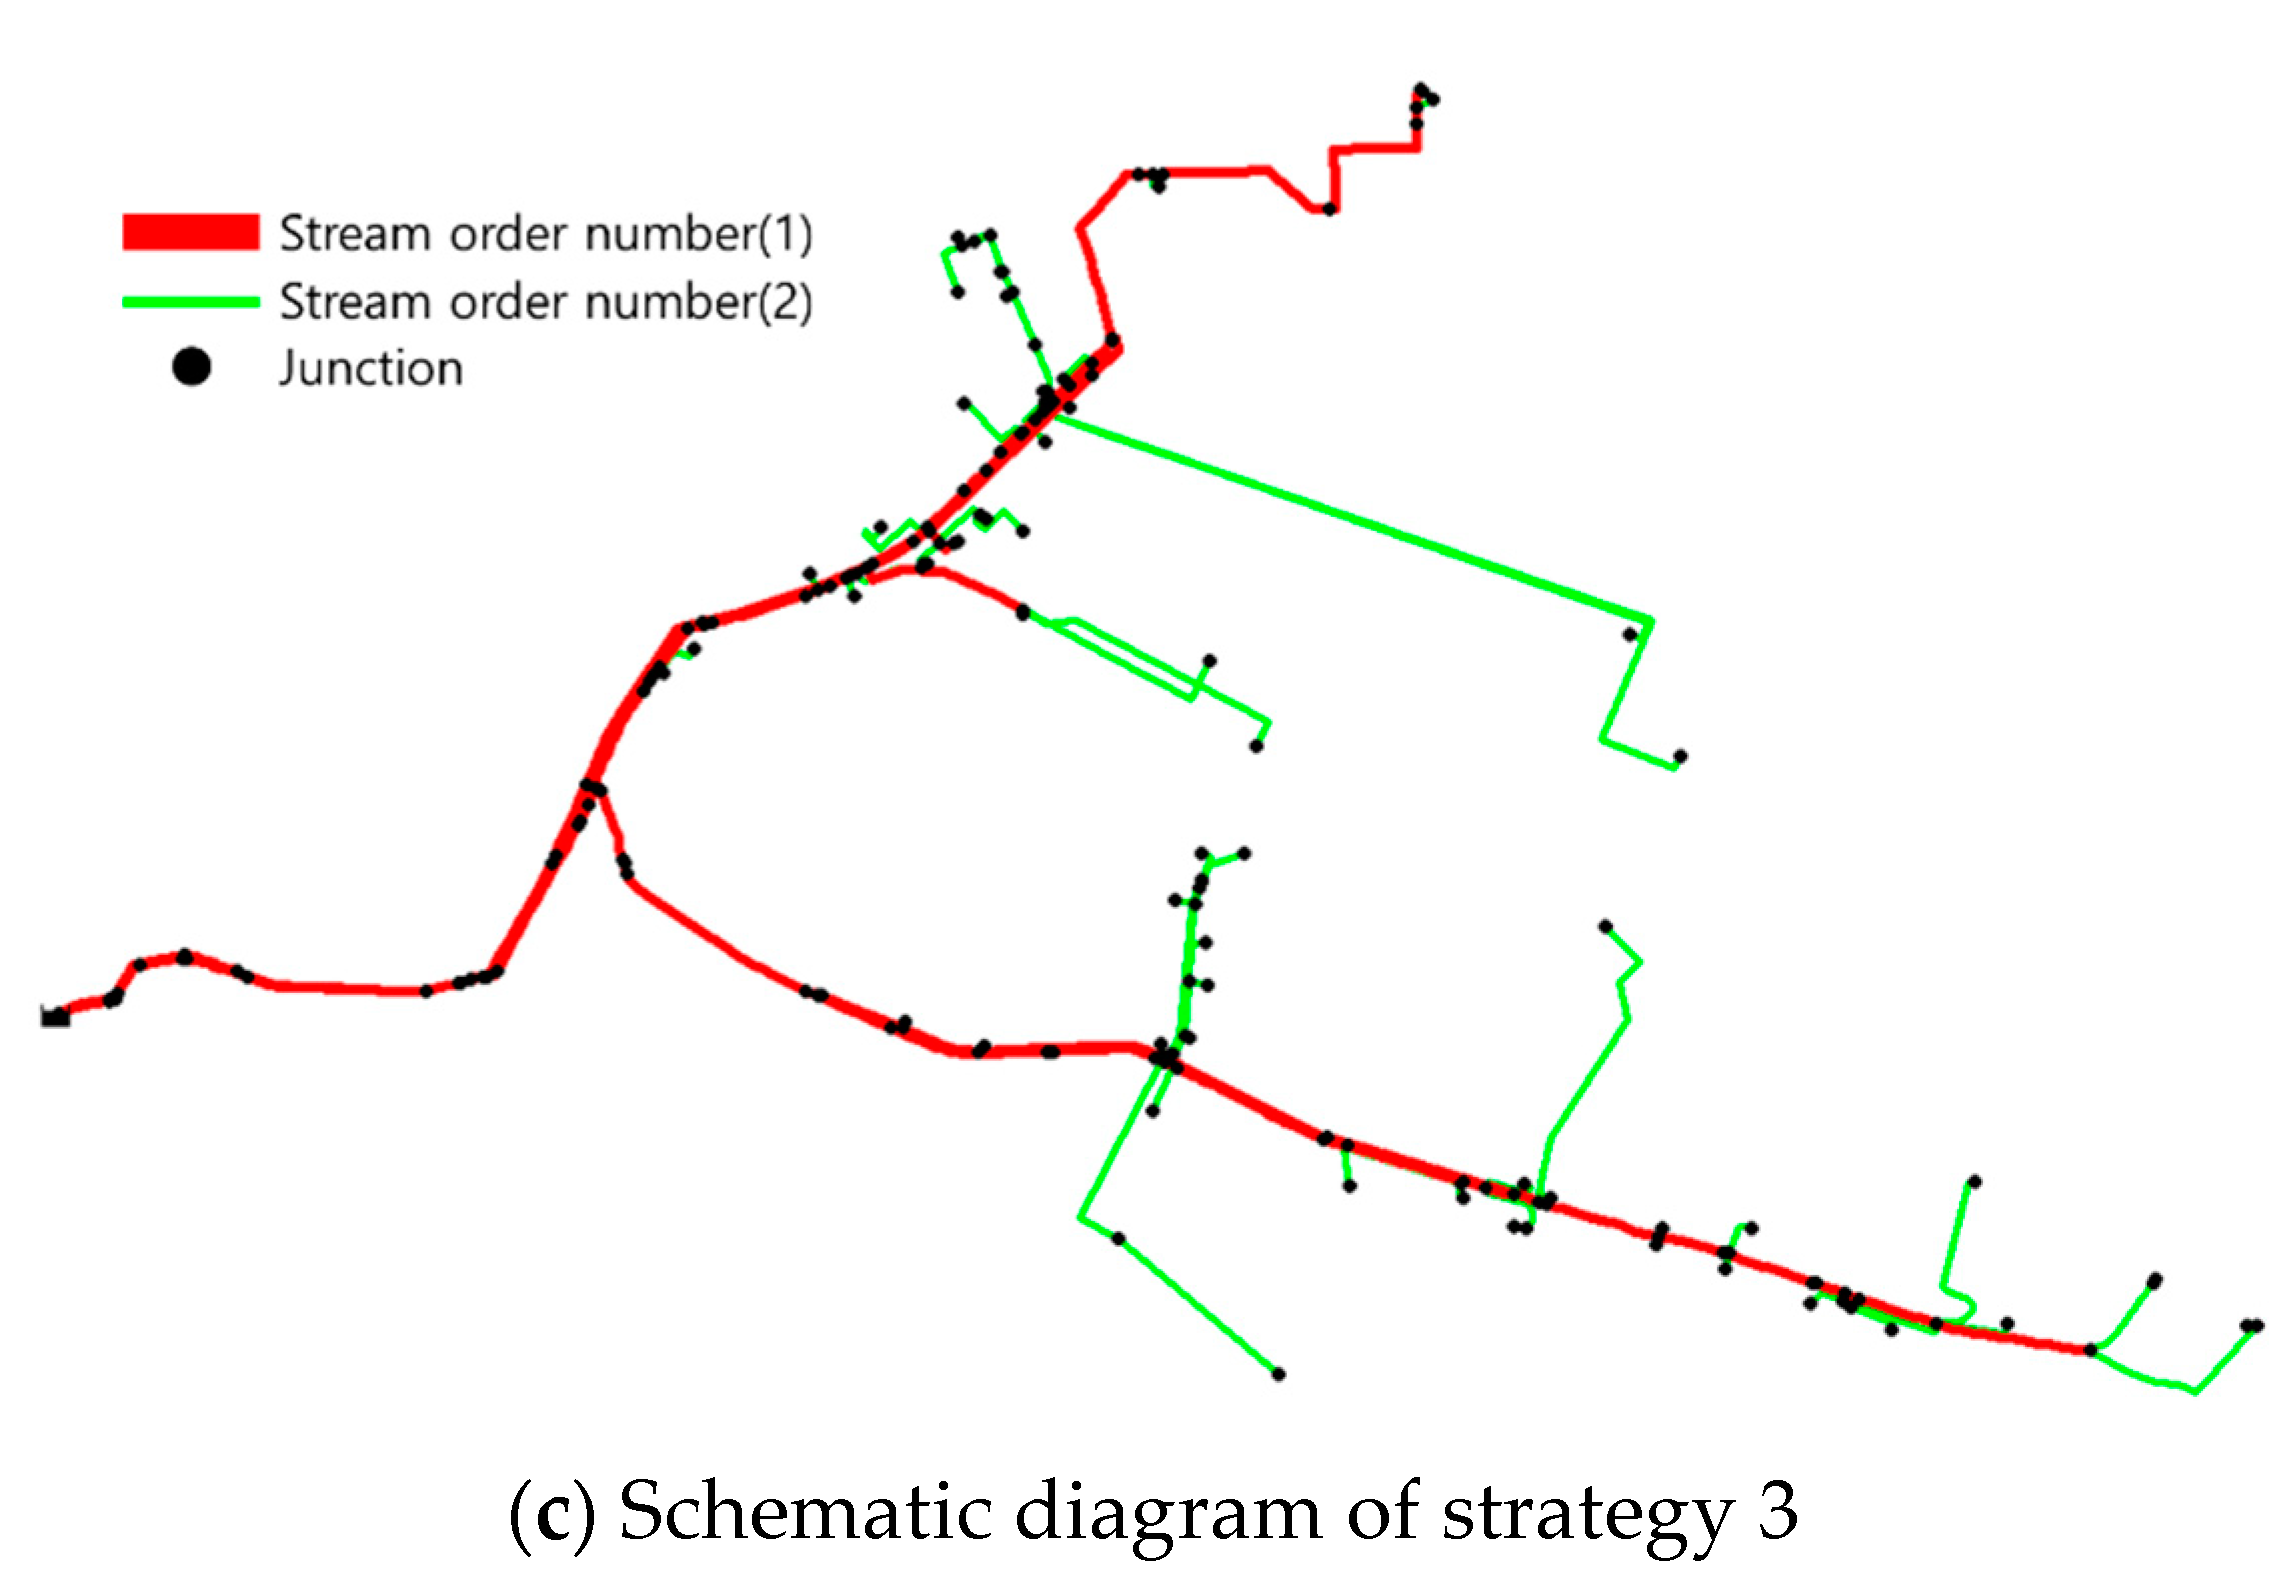
| 3 | Based on river ranking | Apply the method of assigning generalized ranking to tributaries and main stream in accordance with their relative locations (in the case of the ‘A’ system of Republic of Korea, it is divided into primary and secondary segments for application) |
| Pipe Diameter (mm) | Earthquake Resistant Japanese Ductile Iron Pipe (USD/18 ft) | |
|---|---|---|
| Bare Cost without Backfill Cost | Total Cost with Backfill Cost | |
| 101.6 | 103.58 | 108.07 |
| 152.4 | 94.57 | 99.72 |
| 203.2 | 151.62 | 157.45 |
| 254 | 196.61 | 203.11 |
| 304.8 | 259.94 | 267.14 |
| 355.6 | 303.16 | 311.07 |
| 406.4 | 316.50 | 325.13 |
| 457.2 | 412.80 | 422.17 |
| 508 | 423.10 | 433.22 |
| 609.6 | 474.25 | 485.91 |
| Strategy No. | Scenario No. | Demand (CMD) | Increase Rate | Rank | |
|---|---|---|---|---|---|
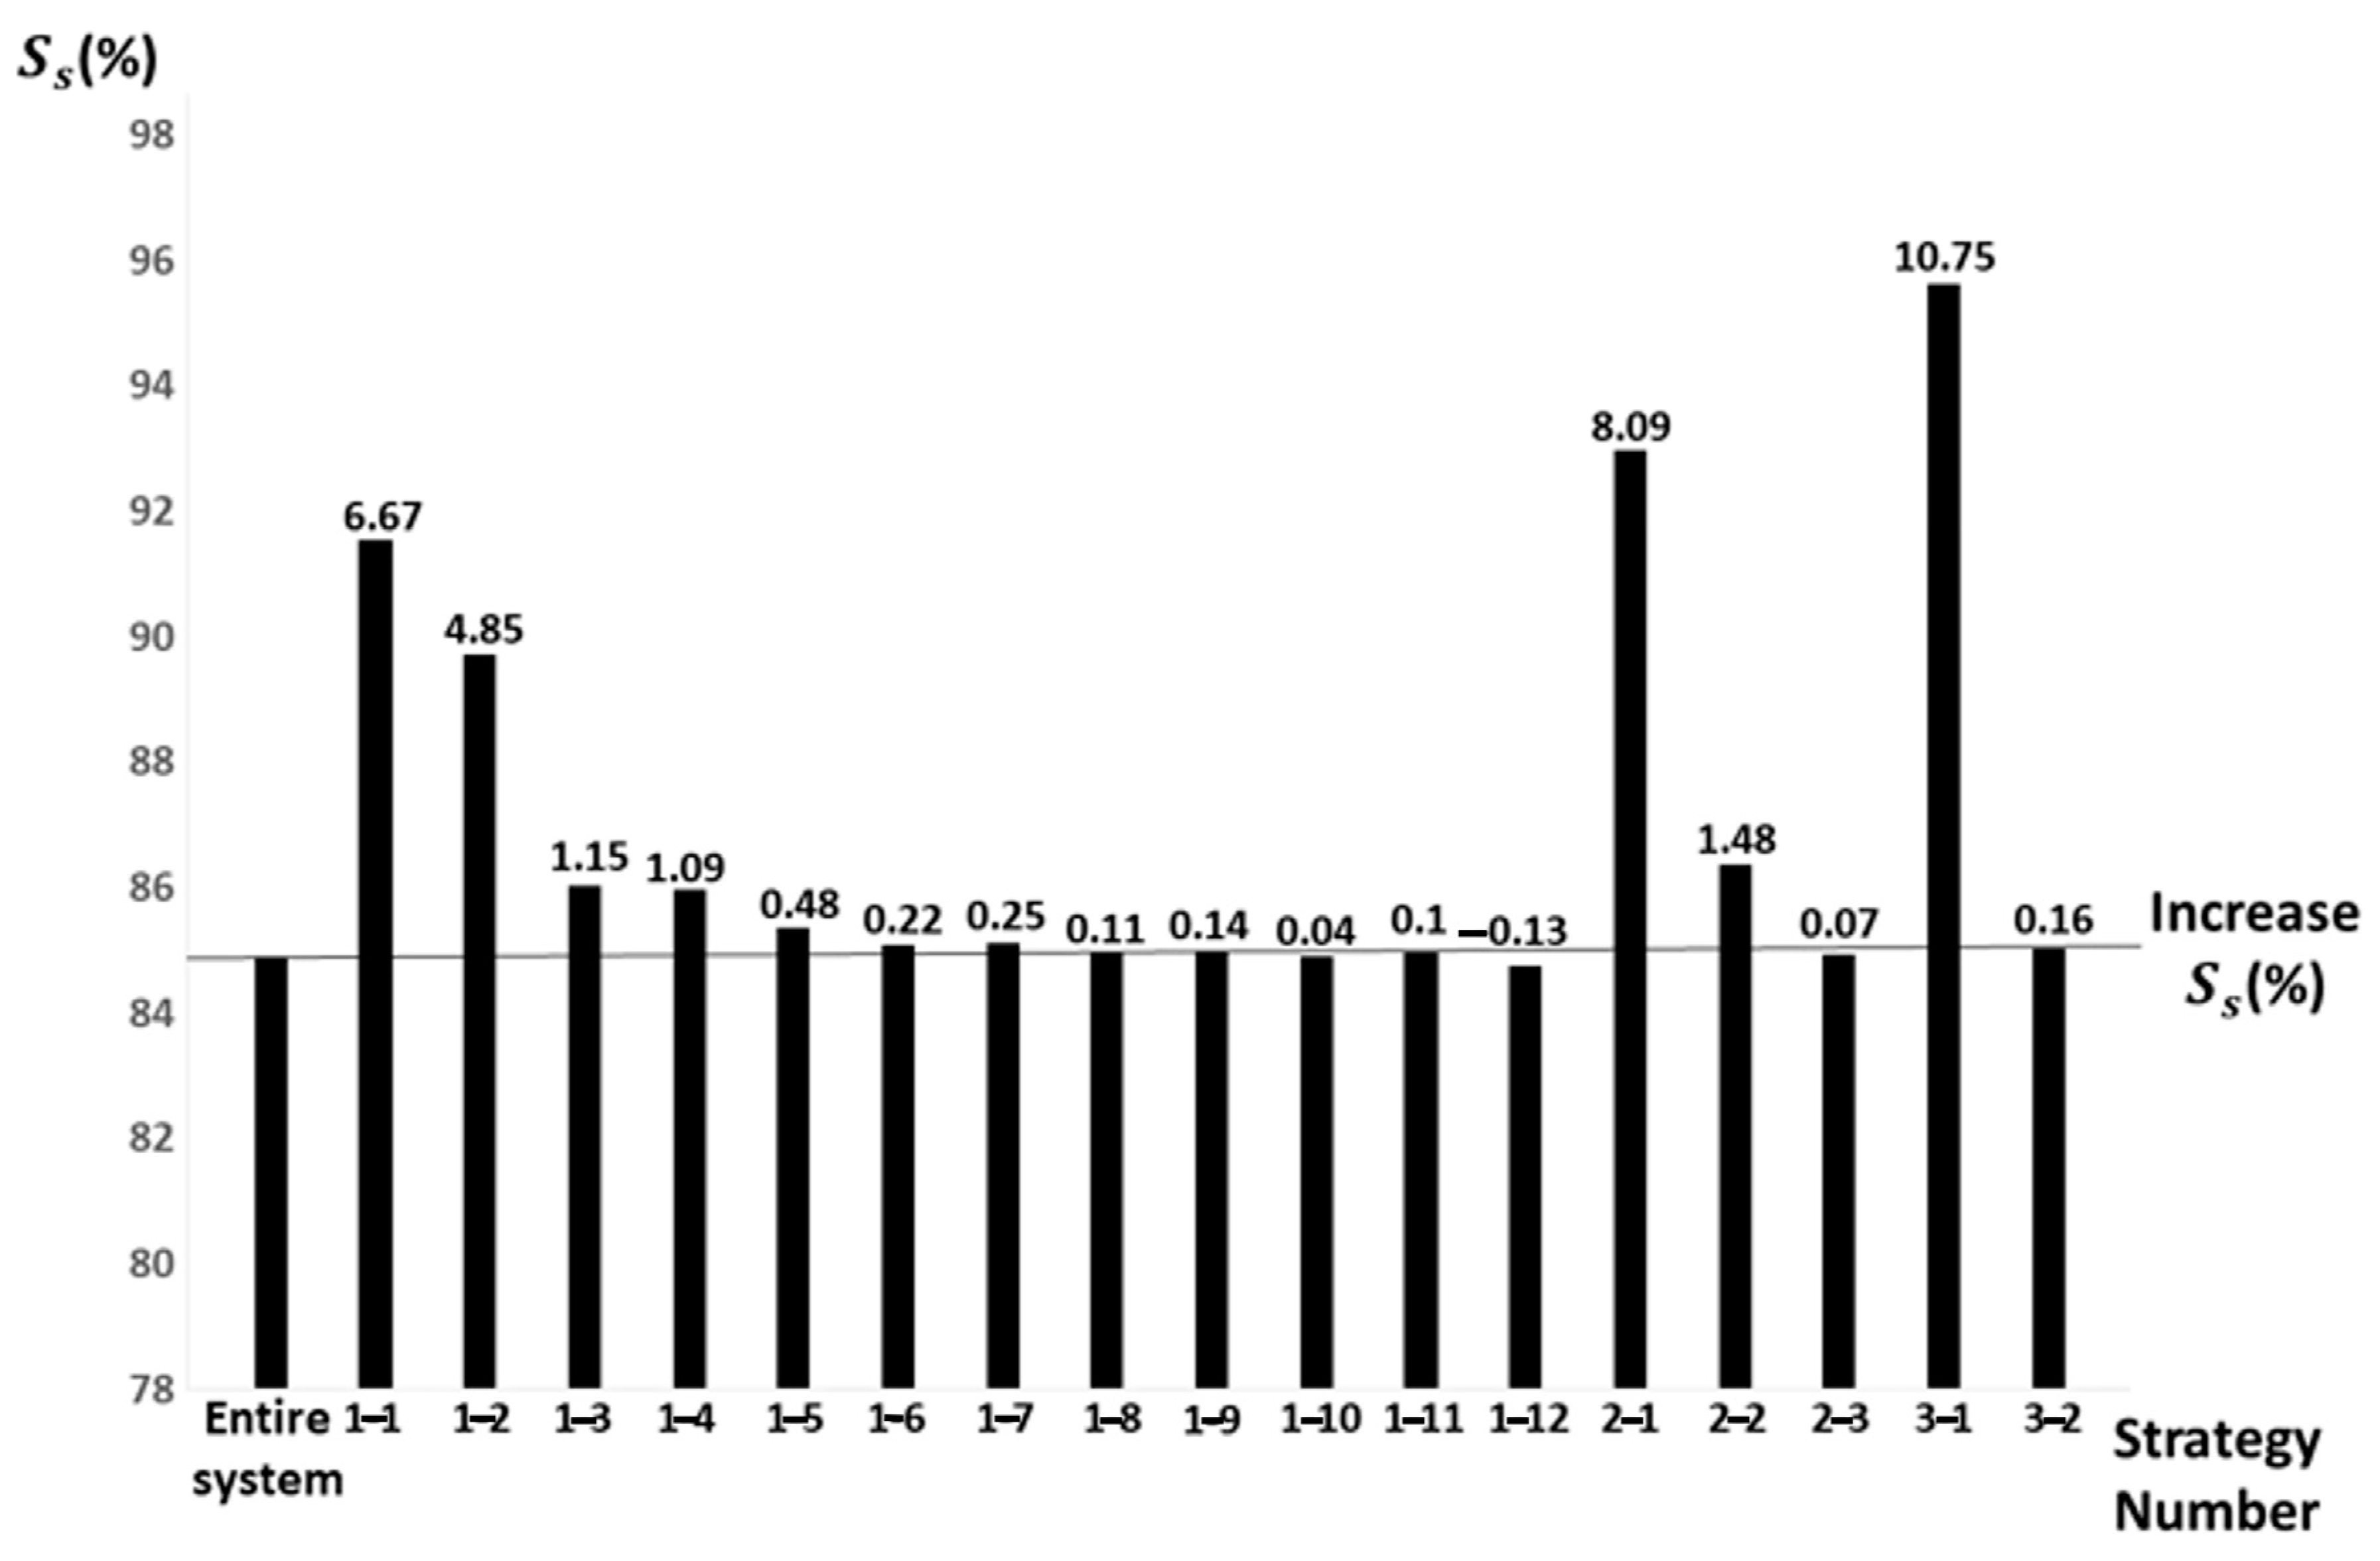
| Entire system | 102,036 | 84.87 | - | - | |
| 1 | 1 | 37,100.66 | 91.54 | 6.67 | 3 |
| 2 | 27,145.22 | 89.72 | 4.85 | 4 | |
| 3 | 9672.53 | 86.02 | 1.15 | 6 | |
| 4 | 8584.7 | 85.96 | 1.09 | 7 | |
| 5 | 6629.41 | 85.35 | 0.48 | 8 | |
| 6 | 5917.98 | 85.09 | 0.22 | 10 | |
| 7 | 3715.73 | 85.12 | 0.25 | 9 | |
| 8 | 2309.87 | 84.98 | 0.11 | 13 | |
| 9 | 2274.75 | 85.01 | 0.14 | 12 | |
| 10 | 2065.18 | 84.91 | 0.04 | 16 | |
| 11 | 1776.3 | 84.97 | 0.1 | 14 | |
| 12 | 1681.14 | 84.74 | −0.13 | 17 | |
| 2 | 1 | - | 92.96 | 8.09 | 2 |
| 2 | - | 86.35 | 1.48 | 5 | |
| 3 | - | 84.94 | 0.07 | 15 | |
| 3 | 1 | - | 95.62 | 10.75 | 1 |
| 2 | - | 85.03 | 0.16 | 11 | |
| Strategy No. | Scenario No. | Costs of Pipeline Replacement ($ ‘000) | Rank | Proportion Compared to Entire Pipeline Replacement (%) |
|---|---|---|---|---|
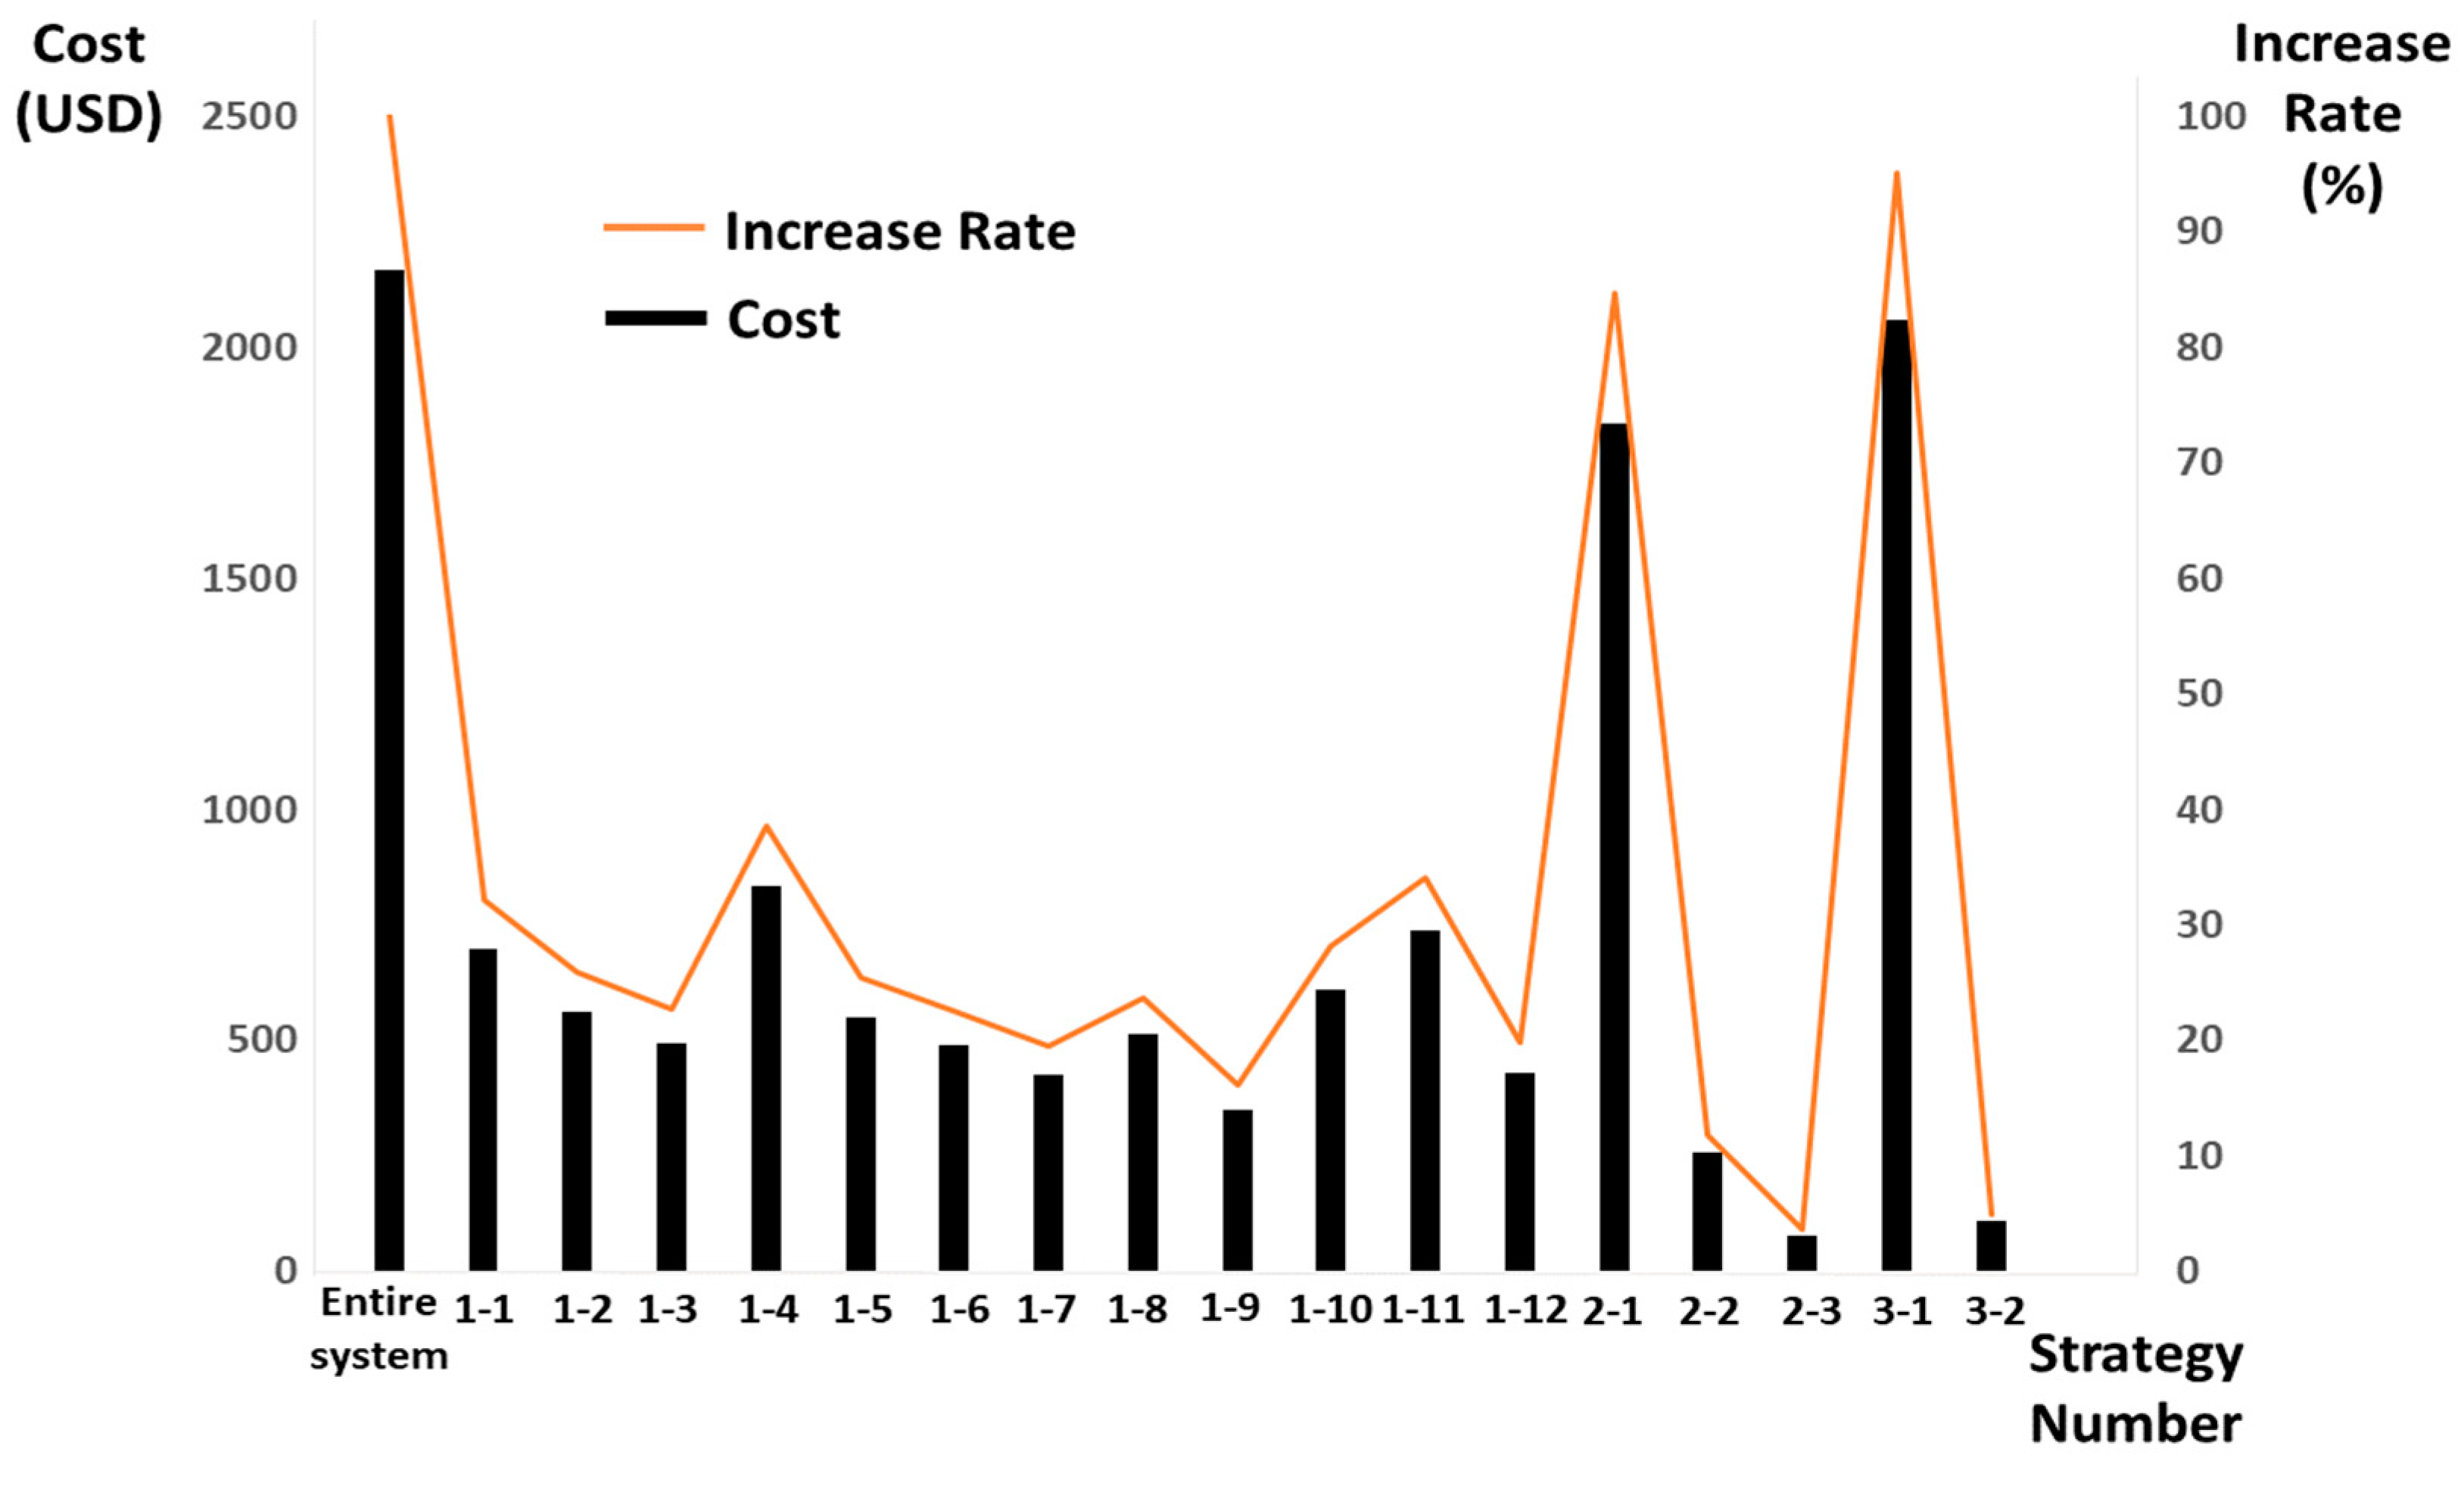
| Entire system | 2166.87 | - | 100 | |
| 1 | 1 | 696.04 | 13 | 32.12 |
| 2 | 561.36 | 11 | 25.91 | |
| 3 | 493.21 | 8 | 22.76 | |
| 4 | 835.3 | 15 | 38.55 | |
| 5 | 551.2 | 10 | 25.44 | |
| 6 | 488.04 | 7 | 22.52 | |
| 7 | 424.37 | 5 | 19.58 | |
| 8 | 512.25 | 9 | 23.64 | |
| 9 | 348.82 | 4 | 16.10 | |
| 10 | 611.23 | 12 | 28.21 | |
| 11 | 737.31 | 14 | 34.03 | |
| 12 | 431.29 | 6 | 19.90 | |
| 2 | 1 | 1833.24 | 16 | 84.60 |
| 2 | 256.12 | 3 | 11.82 | |
| 3 | 77.52 | 1 | 3.58 | |
| 3 | 1 | 2059.14 | 17 | 95.03 |
| 2 | 107.73 | 2 | 4.97 | |
| Average | 648.48 | Average | 29.93 | |
| Strategy No. | Scenario No. | (%) | Rank (a) | Costs of Pipeline Replacement ($ ‘000) | Rank (b) | Total (a + b) | Rank (c) | |
|---|---|---|---|---|---|---|---|---|
| Overall system | 84.87 | - | 2393.38 | - | - | - | - | |
| 1 | 1 | 91.54 | 3 | 696.04 | 13 | 16 | 0.958 | 1 |
| 2 | 89.72 | 4 | 561.36 | 11 | 15 | 0.864 | 2 | |
| 3 | 86.02 | 6 | 493.21 | 8 | 14 | 0.233 | 6 | |
| 4 | 85.96 | 7 | 835.3 | 15 | 22 | 0.130 | 8 | |
| 5 | 85.35 | 8 | 551.2 | 10 | 18 | 0.087 | 10 | |
| 6 | 85.09 | 10 | 488.04 | 7 | 17 | 0.045 | 12 | |
| 7 | 85.12 | 9 | 424.37 | 5 | 14 | 0.059 | 11 | |
| 8 | 84.98 | 13 | 512.25 | 9 | 22 | 0.021 | 14 | |
| 9 | 85.01 | 12 | 348.82 | 4 | 16 | 0.040 | 13 | |
| 10 | 84.91 | 16 | 611.23 | 12 | 28 | 0.007 | 16 | |
| 11 | 84.97 | 14 | 737.31 | 14 | 28 | 0.014 | 15 | |
| 12 | 84.74 | 17 | 431.29 | 6 | 23 | −0.030 | 17 | |
| 2 | 1 | 92.96 | 2 | 1833.24 | 16 | 18 | 0.441 | 5 |
| 2 | 86.35 | 5 | 256.12 | 3 | 8 | 0.578 | 3 | |
| 3 | 84.94 | 15 | 77.52 | 1 | 16 | 0.090 | 9 | |
| 3 | 1 | 95.62 | 1 | 2059.14 | 17 | 18 | 0.522 | 4 |
| 2 | 85.03 | 11 | 107.73 | 2 | 13 | 0.149 | 7 | |
Disclaimer/Publisher’s Note: The statements, opinions and data contained in all publications are solely those of the individual author(s) and contributor(s) and not of MDPI and/or the editor(s). MDPI and/or the editor(s) disclaim responsibility for any injury to people or property resulting from any ideas, methods, instructions or products referred to in the content. |
© 2023 by the authors. Licensee MDPI, Basel, Switzerland. This article is an open access article distributed under the terms and conditions of the Creative Commons Attribution (CC BY) license (https://creativecommons.org/licenses/by/4.0/).
Share and Cite
Lee, C.-W.; Yoo, D.-G. Comparative Study on Strategies for the Division of Earthquake-Proof Strengthening Segments to Reinforce the Reliability of Water Supply Systems. Sustainability 2023, 15, 6837. https://doi.org/10.3390/su15086837
Lee C-W, Yoo D-G. Comparative Study on Strategies for the Division of Earthquake-Proof Strengthening Segments to Reinforce the Reliability of Water Supply Systems. Sustainability. 2023; 15(8):6837. https://doi.org/10.3390/su15086837
Chicago/Turabian StyleLee, Chan-Wook, and Do-Guen Yoo. 2023. "Comparative Study on Strategies for the Division of Earthquake-Proof Strengthening Segments to Reinforce the Reliability of Water Supply Systems" Sustainability 15, no. 8: 6837. https://doi.org/10.3390/su15086837